Article

Tailoring Ruthenium(II) and Rhenium(I) Complexes for Turn-On Luminescent Sensing of Antimony(III)

by
Alexandre Vieira Silva
1,
Fabricio Ragone
1,2,
Gustavo Teodosio Ruiz
1,2 and
Guillermo Orellana
1,*
1
Chemical Optosensors & Applied Photochemistry Group (GSOLFA), Faculty of Chemistry, Complutense University of Madrid, Plaza Ciencias, 2, 28040 Madrid, Spain
2
Instituto de Investigaciones Fisicoquímicas Teóricas y Aplicadas (INIFTA, UNLP, CCT La Plata-CONICET), Diag. 113 y 64, Sucursal 4, C.C. 16, La Plata B1906ZAA, Argentina
*
Author to whom correspondence should be addressed.
Chemosensors 2024, 12(10), 217; https://doi.org/10.3390/chemosensors12100217
Submission received: 10 August 2024 / Revised: 9 October 2024 / Accepted: 10 October 2024 / Published: 18 October 2024

Abstract

:
Antimony (Sb) is currently a widespread element with key roles in telecommunication, sustainable energy, and military industries, among others. Its significant toxicity determines the need to realize sensors for water, air, and soil and the industrial process monitoring of Sb species. Unfortunately, no antimony sensors exist so far, and just laboratory analysis methods are in use. We aimed to contribute to the development of optical sensors for the metalloid by tailoring, for the first time, luminescent Ru(II) and Re(I) polypyridyl complexes to probe and quantify the presence of Sb(III). The molecular design of the complexes includes the multifunctional Sb-binding 2-(2,2′-bithien-5-yl)-1H-imidazo[4,5-f]-1,10-phenanthroline (btip) ligand that ensures the molecular binding of Sb(III) in organic media. The Ru(II)-btip complex is additionally endowed with one 2,2′-bipyrazine (bpz) or two 1,4,5,8-tetraazaphenanthrene (tap) ligands, namely [Ru(bpz)(btip)2]2+ and [Ru(tap)2(btip)]2+, that boost the excited state oxidation potential of the probe, leading to an intramolecular photoinduced electron transfer from btip to the Ru(II) core. The latter is suppressed upon interaction with Sb(III), leading to an 11-fold increase in both the luminescence intensity and lifetime of [Ru(bpz)(btip)2]2+ in the presence of ca. 50 μmol L−1 of SbCl3 in organic medium. The fluorescence intensity of [Re(CO)3(H2O)(btip)]+ also increases upon interaction with Sb(III) but to a much lesser extent due to the intraligand π*→π nature of its emission compared to the Ru(II) ligand-to-metal excited state deactivation. However, the weak π*→d emission band in the red spectral region of the former is quenched by the semimetallic element. The sensing mechanisms of the Ru(II)- and Re(I)-btip probes that allow luminescence intensity (Ru, Re), ratiometric (Ru), and lifetime measurements (Ru) are compared and discussed in this initial solution sensing study.

Graphical Abstract

1. Introduction

Antimony (Sb) is a semimetallic chemical element that belongs to Group 15 of the periodic table. It is found in small amounts in copper, silver, and lead ores, and its extraction is economically feasible when these ores are smelted, but the most abundant main source is the mineral stibnite (Sb2S3) [1,2]. Antimony is currently considered a valuable mined commodity as it is used in key areas like the preparation of alloys for batteries (Pb-Sb and anodes for Li- and Na-ion batteries), photovoltaics, electronics, a catalyst in the plastic industry, and as a flame retardant, to name a few [3]. However, its military and telecom applications (armor piercing bullets, night vision goggles, infrared sensors, optoelectronics, laser sighting, explosive formulations, tritium and nuclear weapon production, flares, military clothing, smartphones, semiconductors, etc.) may arguably be the most critical ones [4].
Pentavalent antimonial compounds are still the drugs of choice for all forms of the tropical disease leishmaniasis [5], although experimental results suggest that they are prodrugs in which the metal is reduced to the active and toxic Sb(III) form inside the infected macrophages. The toxicity of antimony is regarded to be similar to arsenic, and, in general, the inorganic species of Sb are much more toxic than the organic ones, likely due to their binding to thiol-containing enzymes affecting cell homeostasis [6]. Antimony species can also bind to human serum albumin (HSA), inflicting its toxic effects [7].
Due to its toxicity, antimony is considered a pollutant by the U.S. Environmental Protection Agency and similar organisms, and has been categorized as group 2A (“possibly carcinogenic”) and carcinogenic to humans by the International Agency for Research on Cancer [8]. Its pollutant ability strongly depends on its oxidized state, with Sb(III) (the most toxic) and Sb(V) being the common forms found in nature [9]. For instance, the maximum admissible concentration in drinking water is 5–6 μg L−1 in many countries, but 40 μg L−1 applies for water bottled in plastic containers because antimony trioxide is used as a catalyst in the manufacture of polyethylene terephthalate (PET) [10]. Nevertheless, toxicity may arise during occupational exposure, domestic use, or when antimony compounds are used for therapies [2]. Due to the vast application of antimony in common daily products, it is important to monitor the presence of this element in all human environments [2,11].
Therefore, in order to understand the role of this element in the environment, assess its toxicity to humans, and protect the workers’ and consumers’ health, it is of utmost importance the development of novel analytical methods (and, particularly, sensors or probes) to quickly detect and quantify antimony. The analysis of antimony levels or Sb speciation is usually performed in the laboratory, where the samples have been sent and costly instrumentation is often required. Usual techniques [11] are absorption spectrophotometry, atomic absorption or fluorescence spectrometry (AAS/AFS), electrochemical analysis, and inductively coupled plasma mass spectrometry (ICP-MS) depending on the analyte levels and complexity of the sample. The molecular absorption methods are based on selective Sb-complexing colorimetric reactants followed by solvent extraction for the measurement [12,13]; they display poor sensitivity and require lengthy sample preparation, but their low cost is unbeatable. For instance, Sb(III) can be determined in antileishmanial drugs above a 5 μmol L−1 level, suitable for the routine quality control of pharmaceutical formulations, by its complex with bromopyrogallol red [14].
AAS is currently a widespread technique in analytical laboratories [15,16]. Its detection limit for As (0.007 ng L−1 to 3 μg L−1) allows for the testing of both aqueous and solid samples, yet the dynamic range may be limited [11]. The determination of As and Sb traces by AFS-hydride generation has demonstrated its advantages such as a low limit of detection, selectivity, and a wider dynamic range compared to AAS, plus easy speciation analysis [17]. The electrochemical methods for antimony determination mainly include polarography and voltammetry [18]. While analyses are simple and may have enough sensitivity for water or sediment samples, their selectivity is moderate as they are subject to various interferences. ICP-MS is widely used in elemental analysis because of its wide linear dynamic range, high detectability, and simple spectral lines, but at the expense of high acquisition and operational costs as well as the significant effect of the sample matrix [19]. The latter may require some sample clean-up procedures such as magnetic solid-phase extraction [20] or ion chromatography [21], among others, provided that the stability of Sb(III) during the sample preparation is ensured.
Thanks to the advances in light sources (high-power low-consumption LEDs and laser diodes), detectors (photodiodes, APDs, CCDs…), and light guides (planar waveguides, optical fibers…), molecular fluorescence spectrometry has become affordable, portable, and one of the techniques of choice to develop sensitive and robust chemical sensors for environmental monitoring and industrial analysis [22,23,24]. Naturally, it has been used to improve the detection limits of spectrophotometric methods for antimony while keeping their simplicity and affordability. However, there are still very few reports on this technique for metalloid determination, and the analyzed species are ill defined due to the hydrolysis of the so-called “Sb(III) salts” used by the authors. The first fIuorometric determination of antimony was probably that reported by Filer [25]. In adding indicator dye 3,4′,7-trihydroxyflavone at the end of a lengthy sample treatment to extract the analyte and remove most of its many interferences, the fluorescence of its Sb(III) complex at 475 nm was measured in a perchloric acid solution using phosphate as a masking agent. This method showed an absolute detection limit of 40 ng of antimony.
Antimony (probably as SbO+) and thallium (Tl3+) at a 20 μmol L−1 concentration have been shown to quench, somewhat selectively, the emission of a bis-dansyl fluorophore (λemmax = 525 nm) containing a triethoxylated linker on their structure, in ethanol–water (1:1 v/v) [26]. Using a similar strategy, Wu et al. reported a turn-on fluorescent probe for Sb(III) based on rhodamine-conjugated homotrioxacalix [3] arene [27]. Upon adding 3 mol of the analyte (probably SbO+ as well) per mole of indicator dye, a color change to pink and strong fluorescence at 557 nm were observed due to the rhodamine spyrocycle opening; Fe3+ and Ni2+ provide smaller fluorescence enhancements.
Octahedral coordination compounds of Ru(II) with polyazaheteroaromatic chelating ligands (N^N), typically [Ru(N^N)n(N^N)3–n]2+ (n = 0–3), are widely used luminophores to develop optical chemosensors due to their unique set of suitable properties: largely separated absorption (blue) and emission (red) maximums, perfect matches with existing blue LEDs, microsecond emission lifetimes, chemo- and photostability, significant luminescence quantum yields, and, most importantly, the feasibility of tuning their response to a particular analyte by a judicious design of the coordinating ligands and their substituents [28,29,30]. Their emission arises from a triplet metal-to-ligand charge transfer (3MLCT) excited state that is quantitatively formed in the fs time scale from the initially populated singlet excited state due to the ultrafast intersystem crossing induced by the heavy metal core. This luminescence competes with the non-radiative deactivation and with efficient electron, proton, or energy transfer processes involving the 3MLCT excited state and the analyte species (or a third party closely related to the latter).
Luminescent coordination compounds of Rhenium(I) with the general formula [Re(N^N)(CO)3(L)]+ (L = H2O, pyridine…) have been far less used for chemical sensing than their Ru(II) counterparts [31] due to their absorption in the UV, strong intraligand (blue-green) emission, shorter luminescence lifetimes, lower emission quantum yields, and less photostability. However, they display a higher lipophilicity, and their heterocyclic ligands can also be designed to obtain probes for specific analytes (e.g., NO and biothiols in living cells [31]).
To the best of our knowledge, despite the large number of chemical species detected so far with luminescent Ru(II) polypyridyls and Re(I) indicator dyes (gasses, cations, anions, neutral species), no reports on the semimetal sensing have been disclosed so far. This is the first report that shows that luminescence-based antimony(III) monitoring is feasible using a bithiophene-substituted imidazophenanthroline (btip) ligand within highly photooxidizing Ru(II) complexes or coordinated to Re(I). Nevertheless, the sensing mechanism depends on the transition metal core; while Sb(III) suppresses an intramolecular photoinduced electron transfer (PET) process that strongly quenches the red 3MLCT luminescence of the Ru(II) complex, the metalloid increases the blue intraligand (IL) fluorescence of the Re(I) species by slowing down vibrational modes that contribute to the internal conversion deactivation pathway. In both cases, the luminescent probes operate under the so-called “turn-on” sensing principles, whereby their luminescence strongly increases in the presence of the analyte. In the case of Ru(II), emission lifetime-based sensing of Sb(III) is also feasible so as to exploit the many advantages of such sensors [32].

2. Materials and Methods

2.1. Chemicals

Organic and inorganic reactants as well as solvents (HPLC grade) were from Merck (Darmstadt, Germany, formerly Sigma-Aldrich) or ThermoFisher Scientific (Waltham, MA, USA; formerly Acros Organics or Alfa Aesar brands) and used without further purification (except drying when required; see below). The commercial reagents and solvents were dried and purified where necessary, according to procedures described in the literature [33].Thin-layer chromatography (TLC) was carried out on silica gel-coated aluminum plates (Merck F254, 0.25 mm). Column chromatography was carried out on silica gel (Acros, now ThermoFisher Scientific, 35–70 μm). The ion-exchange columns contained Sephadex® SP C-25 (Cytiva, Marlborough, MA, USA).

2.2. Instruments and Devices

Nuclear Magnetic Resonance (NMR) spectroscopy: The 1H-NMR spectra were recorded on Bruker (Billerica, MA, USA) DPX 300 (300 MHz) or Bruker NEO 500 (500 MHz) spectrometers at the Central Instrumentation Facilities (CAI) of Complutense University of Madrid (UCM). The solvents (>98% isotopic purity, Merck or Acros) had tetramethylsilane (TMS, Merck) as the internal reference. The chemical shifts (δ) were given in ppm, and the coupling constants (J), in Hz with the following abbreviations: s = singlet, d = doublet, dd = double doublet, t = triplet, m = multiplet.
Mass spectrometry (MS): High-resolution mass spectra (HRMS) were obtained either on a Bruker HCT Ultra or a Bruker Ultraflextreme MALDI TOF-TOF spectrometer at the Central Instrumentation Facilities (CAI) of Complutense University of Madrid (UCM). The samples were ionized using ESI (electron spray ionization) or MALDI operating in positive or negative ion detection mode.
High-Performance Liquid Chromatography (HPLC): The purification of the final product was carried out in a semi-preparative scale on an Agilent (Santa Clara, CA, USA) HP1200 LC chromatograph equipped with a solvent delivery quaternary pump, autosampler, diode array detector, fraction collector, and Agilent ZORBAX Eclipse XDB-C18 semi-preparative column (250 mm × 9.4 mm, 5 μm particle size). The eluent was a water–acetonitrile mixture (3:2 v/v), both solvents containing 0.01% trifluoracetic acid (isocratic mode) and a flow rate of 5.0 mL min−1. Sample concentration injected: 1 mg mL−1; volume of each injection: 900 μL.
Steady-state absorption and luminescence spectra: These spectra were obtained in 1 cm optical path Suprasil® cells at room temperature using a Varian (Palo Alto, CA, USA) Cary 3Bio UV-Vis spectrophotometer and a HORIBA (Kyoto, Japan) Fluoromax-4 TCSPC spectrofluorometer, respectively. The solutions were air-equilibrated.
Time-resolved luminescence: Luminescence lifetimes were measured by single photon timing (SPT) on a HORIBA Fluoromax-4 TCSPC fluorometer equipped with a pulsed 463 nm HORIBA NanoLED diode laser as the excitation source. Repetition rate: 250 KHz; time window: 3.2 μs; emission wavelength: 690 nm; slits: 9 nm; peak counts at the maximum: 30,000. All solutions were air-equilibrated.

2.3. Synthesis of the Sb(III) Probes

2.3.1. Synthesis of 2,2′-Bipyrazine (bpz)

Diisopropylethylamine (8 mmol or 1.4 mL), palladium acetate (0.4 mmol), tetra-n-butylammonium bromide (8 mmol), and a solution of 2-chloropyrazine (8 mmol) in toluene (2 mL) were added to a two-neck flask fitted with a reflux condenser under argon atmosphere. The mixture was stirred and heated to reflux, and isopropanol (8 mmol) was added. The temperature was maintained at 105 °C for 24 h. After this period, the reaction was allowed to reach room temperature, and the reaction medium was transferred to an extraction funnel. Water (5 mL) and diethyl ether (5 mL) were then added. After stirring and separating the phases, the organic phase was separated, and the organic medium was washed with water (5 mL). The aqueous phase was discarded; the organic phase, dried with MgSO4 and filtered; and the solvent, removed by rotavaporation. The final product was purified on a silica gel chromatographic column using ethyl acetate as the eluent (20% yield). 1H-NMR (300 MHz, CDCl3, Supplementary Materials Figure S1): δ/ppm = 9.54 (s, H3,3′); 8.60 (s, H5,5′,6,6′), in agreement with the literature data [34].

2.3.2. Synthesis of cis-bis(2,2′-Bipyrazine)(dichloro)ruthenium(II)

In a two-neck flask equipped with a magnetic stirrer and a reflux condenser, ruthenium trichloride hydrate (1.57 mmol), 2,2′-bipyrazine (3.16 mmol), and lithium chloride (10.21 mmol) were placed. Under an argon atmosphere, this mixture was diluted with anhydrous DMF (15 mL), and the system was heated at 120 °C for 6 h. After this period, the solvent was removed by rotavaporation, and the product was recrystallized from the DMF–acetone mixture. The purple precipitate was filtered and used in the next reaction steps (98% yield); λmaxabs (DMF): 400 nm and 515 nm.

2.3.3. Synthesis of 1,10-phenanthroline-5,6-dione (PD)

Phenanthroline (23 mmol) and KBr (33 mmol) were added to a two-neck flask. The flask was cooled in an ice bath and, under magnetic stirring; 60 mL of a solution containing sulfuric acid and nitric acid (conc.) in a 2:1 v/v ratio was added dropwise. After 15 min, a reflux condenser was added to the flask, and the reaction was heated at reflux for 4 h. After this period, the reaction medium was placed in an ice bath, and the pH of the reaction medium was adjusted to 6 by adding NaHCO3-saturated solution. The aqueous medium at pH 6 was extracted with dichloromethane (500 mL). The aqueous phase was discarded; the organic phase, dried with MgSO4 and filtered; and the solvent, removed by rotavaporation. The yellow solid obtained thereof was recrystallized from ethanol (39% yield). 1H-NMR (300 MHz, DMSO-d6, Supplementary Materials Figure S2): δ = 8.98 (d, J = 3 Hz, H2,2′); 8.39 (d, J = 6 Hz, H4,4′); 7.67 (dd, J1 = 6 Hz, J2 = 3 Hz, H3,3′); chemical shifts are in agreement with literature data [35].

2.3.4. Synthesis of 2-(2,2′-Bithien-5-yl)-1H-imidazo [4,5-f]-1,10-phenanthroline (btip)

2,2′-bithiophene-5-carbaldehyde (1.2 mmol), ammonium acetate (20 mmol), 1,10-phenanthroline-5,6-dione (1 mmol), and glacial acetic acid (20 mL) were placed in a two-neck flask fitted with a magnetic stirrer and a reflux condenser. The solution was kept under magnetic stirring and heated under reflux for 4 h. After this period, the solution was allowed to reach room temperature, and the product was precipitated by neutralizing the medium with aqueous ammonia (5 M). The precipitate was filtered off and washed with water (3 × 10 mL) and diethyl ether (3 × 10 mL) and then recrystallized from methanol. Finally, it was dried in a vacuum oven (0.01 Torr) at 50 °C (45% yield). 1H-NMR (300 MHz, DMSO-d6, Supplementary Materials Figure S3): δ/ppm = 13.9 (broad s, NH); 9.09–9.04 (m, H6phen and H9phen); 8.85 (d, J = 9 Hz, H4phen and H11phen); 7.86–7.82 (m, H5phen, H10phen, and H4bth); 7.62 (d, J = 6 Hz, H5′bth); 7.50–7.47 (m, H3bth and H3′bth); 7.19–7.16 (m, H4′bth).

2.3.5. Synthesis of [Ru(bpz)(btip)2]2+(CF3CO2)2

Ru(bpz)2Cl2 (0.05 mmol) and btip ligand (0.05 mmol) were placed in a two-neck flask fitted with a magnetic stirrer and a reflux condenser. Ethylene glycol (3 mL) was added to the flask, and the solution was heated under reflux and an argon atmosphere for 6 h. After this period, the reaction medium was allowed to reach room temperature, and water (2 mL) was added to the medium. Saturated aqueous NH4PF6 solution was added slowly until no further precipitate was formed. The precipitate was filtered off, and then washed with iced water (2 × 2 mL) and diethyl ether (2 × 2 mL). After these processes, the solid obtained was dried under vacuum in an oven at 50 °C. This procedure led to the [Ru(bpz)(btip)2](PF6)2 complex in 30% yield (as determined by HPLC). This product was further purified by semi-preparative HPLC (retention time of [Ru(bpz)(btip)2]2+: 14.23 min) to produce the diacetate complex (18% yield) with a purity greater than 99%. 1H-NMR (300 MHz, CD3OD, Supplementary Materials Figure S4): δ/ppm = 9.91 (s, H3,3′bpz), 9.10 (d, J = 8.4 Hz, 2 × H4 or H11btip(phen)), 8.98 (d, J = 8.3 Hz, 2 × H11 or H4btip(phen)), 8.43 (d, J = 3.3 Hz, H5,5′bpz), 8.19 (d, J = 5.1 Hz, 2 × H6 or H9btip(phen)), 7.95–7.76 (m, 8H; H6,6′bpz; 2 × H5 or H10btip(phen); 2 × H9 or H6btip(phen); 2 × H4 btip(bth)), 7.66 (dd, J = 8.1, 5.6 Hz, 2 × H10 or H5btip(phen)), 7.37 (d, J = 4.9 Hz, 2 × H5′btip(bth)), 7.31 (d, J = 3.8 Hz, 4H; 2 × H3btip(bth); 2 × H3′btip(bth)), and 7.03 (dd, J = 5.0, 3.7 Hz, 2 × H4′btip(bth)). MS(+)(MALDI-TOF, CD3OD, Supplementary Materials Figure S5) (m/z): calculated for (M–2(CF3CO2)–H+): 1027.056, observed: 1026.984; calculated for (M’–2(CF3CO2)–H+): 1028.063, observed: 1027.974; calculated for (M–2(CF3CO2)–H+–bpz): 868.997, observed: 868.929; calculated for (M’–2(CF3CO2)–H+–bpz): 870.004, observed: 869.929; calculated for (M–bpz + H+): 1096.984, observed: 1096.974; calculated for (M’–bpz + H+): 1097.991, observed: 1097.974; M’ stands for the N–2H isotopologue generated by (partial) H/D exchange with the NMR solvent before the MS recording.

2.3.6. Synthesis of [Ru(tap)2(btip)]2+(PF6)2

Ru(tap)2Cl2 (0.24 mmol) [36] and btip ligand (0.2 mmol) were dissolved in ethylene glycol (8 mL). The mixture was initially heated in a microwave oven (200 W, 190 °C; Anton Paar Monowave 200) for 30 s under an Ar atmosphere. The reaction progress was monitored during four additional heating periods (1 × 30 s and 3 × 5 min) by TLC (silica; CAN–water–KNO3(satd.) 54:40:6 v/v/v). The mixture gradually acquires a dark orange color during the procedure. After that, the reaction medium was allowed to reach room temperature, and water (50 mL) was added to the medium. Saturated aqueous NH4PF6 solution was added slowly until no further precipitate was formed. The precipitate was filtered off, and then washed with iced water (2 × 2 mL) and diethyl ether (2 × 2 mL). The solid was recrystallized through the dropwise addition of diethyl ether to the solution of the complex in acetonitrile. After these processes, the orange solid obtained was dried in a vacuum oven at 50 °C. It was dissolved in ACN and purified on a column packed with Sephadex LH20 (diameter: 2.5 cm, height: 14 cm; ACN as elution solvent). Analysis of the TLC experiments (silica; ACN-water-KNO3sat 50:40:10% v/v) of the obtained fractions showed that precursor complex as well as btip impurities were separated in the obtained product. The solvent was evaporated to dryness by distillation at low pressure. The obtained orange solid was dried under vacuum (75% yield). 1H-NMR (300 MHz, CD3CN, Supplementary Materials Figure S6): δ/ppm = 13.50 (broad s, NH); 9.05–8.96 (m, H4 and H11btip(phen), H2,2′tap, H9,9′tap); 8.63 (s, H5,6tap, H5′,6′tap); 8.29 (d, J = 2.1 Hz, H3,3′tap, H8,8′tap); 8.05 (d, J = 4.2 Hz; H4btip(bth)); 8.02 (d, J = 5.1 Hz; H6 and H9btip(phen)); 7.62 (dd, J1 = 8.2 Hz; J2 = 5.2 Hz; H5 and H10btip(phen)); 7.38 (d, J = 5.1 Hz, H5′btip(bth)); 7.24 (d, J = 3.9 Hz, H3btip(bth)); 7.19 (d, J = 3.5 Hz, H3′btip(bth)); 7.07 (dd, J1 = 5.0 Hz; J2 = 3.6 Hz; H4′btip(bth)). MS(+)(ESI, MeOH) (Supplementary Materials Figure S7) m/z: calculated for (M–2(PF6)–H+): 849.0654, observed: 849.0608; calculated for (M–2(PF6) + K+–2H+): 887.1554, observed: 887.1508; calculated for (M–2(PF6)): 425.0366, observed: 425.0214.

2.3.7. Synthesis of fac-[Re(CO)3(H2O)(btip)]+Cl

A solution of 22.4 mg (0.07 mmol) of [Re(CO)3(H2O)3]Cl complex [37] in water (50 mL) was introduced dropwise into a round-bottom flask loaded with an aqueous solution (50 mL) of btip (26.5 mg, 0.07 mmol). The mixture was heated to reflux for 24 h under a N2 atmosphere. The progress of the reaction was monitored at 0, 2, and 24 h by both UV-Vis spectroscopy and thin-layer chromatography (TLC, 0.25 mm thick pre-coated Merck 60F254 silica plates; water–EtOH 70:30 v/v). Then, the reaction mixture was filtered off, and 100 mL of ethanol was added to increase the solubility of the product. Reflux was maintained for a further 24 h. The solution was then cooled to room temperature and filtered through a fritted disk. The resulting solid was dissolved in DMF and passed through a Sephadex LH20 column (diameter: 3 cm, height: 23 cm; DMF as elution solvent). Analysis of both the absorption spectra and the TLC plates (silica; water–EtOH 50:50 v/v) of the chromatographic fractions showed that unreacted btip was absent in the obtained product. The solvent was evaporated to dryness by rotavaporation. The obtained brown solid (17.3 mg, 35% yield) was dried under vacuum in an oven at 50 °C. 1H-NMR (300 MHz, DMSO-d6, Supplementary Materials Figure S8): δ/ppm = 14.4 (broad s, H6,), 9.36 (d, J = 5 Hz, H9a,b), 9.20 (d, J = 8.5 Hz, H7a,b), 8.14 (dd, J = 5 Hz, H8a,b), 7,91 (d, J = 4 Hz, H6), 7.62 (d, J = 5 Hz, H1), 7.51 (d, J = 3.5 Hz, H3), and 7.17 (dd, J = 3.5 Hz, H2). Protons were assigned by analysis of the 2-D COSY spectrum (Supplementary Materials Figure S9). MS(+)(ESI, MeOH) m/z: calculated for C24H14N4O4ReS2: 673.00; observed: 710.96 (M+–H+ + K+), 694.98 (M+–H+ + Na+), 673.00 (M+), 654.99 (M+–H2O) (Supplementary Materials Figure S10).

2.4. Determination of the UV-Vis Absorption Spectra

The molar absorption coefficients (ε) were determined from the absorption spectra using the Lambert–Beer law (A = εlc), i.e., absorbance versus concentration curves, where A is the solution absorbance, ε is the molar absorption coefficient (L mol−1 cm−1), l is the optical path (cm), and c is the molar concentration (mol L−1). The analyte mass, weighed on an analytical balance (±0.01 mg), was dissolved in an accurate volume (in a volumetric flask) of the solvent of interest. Aliquots of known volumes were taken from this solution and transferred to other volumetric flasks. The flasks were topped up with the desired solvent so that solutions of known concentrations were obtained with analytical accuracy. The UV-Vis spectrum for these compounds was determined in a Suprasil® cell (Hellma, Müllheim Germany, 1 cm optical path). The bands of interest used in the calculation of ε had an absorbance between 0.05 and 0.2. The experimental data were analyzed using Origin 7.0.

2.5. Luminescence Study of the Probes in the Presence of Antimony Salts

Stock solutions of SbCl3 were prepared by dissolving 3 mg of the salt in 10 mL of DMF. A 40 μM stock solution of the Re-btip luminophore was prepared by dissolving the appropriate amount of it in DMF. Then, 0.5 or 1.5 mL of the stock solution of the complex and selected antimony stock aliquots were mixed, and the total volume of solution was adjusted to 5.00 mL with the solvent. After 10 min incubation, the fluorescence was measured in a Suprasil® cell (Hellma).
For the Ru(II) probes, stock solutions of the SbCl3 salt were prepared by dissolving it in the solvent mixtures of interest (CHCl3–acetonitrile (17:3 v/v) or water–DMSO (1:1 v/v)). A 10 μM stock solution of each luminophore (Ru(II) complexes or 2,2′-bithiophene-5-carbaldehyde) was prepared by dissolving the appropriate amount of it in the corresponding solvent mixture. Before the luminescence measurement, 1.5 mL of the luminophore solution was transferred to a Suprasil® cell, and the selected amount of antimony salt was introduced by adding aliquots of the corresponding stock solution. Then, the total volume of solvent in the cell was adjusted to 3.00 mL through the addition of the appropriate volume of the solvent mixture. The excitation wavelengths of the samples for each experiment are described in Section 3.2 and 3.3. All the steady-state luminescence measurements were carried out using 5 nm slits. For the SPT measurements, 9 nm slits were used.

3. Results and Discussion

The design of our Sb(III) probes started from the known ability of this element to bind sulfur [38] and the wealth of Ru(II) polypyridyls substituted with thiophene moieties [39]. On the other hand, the imidazo[4,5-f]-1,10-phenanthroline ligand (IP, Figure 1) and its 2-substituted derivatives have demonstrated their capacity to coordinate transition metal ions (e.g., Ru(II), Re(I), Ir(III) or lanthanides) that confer luminescence to the metal complex and, therefore, can be used as optical probes for those species that are able to interact with the imidazole basic or acidic nitrogen atoms [40]. Furthermore, the introduction of substituents in the 2 position of IP is very easy from the preparation point of view (see below), opening up almost endless possibilities for the design of analyte-targeted ligands. Therefore, to us, it seemed feasible to synthesize the luminescent Ru-btip and Re-btip probes (Figure 1) and to explore their capability to detect the presence of antimony. Actually, some Ru-btip complexes (but not ours) have been shown to bind DNA in vitro [41] and have been used as sensitizers for photodynamic therapies (most notably of bladder tumors) [42]. In order to ensure an intramolecular photoinduced electron transfer from btip in the Ru-btip complexes that might be modulated by the presence of Sb(III), we decided to use bpz and tap as ancillary ligands (Figure 1) rather than bpy or phen because bpz and tap dramatically increase the excited state oxidation potential of the corresponding Ru(II) heteroleptic complexes [34].

3.1. Synthesis of Ligands and Ru(II) and Re(I) Polypyridyl Probes for Antimony

To synthesize the btip ligand containing a 2,2′-bitiophene group (Figure 1), the straightforward methodology described by Batista et al. [43], which uses 1,10-phenanthroline-5,6-dione (PD) as the starting material, was followed with some modifications. PD was itself prepared in moderate yield from 1,10-phenanthroline according to an oxidation procedure described in the literature [44]. The latter was admixed with ammonium acetate and 2,2′-bithiophene-5-carbaldehyde to obtain the sought for 2-(2,2′-bithien-5-yl)-1H-imidazo[4,5-f]-1,10-phenanthroline (btip) ligand. The heteroleptic Ru(II)-btip complexes with 2,2′-bipyrazine (bpz) and 1,4,5,8-tetraazaphenanthrene (tap) (Figure 1) were prepared from Ru(bpz)2Cl2 and Ru(tap)2Cl2, respectively, in a similar way to the heteroleptic complex with 2,2′-bipyridine reported by Pedras et al. [41]. Due to the weak coordination ability of the bpz ligand (particularly under light and heat) [28], and even using sub-stoichiometric amounts of the precursor btip, the 6 h reaction yielded a mixture of the [Ru(bpz)2(btip)]2+ and [Ru(bpz)(btip)2]2+ complexes, co-isolated as the corresponding bis(hexafluorophosphate) salts upon precipitation with aqueous NH4PF6. Their separation required semi-preparative HPLC to obtain an amount of high purity to carry out the photochemical and analytical characterization; however, this was not required for its tap analog as the [Ru(tap)2(btip)]2+ is the largely major product. Unfortunately, the [Ru(bpz)2(btip)]2+ species could not be isolated with enough purity for the studies in the presence of Sb(III); therefore, the spectroscopic and photochemical study was only performed with [Ru(bpz)(btip)2]2+. The [Re(CO)3(H2O)(btip)]Cl complex was synthesized by heating the triaqua precursor in water with btip. Details of the spectroscopic data recorded and fully assigned to confirm the structure of all precursors and products are provided in the Supplementary Materials document.

3.2. Spectroscopic and Photochemical Features of the Rhenium(I) Probe

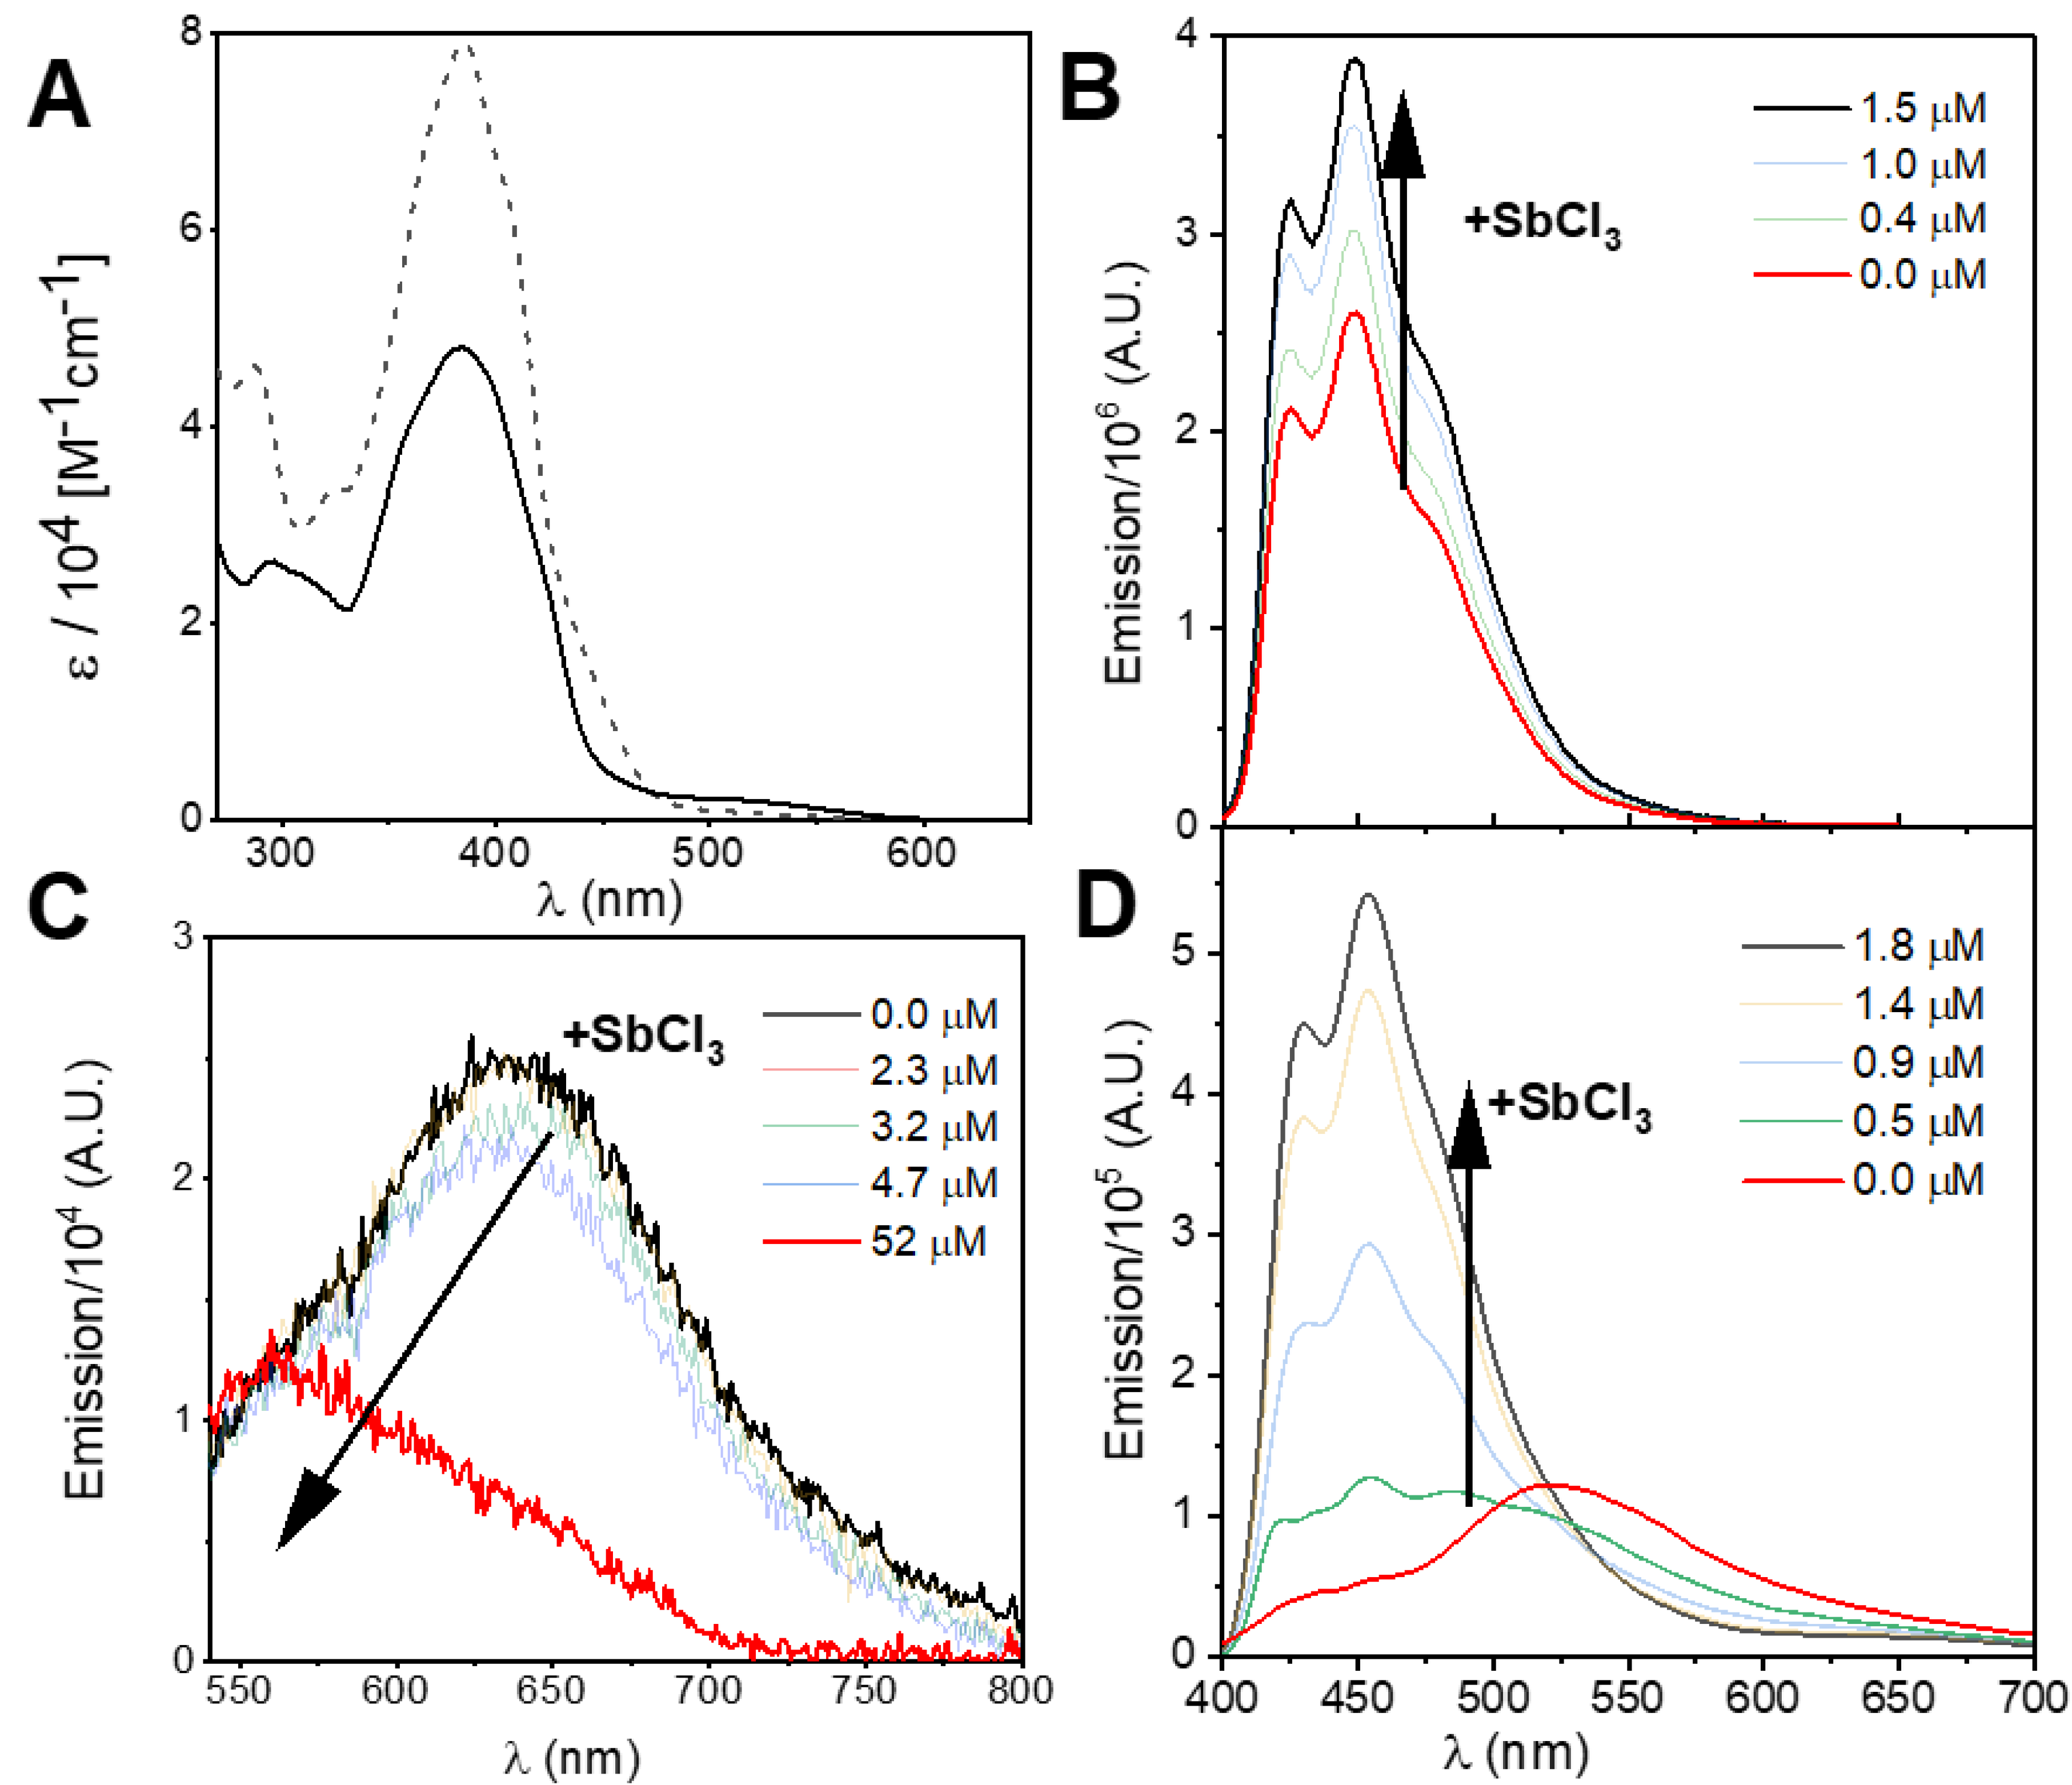
The UV-Vis absorption spectrum of the fac-[Re(CO)3(H2O)(btip)]+ (Re-btip) complex (Figure 2A) shows a strong band at 385 nm along with a few weaker bands in the 270−330 nm region, all of which can be assigned to intraligand (IL) π-π* transitions within the btip moiety by comparison with the absorption spectrum of the free ligand (see also ref. [43] for the spectroscopic data of btip in 1,4-dioxane). An additional very weak absorption band at lower energy (λmax ~ 520 nm), which is absent in the spectrum of the btip ligand, is compatible with a MLCT(Re→btip) transition, namely dπ(Re) → π*imidazo-phen). These IL and MLCT bands have molar absorption coefficients (ε) of 48,000 L mol−1 cm−1 and 2000 L mol−1 cm−1 at 385 nm and 520 nm, respectively. An absorption spectrum of a Re(I) tricarbonyl complex with an imidazophenanthroline ligand has been reported [45], and both the intraligand and MLCT bands are found at significantly higher energies with similar ε values (28,000 L mol−1 cm−1 and 5000 L mol−1 cm−1 at 320 nm and 400 nm, respectively). This comparison highlights the effect of the bithiophene moiety on the shift to lower energies of such transitions and the strengthening of the IL one.
Figure 2 also displays the luminescence spectra of both the free btip ligand and the Re-btip complex in DMF solutions. A π*-π structured emission with maximums at 425, 450, and 480 nm was observed upon excitation at 380 nm of a DMF solution of btip (Figure 2B). When exciting the Re-btip complex at this wavelength, the intraligand emission undergoes a significant red shift to 522 nm, and its fine structure becomes blurred (Figure 2D). This dramatic red shift might be due to the fluorescence of the Cl-hydrogen-bonded or deprotonated Re-btip on the imidazophenanthroline moiety of btip due to the increase in the acidity of its NH atom because of the coordination to the metal core [40] and the enhanced basicity of Cl in the (anhydrous) DMF. A similar effect has been observed for the Ru(II) complex dissolved in chloroform–acetonitrile mixture but, logically, not in methanol (see below). Nevertheless, the excitation of Re-btip in the MLCT band (at 500 nm) yields a broad structureless luminescence centered at 635 nm (Figure 2C) that can be assigned to that coming from the 3MLCT excited state rather than to the intraligand transition.
Upon the addition of increasing substoichiometric amounts of SbCl3 and excitation at 380 nm, the blue emission of both the free btip ligand and the Re-btip complex in solution significantly increases (Figure 2B,D and Figure 3A). In the latter case, the structure of the luminescence band and the position of its maximum are found again at 455 nm, while the green luminescence at 522 nm is lost. However, whereas the free ligand emission increases ca. 1.4-fold at 1.0 μmol L−1 of Sb(III), the luminescence intensity of the complex raises ca. 6.4-fold at the same Sb(III) concentration. The small changes undergone by the absorption of the Re-btip in the presence of such amounts of Sb(III) (Supplementary Material Figure S11) do not account for the important variation in its fluorescence intensity. In this regard, the sensitivity of the luminescent Re-btip complex to the analyte seems to be 4.5× higher than that of the ligand. In both cases, the increase in the IL fluorescence observed in the presence of Sb(III) might be explained by the reduction in the non-radiative deactivation modes upon coordination of the 2,2′-bithiazole moiety of btip to the semimetal.
The SbCl3-btip adduct formed under these conditions might involve the interaction of the electrophilic Sb(III) atom with the π electron density of the thiophene ring rather than with its sulfur atom, as it has been shown through the X-ray diffraction of the bithiophene-SbCl3 adduct [46]. Nevertheless, the additional coordination of SbCl3 to the nitrogen–donor IP moiety cannot be ruled out as it has been evidenced by Ouchi et al. [47] for 2-aminobenzothiazole and 2-sulfanylbenzimidazole using electronic and IR spectroscopies.
Interestingly, unlike its blue fluorescence, the weaker red luminescence from the MLCT excited state of Re-btip is slightly quenched by increasing Sb(III) concentrations with substoichiometric amounts of SbCl3 (Figure 2C). However, when a four-fold excess of the latter is added (50 μmol L−1), the red luminescence fades away and only a maximum at 540 nm is observed. Under this condition, the absorption at the excitation wavelength (500 nm) has also decreased dramatically (Supplementary Material Figure S11), contributing undoubtedly to the loss of the red emission.
The quenching of the 3MLCT emission of the Re(I) complex in DMF might be related to the binding of the excess Sb(III) to multiple sites of the probe or to the deprotonation (or just hydrogen bonding) of the imidazole N-H hydrogen atom by the SbCl3 species, as has been demonstrated for the luminescence quenching of several Ru(II), Os(II) and Ir(III) complexes with imidazo[4,5-f]-1,10-phenanthroline by fluoride, acetate, and other anions in organic media [40]. Therefore, the Re-btip probe can be used as a turn-on or a turn-off luminescent sensor for Sb(III) depending on the excitation and emission wavelengths we choose.

3.3. Spectroscopic and Photochemical Features of the Ruthenium(II) Probes

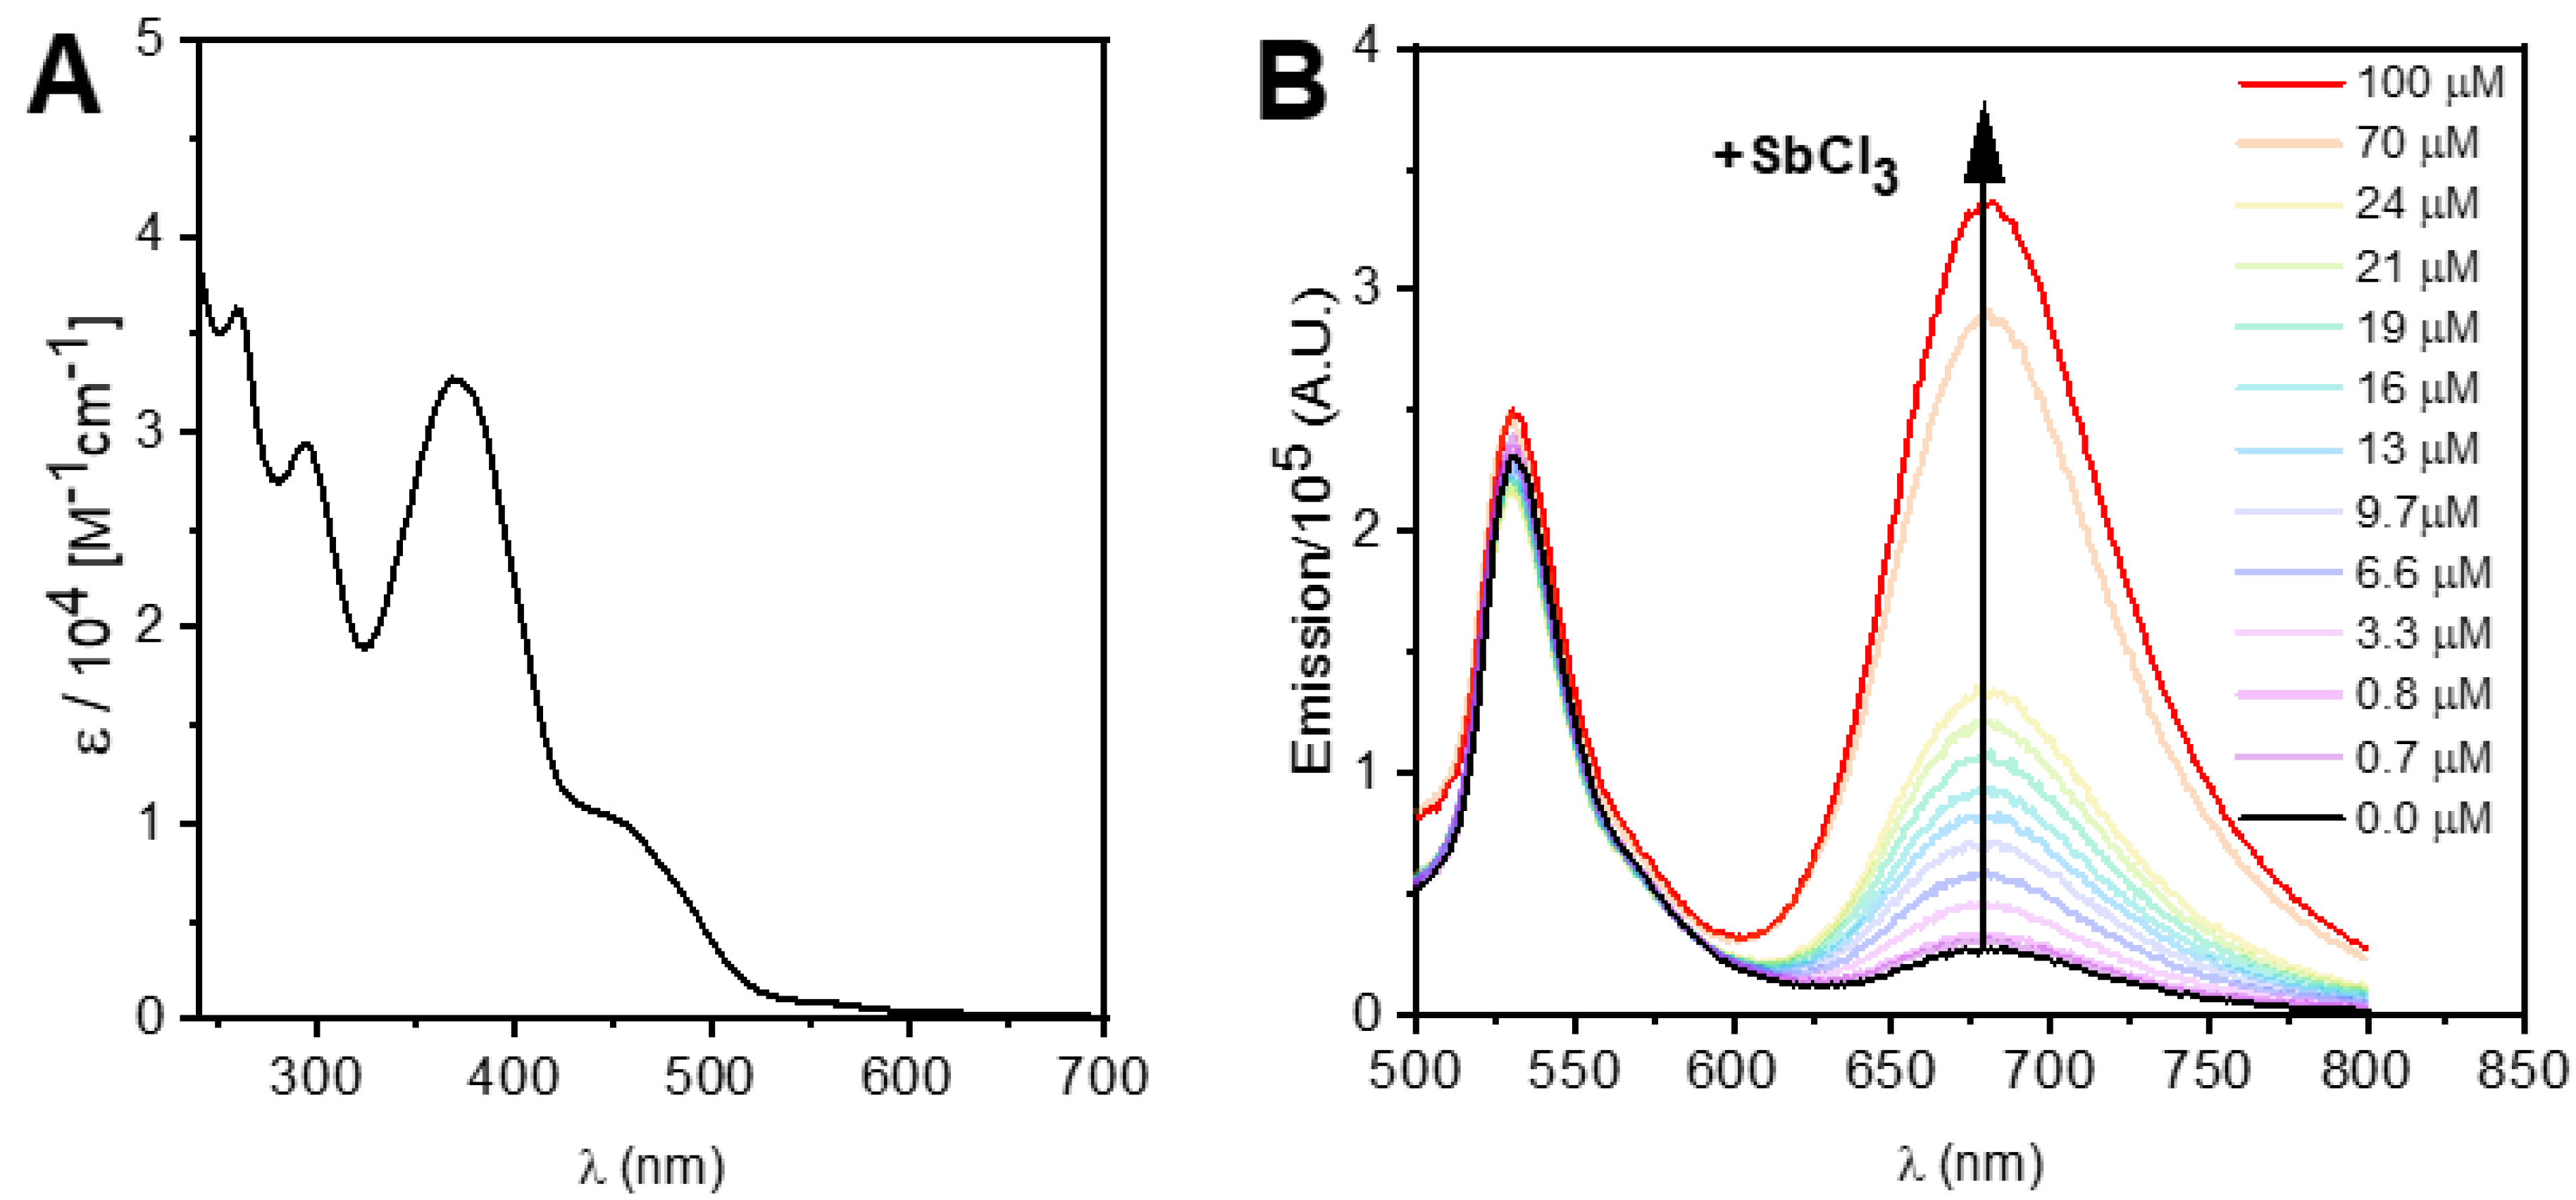
The absorption spectrum of the novel antimony probe, [Ru(bpz)(btip)2]2+, shows the typical metal-to-ligand charge transfer (MLCT) band of Ru(II) polypyridyl complexes as a shoulder at ca. 460 nm (11,600 L mol−1 cm−1) due to the intense band at 380 nm (33,300 L mol−1 cm−1, Figure 4). The latter can readily be attributed to the btip intraligand π-π* absorption (Figure 2A), while the transition at 292 nm (29,400 L mol−1 cm−1) would correspond to the intraligand absorption centered on bpz by comparison with the spectrum of [Ru(bpz)3]2+ [34]. The MLCT absorption features are similar to those reported for [Ru(bpy)2(btip)]2+ (463 nm, 12,700 L mol−1 cm−1 in pH 7 Tris buffer; bpy = 2,2′-bipyridine) [41], demonstrating the small effect of the ancillary ligands (see below for the tap complex).
In order to demonstrate that the [Ru(bpz)(btip)2]2+ complex could also be used as a luminescent sensor for antimony, we performed emission measurements in the absence and in the presence of SbCl3 in a CHCl3-CH3CN 85:15 v/v solvent mixture (for solubility reasons). As can be observed in Figure 4B, the novel Ru(II) complex displays two emission maxima. The first one, at 530 nm, must arise from the fluorescence from the bithiophene moiety as per its position and band width. However, it is significantly red-shifted when compared with the emission of the free ligand (450 nm, see above) and does not display fine structure. Taking into account that Ru(II) is a stronger electron acceptor than Re(I) and that the band maximum is located in a similar position to that observed for the Re-btip complex upon excitation at 380 nm, we may conclude that this band corresponds to the IL fluorescence of the deprotonated imidazole moiety of the Ru-coordinated btip ligand. Furthermore, unlike Re-btip, the intensity of this fluorescence band is insensitive to the presence of Sb(III) in the solution (after correction for the spectral baseline), indicating that ligand deprotonation cannot be reversed by interaction with SbCl3. In addition to the increased acidity of the btip ligand when coordinated to the Ru(II) core, the higher basicity of the CF3CO2 counteranions of the coordination complex in the CHCl3-CH3CN solvent mixture also leads to the full deprotonation of btip. Indeed, we observed that the green fluorescence of [Ru(bpz)(btip)2]2+ vanishes if the complex is dissolved in methanol, either upon excitation at 370 nm or 440 nm, and only a strong fluorescence at 433 nm was found (Supplementary Material Figure S12). The presence of the analyte-insensitive green fluorescence band of this probe in combination with the Sb(III)-modulated red luminescence is a bonus for developing ratiometric emission intensity-based optical sensors for the metalloid.
The second emission maximum, at 680 nm (Figure 4B), is assigned to the typical emission from the lowest lying excited state of the Ru(II) polypyridyl complexes (3MLCT). Compared to the luminescence of [Ru(bpy)2(btip)]2+ [41], the emission of the monobipyrazine complex is significantly weaker. This fact must be attributed to an efficient intramolecular photoinduced electron transfer (PET) quenching from the bithiazole moiety of btip, a process that only occurs for [Ru(bpz)(btip)2]2+ and not for the bpy or phen analogs due to the higher oxidation potential of the bpz complexes in their 3MLCT state compared to their bpy analogs [34]. Such a difference holds whenever bpy or phen ligands in a Ru(II) polypyridyl are replaced with bpz or tap ligands [48]. For instance, a similar difference has been reported for the luminescent H2S probes [Ru(phen)2(tap)]2+ and [Ru(tap)2(phen)]2+: the emission quenching of the latter by H2S is 88 times more efficient than that of the former, so the bis(tap) complex may be used to manufacture a working optosensor for that pollutant gas [49].
The red emission of [Ru(bpz)(btip)2]2+ shows an unprecedented 11-fold intensity increase in the presence of 100 μmol L−1 of SbCl3 (Figure 4B). The Sb(III) boosts the Ru(II) complex ligand-to-metal radiative deactivation pathway due to the removal of the intramolecular PET process from the bithiophene moiety to the electronically excited Ru(II) complex upon coordination of the analyte to the btip ligand, as we have discussed above for the Re-btip complex. Therefore, the Ru-btip complex may be regarded as an optical “turn-on” luminescent sensor for Sb(III). Comparison with the Re-btip probe (Figure 3) shows that the analyte sensitivity of the MLCT luminescence intensity of the Ru(II) complex is lower than that of the IL fluorescence of the former due to the different mechanisms that account for the turn-on effect in the presence of SbCl3. A successful synthesis of the [Ru(bpz)2(btip)]2+ complex would probably lead to a significant enhancement in the sensitivity to Sb(III) due to the higher excited state oxidation potential predicted for the latter (yet at the expense of a higher photolability; see below). The sensitivity of the analog Ru(II) complex with two tap ligands (Figure 3C) lends support to this hypothesis.
The [Ru(bpz)(btip)2]2+ indicator dye can also operate in the advantageous emission lifetime-based mode because we confirmed that this photophysical parameter also increases in the presence of Sb(III), in the same solvent mixture used for the steady-state experiments (Figure 5). The luminescence of [Ru(bpz)(btip)2]2+ decays multi-exponentially in the Sb(III) concentration range we explored (Table 1). This fact may be due to the existence of different stereoisomers with distinct excited state lifetimes (see below and Figure S13, Supplementary Material), to the formation of various probe-Sb(III) adducts with different stoichiometry, and to the presence of some amount of free Ru-btip complex in equilibrium with the adduct(s). The observed increase in the pre-exponentially weighted emission lifetime (τM, Figure 5B and Table 1), i.e., the average lifetime that shows the best correlation with the luminescence phase shift measurements preferred for in situ lifetime-based optical sensing, is in agreement with the magnitude of the luminescence intensity increase.
The observation of three different excited state lifetimes, even when Sb(III) is absent (Table 1), suggests the existence of at least three distinct molecular configurations with different efficiencies for transferring a single electron to the vacant t2g orbital of the (d6) Ru(II) core formed upon the absorption of light. These configurations might be the s-cis/s-trans stereoisomers that are formed by the rotation of the (partially double) thiophene-thiophene and thiophene–imidazole bonds (see Supplementary Material Figure S13), either associated or not to the SbCl3 species (see Section 3.2). Additional configurations might arise upon the association of SbCl3 to the imidazolate N atom of the deprotonated btip ligand. However, not all of these configurations would have different rates of intramolecular photoinduced electron transfer (or some of them might be just conformations). Interestingly, when the 2,2′-bithiazole moiety is not directly connected to the coordinated phen ligand (e.g., via a 5-aminocarbonyl linker), the 3MLCT excited state of the Ru(II) complex decays exponentially (i.e., there is no evidence of more than one excited state lifetime) [50].
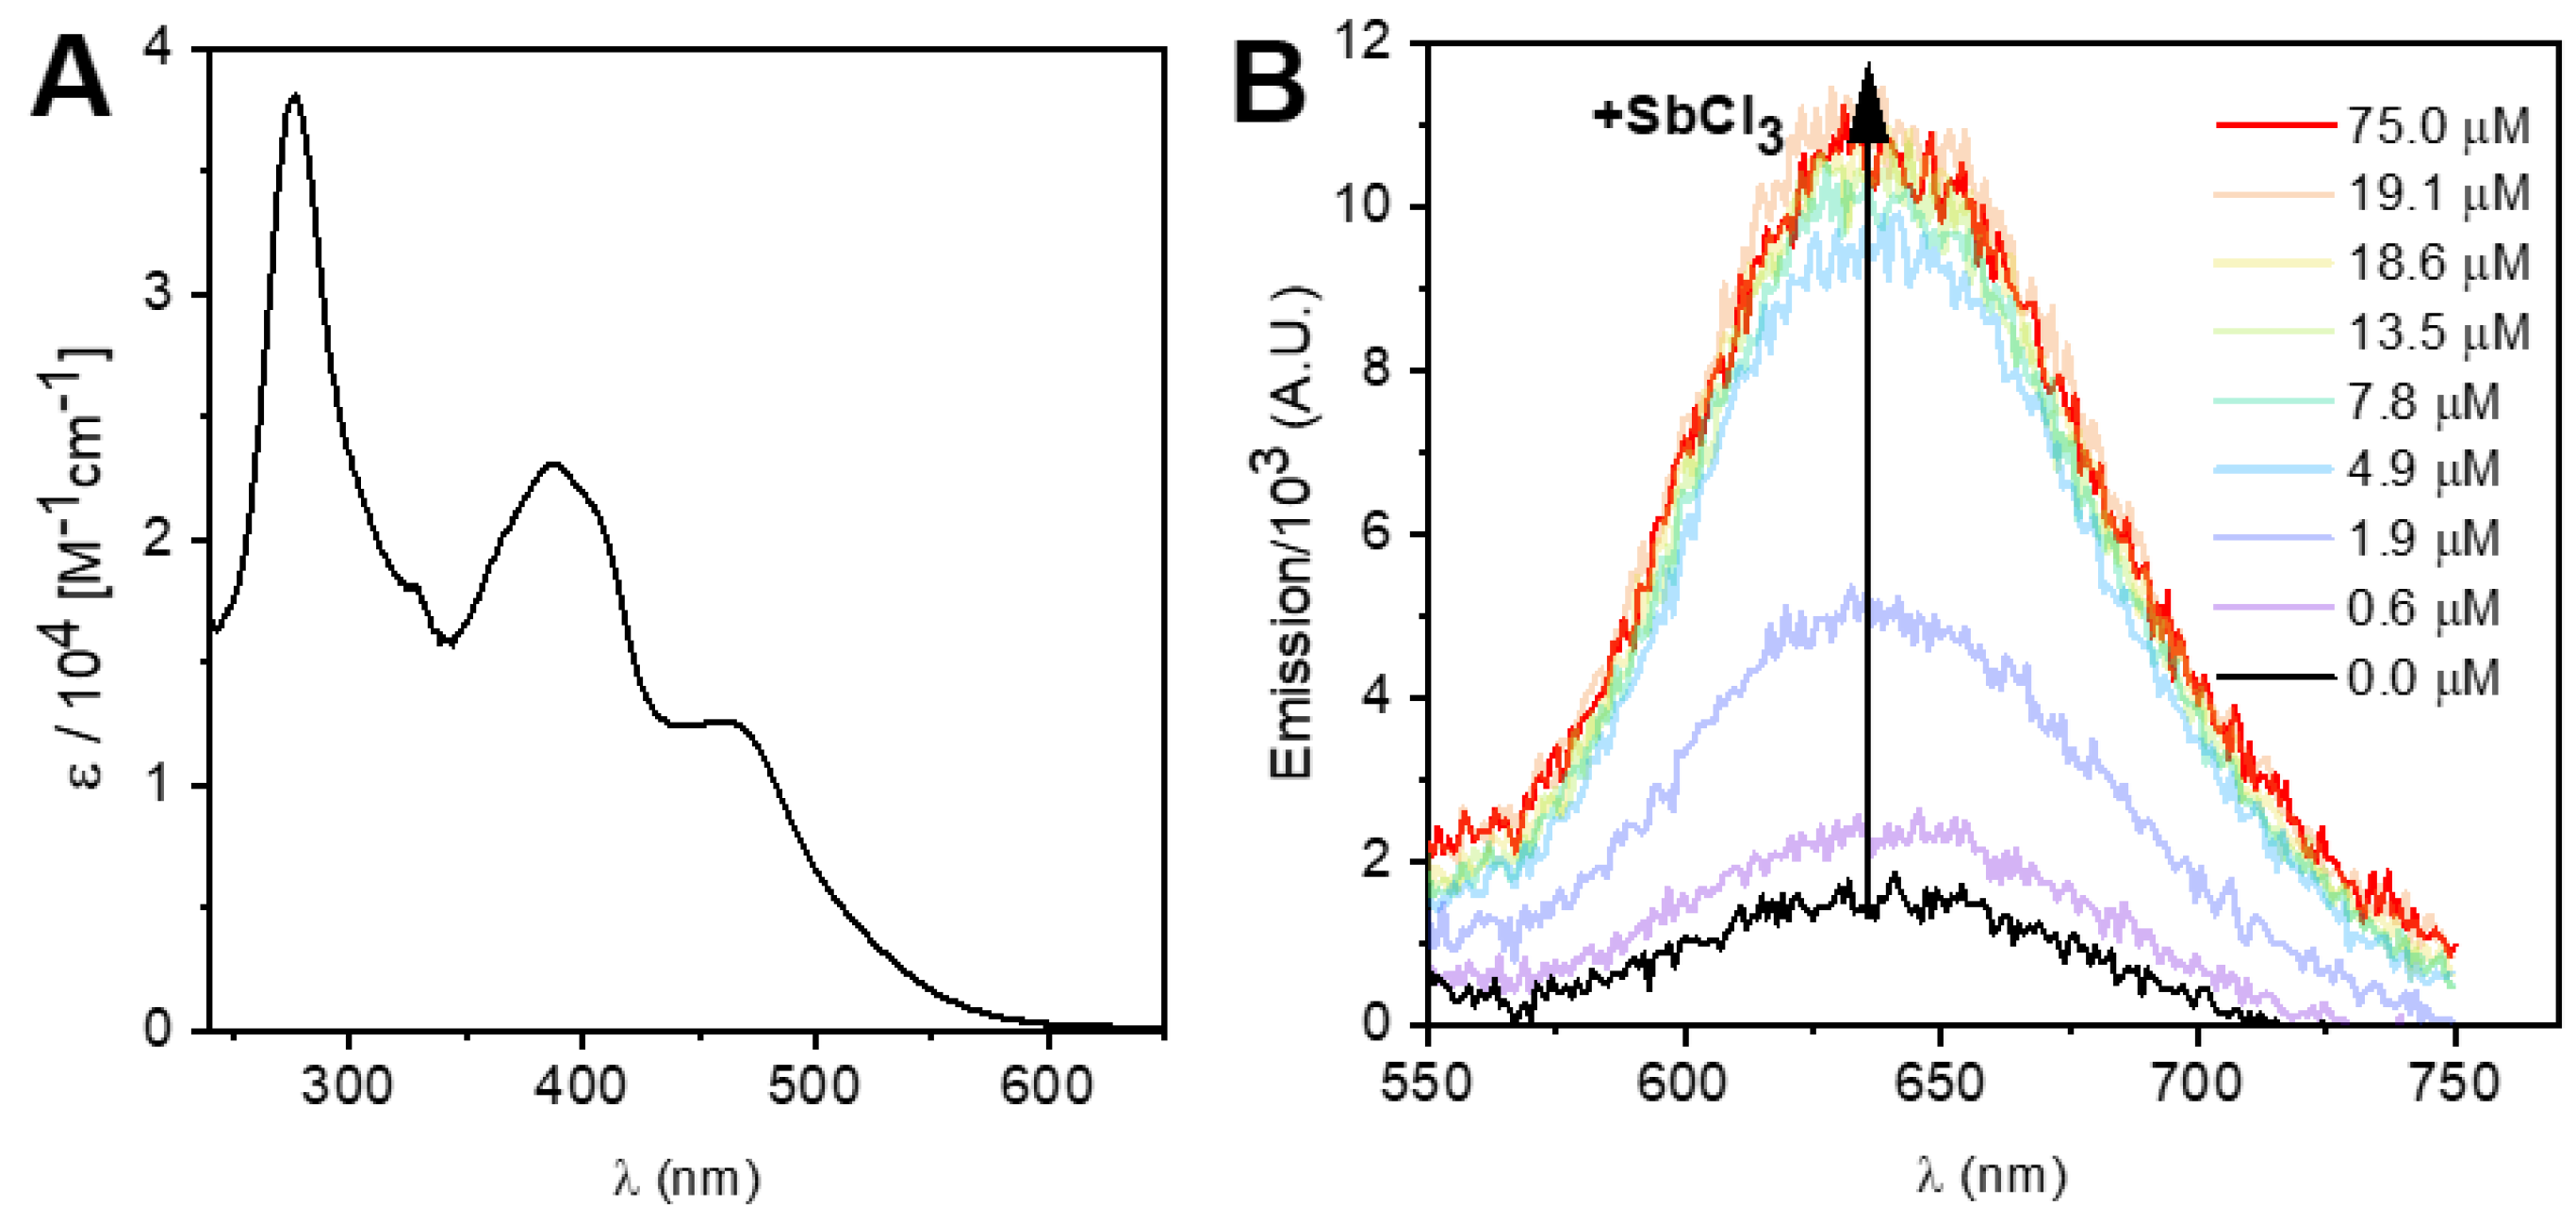
To test the response mechanism outlined above and to increase the photostability of the bpz probe, the analogous Ru-btip complex containing two ancillary tap ligands rather than a single bpz was synthesized, and its luminescence was tested in the presence of Sb(III) (Figure 6). The [Ru(tap)2(btip)]2+ probe displays similar behavior to the bpz counterpart, but its red luminescence from the 3MLCT state at 635 nm is weaker. The tap ligand imparts a higher photostability to the corresponding Ru(II) complexes due to its rigidity compared to the bpz analog. This is due to the fact that ligand photodetachment in Ru(II) polypyridyls arises from the population of a close-lying (non-emissive) dissociative triplet metal-centered (3MC) excited state [48]. Such population occurs readily at room temperature for complexes with a small 3MLCT–3MC energy gap, e.g., bpz and tap complexes. However, the presence of two tap ligands instead of a single bpz ligand in the coordination sphere of Ru(II) significantly increases the excited state oxidation potential of the complex [49], so that the PET process is more efficient than that in the [Ru(bpz)(btip)2]2+ probe, and the 3MLCT luminescence of the (tap)2 complex is weaker than that of the bpz probe. The [Ru(tap)2(btip)]2+ also responds to the presence of Sb(III) and with higher sensitivity than the bis(bpz) probe (Figure 3C). Furthermore, because the emission spectra have been measured in methanol (for solubility reasons), no emission corresponding to the ligand-centered fluorescence at ~530 nm from the deprotonated btip coordinated to Ru(II) is found (Supplementary Material Figure S14).
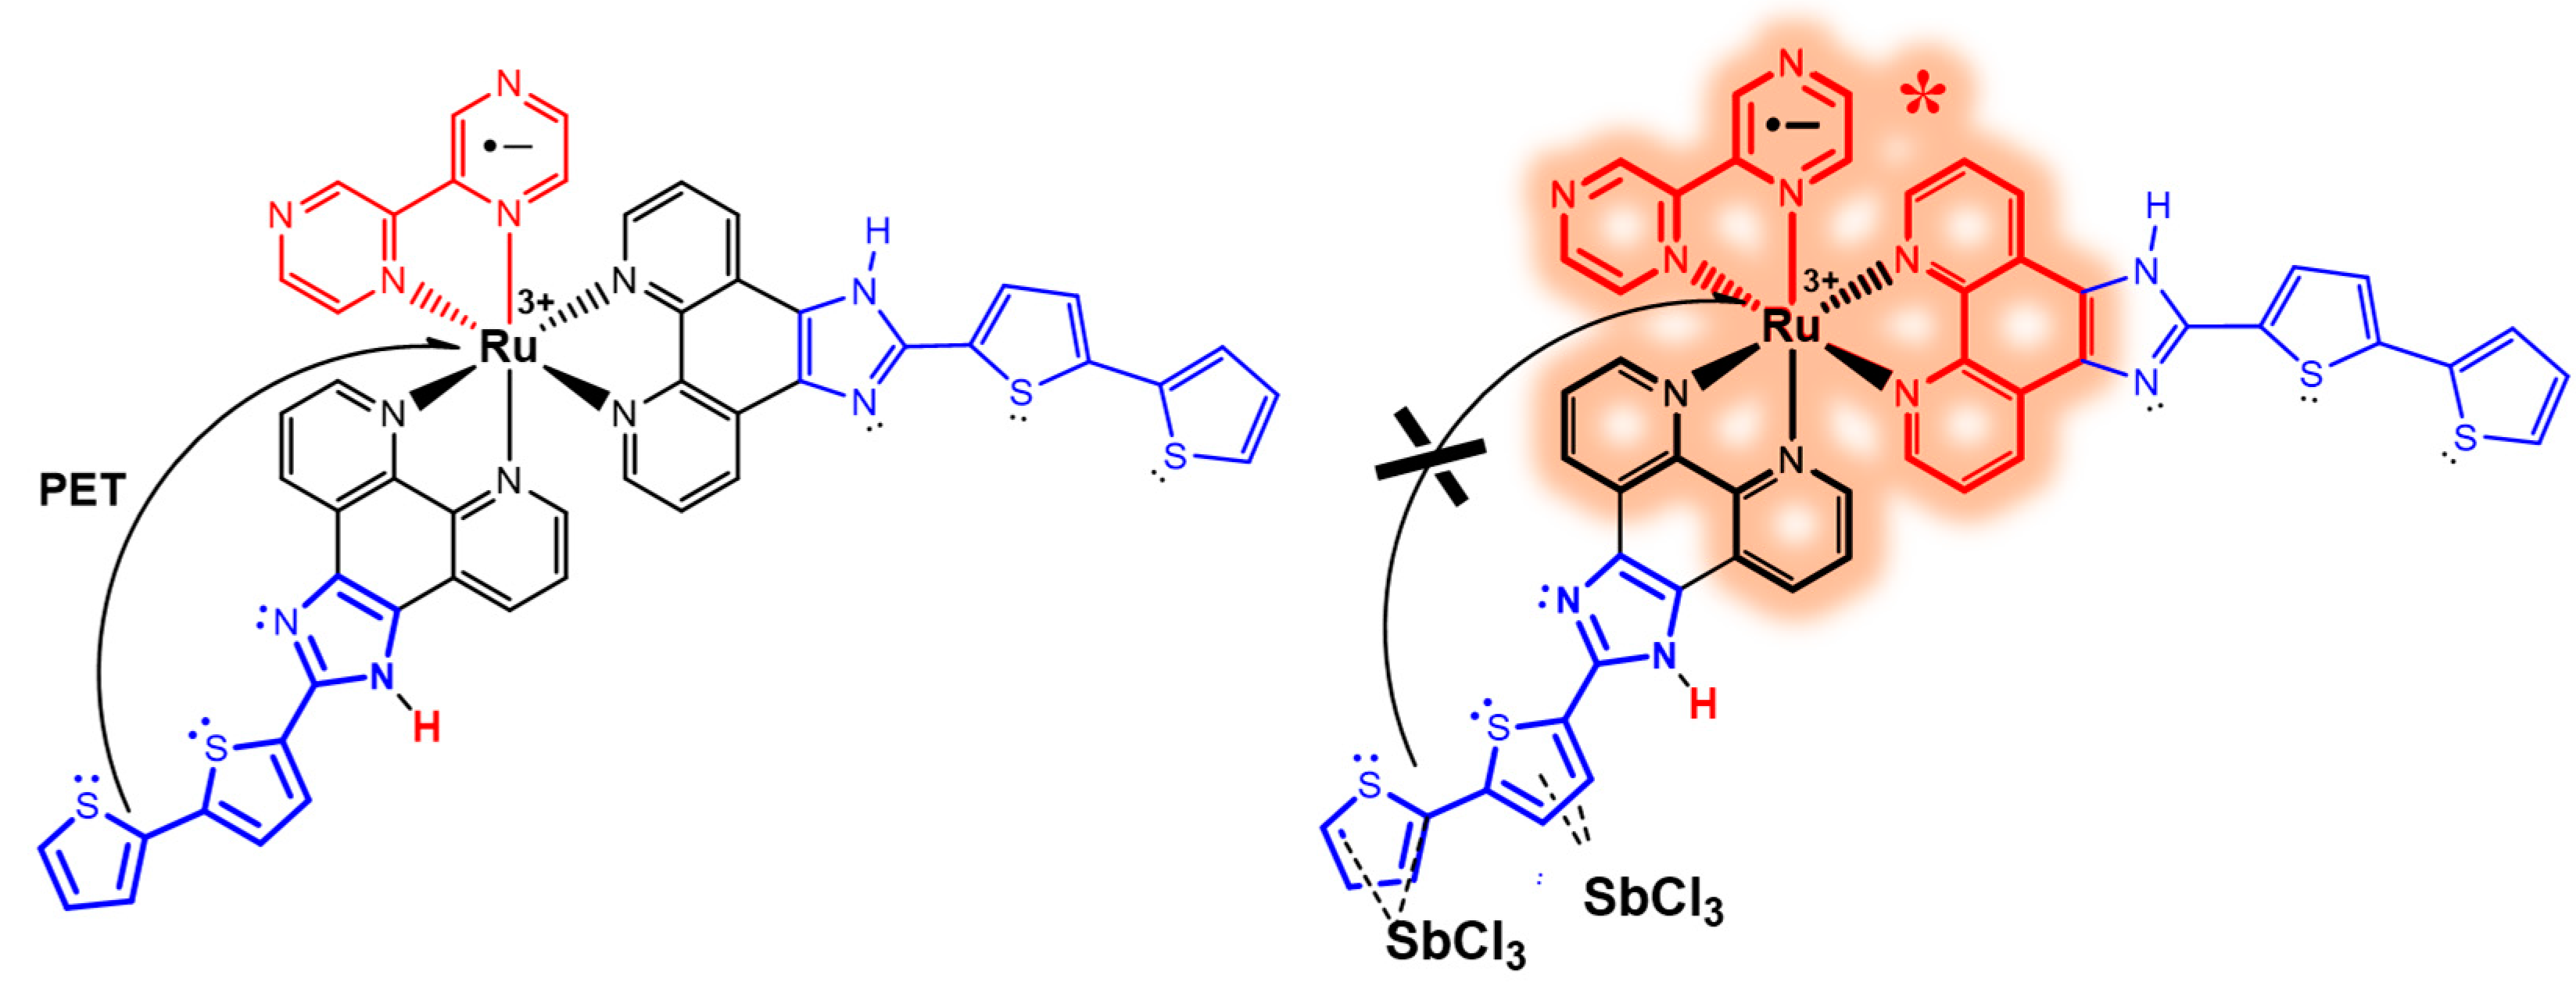
A scheme that summarizes the response mechanism of the novel Sb(III) probe to Sb(III) is depicted in Figure 7.

4. Conclusions

Both [Re(CO)3(H2O)(btip)]+ (Re-btip) and [Ru(bpz)(btip)2]2+ (Ru-btip), hitherto unknown probes, have demonstrated to be promising candidates for developing luminescence turn-on sensors for Sb(III) monitoring, each of them with the advantages and disadvantages of the respective Re-based or Ru(II)-based families of probes. Depending on the excitation and emission monitoring wavelengths, the Re-btip complex shows an enhancement/quenching of its dual luminescence in the presence of Sb(III), which is of particular interest for achieving spectral tunable optical sensors for this analyte. In addition to a ratiometric luminescence intensity sensing mode in non-protogenic solvents, the Ru-btip indicator dye also allows for the monitoring of the analyte in emission lifetime-based time-resolved or phase-sensitive modes with adequate instrumentation (for instance, that used for the luminescence sensing of dissolved oxygen in surface water quality monitoring). So far, the use of these molecular probes would require the extraction of the Sb(III) species into an organic solvent to maximize the (reversible) analyte–probe interaction and increase the analyte detectability. These luminescent molecular sensors have demonstrated their versatile response to SbCl3 in this first account; however, further tests and method optimization are required to identify whether they are sensitive to other potentially interfering species present in the actual sample, to test their response to other Sb(III) compounds (e.g., organoantimonials), to allow their use in various fields, and to reach the required detection levels in the different analytical applications.
The interaction of Sb(III) with the metal-coordinated btip ligand occurs in different sites of the latter, including the -NH or the N atoms of its imidazole moiety and the S atoms and π electron density of the bithiophene moiety. Preliminary results of studies carried out by monitoring the btip-SbCl3 interaction by 1H-NMR and computational modeling methods are consistent with these multiple association modes that control the intramolecular photoinduced electron transfer process suppressed or attenuated by the analyte coordination to the metal probe. Further studies to elucidate these key factors are currently under way.

Supplementary Materials

The following supporting information can be downloaded at https://www.mdpi.com/article/10.3390/chemosensors12100217/s1: Figure S1: 1H NMR spectrum of 2,2′-bipyrazine (300 MHz, CDCl3). Figure S2: 1H NMR spectrum of 1,10-phenanthroline-5,6-dione (PD) (300 MHz, DMSO-d6). Figure S3: 1H NMR spectrum of 2-(2,2′-bithien-5-yl)-1H-imidazo[4,5-f]-1,10-phenanthroline (btip) (300 MHz, DMSO-d6). Figure S4: 1H NMR spectrum of [Ru(bpz)(btip)2]2+(CF3CO2)2 (300 MHz, CD3OD). Figure S5: MALDI TOF(+) mass spectrum of [Ru(bpz)(btip)2]2+(CF3CO2)2 from CD3OD solution; matrix: 2,5-DHB in 30% CAN-70% H2O with 0.1% TFA. Figure S6: 1H NMR spectrum of [Ru(tap)2(btip)]2+(PF6)2 (300 MHz, CD3CN). Figure S7: High-resolution ESI(+) mass spectrum of [Ru(tap)2(btip)]2+(PF6)2 in methanol. Figure S8: 1H NMR spectrum of fac-[Re(CO)3(H2O)(btip)]+Cl (500 MHz, DMSO-d6). Figure S9: NMR 1H-1H COSY spectrum of fac-[Re(CO)3(H2O)(btip)]+Cl (500 MHz, DMSO-d6). Figure S10: ESI(+) mass spectrum of fac-[Re(CO)3(H2O)(btip)]+Cl in methanol. Figure S11: Electronic absorption spectra of fac-[Re(CO)3(H2O)(btip)]+Cl in the absence or in the presence of different concentrations of SbCl3 in DMF. Figure S12: Luminescence spectra of [Ru(bpz)(btip)2]2+ in MeOH upon (A) excitation at 370 nm; (B) excitation at 440 nm. Figure S13: Possible configurations that arise by rotation of the thiophene–thiophene and thiophene–imidazole bonds of [Ru(bpz)(btip)2]2+ that would explain the appearance of multiple emission lifetimes both in the presence (depicted) and in the absence (not depicted) of thiophen-coordinated antimony (as SbCl3). The possibility of Sb(III) coordination to one to four of the thiophene moieties of the btip ligands might be another cause of the multi-exponential decays of the probe emission. Figure S14: Full luminescence spectra of [Ru(tap)2(btip)]2+ (13.0 μmol L−1) in the presence of SbCl3 at different concentrations ([Sb]/μmol L−1 = 0; 0.62; 1.86; 4.87; 7.79; 13.35; 18.58; 19.09; and 75.00) in methanol; λexc = 450 nm. The spectrum of the solvent is provided as luminescence-free control.

Author Contributions

Conceptualization, G.O.; methodology, G.O. and G.T.R.; validation, G.O., F.R. and G.T.R.; formal analysis, A.V.S., G.O., F.R. and G.T.R.; investigation, A.V.S., G.O., F.R. and G.T.R.; resources, G.O.; data curation, G.O. and G.T.R.; writing—original draft preparation, A.V.S., G.O., F.R. and G.T.R.; writing—review and editing, G.O.; supervision, G.O.; project administration, G.O.; funding acquisition, G.O. All authors have read and agreed to the published version of the manuscript.

Funding

This research was funded by the Spanish Ministry of Science, Innovation and Universities (MICIU), grant no. PID2021-127457OB-C22, as well as by CONICET (PIP 0189CO), ANPCyT (PICT-2021-I-INVI-00697), and Universidad Nacional de La Plata (11/X954) of Argentina.

Institutional Review Board Statement

Not applicable.

Informed Consent Statement

Not applicable.

Data Availability Statement

The raw data supporting the conclusions of this article will be made available by the authors upon request.

Acknowledgments

A.V.S. acknowledges Airbus Military/Universidad San Pablo—CEU doctoral research fellowships in Spain. FR and GTR are Research Members of CONICET (Argentina).

Conflicts of Interest

The authors declare no conflicts of interest.

References

  1. Dembele, S.; Akcil, A.; Panda, S. Technological trends, emerging applications and metallurgical strategies in antimony recovery from stibnite. Minerals Eng. 2022, 175, 107304. [Google Scholar] [CrossRef]
  2. Filella, M. (Ed.) Antimony; De Gruyter: Berlin, Germany, 2021; ISBN 9783110665345. [Google Scholar]
  3. Jenkins, D.J. (Ed.) Properties and Uses of Antimony; Nova Science Publishers: New York, NY, USA, 2022; ISBN 9798886970883. [Google Scholar]
  4. Blackmon, D. Antimony: The Most Important Mineral You Never Heard Of. Forbes, 2021, May 6. Available online: https://www.forbes.com/sites/davidblackmon/2021/05/06/antimony-the-most-important-mineral-you-never-heard-of/ (accessed on 9 August 2024).
  5. Ruiz-Postigo, J.A.; Jain, S. Pentavalent Antimonials in the Treatment of Human Leishmaniasis. In Antimony; Filella, M., Ed.; De Gruyter: Berlin, Germany, 2021; pp. 303–317. ISBN 9783110665345. [Google Scholar]
  6. Periferakis, A.; Caruntu, A.; Periferakis, A.-T.; Scheau, A.-E.; Badarau, I.A.; Caruntu, C.; Scheau, C. Availability, Toxicology and Medical Significance of Antimony. Int. J. Environ. Res. Public Health 2022, 19, 4669. [Google Scholar] [CrossRef]
  7. Song, W.; Zhang, D.; Pan, X.; Lee, D.J. Complexation of HSA with different forms of antimony (Sb): An application of fluorescence spectroscopy. J. Lumin. 2013, 136, 80–85. [Google Scholar] [CrossRef]
  8. Karagas, M.R.; Wang, A.; Dorman, D.C.; Hall, A.L.; Pi, J.B.; Sergi, C.M.; Symanski, E.; Ward, E.M.; Arrandale, V.H.; Azuma, K.; et al. Carcinogenicity of cobalt, antimony compounds, and weapons-grade tungsten alloy. Lancet Oncol. 2022, 23, P577–P578. [Google Scholar] [CrossRef]
  9. Bolan, N.; Kumar, M.; Singh, E.; Kumar, A.; Singh, L.; Kumar, S.; Keerthanan, S.; Hoang, S.A.; El-Naggar, A.; Vithanage, M.; et al. Antimony contamination and its risk management in complex environmental settings: A review. Environ. Internat. 2022, 158, 106908. [Google Scholar] [CrossRef]
  10. Filella, M. Antimony and PET bottles: Checking facts. Chemosphere 2020, 261, 127732. [Google Scholar] [CrossRef]
  11. Zhang, Y.; Ding, C.; Gong, D.; Deng, Y.; Huang, Y.; Zheng, J.; Xiong, S.; Tang, R.; Wang, Y.; Su, L. A review of the environmental chemical behavior, detection and treatment of antimony. Environ. Technol. Innov. 2021, 24, 102026. [Google Scholar] [CrossRef]
  12. Matulis, R.M.; Guyon, J.C. Spectrophotometric Determination of Antimony. Anal. Chem. 1965, 37, 1391–1395. [Google Scholar] [CrossRef]
  13. Abu-Hilal, A.H.; Riley, J.P. The spectrophotometric determination of antimony in water, effluents, marine plants and silicates. Anal. Chim. Acta 1981, 131, 175–186. [Google Scholar] [CrossRef]
  14. Rath, S.; Jardim, W.; Dórea, J. A simple spectrophotometric procedure for the determination of antimony(III) and (V) in antileishmanial drugs. Fresenius J. Anal. Chem. 1997, 358, 548–550. [Google Scholar] [CrossRef]
  15. Matusiewicz, H.; Krawczyk, M. Determination of total antimony and inorganic antimony species by hydride generation in situ trapping flame atomic absorption spectrometry: A new way to (ultra)trace speciation analysis. J. Anal. Atomic Spectrom. 2008, 23, 43–53. [Google Scholar] [CrossRef]
  16. Correia, F.O.; Almeida, T.S.; Garcia, R.L.; Queiroz, A.F.S.; Smichowski, P.; da Rocha, G.O.; Araujo, R.G.O. Sequential determination and chemical speciation analysis of inorganic as and sb in airborne particulate matter collected in outdoor and indoor environments using slurry sampling and detection by HG-AAS. Environ. Sci. Pollut. Res. 2019, 26, 21416–21424. [Google Scholar] [CrossRef]
  17. Ferreira, S.L.C.; Pereira dos Anjos, J.; Felix, C.S.A.; Marques da Silva Junior, M.; Palacio, E.; Cerdá, V. Speciation analysis of antimony in environmental samples employing atomic fluorescence spectrometry—Review. TrAC Trends Anal. Chem. 2019, 110, 335–343. [Google Scholar] [CrossRef]
  18. Toghill, K.E.; Lu, M.; Compton, R.G. Electroanalytical Determination of Antimony. Int. J. Electrochem. Sci. 2011, 6, 3057–3076. [Google Scholar] [CrossRef]
  19. Espinosa Bosch, M.; Ruiz Sanchez, A.J.; Sanchez Rojas, F.; Bosch Ojeda, C. Arsenic and antimony speciation analysis in the environment using hyphenated techniques to inductively coupled plasma mass spectrometry: A review. Int. J. Environ. Waste Manag. 2010, 5, 4–63. [Google Scholar] [CrossRef]
  20. Li, P.; Chen, Y.-J.; Hu, X.; Lian, H.-Z. Magnetic solid phase extraction for the determination of trace antimony species in water by inductively coupled plasma mass spectrometry. Talanta 2015, 134, 292–297. [Google Scholar] [CrossRef]
  21. Lin, Y.-A.; Jiang, S.-J.; Sahayam, A.C. Determination of antimony compounds in waters and juices using ion chromatography-inductively coupled plasma mass spectrometry. Food Chem. 2017, 230, 76–81. [Google Scholar] [CrossRef]
  22. Orellana, G. Fluorescence-Based Sensors. In Optical Chemical Sensors; Baldini, F., Chester, A.N., Homola, J., Martellucci, S., Eds.; NATO Sci Ser II; Springer: Dordrecht, The Netherland, 2006; Volume 224, pp. 99–116. [Google Scholar] [CrossRef]
  23. Demchenko, A.P. Introduction to Fluorescence Sensing, 3rd ed.; Springer Nature: Cham, Switzerland, 2023; Volume 2. [Google Scholar] [CrossRef]
  24. Orellana, G.; Darder, M.M.; Quílez-Alburquerque, J. Luminescence-Based Sensors for Water Quality Analysis. In Encyclopedia of Sensors and Biosensors; Narayan, R., Ed.; Elsevier: Amsterdam, The Netherlands, 2023; Volume 4, pp. 599–613. [Google Scholar] [CrossRef]
  25. Filer, T.D. Fluorometric determination of submicrogram quantities of antimony. Anal. Chem. 1971, 43, 725–729. [Google Scholar] [CrossRef]
  26. Qureshi, N.; Ehtisham-ul-Haque, S.; Abbas, M.; Yameen, M.; Azhar, M.F.; Mahmoudi, G.; Nazir, A.; Iqbal, M. Synthesis of fluorescent di-dansyl substituted ethoxy compound: A selective sensor for antimony and thallium metals detection. J. Mater. Res. Technol. 2019, 8, 1576–1580. [Google Scholar] [CrossRef]
  27. Wu, C.; Zhang, W.-J.; Zeng, X.; Mu, L.; Xue, S.-F.; Tao, Z.; Yamato, T. New fluorescent sensor for antimony and transition metal cations based on rhodamine amide-arm homotrioxacalix[3]arene. J. Incl. Phenom. Macrocycl. Chem. 2010, 66, 125–131. [Google Scholar] [CrossRef]
  28. Orellana, G.; García-Fresnadillo, D. Environmental and industrial optosensing with tailored luminescent Ru(II) polypyridyl complexes. In Optical Sensors: Industrial, Environmental and Diagnostic Applications; Narayanaswamy, R., Wolfbeis, O.S., Eds.; Springer: Berlin/Heidelberg, Germany, 2004; pp. 309–357. ISBN 978-3-540-40886-4. [Google Scholar]
  29. Wu, M.; Zhang, Z.; Yong, J.; Schenk, P.M.; Tian, D.; Xu, Z.P.; Zhang, R. Determination and Imaging of Small Biomolecules and Ions Using Ruthenium(II) Complex-Based Chemosensors. Topics Curr. Chem. 2022, 380, 29. [Google Scholar] [CrossRef] [PubMed]
  30. Rashid, A.; Mondal, S.; Ghosh, P. Development and Application of Ruthenium(II) and Iridium(III) Based Complexes for Anion Sensing. Molecules 2023, 28, 1231. [Google Scholar] [CrossRef] [PubMed]
  31. Lee, L.C.-C.; Lo, K.K.-W. Strategic Design of Luminescent Rhenium(I), Ruthenium(II), and Iridium(III) Complexes as Activity-Based Probes for Bioimaging and Biosensing. Chem. Asian J. 2022, 17, e202200840. [Google Scholar] [CrossRef] [PubMed]
  32. Urriza-Arsuaga, I.; Ielasi, G.; Bedoya, M.; Orellana, G. Luminescence-Based Sensors for Bioprocess Applications. In Fluorescence in Industry; Pedras, B., Ed.; Springer Nature: Berlin/Heidelberg, Germany, 2019; pp. 1–38. [Google Scholar] [CrossRef]
  33. Perrin, D.D.; Armarego, W.L.F.; Perrin, D.R. Purification of Laboratory Chemicals, 2nd ed.; Pergamon: Oxford, UK, 1980; ISBN 0-08-022961-1. [Google Scholar]
  34. Crutchley, R.J.; Lever, A.B.P. Comparative Chemistry of Bipyrazyl and Bipyridyl Metal Complexes: Spectroscopy, Electrochemistry, and Photoanation. Inorg. Chem. 1982, 21, 2276–2282. [Google Scholar] [CrossRef]
  35. Dickerson, J.E.; Summers, L.A. Derivatives of 1,10-Phenanthroline-5,6-quinone. Aust. J. Chem. 1970, 23, 1023–1027. [Google Scholar] [CrossRef]
  36. Masschelein, A.; Jacquet, L.; Kirsch-De Mesmaeker, A.; Nasielski, J. Ruthenium complexes with 1,4,5,8-tetraazaphenanthrene. Unusual photophysical behavior of the tris-homoleptic compound. Inorg. Chem. 1990, 29, 855–860. [Google Scholar] [CrossRef]
  37. Ragone, F.; Saavedra, H.H.M.; García, P.F.; Wolcan, E.; Argüello, G.A.; Ruiz, G.T. Association studies to transporting proteins of fac-ReI(CO)3(pterin)(H2O) complex. J. Biol. Inorg. Chem. 2017, 22, 99–108. [Google Scholar] [CrossRef]
  38. Greenwood, N.N.; Earnshaw, A. Chemistry of the Elements, 2nd ed.; Butterworth-Heinemann: Oxford, UK, 1997; pp. 578–583. ISBN 0750633654. [Google Scholar]
  39. Aghazada, S.; Nazeeruddin, M.K. Ruthenium Complexes as Sensitizers in Dye-Sensitized Solar Cells. Inorganics 2018, 6, 52. [Google Scholar] [CrossRef]
  40. Naithani, S.; Goswami, T.; Thetiot, F.; Kumar, S. Imidazo [4,5-f][1, 10] phenanthroline based luminescent probes for anion recognition: Recent achievements and challenges. Coord. Chem. Rev. 2023, 475, 214894. [Google Scholar] [CrossRef]
  41. Pedras, B.; Batista, R.M.F.; Tormo, L.; Costa, S.P.G.; Raposo, M.M.M.; Orellana, G.; Capelo, J.L.; Lodeiro, C. Synthesis, characterization, photophysical studies and interaction with DNA of a new family of Ru(II) furyl- and thienyl-imidazo-phenanthroline polypyridyl complexes. Inorg. Chim. Acta 2012, 381, 95–103. [Google Scholar] [CrossRef]
  42. Shi, G.; Monro, S.; Hennigar, R.; Colpitts, J.; Fong, J.; Kasimova, K.; Yin, H.; DeCoste, R.; Spencer, C.; Chamberlain, L.; et al. Ru(II) Dyads Derived from α-Oligothiophenes: A New Class of Potent and Versatile Photosensitizers for PDT. Coord. Chem. Rev. 2015, 282−283, 127–138. [Google Scholar] [CrossRef]
  43. Batista, R.M.F.; Costa, S.P.G.; Belsey, M.; Lodeiro, C.; Raposo, M.M.M. Synthesis and characterization of novel (oligo)thienyl-imidazo-phenanthrolines as versatile p-conjugated systems for several optical applications. Tetrahedron 2008, 64, 9230–9238. [Google Scholar] [CrossRef]
  44. Yamada, M.; Tanaka, Y.; Yoshimoto, Y.; Kuroda, S.; Shimao, I. Synthesis and Properties of Diamino-Substituted Dipyrido (3, 2-a: 2‘, 3‘-c) phenazine. Bull. Chem. Soc. Jpn. 1992, 65, 1006–1011. [Google Scholar] [CrossRef]
  45. Choroba, K.; Penkala, M.; Palion-Gazda, J.; Malicka, E.; Machura, B. Pyrenyl-Substituted Imidazo[4,5-f][1,10]phenanthroline Rhenium(I) Complexes with Record-High Triplet Excited-State Lifetimes at Room Temperature: Steric Control of Photoinduced Processes in Bichromophoric Systems. Inorg. Chem. 2023, 62, 19256–19269. [Google Scholar] [CrossRef]
  46. Korte, L.; Lipka, A.; Mootz, D. Addukte schwefelhaltiger Heteroaromaten mit SbCl3 Untersuchungen zur Bildung und Kristallstruktur von 2,2′-Dithienyl· 2 SbCl3 und Benzo-[b]-thiophen· 2 SbCl3. Z. Anorg. Chem. 1985, 524, 157–167. [Google Scholar] [CrossRef]
  47. Ouchi, A.; Takeuchi, T.; Taminaga, I. The syntheses and properties of the benzothiazole or benzimidazole derivative adduct of Tin(II, IV) and antimony(III) halides. Bull. Chem. Soc. Japan 1970, 43, 2840–2844. [Google Scholar] [CrossRef]
  48. Ortmans, I.; Moucheron, C.; Kirsch-De Mesmaeker, A. Ru(II) polypyridine complexes with a high oxidation power. Comparison between their photoelectrochemistry with transparent SnO2 and their photochemistry with desoxyribonucleic acids. Coord. Chem. Rev. 1998, 168, 233–271. [Google Scholar] [CrossRef]
  49. Urriza-Arsuaga, I.; Bedoya, M.; Orellana, G. Unprecedented reversible real-time luminescent sensing of H2S in the gas phase. Anal. Chem. 2019, 91, 2231–2238. [Google Scholar] [CrossRef]
  50. Majewski, M.B.; Tacconi, N.R.D.; MacDonnell, F.M.; Wolf, M.O. Ligand-Triplet-Fueled Long-Lived Charge Separation in Ruthenium(II) Complexes with Bithienyl-Functionalized Ligands. Inorg. Chem. 2011, 50, 9939–9941. [Google Scholar] [CrossRef]
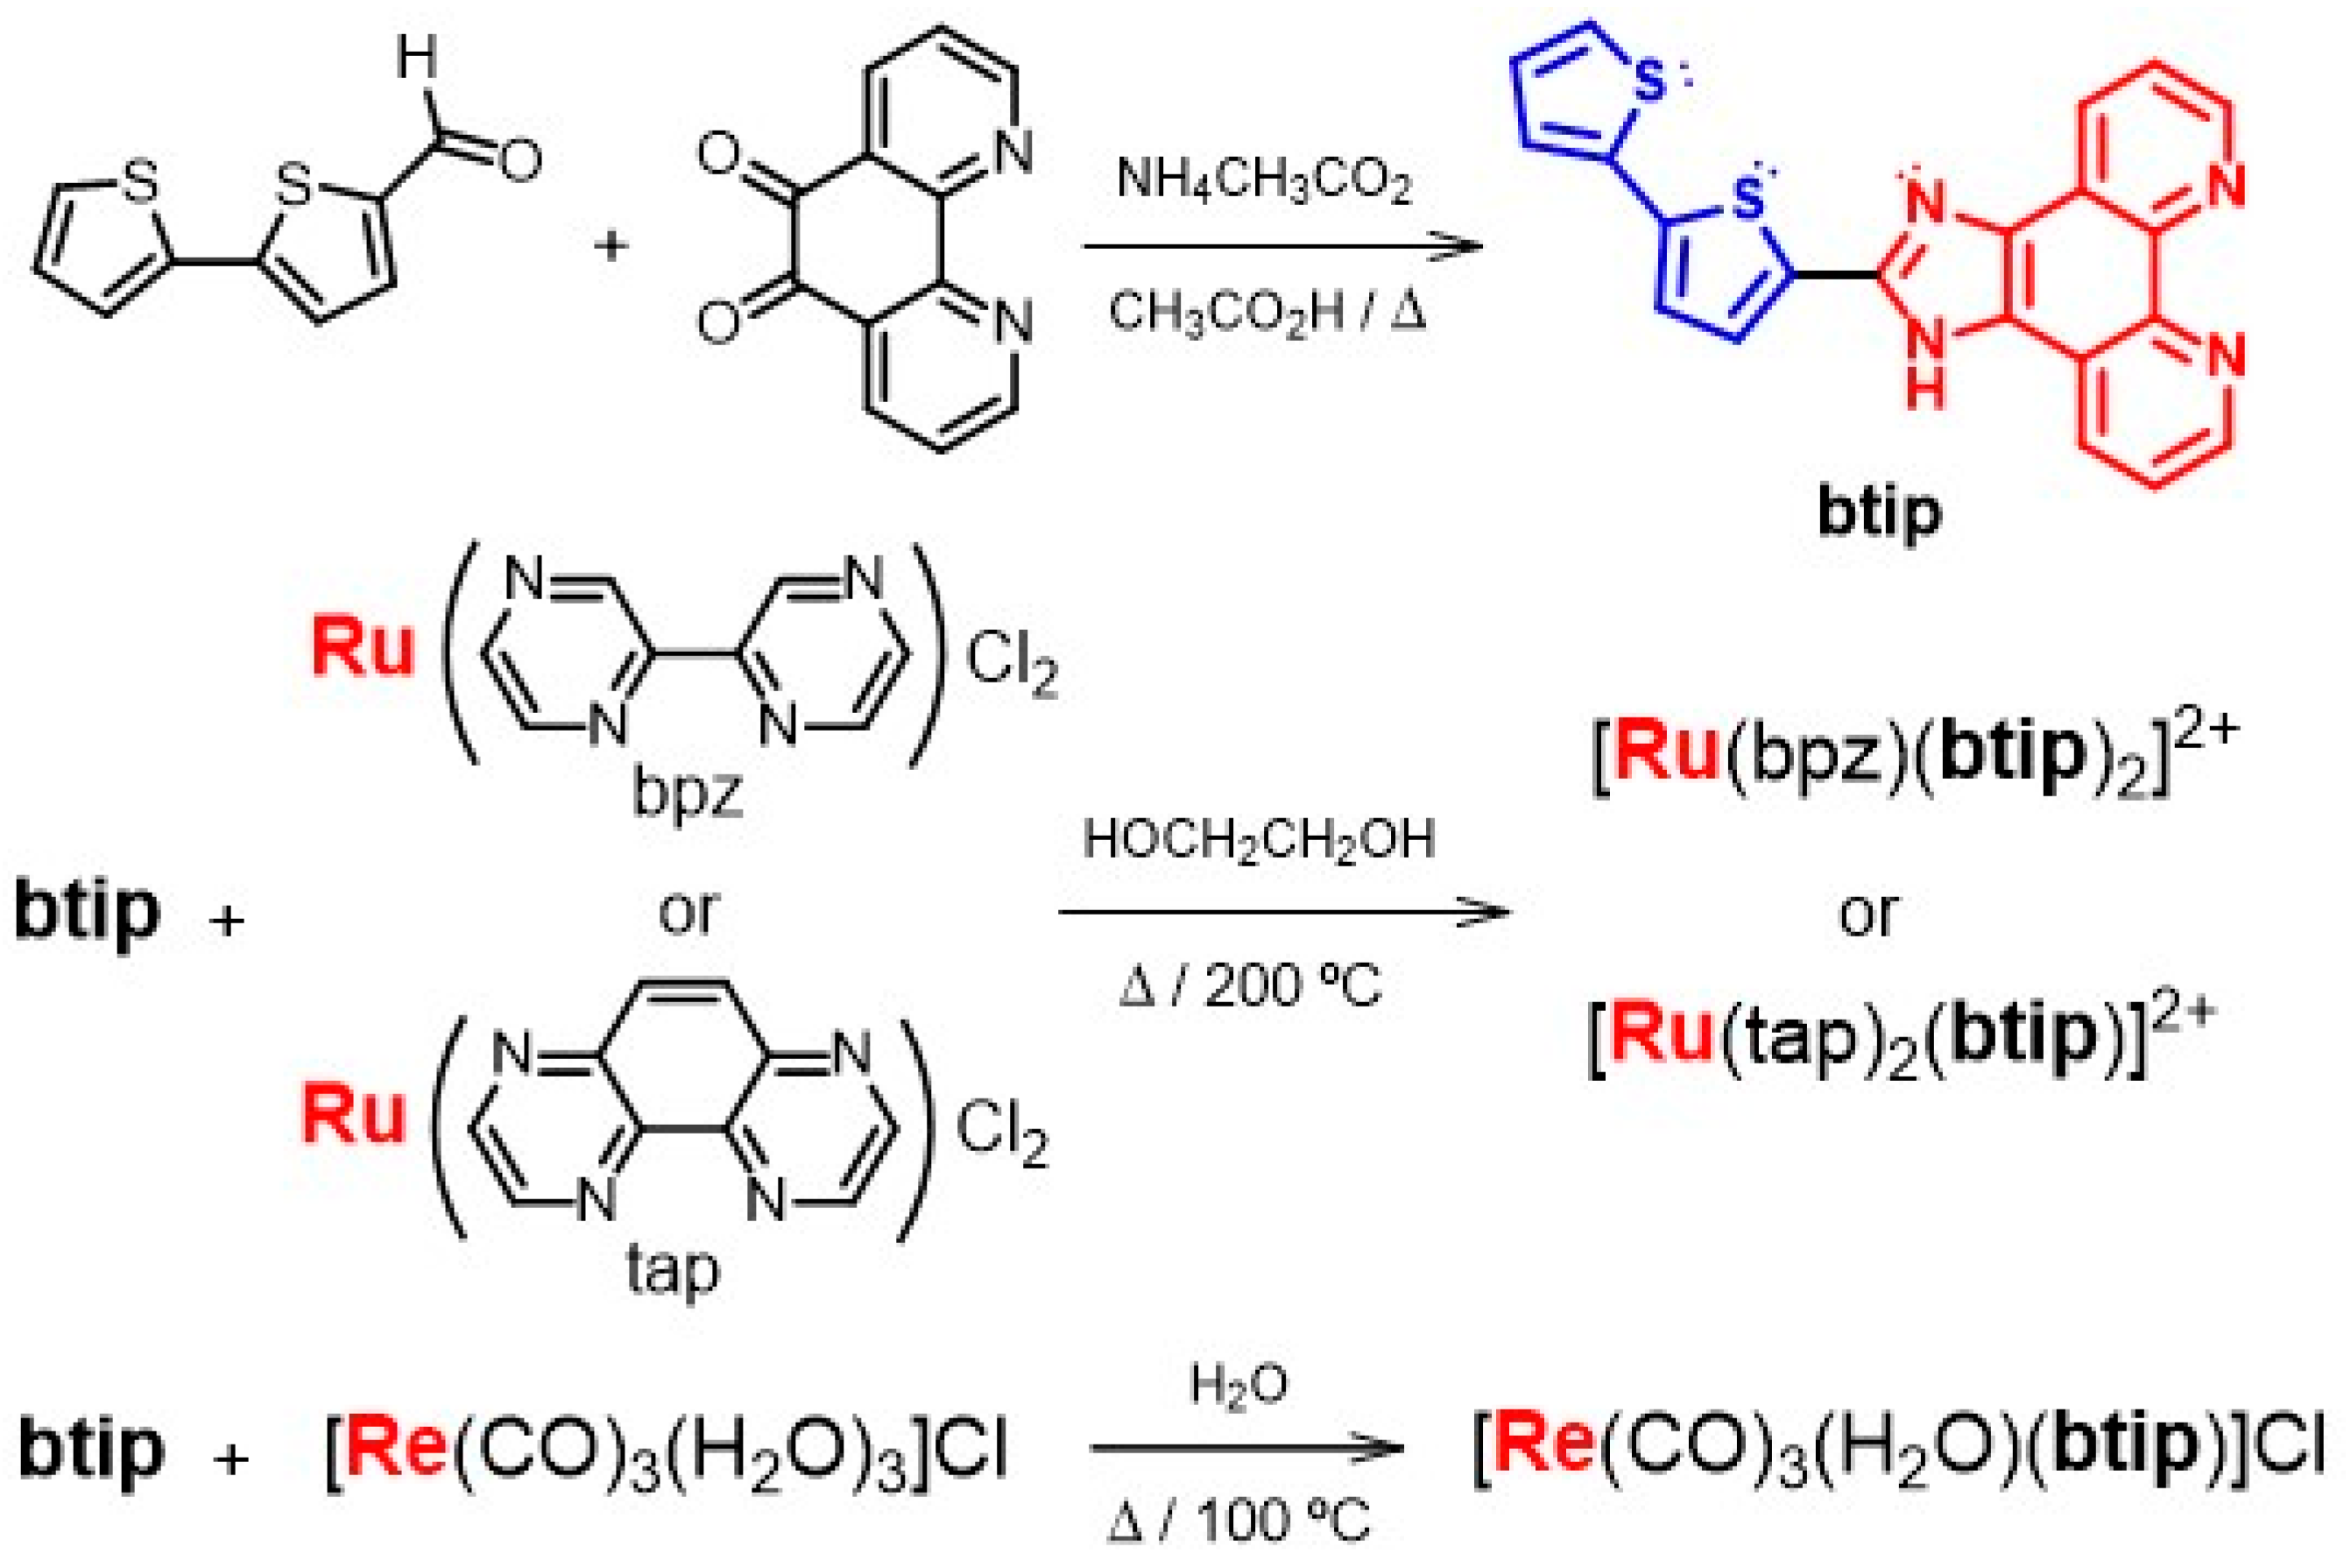
Figure 1. Chemical structures and synthetic routes of the btip ligand and the novel luminescent probes for Sb(III). The imidazo[4,5-f]-1,10-phenanthroline (IP) and 2,2′-bithiophene (BT) moieties of the former are depicted in red and blue colors, respectively.
Chemosensors 12 00217 g001
Figure 2. (A) UV-Vis absorption spectra of the btip ligand (dashed line) (5.0 μmol L−1) and the fac-[Re(CO)3(H2O)(btip)]+ (Re-btip) complex (solid line) (18 μmol L−1) in DMF at room temperature. (BD) Luminescence spectra in DMF at room temperature, in the presence of various Sb3+ concentrations, of (B) the btip ligand, 2.0 μmol L−1, λexc = 380 nm; (C) the Re-btip complex, 13 μmol L−1, λexc = 500 nm; and (D) the Re-btip complex, 4.2 μmol L−1, λexc = 380 nm.
Chemosensors 12 00217 g002
Figure 3. Relative luminescence intensity of the Sb(III) molecular probes at the maximum of their corresponding emission band as a function of the SbCl3-to-probe mole ratio: (A) 4.2 μM [Re(CO)3(H2O)(btip)]+ in DMF (the result does not change if 10 μM [Re-btip] is used instead); (B) 10.0 μM [Ru(bpz)(btip)2]2+ in acetonitrile; (C) 13.0 μM [Ru(tap)2(btip)]2+ in methanol–water (89:11 v/v). λexc = 380, 440, and 450 nm, respectively; λem = 450, 680, and 635 nm, respectively.
Chemosensors 12 00217 g003
Figure 4. (A) UV-Vis absorption spectrum of [Ru(bpz)(btip)2]2+ (10.0 μmol L−1) in acetonitrile. (B) Luminescence spectra of [Ru(bpz)(btip)2]2+ (10.0 μmol L−1) in the absence and in the presence of SbCl3 at different concentrations (0.7–100 μmol L−1) in CHCl3–acetonitrile (85:15 v/v); λexc = 440 nm.
Chemosensors 12 00217 g004
Figure 5. (A) [Ru(bpz)(btip)2]2+ luminescence decays at 690 nm (463 nm diode laser excitation) in the absence and in the presence of SbCl3 at different concentrations (0.68–47 μmol L−1, Table 1) in CHCl3–acetonitrile (85:15 v/v). (B) Variation in the relative pre-exponentially weighted emission lifetime (τM(Sb)/τM(0); see Table 1 for the definition and calculation of τM) as a function of the added SbCl3 in CHCl3–acetonitrile (85:15 v/v).
Chemosensors 12 00217 g005
Figure 6. (A) UV-Vis absorption spectrum of [Ru(tap)2(btip)]2+ (13.0 μM) in methanol–water (89:11 v/v) showing maximums at 460 nm (13,100 L mol−1 cm−1), 381 (23,200 L mol−1 cm−1), and 279 nm (38,000 L mol−1 cm−1). (B) Luminescence spectra of [Ru(tap)2(btip)]2+ (13.0 μmol L−1) in methanol in the presence of SbCl3 at different concentrations; λexc = 450 nm.
Chemosensors 12 00217 g006
Figure 7. Scheme of the photochemical mechanism responsible for the Sb(III) (as SbCl3) sensing with the luminescent [Ru(bpz)(btip)2]2+ probe in non-protogenic organic media. The red emission of the Ru(II) complex is extremely low in the absence of the analyte due to intramolecular photoinduced electron transfer (PET) from the bithiophene moiety to the luminescent 3MLCT state of the complex (depicted). However, the probe emission switches ON when Sb(III) coordinates to the bithiophene moiety and suppresses the fast PET deactivation pathway. The actual structure and stoichiometry of the SbCl3-btip adduct(s) are unknown, and the artist rendering is only based on the reported adducts of SbCl3 with 2,2′-bithiophene and related heterocycles [46]. The acidic hydrogen atom of btip is shown, but it may be absent or exchanged between the heterocyclic N atoms depending on the solvent.
Chemosensors 12 00217 g007
Table 1. Emission lifetime of [Ru(bpz)(btip)2]2+ in the presence of SbCl3 at different concentrations in CHCl3–acetonitrile (85:15 v/v); λexc = 463 nm; λem = 690 nm.
[SbCl3]/μmol L−1τ1/ns (%) aτ2/ns (%) aτ3/ns (%) aτM/ns b
0.0012 (47)40 (30)268 (22)21.5
0.6814 (35)65 (22)326 (43)34
1.3617 (32)79 (23)336 (46)43
2.0018 (18)115 (22)351 (60)76
10.019 (7)140 (25)359 (68)139
14.027 (6)162 (29)362 (65)178
47.041 (2)186 (34)386 (63)247
a The relative contribution to the overall luminescence of each component (%i) of a tri-exponential decay ( I L ( t ) = A + 1 3 B i e t / τ i ) is given by the equation: % i = 1 3 B i τ i B i τ i ; a higher number of exponentials does not improves the goodness of fit. b Pre-exponentially weighted luminescence lifetime: τ M = 1 3 B i τ i B i .
Disclaimer/Publisher’s Note: The statements, opinions and data contained in all publications are solely those of the individual author(s) and contributor(s) and not of MDPI and/or the editor(s). MDPI and/or the editor(s) disclaim responsibility for any injury to people or property resulting from any ideas, methods, instructions or products referred to in the content.