Abstract
Reinforced concrete structures are prevalent in infrastructure and are of significant economic and social importance to humanity. However, they are prone to decay from cement paste carbonation. pH sensors have been developed to monitor cement paste carbonation, but their adoption by the industry remains limited. This work introduces two new methods for monitoring cement paste carbonation in real time that have been validated through the accelerated carbonation of cement paste samples. Both configurations depart from traditional pH monitoring. In the first configuration, the carbonation depth of a cement paste sample is measured using two CO2 optical fiber sensors. One sensor is positioned on the surface of the sample, while the other is embedded in the middle. As the carbonation depth progresses and reaches the embedded CO2 sensor, the combined response of the sensors changes. In the second configuration, a multimode fiber is embedded within the paste, and its carbonation is monitored by observing the increase in reflected light intensity (1.6–18%) resulting from the formation of CaCO3. Its applicability in naturally occurring carbonation is tested at concentrations of 3.2% CO2, and the influence of water is positively evaluated; thus, this setup is suitable for real-world testing and applications.
1. Introduction
Concrete is crucial to modern society, and its usage is closely tied to economic prosperity [1,2,3]. Over the last century, its wide-range application in housing and infrastructure has led to a rise in cement production, which has in the past decade leveled off at around four billion tons annually [4,5], as shown in Figure 1a.
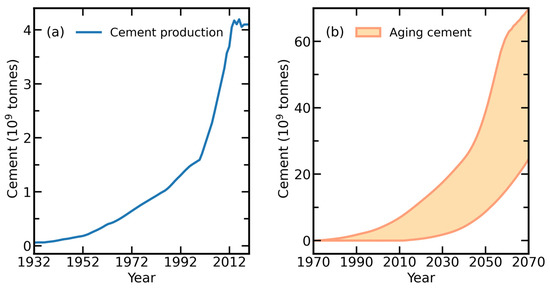
Figure 1.
(a) Cement production throughout the past century [4,5]. (b) Aging prediction of cement paste by integrating cement paste that is 40–60 and 80–120 years old.
The prolific use of concrete has made the cement industry the second largest industrial emitter, accounting for 7% of global emissions [6]. The fossil fuels and electricity required for cement production [7], combined with the CO2 release from the thermal decomposition of calcite (CaCO3) [8], account for most of its environmental impact. The Paris Agreement aims for a 16% reduction in emissions from cement production by 2030 [9], yet cement usage is projected to increase by 12–23% by 2050 due to population and economic growth in developing countries. This could lead to a rise in emissions from 2.9 to 3.5 Gt of CO2 [6,10]. A further increase in demand for cement production is expected due to repairs and the rebuilding of aging infrastructure, whose service life ranges from 50 to 100 years [11]. A lower and upper boundary for this demand is estimated, integrating cement paste that is 40–60 and 80–120 years old, as shown in Figure 1b.
Cement paste carbonation is the reaction of dissolved CO2 with the calcium (Ca) present in concrete cement paste, resulting in the formation of calcium carbonate (CaCO3). This process is a major cause of concrete decay and afflicts two of the main components of cement paste: portlandite (Ca(OH)2) and calcium silicate hydrates (C-S-H) [12]. Portlandite maintains the pH of the cement paste around 12.5–13.8 [13], which protects steel from corrosion. The carbonation of portlandite reduces the pH of cement paste, leaving the rebars exposed to oxidation once the pH drops below 9.0–9.5 [11,13], causing concrete spalling and further exposing the structure to the elements. Calcium silicate hydrates constitute 50–60% of cement paste and are responsible for cement paste’s binding properties and compressive strength [14]. Over time, the reaction of cement paste with CO2 reduces C-S-H’s Ca/Si ratio, increases its porosity, and leads to the formation of cracks. Ultimately, the C-S-H undergoes a complete transformation as it reacts with CO2, leading to the formation of calcium carbonate and amorphous silica hydrate [12].
Monitoring cement paste will be key in extending the service life of existing infrastructure and reducing the need for cement production, a task for which sensors will be indispensable. Cement paste carbonation is currently controlled through the measurement of cement paste’s pH [13,15] and, despite the higher cost, this monitoring remains dependent on periodic visual inspections and destructive, time-consuming sample collection [16]. These samples are analyzed through chemical indicators, such as phenolphthalein [11,17], through leaching methods [18,19], or through concrete pore solution extraction under pressure [20,21]. Despite their low adoption by the industry [16], sensors for the monitoring of cement paste’s pH have been developed and are proven to obtain valuable information. While conventional glass electrodes are unsuited for embedment in reinforced concrete structures due to their frailty and their susceptibility to alkaline error [22], electrochemical sensors using iridium oxide electrodes [23] can be implemented for this purpose. Their long-term stability in solution [23,24] has been translated into reliable measurements in concrete [25,26]. Still, electrochemical methods remain susceptible to electromagnetic interference and to the poor stability of reference electrodes [27]. As an alternative, optical fiber sensors have been researched for the monitoring of cement paste’s pH. Much of this research has been devoted to the development and testing of pH-sensitive membranes (optical modulators) in solution [28,29,30,31,32]. The embedment of sensitive membranes has also been investigated [33,34,35,36], but only a few reports have shown the sensors working while embedded in cementitious materials: the monitoring of the early age of low-pH cement paste [37], the curing of cement paste [38], and the carbonation of mortar [39] and concrete [40]. These sensors use an optical fiber to guide light into a modulator whose absorption spectrum or fluorescence are sensitive to changes in pH. Despite their low cost, these sensors could be susceptible to photobleaching, the instability of the light source, and the leaching out of the indicator [36]. Their susceptibility to the dynamic environment of concrete, such as its varying relative humidity (RH), adsorbed water, vibrations, and crack formation, remains largely untested for both optical fiber and electrochemical sensors.
In this work, optical fiber sensors are employed for the monitoring of cement paste carbonation through two distinct setups. The carbonation depth-monitoring setup exploits the difference in CO2 concentrations between the inside and the outside of a cement paste sample to achieve its carbonation depth. It employs for this purpose two optical fiber sensors functionalized in transmission with a CO2-sensitive colorimetric membrane [41]. The total carbonation-monitoring setup measures the reflectivity changes in the cement paste as the carbonation occurs. This measurement is taken through an embedded multimode fiber without using a modulator, relying solely on the cement paste to change the measured light intensity. In Section 2, both setups are presented along with the underlying carbonation mechanics that they exploit. The cement paste samples used and their curing processes are demonstrated, as well as the carbonation regime they underwent. In Section 3, the results of the accelerated carbonation for both setups are shown and discussed.
2. Materials and Methods
2.1. Carbonation Depth-Monitoring
The carbonatation depth study was performed in a small setup comprising a cured cement paste sample with an inside gap to allow the placement of a CO2 [41] and a temperature sensor, as shown in Figure 2. The sample was produced using Portland limestone cement (CEM II/B-L, 32.5 N) with a water-to-cement ratio (w/c) of 0.5. The sample’s cure was sealed from the outside environment with parafilm to prevent the evaporation of water and left to cure for 7 days, allowing it to achieve 80% of its 28-day cure compressive strength [42,43,44].
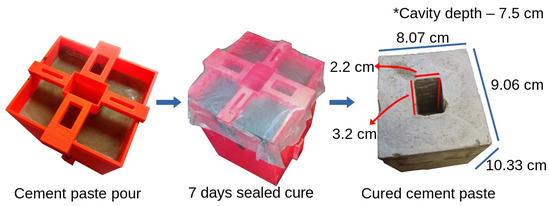
Figure 2.
Fabrication of the cement paste sample via a 3D-printed cast that left a cavity for the placement of a colorimetric optical CO2 sensor after a 7-day sealed cure.
Once cured, the cement paste was removed from the cast and placed in a sealed container (carbonation chamber) as shown in Figure 3, along with two CO2 optical fiber sensors already developed and reported in [41]. One CO2 sensor is embedded in the sample, and the other is adjacent to its outer surface. Each is connected to a spectrometer (Hamamatsu C12880MA, Shizuoka, Japan), as shown by Spec 1 and Spec 2 in Figure 3. Carbon dioxide was introduced at different concentrations into the container. Injections were either pure CO2 (100% CO2) or mixtures of CO2 and N2 when lower concentrations were used. These mixtures were formed in a separate container (the mixing chamber), where the concentration of each gas was controlled through a pressure gauge, and the pressure in the container was always raised to 4 bars before transfer into the carbonation chamber. As explained in [41], the CO2 optical sensors are based on a colorimetric membrane which has a strong absorbance band at 430 nm. Two light-emitting diodes (LEDs), one blue and one red, are used to interrogate the membrane, with their spectral intensity being measured in transmission with a spectrometer, as shown in Figure 4.
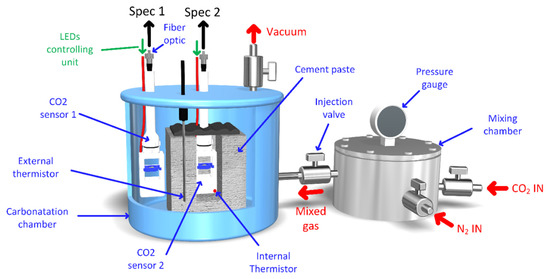
Figure 3.
Carbonation depth-monitoring setup, composed of a carbonation chamber and a mixing chamber. N2 and CO2 are combined in the mixing chamber and released into the adjacent carbonation chamber once the pressure reaches 4 bars. In the carbonation chamber, a cement paste sample is placed with two CO2 optical fiber sensors working in transmission [41], one outside (CO2 sensor 1) and one inside (CO2 sensor 2) of the sample. Likewise, two thermistors are also used in the same configuration.
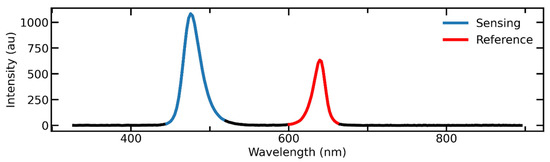
Figure 4.
Sensing (blue) and reference (red) wavelengths used to interrogate the colorimetric CO2-sensitive membrane.
Intensity ratio () of the two LEDs’ wavelengths is a measure of CO2 concentration. The inner CO2 probe (CO2 sensor 2) has a thermistor embedded in it, and a second thermistor is placed on the outside surface of the cement paste sample.
The upper surface of the sample was covered with hot-melt adhesive to prevent the intrusion of CO2 directly to the cavity where the second CO2 sensor is placed. The two optical fiber sensors respond to changes in CO2 concentration at both points and are used to qualitatively infer the carbonation depth of the sample. The combined response of both sensors changes when the carbonation depth reaches the inner sensor. Injections of CO2 used in the carbonation depth-monitoring setup are divided into three different sets, as shown in Table 1:

Table 1.
CO2 injections into the carbonation chamber for the monitoring of the carbonation depth of a cement paste sample.
- Set C1 injections are used to access combined responses from the inner and outer CO2 optical fiber sensors when the carbonation depth has not reached the inner cavity. The pressure in the mixing container is always raised to 4 bars, regardless of the concentration of CO2, and its contents are slowly vacated over a couple of minutes into the carbonation container.
- Set C2 consists of long-lasting injections of 100% CO2, with the goal of increasing the carbonation rate, ensuring that the carbonation depth reaches the inner cavity. Injection duration varies between 22 and 52 min.
- Set C3 is made of 100% CO2 injections, aimed at accessing the combined response of the sensors once the carbonation depth reaches the inner cavity.
2.2. Total Carbonation-Monitoring
The polished tip from a silica multimode fiber with a core diameter of 600 µm is embedded in cement paste with the aim of monitoring its color change due to carbonation. An optical fiber bundle in bifurcated (Y) cable of two 200 µm multimode fibers (Ocean Optics EOS-26488, Orlando, FL, USA) is used to transport light from a light-emitting diode (LED) (Roithner Lasertechnik, w54l5111p & b5b-433-b525, Vienna, Austria) into the embedded fiber and carry the light reflected at the cement paste to a spectrometer (Hamamatsu C12880MA, Shizuoka, Japan), as shown in Figure 5a.
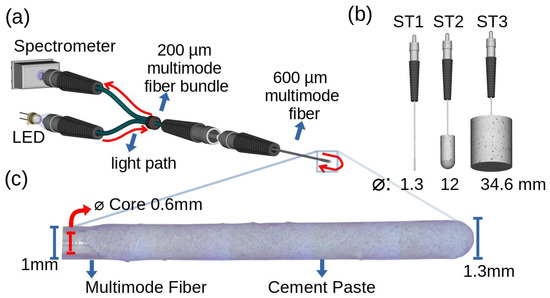
Figure 5.
(a) Total carbonation-monitoring setup. (b) Different types of cement paste samples used and their diameters. (c) Image of an ST1 sample, the smallest cement paste sample used in this work.
The total carbonation-monitoring setup exploits the change in cement paste color induced by its carbonation. Cement paste’s gray color is due to iron ore (black) used in cement production which taints cement’s color to be gray. The formation of CaCO3 (white) due to carbonation changes the cement paste’s color to a lighter tone of gray, and hence, it also changes its reflectivity. Thus, as the carbonation front travels through the fiber tip, the cement paste color changes to a lighter tone, increasing the amount of light being reflected to the fiber tip.
Cement paste samples of 0.5 w/c were produced using Portland limestone cement (CEM II/B-L, 32.5 N) with varying sizes, as shown in Figure 5b. The smallest-size samples, ST1, were produced by dipping the multimode fiber in cement after its mixing and placing it in a 100% RH chamber for 7 days. ST2 and ST3 samples were cured in casts with an embedded polished multimode fiber, sealed from the outside environment for 7 days.
Carbonation of cement paste is a slow phenomenon that takes years to occur in natural concentrations of CO2 (~400 ppm). In this study, the carbonation rate of ST3 samples was increased based on established protocols [12,45] using high concentrations of CO2 (100% CO2) and cycling between CO2-rich and -poor atmospheres. This oscillation of CO2 concentrations allows for the exhaust of water produced during the carbonation of cement paste. This water tends to accumulate in the capillary pores and obstruct subsequent carbonation [46]. ST1 and ST2 samples were optimized in terms of carbonation by setting the relative humidity in the carbonation chamber at 60% RH using a saturated salt solution of NaBr [47]. At a 100% CO2 concentration, the carbonation products differ from the naturally occurring ones [12]. For this reason, our sample is carbonated at the lower concentration of 3.2% of CO2, since the carbonation products at this CO2 concentration are found to be like those produced at ambient concentrations of CO2 (400 ppm), while still being fast to produce [48].
Table 2 displays the cement paste samples produced with an embedded multimode fiber, their name, type, concentration of CO2 (%CO2), and volume flow under which they were carbonated, as well as some observations, such as RH and whether the upper surface was sealed or not. The sealing of the upper surface of ST2 and ST3 samples is important, given the porous nature of cement paste that surrounds the optical fiber interstitial transition zone. Not sealing this surface creates a pathway for CO2 to carbonate the paste surrounding the fiber tip prematurely. Samples A–D are carbonated at 100% concentration of CO2 at a volume flow of 300 mL/min. Sample E is carbonated at 3.2% concentration of CO2 at a volume flow of 310 mL/min (300 mL/min of N2 and 10 mL/min of CO2). Moreover, sample F is carbonated at 100% concentration of CO2 at a volume flow of 10 mL/min.
Table 2.
Cement paste samples whose carbonation was monitored through cement paste reflectance in the total carbonation-monitoring setup and the parameters under which it occurred.
3. Results
3.1. Carbonation Depth-Monitoring
The inner and outer CO2 sensors’ response to the C1 injections, with concentrations of CO2 between 7 and 100%, is presented in Figure 6a. CO2 sensor 1 (the outer sensor)’s data are in blue, and CO2 sensor 2 (the inner sensor)’s data are in orange. The outer sensor is sensitive to the injections of CO2 and to CO2 consumption by the cement paste as it is carbonated. This consumption is shown in Figure 6b for a 20% CO2 injection made with the cement paste and a 25% CO2 injection without the cement paste sample. In contrast, the inner sensor exhibits no sensitivity to the CO2 atmospheres in the carbonation chamber. Instead, it displays a continuous signal increase even when no CO2 is being injected, as shown in the truncated sections of Figure 6a. CO2 sensor 2 (the inner sensor)’s intensity ratio keeps rising until the start of the 75% CO2 injections. The inner sensor remains stable for injections between CO2 concentrations of 75 and 100%, apart from the signal drops that the injections themselves cause. These signal losses are caused by the rise in temperature, as shown in Figure 6c, and the relative humidity due to the cement paste carbonation. These drops start at 50% CO2 and increase in magnitude with an increase in the CO2 concentration.
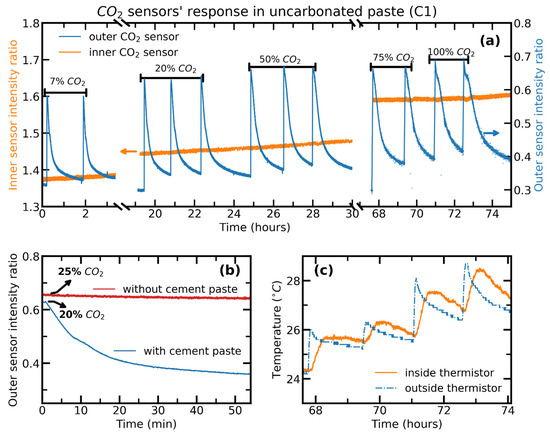
Figure 6.
(a) Inner and outer CO2 sensors’ response to two injections of 7% concentration of CO2, three injections of 20% CO2, three injections of 50% CO2, two injections of 75% CO2, and two injections of 100% CO2. (b) Influence of cement paste on the CO2 inside the container for an injection with a concentration of 20% CO2, measured with the outer sensor (CO2 sensor 1), compared with an injection with a concentration of 25% CO2 without cement paste. (c) Temperature variations during each of the CO2 injections with concentrations of 75 and 100%.
In the C2 injections, a more aggressive carbonation regime occurred, with a long period of injections at a 100% concentration of CO2. The response of both sensors during injection 6 is displayed in Figure 7a. The light intensity from the two LEDs in each of the sensors is displayed in Figure 7b,c. The temperature recorded inside and outside of the sample is shown in Figure 7d. The inner sensor has a pronounced loss of signal during the 27 min injection of 100% CO2, as shown in Figure 7c. This is the same phenomenon as the one shown in Figure 6a. The decreases in the intensity ratio are caused by a loss in signal at both wavelengths and are hence attributed to changes in the optical path of light caused by the buildup of water in the CO2 sensor and to the increase in temperature which also affects the sensors’ response. The buildup of temperature was higher on the inside by 6 °C, as shown in Figure 7d, which was something that had not previously occurred, as shown in Figure 6c. The outside was first to rise in temperature, denoting that the carbonation predominantly happened closer to the outer surface of the sample than its inner cavity.
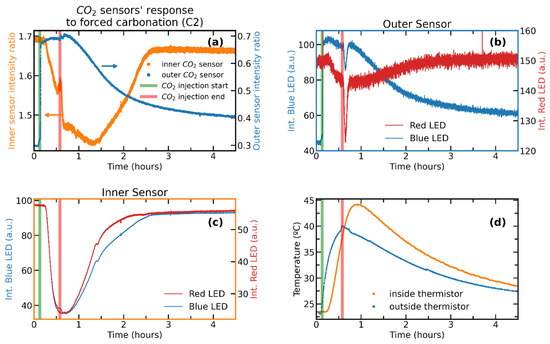
Figure 7.
(a) Inner and outer CO2 sensors’ response to 27 min of 100% CO2 concentration, injection 6, Table 1. (b) CO2 sensor 1’s (outer) red and blue LED intensities during injection 6. (c) CO2 sensor 2’s (inner) red and blue LED intensities. (d) Temperature increases inside and outside the cement paste sample for injection 6.
In C3, the injections of CO2 occur after the carbonation depth has reached the inner cavity. Both sensors respond to injections of CO2, as shown in Figure 8a,b, and there is a 90 s delay of the inner sensor relative to that of the outer sensor, as shown in Figure 8b. The signals denote that the carbonation occurs predominantly on the inside of the samples, with the inner sensor recording a larger consumption of CO2 than the outer one. Moreover, the CO2 consumption at a 100% CO2 concentration on the outside is significantly slower than that in C1, as shown in Figure 8c. This is due to the larger distance between the exterior wall and the carbonation front than between the inner cavity wall and the carbonation front, resulting in the increased availability of the material to be carbonated on the inside. This is confirmed through a phenolphthalein test of a fractured wall of the sample, as shown in Figure 8d.
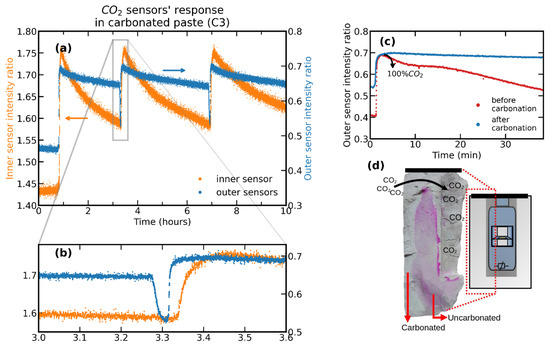
Figure 8.
(a) Inner and outer CO2 sensors’ response to 100% CO2 concentration after forced carbonation occurred; and (b) a close-up of these responses starting at 3 h. (c) Outer sensor’s response to 100% CO2 injections before and after carbonation. (d) Cross-section of the carbonated cement paste and the pathway of CO2 into the inner sensor cavity.
In Figure 8a,b, sharp dips can be seen in the outer sensor’s data, which are caused by the forced removal of the gases in the carbonation chamber through a vacuum pump. This purge did not affect the concentration of CO2 in the sample’s cavity, as seen in Figure 8b, indicating that no large cracks connect the inner cavity with the outside.
The stability of the setup was evaluated with injections of CO2 into the carbonation chamber, without the cement paste, at concentrations of 25, 50, and 100%. Both CO2 sensors responded to the injections, displaying four different levels of intensity ratios, one for ambient CO2 and one for each of the CO2 concentrations used, as shown in Figure 9a,b. The signal increase found in CO2 sensor 2 (the inner sensor) during set C1 of the injections was found to also occur for the third CO2 sensor embedded in cement paste at atmospheric CO2 concentrations, as shown in Figure 9d, but not for the outer CO2 sensor, as shown in Figure 9c. Thus, these CO2 sensors display a signal drift when they are embedded in cement paste while devoid of CO2; this is likely due to the cement paste shedding material onto the membrane, causing its signal to drift toward saturation, as shown in Figure 9d. This drift stops once high concentrations of CO2 reach the membrane, at which point it responds as expected, as shown in Figure 8a,b.
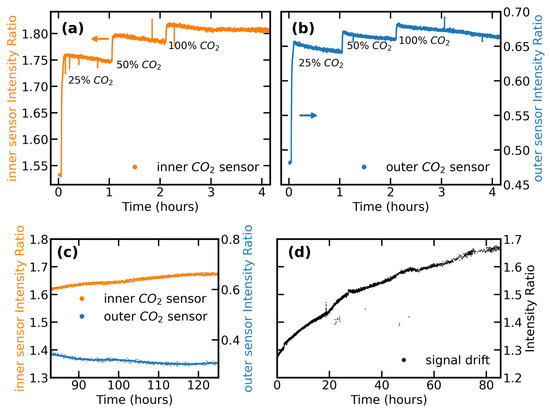
Figure 9.
Response of the CO2 sensors in a container into which different concentrations of CO2 were injected: (a) data from the inner sensor, and (b) data from the outer sensor. (c) Inner and outer sensors’ response in the following days after C1 injections of CO2. The inner sensor displays a signal increase, while the outer remains at a lower level, indicating that CO2 in the chamber has been consumed through cement paste carbonation. (d) CO2 sensor’s response inside of a cement paste sample at atmospheric CO2 concentration.
The signal drifts when embedded in cement paste, even at ambient concentrations of CO2, and the signal loss occurring under the adverse environment that forms inside the cement paste as a result of extended periods of forced carbonation at a 100% concentration of CO2 indicate that these are not the optimal scenarios for this setup. Still, the sensors used were robust enough to endure the high temperatures and %RH values that formed in the carbonation chamber, validating the working principle of the proposed setup: a setup wherein at least two separate CO2 sensors can be used in conjunction to monitor the moment the carbonation front reaches a given depth in the cement paste.
3.2. Total Carbonation-Monitoring
The carbonation of samples A (ST1—100% CO2 at 300 mL/min), E (ST1—3.2% CO2 at 310 mL/min), and F (ST1—100% CO2 at 10 mL/min) is presented in Figure 10. These results denote an increase in signal caused by the cement paste’s discoloration due to its carbonation, which increases the reflectance at the tip. After this increase, the obtained signal remains stable in the presence of CO2, indicating full carbonation has occurred for the cement paste in the vicinity of the fiber tip. The signal stability before the CO2 injection was monitored in sample A, while the carbonation of samples E and F took place four and seven minutes after the start of their monitoring, respectively. Sample A denotes a dip in signal that coincides with the start of the carbonation. This dip is caused by the accumulation of water at the fiber tip, which increases the refractive index in its vicinity, decreasing its reflectance, as shown in Figure 10a. This buildup of water occurs due to the high carbonation rate with 100% CO2 at a volume flow of 300 mL/min. By reducing the volume flow, but maintaining the concentration of CO2, the dip in intensity caused by the water released is mitigated in sample F, as shown in Figure 10a. The decrease in the volume flow to 10 mL/min is sufficient to allow the cement paste sample to exhaust the water outwards during its carbonation. Sample E, carbonated with 3.2% CO2 at a volume flow of 310 mL/min (10 mL/min of CO2 and 300 mL/min of N2), maintains the absence of the signal dip from water buildup, but has a slower rate of carbonation when compared with sample F, as shown in Figure 10b. This is due to the lower concentration of CO2 that reaches the sample. Ultimately, water slows down the carbonation of sample A, which takes longer than samples E and F despite its higher concentration of CO2 and volume flow, as shown in Figure 10. The signal increase at 3.2% CO2 is indicative that this setup could be used for the monitoring of the naturally occurring carbonation of cement paste.
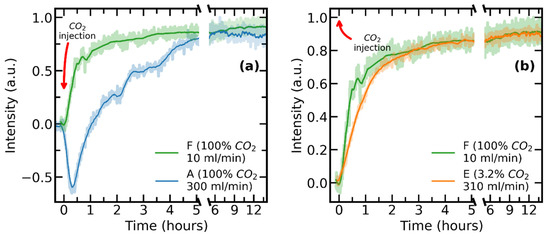
Figure 10.
(a) Carbonation of ST1 cement pastes samples at 100% CO2 with a volume flow of 300 mL/min (sample A) and at 100% CO2 with a volume flow of 10 mL/min (sample F). (b) Carbonation of ST1 samples at 100% CO2 with a volume flow of 10 mL/min (sample F) and at 3.2% CO2 with 300 mL/min of N2 and 10 mL/min of CO2 (sample E).
An increase in sample size is met with a longer dip from water buildup, as seen in Figure 11, for the 100% CO2 carbonation of samples A (ST1), B (ST2), and D (ST3) at a volume flow of 300 mL/min CO2. The water accumulation at the tip for the smaller samples, A and B, coincides with the start of their carbonation, while for sample D, several hours are required for it to start to occur. The larger size of sample D delays the water released from the carbonation occurring close to the sample’s surface from accumulating at the tip; the full process takes 60 h to occur.
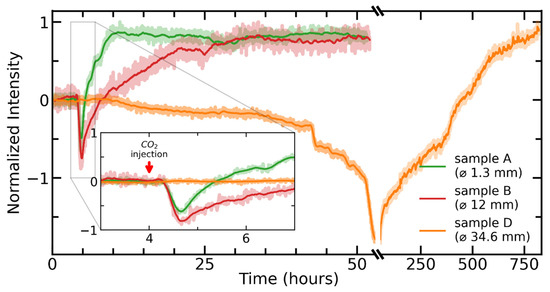
Figure 11.
Carbonation of cement paste samples at 100% CO2 for samples A (ST1), B (ST2), and D (ST3). The diameters in the labels include the multimode fiber at the center which has ⌀ 1 mm.
The larger-size samples also take longer for the signal increase to stabilize (at the end of the carbonation). Sample A was fully carbonated at the 10 h mark and sample B at the 30 h mark. Sample D took more than 750 h for its carbonation to occur.
The total carbonation-monitoring setup was previously employed to measure the durability of cement paste from water ingress [49]. Sample C was produced to study the cross-sensitivity between carbonation and water ingress/egress in terms of the reflection light intensity. Figure 12 denotes how carbonation influences the wet/dry light intensities of sample C. This measurement begins with the sample being saturated with water followed by its drying (as shown by the orange line of Figure 12). After drying, the reliability of the setup is displayed by the long-lasting stable signal during which the outside environment remains unchanged. This is followed by the forced carbonation of sample C, which induces a loss in intensity (water accumulation) followed by an intensity increase (cement paste carbonation).
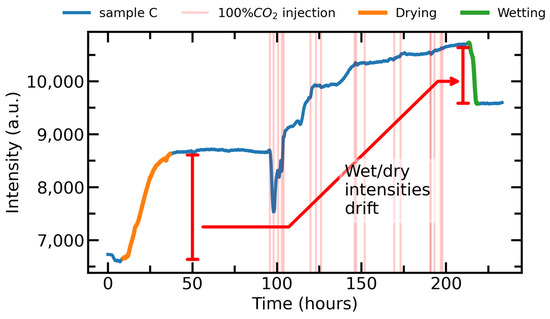
Figure 12.
Influence of carbonation in the wet/dry signal of sample C previously used to monitor cement paste durability [49].
The difference in the carbonation rate of both ST3 cement pastes (C and D) is caused by the sealing of sample D’s top surface and the exposed top surface of sample C. The interstitial transition zone between the optical fiber and the cement paste is a gateway for carbonation around the fiber tip, hence the importance of sealing the upper surface of the cement paste. After carbonation has occurred, the sample is submerged in water, causing a signal drop (as indicated by the green line in Figure 12). A new, higher-intensity value for wet cement is found. The carbonation is responsible for a drift in the wet/dry intensities, which does not impair the estimation of the cement paste’s durability via the capillary coefficient [49]. In this estimation, the maximum and minimum intensities are converted into distances across the diameter of the fiber tip core, discarding the need for calibrated fixed values of intensity. In the monitoring of carbonation, the emphasis is on finding the moment the signal starts to go above the dry signal intensity (the maximum value of intensity before the carbonation) and when it reaches a plateau (the end of carbonation). For high concentrations of CO2, a dip in signal, due to water accumulation, could also be monitored to denote the start of carbonation. The sensor can perform both tasks: the monitoring of cement paste durability from water ingress and the monitoring of cement paste carbonation.
Table 3 displays the signal increase in the cement paste’s reflection caused by the paste’s carbonation as well as the signal-to-noise ratio (SNR) of the data. The increase in signal is estimated relative to the reflection light intensity before the CO2 is injected into the chamber. The signal increase varies between 1.6 (sample A) and 18% (sample C) and the SNR between 55 (sample C) and 9 (sample B).
Table 3.
Cement paste samples’ reflection light intensity increase due to the formation of CaCO3 and the SNR recorded with the total carbonation-monitoring setup.
The phenolphthalein tests, as shown in Figure 13, on samples A, B, D, and E demonstrate that these are fully carbonated. Samples A, B, and E have pieces of cement paste produced from leftovers which are not carbonated; hence, all produce a strong dark pink color in the cement paste. Sample C is the only partially carbonated sample of cement paste, and there are several areas with a lighter tone of pink, namely around the place previously occupied by the optical fiber. This indicates that CO2 traveled inwards through the interstitial transition zone that exists between the optical fiber and the cement paste, causing the cement paste sample to carbonate prematurely.
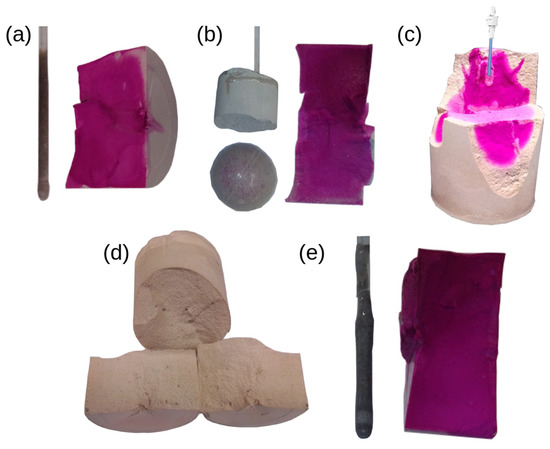
Figure 13.
(a,b) represent, respectively, a phenolphthalein test of samples A and B along with pieces of cement paste produced from the same batch. These extra cement paste samples were not carbonated. (c) Phenolphthalein test of sample C indicates the sample is partially carbonated, especially around the fiber where a lighter tone of pink is found. (d) Phenolphthalein test indicates sample D is fully carbonated. (e) Sample E and cement paste sample produced with leftover cement under phenolphthalein test.
4. Conclusions
A setup with two CO2 sensors was used to monitor the carbonation depth of cement paste. An embedded sensor remained unresponsive to the CO2 injections until the carbonation front reached the cavity into which it was placed. Once it was reached, the inner sensor began to respond to the CO2, indicating the time a given carbonation depth was reached. An exterior sensor monitored both the CO2 injections and CO2 consumption of the carbonation. The sensors showed resilience towards the increase in temperature and relative humidity from extended periods of forced carbonation, having continued to work after these periods, albeit gathering partial data. The inner sensors displayed a drift in signal while idle. This drift disappeared once high concentrations of CO2 were reached.
An embedded multimode fiber was successfully used to monitor the formation of CaCO3 during accelerated cement paste carbonation. The formation of CaCO3 discolored the cement paste, increasing the amount of signal that was being reflected back to the embedded fiber. The sensitivity of this sensor towards refractive index changes complemented the monitoring of the accelerated carbonation via observations of the water buildup in the capillary pores resulting from this process. The cross sensitivity with the water ingress and egress was positively evaluated, and the carbonation at a 3.2% CO2 concentration suggests it can monitor naturally occurring carbonation. Thus, a simple and inexpensive setup could be used for monitoring the water ingress as well as carbonation of cement paste.
Author Contributions
Conceptualization, P.M.d.S. and L.C.C.C.; methodology, P.M.d.S., J.P.M., L.C.C.C. and J.M.M.M.d.A.; software, P.M.d.S. and L.C.C.C.; formal analysis, P.M.d.S. and J.P.M.; resources, P.M.d.S., J.P.M. and L.C.C.C.; data curation, P.M.d.S.; writing—original draft preparation, P.M.d.S.; writing—review and editing, J.P.M., L.C.C.C. and J.M.M.M.d.A.; visualization, P.M.d.S., L.C.C.C. and J.M.M.M.d.A.; supervision, L.C.C.C. and J.M.M.M.d.A.; funding acquisition, L.C.C.C. and J.M.M.M.d.A. All authors have read and agreed to the published version of the manuscript.
Funding
This work was co-financed by Component 5—Capitalization and Business Innovation, integrated in the Resilience Dimension of the Recovery and Resilience Plan within the scope of the Recovery and Resilience Mechanism (MRR) of the European Union (EU), framed in the Next Generation EU, for the period 2021–2026, within project ATE, with reference 56. This work was also financed by National Funds through the Portuguese Funding Agency, FCT—Fundação para a Ciência e Tecnologia, within the PhD grants UI/BD152695/2022 and SFRH/BD130674/2017, and the research contract CEECIND/00471/2017.
Institutional Review Board Statement
Not applicable.
Informed Consent Statement
Not applicable.
Data Availability Statement
The data used in this work are available upon request.
Conflicts of Interest
The authors declare no conflict of interest.
References
- Aïtcin, P.-C. Cements of Yesterday and Today. Cem. Concr. Res. 2000, 30, 1349–1359. [Google Scholar] [CrossRef]
- de Brito, J.; Kurda, R. The Past and Future of Sustainable Concrete: A Critical Review and New Strategies on Cement-Based Materials. J. Clean. Prod. 2021, 281, 123558. [Google Scholar] [CrossRef]
- Wray, P. Straight Talk with Karen Scrivener on Cements, CO2 and Sustainable Development. Am. Ceram. Soc. Bull. 2012, 91, 47–50. [Google Scholar]
- van Oss, H.G. Background Facts and Issues Concerning Cement and Cement Data; United States Geological Survey: Reston, VA, USA, 2012.
- International Energy Agency. Global Cement Production, 2010–2019. Available online: https://www.iea.org/data-and-statistics/charts/global-cement-production-2010-2019 (accessed on 2 June 2023).
- Fernandez, A.; Leung, Y. Low-Carbon Transition in the Cement Industry; International Energy Agency: Paris, France, 2018; Available online: https://www.iea.org/reports/technology-roadmap-low-carbon-transition-in-the-cement-industry (accessed on 2 June 2023).
- Schneider, M. The Cement Industry on the Way to a Low-Carbon Future. Cem. Concr. Res. 2019, 124, 105792. [Google Scholar] [CrossRef]
- York, I.N.; Europe, I. Concrete Needs to Lose Its Colossal Carbon Footprint. Nature 2021, 597, 593–594. [Google Scholar] [CrossRef]
- Watts, J. Concrete: The Most Destructive Material on Earth. Guardian. 25 February 2019. Available online: https://www.theguardian.com/cities/2019/feb/25/concrete-the-most-destructive-material-on-earth (accessed on 2 June 2023).
- Darraj, N.; Bender, G. Carbon Neutral Energy Intensive Industries; UNECE: Geneva, Switzerland, 2022; Available online: https://unece.org/sustainable-energy/cleaner-electricity-systems/carbon-neutral-energy-intensive-industries (accessed on 2 June 2023).
- Pacheco-Torgal, F.; Melchers, R.E.; Shi, X.; De Belie, N.; Van Tittelboom, K.; Sáez, A. Eco-Efficient Repair and Rehabilitation of Concrete Infrastructures; Woodhead Publishing: Sawston, UK, 2017; ISBN 9780081021828. [Google Scholar]
- Šavija, B.; Luković, M. Carbonation of Cement Paste: Understanding, Challenges, and Opportunities. Constr. Build. Mater. 2016, 117, 285–301. [Google Scholar] [CrossRef]
- Taheri, S. A Review on Five Key Sensors for Monitoring of Concrete Structures. Constr. Build. Mater. 2019, 204, 492–509. [Google Scholar] [CrossRef]
- Mehta, P.K.; Monteiro, P.J.M. Concrete: Microstructure, Properties, and Materials, 4th ed.; McGraw-Hill Education: New York, NY, USA, 2014; ISBN 9780071797870. [Google Scholar]
- Behnood, A.; Van Tittelboom, K.; De Belie, N. Methods for Measuring PH in Concrete: A Review. Constr. Build. Mater. 2016, 105, 176–188. [Google Scholar] [CrossRef]
- Angst, U.M. Challenges and Opportunities in Corrosion of Steel in Concrete. Mater. Struct. 2018, 51, 4. [Google Scholar] [CrossRef]
- Chang, C.F.; Chen, J.W. The Experimental Investigation of Concrete Carbonation Depth. Cem. Concr. Res. 2006, 36, 1760–1767. [Google Scholar] [CrossRef]
- Plusquellec, G.; Geiker, M.R.; Lindgård, J.; Duchesne, J.; Fournier, B.; De Weerdt, K. Determination of the PH and the Free Alkali Metal Content in the Pore Solution of Concrete: Review and Experimental Comparison. Cem. Concr. Res. 2017, 96, 13–26. [Google Scholar] [CrossRef]
- Li, L.; Sagüés, A.A.; Poor, N. In Situ Leaching Investigation of PH and Nitrite Concentration in Concrete Pore Solution. Cem. Concr. Res. 1999, 29, 315–321. [Google Scholar] [CrossRef]
- Cyr, M.; Rivard, P.; Labrecque, F.; Daidié, A. High-Pressure Device for Fluid Extraction from Porous Materials: Application to Cement-Based Materials. J. Am. Ceram. Soc. 2008, 91, 2653–2658. [Google Scholar] [CrossRef]
- Vollpracht, A.; Lothenbach, B.; Snellings, R.; Haufe, J. The Pore Solution of Blended Cements: A Review. Mater. Struct. 2016, 49, 3341–3367. [Google Scholar] [CrossRef]
- Bates, R.G.; Vijh, A.K. Determination of PH: Theory and Practice; Wiley: New York, NY, USA, 1973; Volume 120, ISBN 0-471-05647-2. [Google Scholar]
- Wang, M.; Yao, S.; Madou, M. A Long-Term Stable Iridium Oxide PH Electrode. Sens. Actuators B Chem. 2002, 81, 313–315. [Google Scholar] [CrossRef]
- Seguí Femenias, Y.; Angst, U.; Elsener, B. Monitoring PH in Corrosion Engineering by Means of Thermally Produced Iridium Oxide Electrodes. Mater. Corros. 2018, 69, 76–88. [Google Scholar] [CrossRef]
- Dong, S.-G.; Lin, C.-J.; Hu, R.-G.; Li, L.-Q.; Du, R.-G. Effective Monitoring of Corrosion in Reinforcing Steel in Concrete Constructions by a Multifunctional Sensor. Electrochim. Acta 2011, 56, 1881–1888. [Google Scholar] [CrossRef]
- Du, R.-G.; Hu, R.-G.; Huang, R.-S.; Lin, C.-J. In Situ Measurement of Cl–Concentrations and PH at the Reinforcing Steel/Concrete Interface by Combination Sensors. Anal. Chem. 2006, 78, 3179–3185. [Google Scholar] [CrossRef] [PubMed]
- Fan, L.; Shi, X. Techniques of Corrosion Monitoring of Steel Rebar in Reinforced Concrete Structures: A Review. Struct. Health Monit. 2022, 21, 1879–1905. [Google Scholar] [CrossRef]
- Pfeifer, D.; Klimant, I.; Borisov, S.M. Ultrabright Red-Emitting Photostable Perylene Bisimide Dyes: New Indicators for Ratiometric Sensing of High PH or Carbon Dioxide. Chem. A Eur. J. 2018, 24, 10711–10720. [Google Scholar] [CrossRef] [PubMed]
- Staudinger, C.; Breininger, J.; Klimant, I.; Borisov, S.M. Near-Infrared Fluorescent Aza-BODIPY Dyes for Sensing and Imaging of PH from the Neutral to Highly Alkaline Range. Analyst 2019, 144, 2393–2402. [Google Scholar] [CrossRef] [PubMed]
- Nguyen, T.H.; Venugopala, T.; Chen, S.; Sun, T.; Grattan, K.T.V.; Taylor, S.E.; Basheer, P.A.M.; Long, A.E. Fluorescence Based Fibre Optic PH Sensor for the PH 10–13 Range Suitable for Corrosion Monitoring in Concrete Structures. Sens. Actuators B Chem. 2014, 191, 498–507. [Google Scholar] [CrossRef]
- Nguyen, T.H.; Sun, T.; Grattan, K.T.V. Novel Coumarin-Based PH Sensitive Fluorescent Probes for the Highly Alkaline PH Region. Dye. Pigment. 2020, 177, 108312. [Google Scholar] [CrossRef]
- Srinivasan, R.; Phillips, T.E.; Bargeron, C.B.; Carlson, M.A.; Schemm, E.R.; Saffarian, H.M. Embedded Micro-Sensor for Monitoring PH in Concrete Structures. Proc. SPIE 2000, 3988, 40–44. [Google Scholar]
- Xie, W.; Sun, T.; Grattan, K.T.; McPolin, D.; Basheer, P.A.M.; Long, A.E. Fibre Optic Chemical Sensor Systems for Internal Concrete Condition Monitoring. Proc. SPIE 2004, 5502, 334–337. [Google Scholar]
- Bartelmess, J.; Zimmek, D.; Bartholmai, M.; Strangfeld, C.; Schäferling, M. Fibre Optic Ratiometric Fluorescence PH Sensor for Monitoring Corrosion in Concrete. Analyst 2020, 145, 2111–2117. [Google Scholar] [CrossRef] [PubMed]
- Basheer, M.P.; Grattan, K.T.V.; Sun, T.; Long, A.E.; McPolin, D.; Xie, W. Fiber Optic Chemical Sensor Systems for Monitoring PH Changes in Concrete. Proc. SPIE 2004, 5586, 144–153. [Google Scholar]
- Dantan, N.; Habel, W.R.; Wolfbeis, O.S. Fiber Optic PH Sensor for Early Detection of Danger of Corrosion in Steel-Reinforced Concrete Structures. Proc. SPIE 2005, 5758, 274–284. [Google Scholar]
- Tariq, A.; Baydoun, J.; Remy, C.; Ghasemi, R.; Lefevre, J.P.; Mongin, C.; Dauzères, A.; Leray, I. Fluorescent Molecular Probe Based Optical Fiber Sensor Dedicated to PH Measurement of Concrete. Sens. Actuators B Chem. 2021, 327, 128906. [Google Scholar] [CrossRef]
- Galan, I.; Müller, B.; Briendl, L.G.; Mittermayr, F.; Mayr, T.; Dietzel, M.; Grengg, C. Continuous Optical In-Situ PH Monitoring during Early Hydration of Cementitious Materials. Cem. Concr. Res. 2021, 150, 106584. [Google Scholar] [CrossRef]
- Inserra, B.; Hayashi, K.; Marchisio, A.; Tulliani, J.-M. Sol–Gel-Entrapped PH Indicator for Monitoring PH Variations in Cementitious Materials. J. Appl. Biomater. Funct. Mater. 2020, 18, 228080002093654. [Google Scholar] [CrossRef] [PubMed]
- Jeong, H.; Jung, B.J.; Kim, J.H.; Seo, S.-Y.; Yun, H.; Kim, K.S. Development and Assessment of Nile Blue-Immobilized PH Sensor to Monitor the Early Stage of Concrete Carbonation. J. Build. Eng. 2022, 62, 105319. [Google Scholar] [CrossRef]
- Mendes, J.P.; Coelho, L.; Kovacs, B.; de Almeida, J.M.M.M.; Pereira, C.M.; Jorge, P.A.S.; Borges, M.T. Dissolved Carbon Dioxide Sensing Platform for Freshwater and Saline Water Applications: Characterization and Validation in Aquaculture Environments. Sensors 2019, 19, 5513. [Google Scholar] [CrossRef] [PubMed]
- Taylor, P.C. Curing Concrete; CRC Press: Boca Raton, FL, USA, 2013; ISBN 9780203866139. [Google Scholar]
- American Concrete Institute. ACI Committee 308, Guide to External Curing of Concrete; American Concrete Institute: Farmington Hills, MI, USA, 2016; Available online: https://www.concrete.org/portals/0/files/pdf/previews/308r_16_preview.pdf (accessed on 2 June 2023).
- Maestro CEM II/B-L 32,5N Cimento Portland de Calcário. Available online: https://www.secil.pt/pt/produtos/cimento/cimento-cinzento/maestro-cem-ii-b-l-32-5n (accessed on 2 June 2023).
- Fernández Bertos, M.; Simons, S.J.R.; Hills, C.D.; Carey, P.J. A Review of Accelerated Carbonation Technology in the Treatment of Cement-Based Materials and Sequestration of CO2. J. Hazard. Mater. 2004, 112, 193–205. [Google Scholar] [CrossRef] [PubMed]
- Phung, Q.T.; Maes, N.; Jacques, D.; Bruneel, E.; Van Driessche, I.; Ye, G.; De Schutter, G. Effect of Limestone Fillers on Microstructure and Permeability Due to Carbonation of Cement Pastes under Controlled CO2 Pressure Conditions. Constr. Build. Mater. 2015, 82, 376–390. [Google Scholar] [CrossRef]
- Greenspan, L. Humidity Fixed Points of Binary Saturated Aqueous Solutions. J. Res. Natl. Bur. Stand. Sect. A Phys. Chem. 1977, 81, 89–96. [Google Scholar] [CrossRef]
- Castellote, M.; Fernandez, L.; Andrade, C.; Alonso, C. Chemical Changes and Phase Analysis of OPC Pastes Carbonated at Different CO2 Concentrations. Mater. Struct./Mater. Constr. 2009, 42, 515–525. [Google Scholar] [CrossRef]
- da Silva, P.M.; Coelho, L.C.C.; de Almeida, J.M.M.M. Single Fiber Reflectance Spectroscopy for the Monitoring of Cement Paste. Chemosensors 2021, 9, 312. [Google Scholar] [CrossRef]


Disclaimer/Publisher’s Note: The statements, opinions and data contained in all publications are solely those of the individual author(s) and contributor(s) and not of MDPI and/or the editor(s). MDPI and/or the editor(s) disclaim responsibility for any injury to people or property resulting from any ideas, methods, instructions or products referred to in the content. |
© 2023 by the authors. Licensee MDPI, Basel, Switzerland. This article is an open access article distributed under the terms and conditions of the Creative Commons Attribution (CC BY) license (https://creativecommons.org/licenses/by/4.0/).