Article

Investigation of the Synergistic Effect of Layer-by-Layer Films of Carbon Nanotubes and Polypyrrole on a Flexible Electrochemical Device for Paraquat Sensing

by
Stefanny F. Amaro
1,
Cristiane C. Maciel
2,
Jéssica S. Rodrigues
1,
Amanda de S. M. de Freitas
3,
Lucas V. B. V. Fré
1,
Anerise de Barros
4 and
Marystela Ferreira
1,*
1
Center of Science and Technology for Sustainability (CCTS), Federal University of São Carlos (UFSCar), Sorocaba 18052-780, SP, Brazil
2
Postgraduate Program in Materials Science and Technology—POSMAT, São Paulo State University Júlio de Mesquita Filho (UNESP), Sorocaba 17033-360, SP, Brazil
3
Institute of Science and Technology (ICT), Federal University of São Paulo (UNIFESP), São José do Campos 12231-280, SP, Brazil
4
Department of Inorganic Chemistry, Institute of Chemistry, State University of Campinas (UNICAMP), Campinas 13083-970, SP, Brazil
*
Author to whom correspondence should be addressed.
Chemosensors 2023, 11(8), 420; https://doi.org/10.3390/chemosensors11080420
Submission received: 20 June 2023 / Revised: 13 July 2023 / Accepted: 18 July 2023 / Published: 26 July 2023
(This article belongs to the Special Issue Developments on Supramolecular Thin Films to Sensing Applications)

Abstract

:
This research aims to study flexible sensors based on a poly(butylene adipate-co-terephthalate) (PBAT) biodegradable polymer and graphite. Sensors were modified through the layer-by-layer (LbL) technique to improve their electrochemical behavior for paraquat (PQ) detection. Nanostructured films were obtained by alternating layers of anionic and cationic materials, carbon nanotubes (CNTs), and polypyrrole (PPY), respectively. The devices, with and without modification, were characterized by contact angle, scanning electron microscopy (SEM), and Fourier transform infrared spectroscopy (FTIR). Electrochemical characterization was labeled via cyclic voltammetry (CV) and electrochemical impedance spectroscopy (EIS). PQ molecules were detected using the differential pulse voltammetry (DPV) technique in a concentration range of 0.1 to 2.1 µM. The sensor detection limit (LOD) was obtained using the analytical curve, with it being equal to 0.073 µM. The LbL film gPBAT(PPY/CNT)n sensor showed good stability, reproducibility, and repeatability, with recovery values ranging from 99.4% to 109.3% for PQ when the analyzed samples were contaminated with tap water. The produced electrodes have the advantage of being flexible, disposable, reproducible, and of low manufacturing cost, which makes them attractive for portable environmental analysis.

1. Introduction

Composites based on biodegradable polymers and carbon-containing materials—such as graphite—are an interesting alternative in the field of sensors due to their mechanical, electrical, and thermal characteristics [1,2]. Nanocomposites manufactured using the layer-by-layer (LbL) technique are commonly applied to modify the sensors’ surface, making the device more attractive. Through this technique, it is possible to obtain ultrathin films with organized structures and properties on the molecular scale of the materials, whose deposition is independent of the substrate’s nature, size, or topology [3,4].
When choosing materials in sensing, the main points are mainly related to their intrinsic properties, cost, and type of desired application. Thus, conducting polymers have attracted great interest due to their high specific capacitance, easy synthesis, good stability, and low cost [5,6]. In the case of carbon nanotubes (CNTs), research interest in these materials stems from their high surface area; surface pendant bonds, which are favorable for interfacial polarization; multiple scattering; and good electrical conductivity [7,8]. There are two types of CNTs: single-walled carbon nanotubes (SWCNTs) and multi-walled carbon nanotubes (MWCNTs). The difference between them is basically related to the diameter: SWCNTs have a diameter between 1 and 2 nm, while MWCNTs are between 50 and 90 nm in diameter [9]. In this work, we used MWCNTs, showing that a fully flexible and biodegradable polymer and graphite-based composite sensor was able to reproduce improvements, with the surface modified from functionalized carbon nanotubes and PPY.
The organic material combination of two classes—conductive polymers and CNTs—results in a new material called a nanocomposite, which has stood out in recent years as it presents physicochemical properties of great interest, and it can be used in the manufacture of several devices [10]. The polymeric base is a fossil-originated biodegradable material, a co-polyester called poly(butylene adipate-co-terephthalate) (PBAT), with it being flexible and having good thermal and mechanical properties at room temperature [11,12,13]. LbL films from polypyrrole (PPY) and carbon nanotubes (CNTs) are intended for applications in electrochemical sensing for paraquat (1,1′-dimethyl-4,4′-bipyridinium), an herbicide for weed control in agriculture, which is highly toxic to humans and animals and able to cause damage to liver, respiratory, and cardiac function [14,15,16]. The interaction between PPY and CNTs during ultrathin film fabrication favors a synergy of properties aimed at improved stability, sensitivity, and charge storage, which are indispensable in sensing. Thus, this work seeks to optimize the fabrication of a nanostructured film using characterization techniques and the verification of the efficiency of the nanocomposite in paraquat detection.
The authors have described in other manuscripts the application of the polymeric material PBAT together with carbon materials for the electrochemical detection of heavy metals and hydroquinone and the simultaneous detection of paraquat and catechol [11,13,17], as well as for the characterization of these electrodes. The purpose of this study is to test the conductivity of a material as a conductor, whether modified or non-modified, in order to produce a sensor or biosensor. In addition, LbL nanostructured films were used to modify the surface of the electrodes and, subsequently, prove the effectiveness of the synergy between the materials used as the electrochemical sensor. Therefore, the present work proposes the fabrication of low-cost sensors with their surface modified by LbL films combining carbon nanotubes and PPY, which are later applied as electrochemical sensors for the detection of an environmental pollutant, paraquat, in tap water. Fourier transform spectroscopy (FTIR), scanning electron microscopy (SEM), and contact angle were used to characterize the materials. This is also a study related to the electrochemical properties of the sensor through the analysis of cyclic voltammetry (CV) and electrochemical impedance spectroscopy (EIS). For the simultaneous detection of paraquat, the authors used differential pulse voltammetry (DPV). The sensor proved efficient, in terms of stability and reproducibility, in detecting the analyte after being subjected to a tap water sample containing paraquat.

2. Materials and Methods

2.1. Materials

The applied materials for sensor synthesis were PBAT, synthetic graphite powder (<20 μm, assay 99%), and sulfuric and nitric acids (Synth). The carbon nanotube, multi-walled, 50–90 nm in diameter, >95% carbon basis, was purchased from Aldrich Chemistry, and the PPY was purchased from Sigma-Aldrich (St. Louis, MO, USA). For detection, paraquat (PQ) was purchased from Sigma-Aldrich. The experiments were performed by adding possible interferents to evaluate the selectivity of the proposed gPBAT(PPY/CNT)n electrode; these were hydroquinone (HQ), methyl parathion, and carbofuran, purchased from Vetec, Sigma-Aldrich, and Aldrich Chemistry, respectively. The solutions used in this work were all prepared with ultrapure water (Sartorius Weighing Technology, Göttingen, Germany) and a resistivity of 18.2 MΩ cm at 25 °C.

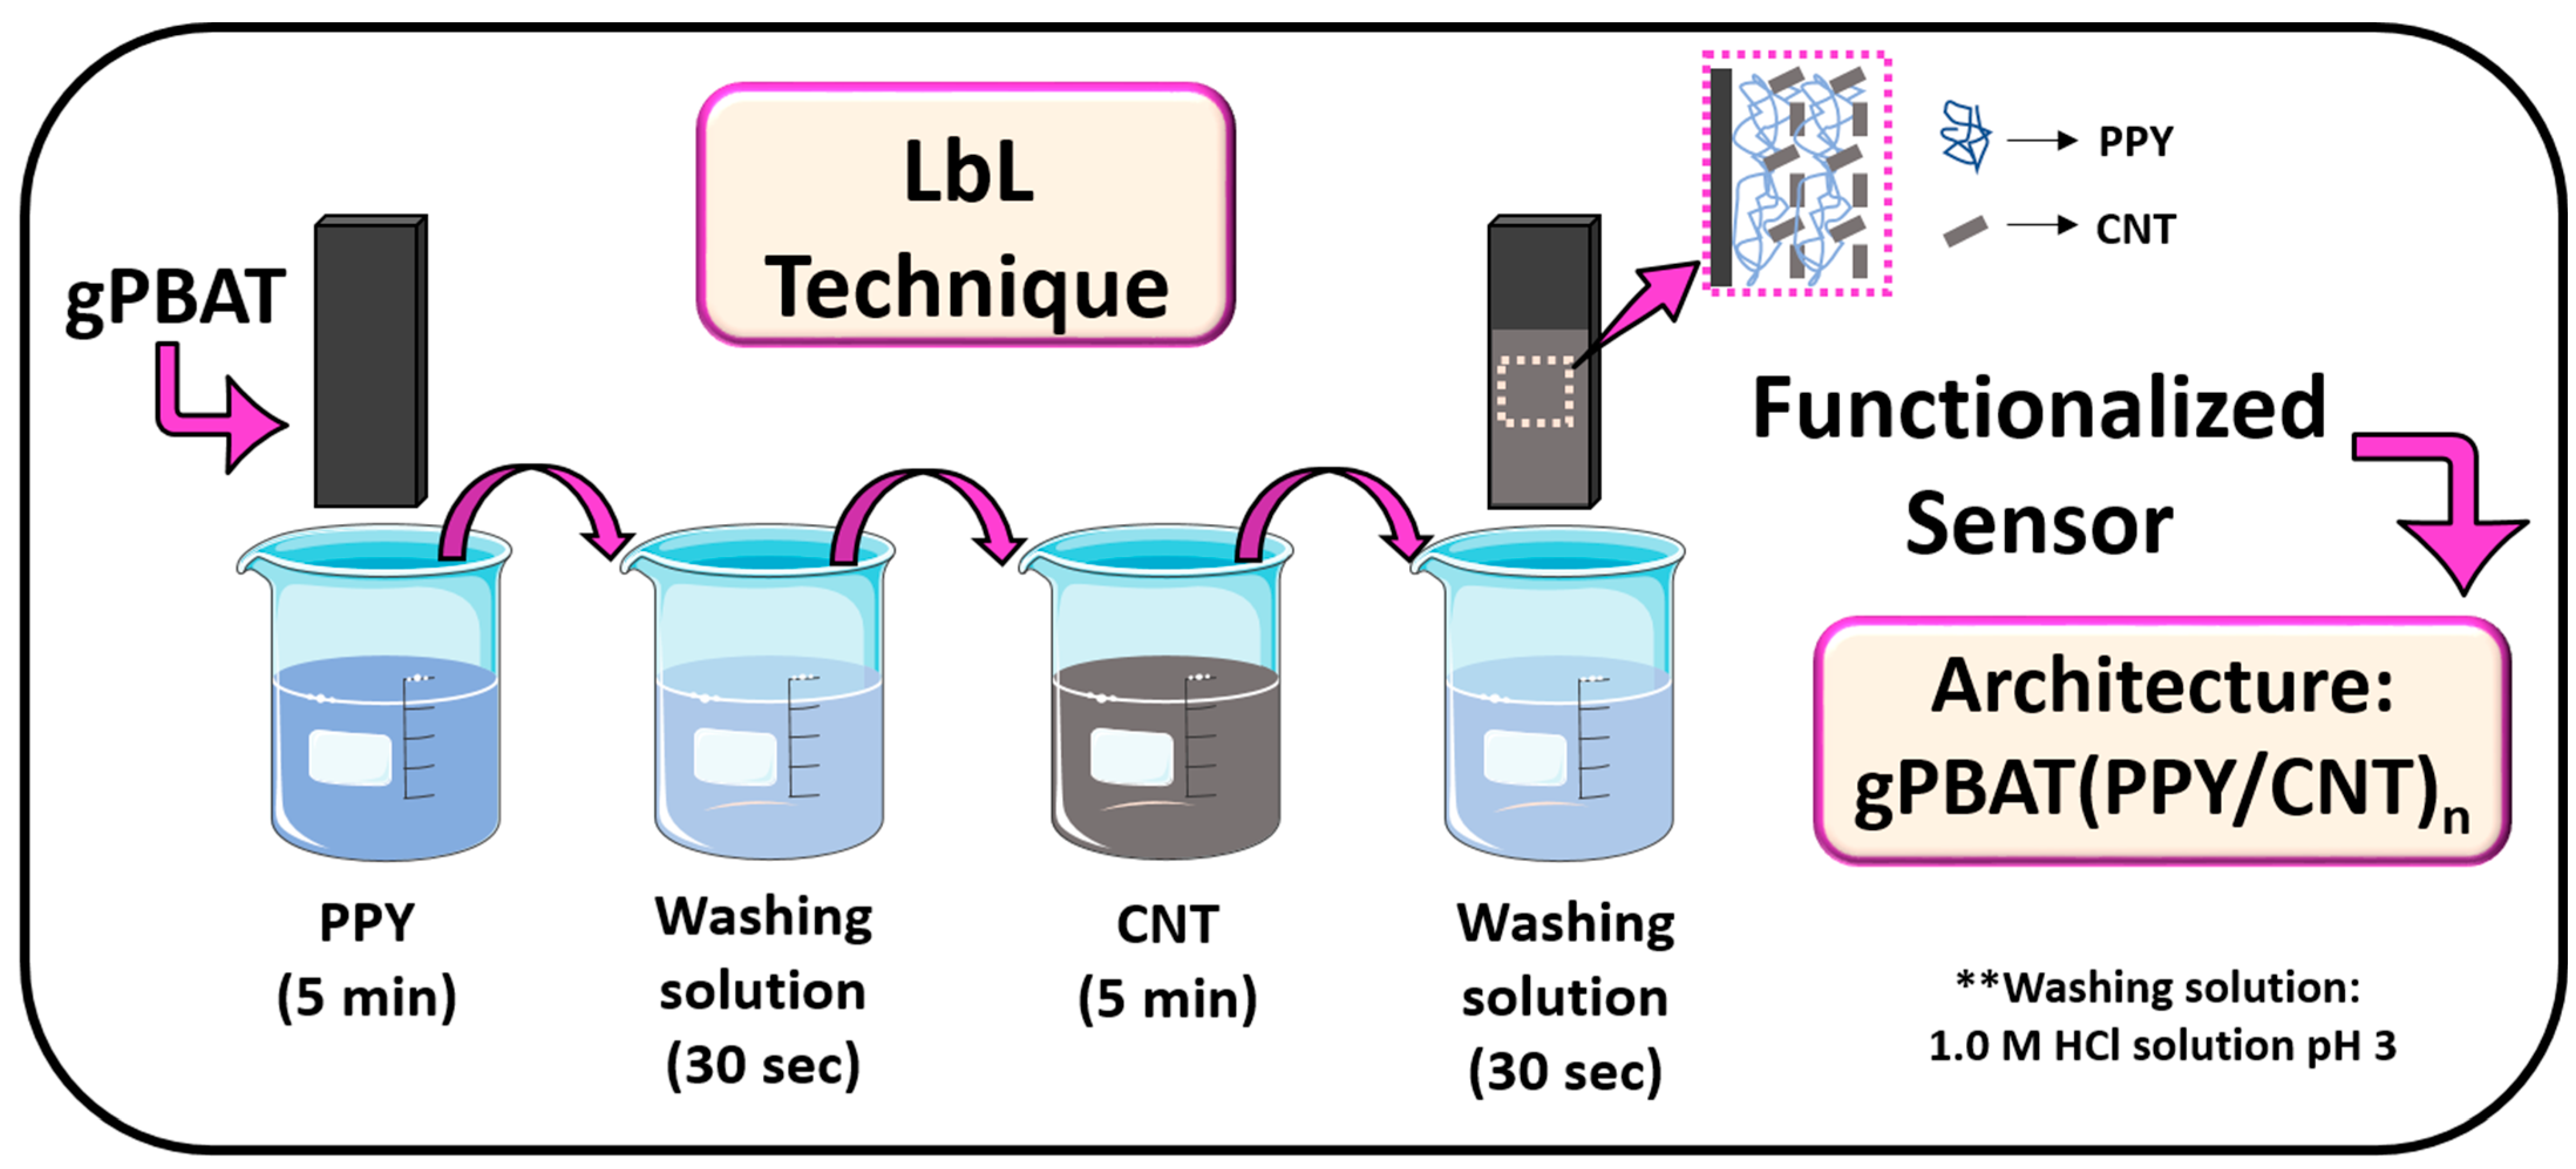
2.2. CNT Synthesis and Functionalization of the gPBAT

The chemical functionalization of the CNT was performed through acidic oxidation treatment, where 20 mg of CNT was diluted in a solution of concentrated sulfuric and nitric acids (H2SO4 and HNO3, respectively) in a ratio of 3:1 (v/v). The solution was kept in ultrasound at a temperature between 60 and 80 °C for a period of 24 h. Subsequently, the CNT was neutralized to pH around 6.0 via successive washing procedures with ultrapure water, followed by centrifugation and removal of the supernatant solution. The precipitate was oven-dried at 90 °C for 2 h, resulting in a black powder [18].
For electrode fabrication, the gPBAT substrate was produced by mixing in 7:3 proportion (graphite–PBAT) in 10 mL of chloroform and then subjected to solvent evaporation. The process was based on the work developed by Maciel et al. (2022) [10]. Electrode modification was performed using LbL assembly: Cationic and anionic HCl solutions (pH 3.0) of PPY and CNT were prepared at a concentration of 0.1 mg mL−1 and 0.01 mg mL−1, respectively. Figure 1 illustrates the procedure for the fabrication of LbL gPBAT(PPY/CNT)n architecture, in which n indicates the number of bilayers deposited for each supramolecular architecture. To perform the LbL technique, the gPBAT substrate was immersed in the cationic PPY solution for 5 min and then washed (to remove weakly adsorbed material and to avoid cross-contamination) via immersion in the HCl solution (pH 3.0) for 30 s. Subsequently, the substrate was immersed in the anionic CNT solution for 5 min and washed again to remove excess non-adsorbed material. Thus, this process was repeated n times, n being the number of bilayers. Furthermore, an architectural study was carried out with other polyelectrolytes (Poly(vinyl sulfonate) (PVS) and Poly(ethyleneimine) (PEI)) to verify the difference between films with and without CNT for the detection of hydroquinone. The different LbL architectures and conditions for film fabrication are described in Table 1.

2.3. Physical Characterizations

Using the technique of sessile drop in a Ramé Hart goniometer (model 100-00) with deionized water, the wettability of gPBAT and gPBAT(PPY/CNT)20 LbL films was measured. Briefly, the process consists of depositing three drops of liquid at different points on the surface, each resulting in 10 contact angle measurements. The results corresponded to an average of 30 measurements.
A morphological characterization study was performed in a scanning electron Microscope (SEM-FEG), model FEI Quanta 250 FEG (FEI Co., Hillsboro, OR, USA), with a voltage acceleration of 2 kV in a tungsten filament. Afterward, the samples were covered with a thin iridium film using a metallizer model MED020 Baltec. Using the Nicolet Summit IR 200 FT-IR model, the structural characterization of gPBAT films was in reflectance mode, using 126 scans, nominal resolution of 4.0 cm−1, in a range of 4000 to 400 cm−1. The spectra were obtained with Paradigma Ominic (Thermo Scientific, Waltham, MA, USA) and using Origin Pro 8.0. A Horiba Jobin Yvon T64000 Raman spectrometer and an Olympus BX41 microscope were used to perform the measurements. The samples were characterized using an incident excitation radiation of wavelength equal to 633 nm from a He-Ne laser, via 20 s exposure, 2 accumulations, in 1800 grating, and using an objective of 50xLWD. The zeta potential analysis was performed with an electrokinetic analyzer (SurPASS 3, Anton Paar, GmbH, Graz, Austria). Following the equipment requirement, the nanostructured films were deposited on a 21 cm² glass substrate. In addition, 0.1 M KCl solutions were used as electrolytes, at room temperature at pH 7.

2.4. Electrochemical Measurements

All experiments were carried out in an Autolab PGSTAT30 (Eco Chemie, Utrecht, The Netherlands) galvanostatic/potentiostat, using a three-electrode electrochemical cell comprising a reference Ag/AgCl electrode (3 M KCl), a platinum auxiliary 1.0 cm2 electrode, and gPBAT(PPY/CNT)n LbL film as the working electrode, which was adequately glued on a glass support, consequently insulating one side of the electrode.
Electrochemical characterizations were performed in the presence of 5.0 mM Fe(CN)6−3/−4 containing 0.1 M KCl as a supporting electrolyte via CV (scan rate of 50 mV·s−1 and potential range of −0.2 V to 0.6 V) and EIS (frequency range of 1 × 10⁵ Hz to 0.1 Hz and amplitude of 10 mV). The DPV technique was used to detect analytes over a potential range of −0.80 to 0.0 V and a scan rate of 50 mV·s−1, in 0.1 M PBS buffer. In addition, different analytes were studied to verify the sensor’s selectivity with the individual addition of hydroquinone, methyl parathion, and carbofuran (0.50 mM in 0.1 M PBS buffer) as possible interfering species.

3. Results and Discussion

3.1. Study of Architecture and Bilayer

The determined architecture in the present work was n = 5, where n indicates the number of deposited bilayers. Consequently, the architectures were named gPBAT(PPY/CNT)5, gPBAT(PEI/CNT)5, and gPBAT(PVS/PPY)5. The architectures were built on a gPBAT substrate, immersed in suspensions of opposite charges to build alternating layers. The LbL films were electrochemically characterized using CV and EIS techniques, and the analyses were performed in a standard redox probe solution of potassium hexacyanoferrate (Fe(CN)6−3/−4), with a concentration equal to 5 × 10⁻³ M in 0.1 M KCl. It was possible to verify that the obtained gPBAT(PPY/CNT)5, gPBAT(PEI/CNT)5, and gPBAT(PVS/PPY)5 architectures had a current density (J) values equal to 1.03 ± 4.94 × 10⁻² (Figure 2A), 0.63 ± 3.81 × 10⁻² (Figure 2C), and 0.13 ± 2.75 × 10⁻² (Figure 2E) mA/cm², respectively.
The values of the charge transfer resistance (Rct), following the same order, were 0.93 ± 0.04 (Figure 2B), 1.31 ± 0.06 (Figure 2D), and 1.52 ± 0.05 (Figure 2F) (KΩ cm2). The results reveal that the gPBAT(PPY/CNT)5 LbL architecture had an improved and well-defined redox response compared with the other architectures investigated. This is attributed to the synergistic effect between the PPY and the functionalized CNT, facilitating the oxidative process between the electrode surface and the electrolyte solution. This architecture significantly improved the electron transfer rate compared with gPBAT(PEI/CNT)5 and gPBAT(PVS/PPY)5 electrodes.
After the architectural study, the bilayer numbers were studied for all architectures for comparison purposes. It is seen from Figure 2A that the gPBAT(PPY/CNT)7 architecture showed higher current density and lower Rct value for the seven bilayers (1.41 ± 7.07 × 10⁻² mA/cm2 and 0.16 ± 0.02 KΩ cm2) than the three-bilayer films (0.42 × 10⁻⁴ ± 3.25 × 10⁻² mA/cm2), five-bilayer films (1.03 ± 5.65 × 10⁻² mA/cm²), and ten-bilayer films (0.28 ± 3.60 × 10⁻² mA/cm2). These results corroborate the Rct values obtained in Nyquist plots, which are 0.79 ± 0.05, 0.25 ± 0.03, and 0.88 ± 0.05 (KΩ cm2). As the number of layers increased, the extent of electron transport decreased, which is directly related to the double electrical layers formed on the film surface, turning it more resistant. Therefore, the results show that seven bilayers were enough to improve the surface area of the gPBAT(PPY/CNT)7 electrode, which demonstrated higher J and lower Rct.

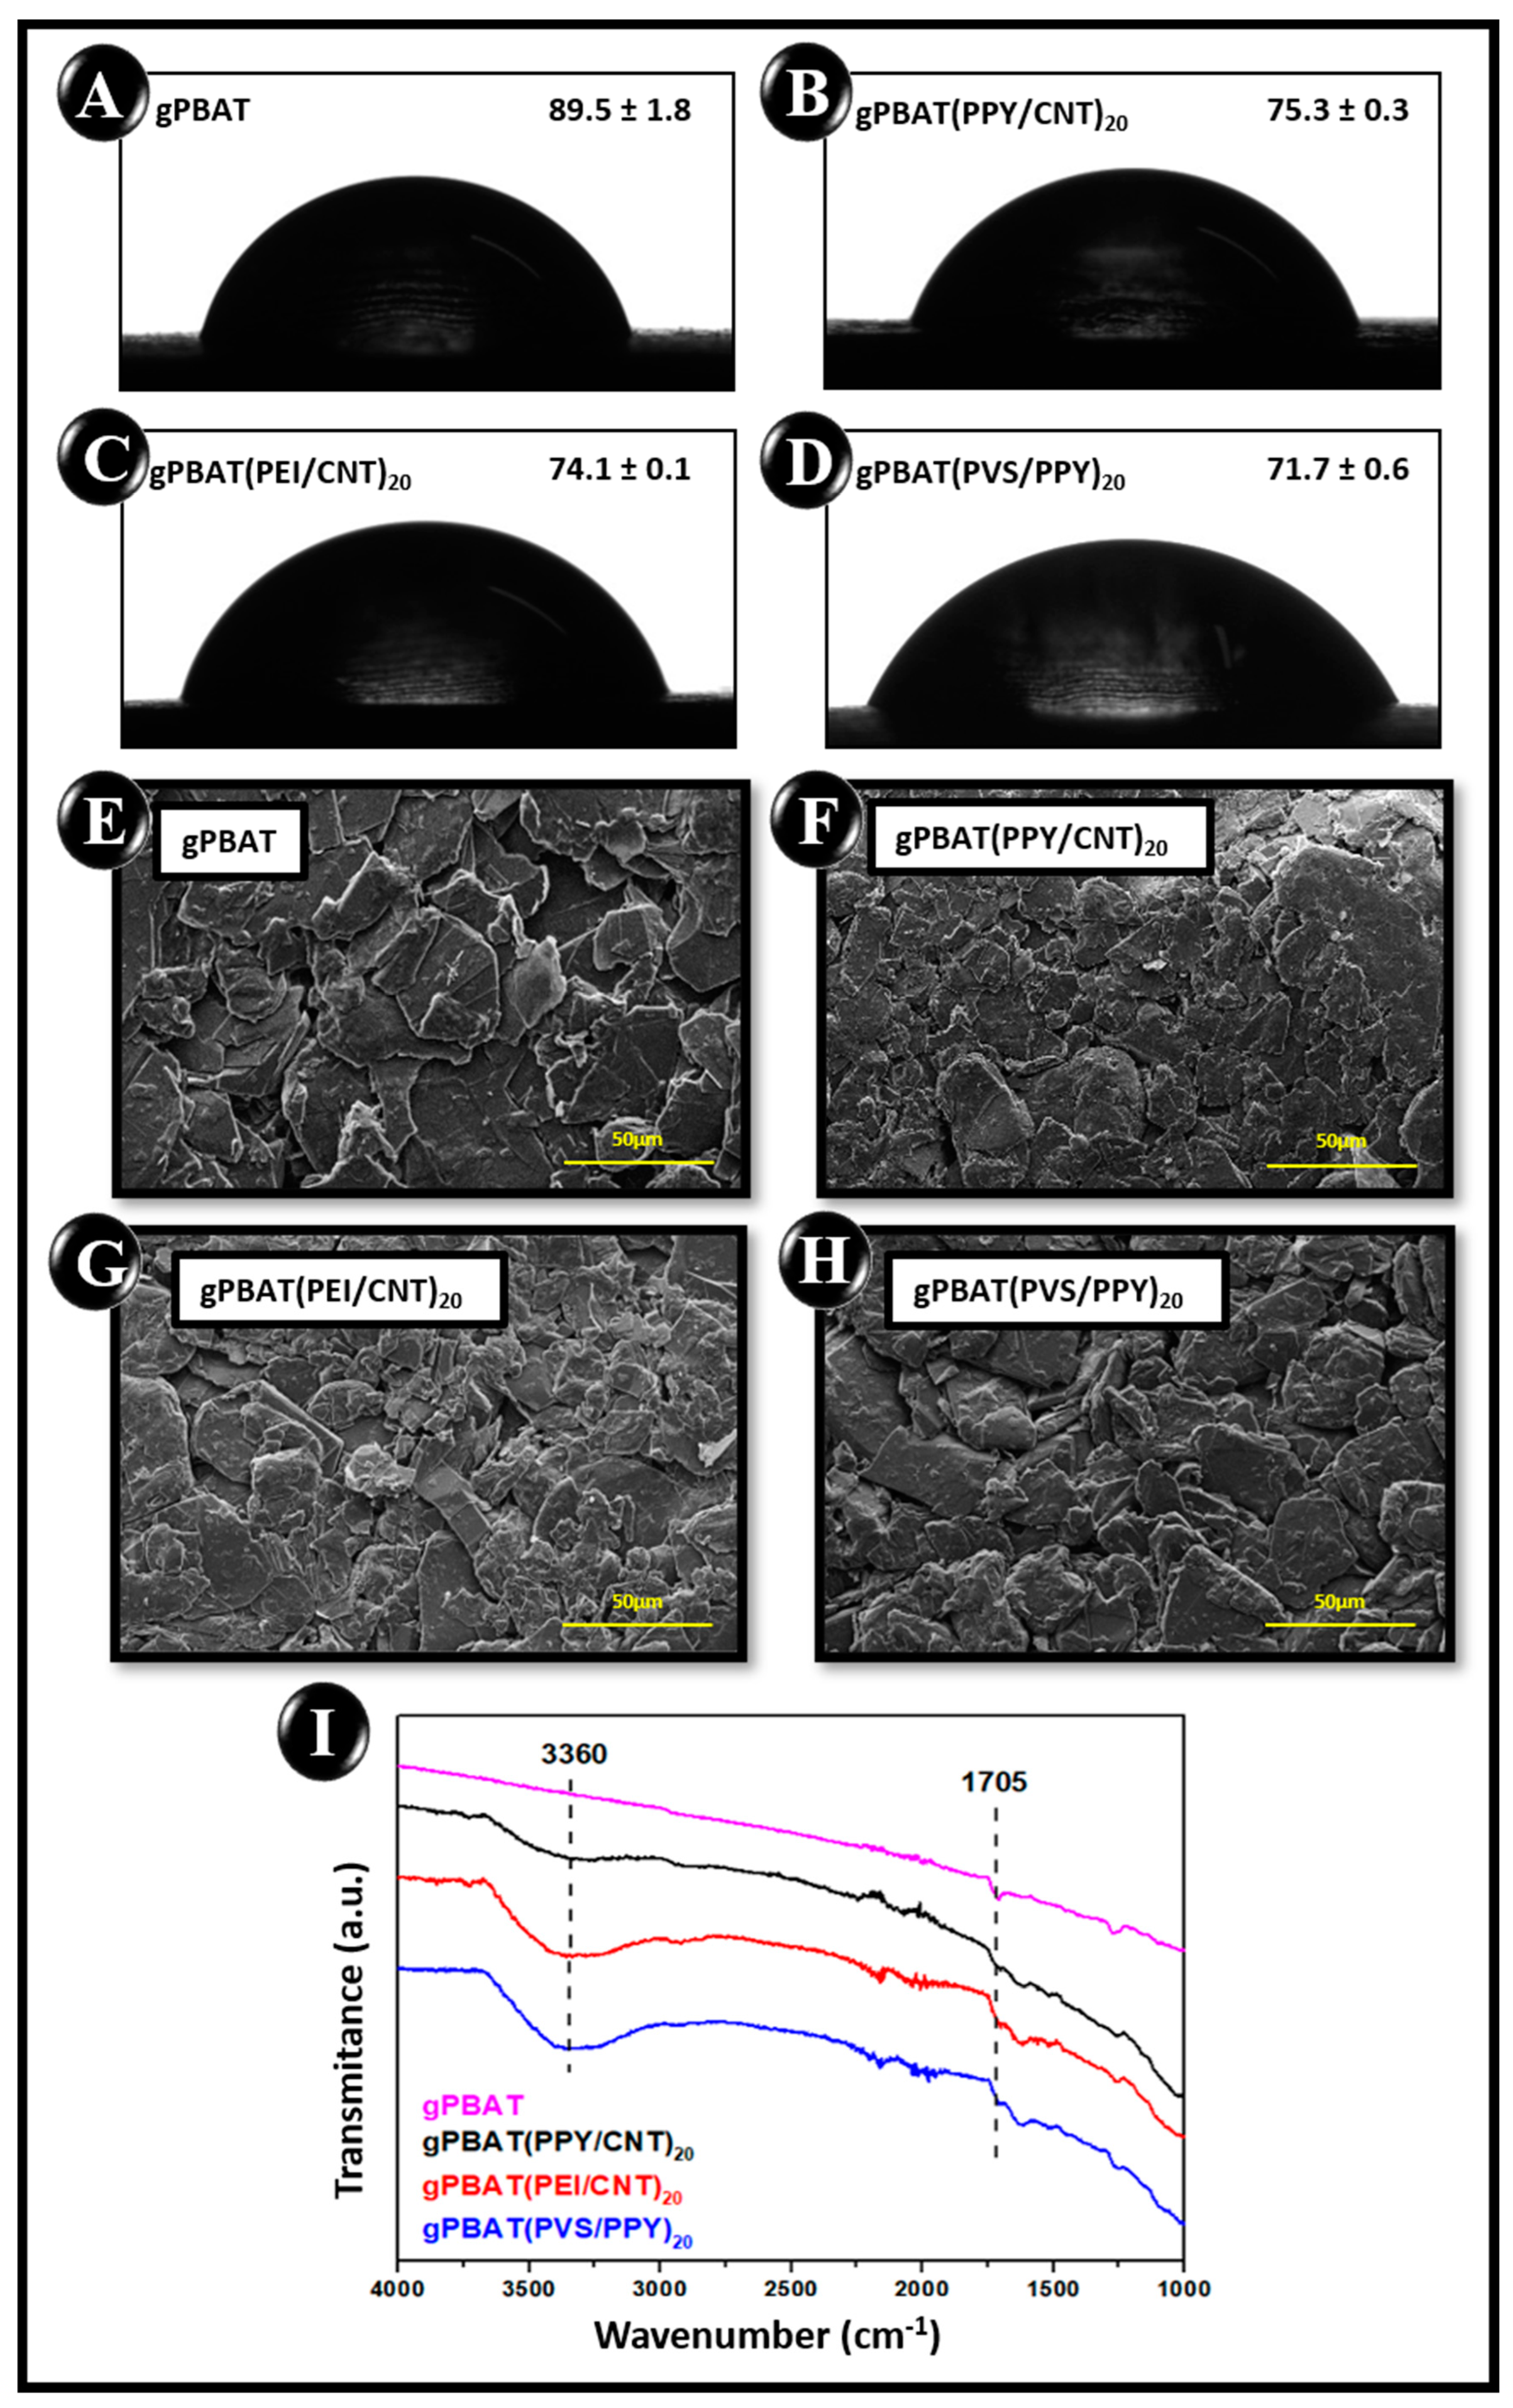
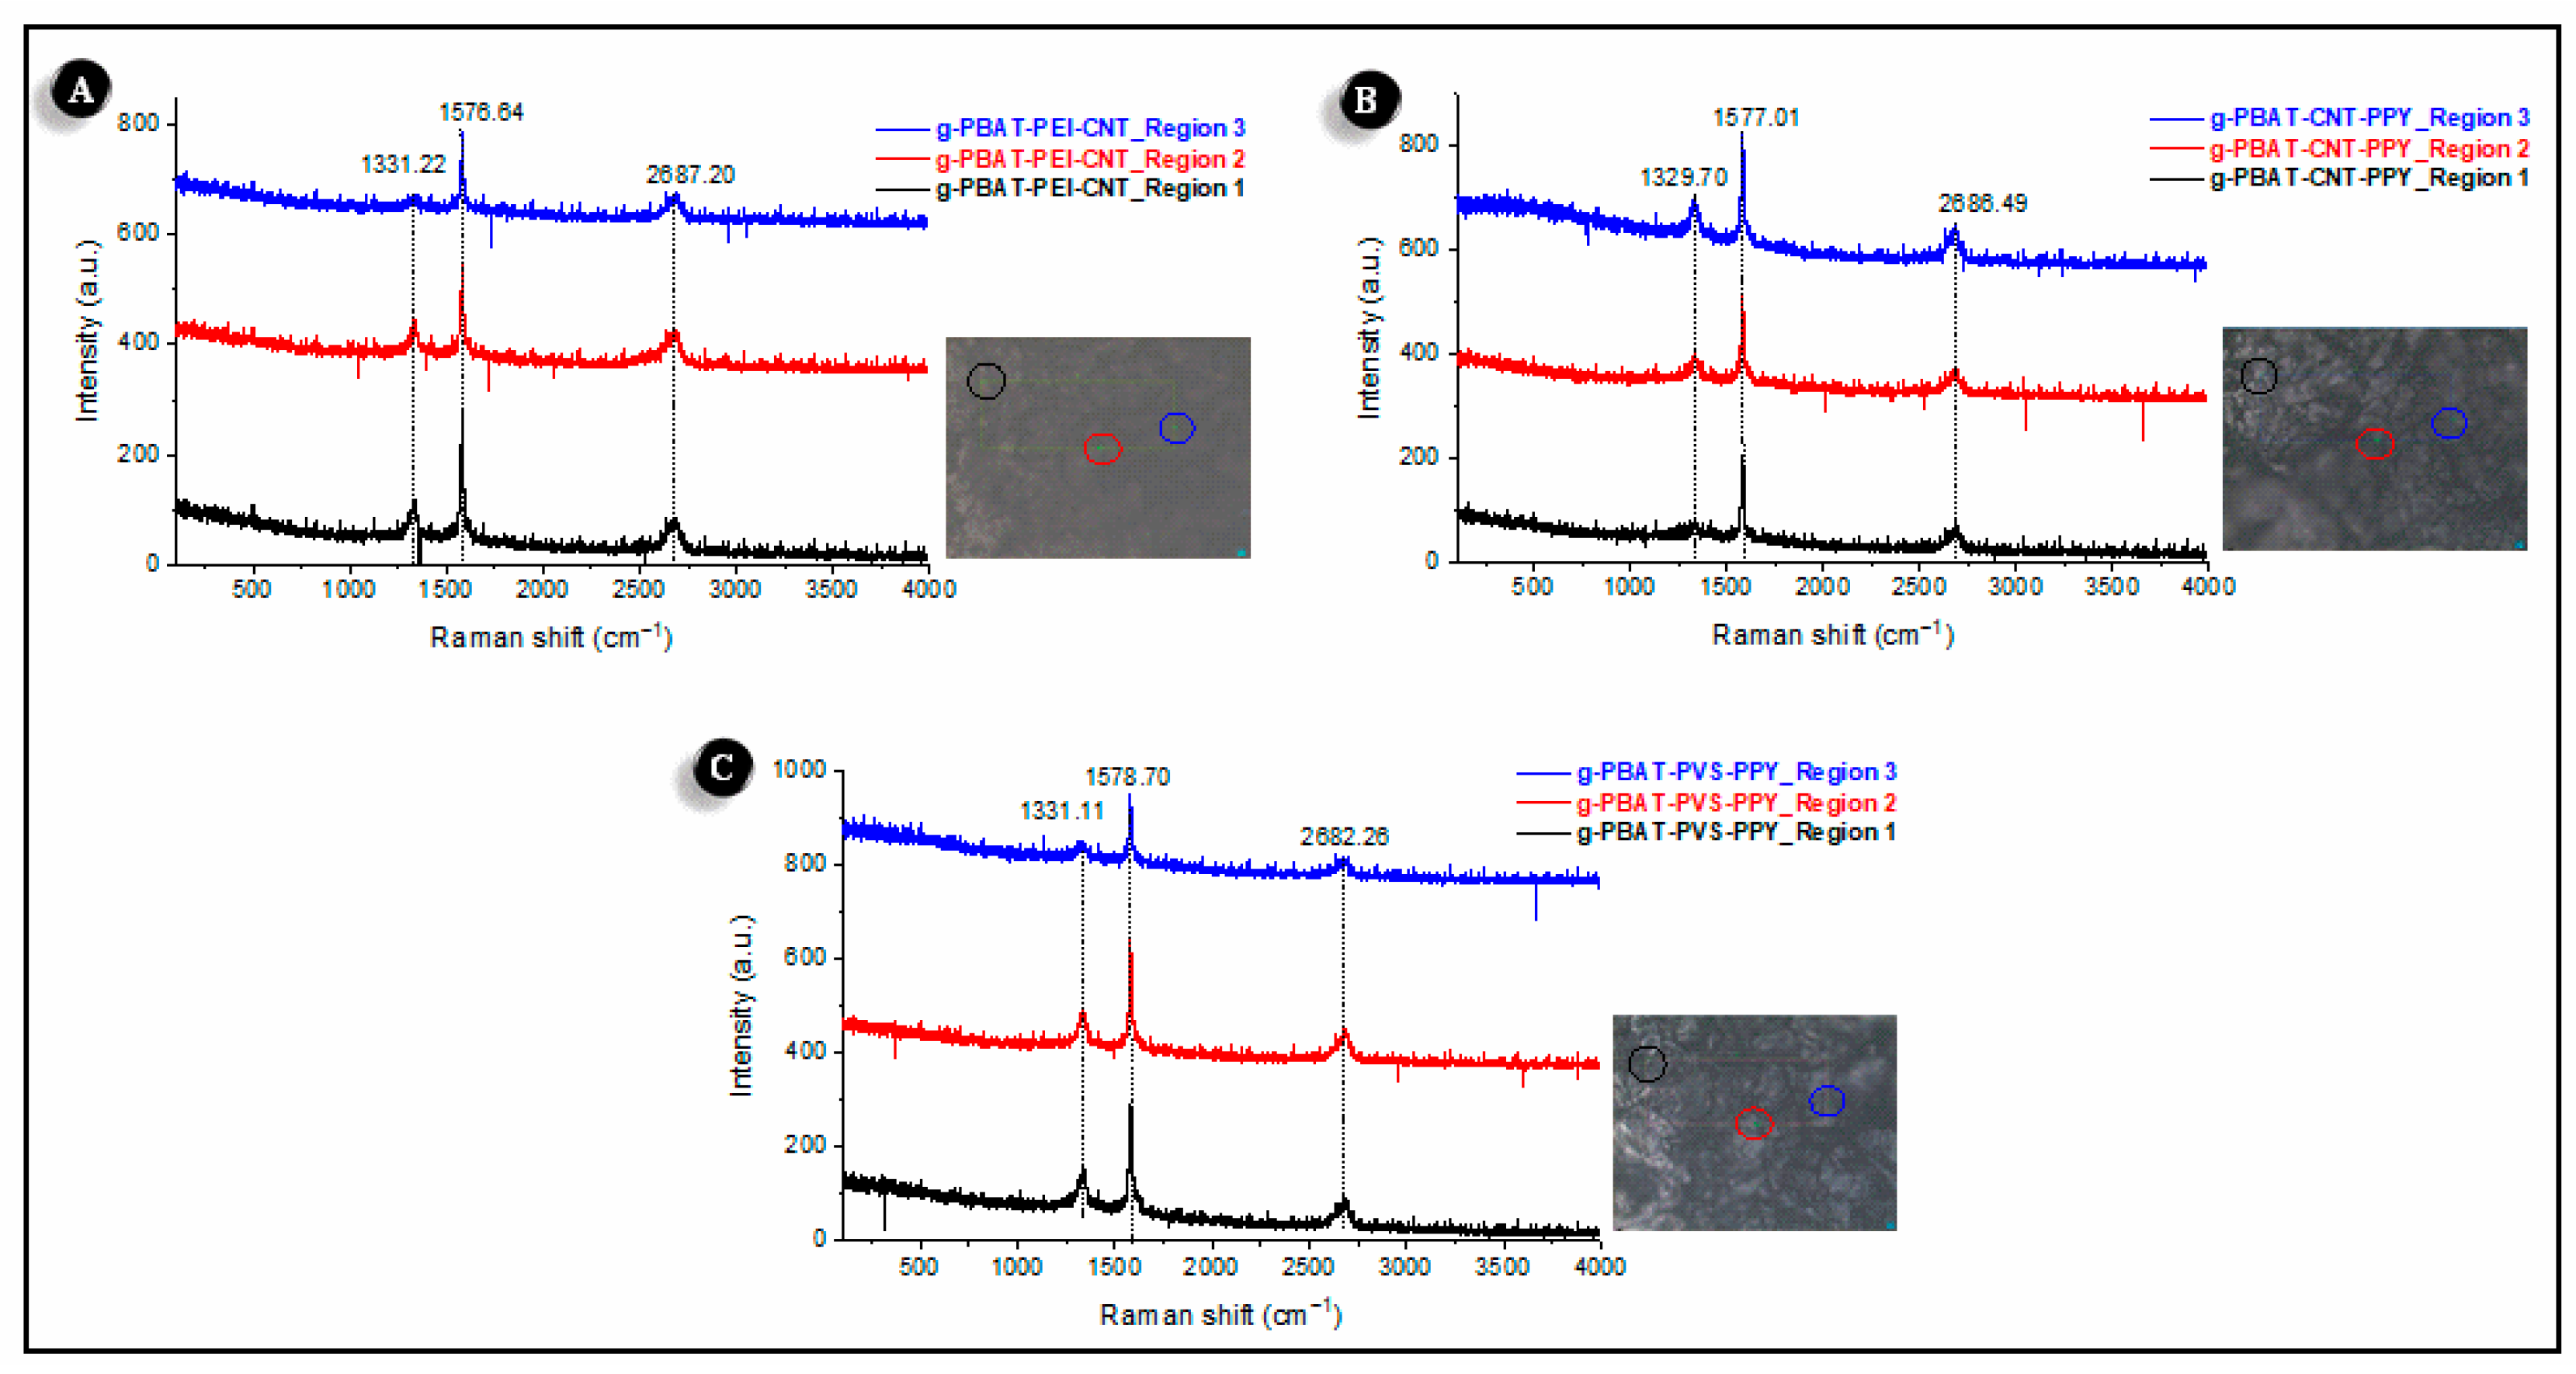
3.2. Physical Characterization

Wettability—A wettability study was carried out to compare the behavior of the gPBAT and modified gPBAT electrode with three different architectures gPBAT(PPY/CNT)20, gPBAT(PEI/CNT)20, and gPBAT(PVS/PPY)20. Briefly, 20 bilayers were used to increase the films’ thickness and obtain explanatory results from the nanostructured films in the analyses. Figure 3A shows the image of the water droplet on the surface of the gPBAT electrode, with the measured contact angle of 89.5° ± 1.8°. For gPBAT(PPY/CNT)20 (Figure 3B), the measured angle was 75.3° ± 0.3°, whereas for gPBAT(PEI/CNT)20 (Figure 3C), it was 74.1° ± 0.1°, and finally, for gPBAT(PVS/PPY)20 (Figure 3D), it was 71.7° ± 0.6°. In different architectures, the coating of the gPBAT substrate with LbL led to a reduction in the cohesive force, verified by the decrease in the electrode’s contact angle and consequently an improved hydrophilic character after modification using the LbL film. The gPBAT(PPY/CNT)20 film had the smallest angle value, with the largest variation in the formed angle between the droplet and the surface, which was approximately 17.8° regarding gPBAT without the modification. The values of gPBAT(PEI/CNT)20 and gPBAT(PVS/PPY)20 LbL films were approximately 15.4° and 14.2°, respectively. This increase in hydrophilicity due to LbL film assembly reveals an effective modification of the electrode surface through the construction of the nanostructured film. Previous research has revealed that the functionalization of polymeric substrates with LbL films increases the hydrophilicity of the material, providing a better interaction between the electrode and the aqueous medium in which the analytes were measured [10]. In this work, the same behavior was observed. With increased hydrophilicity, an average contact angle of approximately 15.8° was observed for the modified electrodes, which was more than that of the unmodified PBAT electrode. Thus, a better electrochemical response sensor is expected using the gPBAT(PPY/CNT)n architecture compared with unmodified gPBAT.
Scanning electron microscopy (SEM)—The surface morphology of the electrodes of pure gPBAT (Figure 3E), gPBAT(PPY/CNT)20 (Figure 3F), gPBAT(PEI/CNT)20 (Figure 3G), and gPBAT(PVS/PPY)20 (Figure 3H) were analyzed using scanning electron microscopy. It was found that the graphite particles were aggregated in an orderly manner to the PBAT when analyzing the surface of the gPBAT electrode. The conductive area on the film surface is produced thanks to the compactability of the particles and the porosity. This behavior can also be found in other micrographs reported in the literature [13,19,20]. The morphology of the gPBAT electrodes modified with the three LbL architectures did not show significant changes in morphology compared with gPBAT, as already observed in other studies [11]. This result is a consequence of the nanoscale structure in the film because the magnification achieved with the microscope used in this study does not allow the visualization of the nanoscale structures. However, through contact angle and FTIR analyses, it was possible to observe significant differences between the gPBAT electrode and the material covered with the LbL films.
Fourier transform infrared spectroscopy (FTIR)—FTIR/ATR was used to analyze the materials’ surface composition. Thus, it was possible to observe the changes in the gPBAT electrode after coating with the three types of nanostructured LbL film (Figure 3I). It has been established in the literature that PBAT presents an intense band in the region of 1705 cm−1, which is attributed to C=O, ester carbonyls [13]. However, with the incorporation of the graphite into the polymeric matrix, it was possible to verify that all the bands had weakened intensity, including the C=O bond. Despite the inclusion of graphite, a signal was still present, which obscured these bands. The same result was seen when the gPBAT was modified with LbL film in the three architectures. It was possible to observe the appearance of a band in the region of 3360 cm−1 attributed to the O-H stretching of the hydroxyl group of water [21]. This result is expected once all films are grown and structured in an aqueous medium on a porous substrate. The increase in the presence of hydroxyl groups on the surface of the electrodes modified with the three film architectures also corroborated the increased wetting behavior. The three LbL functionalized substrates showed decreased contact angle values, demonstrating improved hydrophilicity.
Raman analysis—This analysis was performed for all electrode composites architectures, gPBAT(PEI/CNT)7, gPBAT(PPY/CNT)7, and gPBAT(PVS/PPY)7, as shown in Figure 4. From the optical images, it can be observed that the sample had a different aspect with the three different aggregates, and the Raman spectra were collected at the exact point indicated by red, black, and blue spheres. Figure 4A corresponds to the electrode gPBAT(PEI/CNT)7, and we observed the characteristic bands of G, D, and G’ at 1331.22, 1576.64, and 2687.20 cm−1, respectively. The high intensity of the D band in relation to the G band indicates the predominance of CNT [8,11,22,23] and their homogeneous distribution on the electrode composite. The same behavior was observed in Figure 4B,C for the gPBAT(PPY/CNT)7, and gPBAT(PVS/PPY)7 electrode composites, respectively, i.e., a higher intensity for the D band than the G band. However, no significative shift for these bands was observed according to the different architectures, indicating that only physics interactions constitute the combination of materials.

3.3. Zeta Potential of Nanostructured Films

The zeta potential of the LbL films was evaluated in the three architectures. Table 2 presents these values at pH 7.0. The results indicate that the negative zeta potential was in increasing order for gPBAT(PPY/CNT)7, gPBAT(PEI/CNT)7, and gPBAT(PVS/PPY)7 films, respectively. The films containing CNT showed higher negative zeta potential than the gPBAT(PVS/PPY)7 film. This is expected due to the CNT’s charge. The chemical functionalization of CNT led to an increase in the presence of negative charges on its surface [24,25].

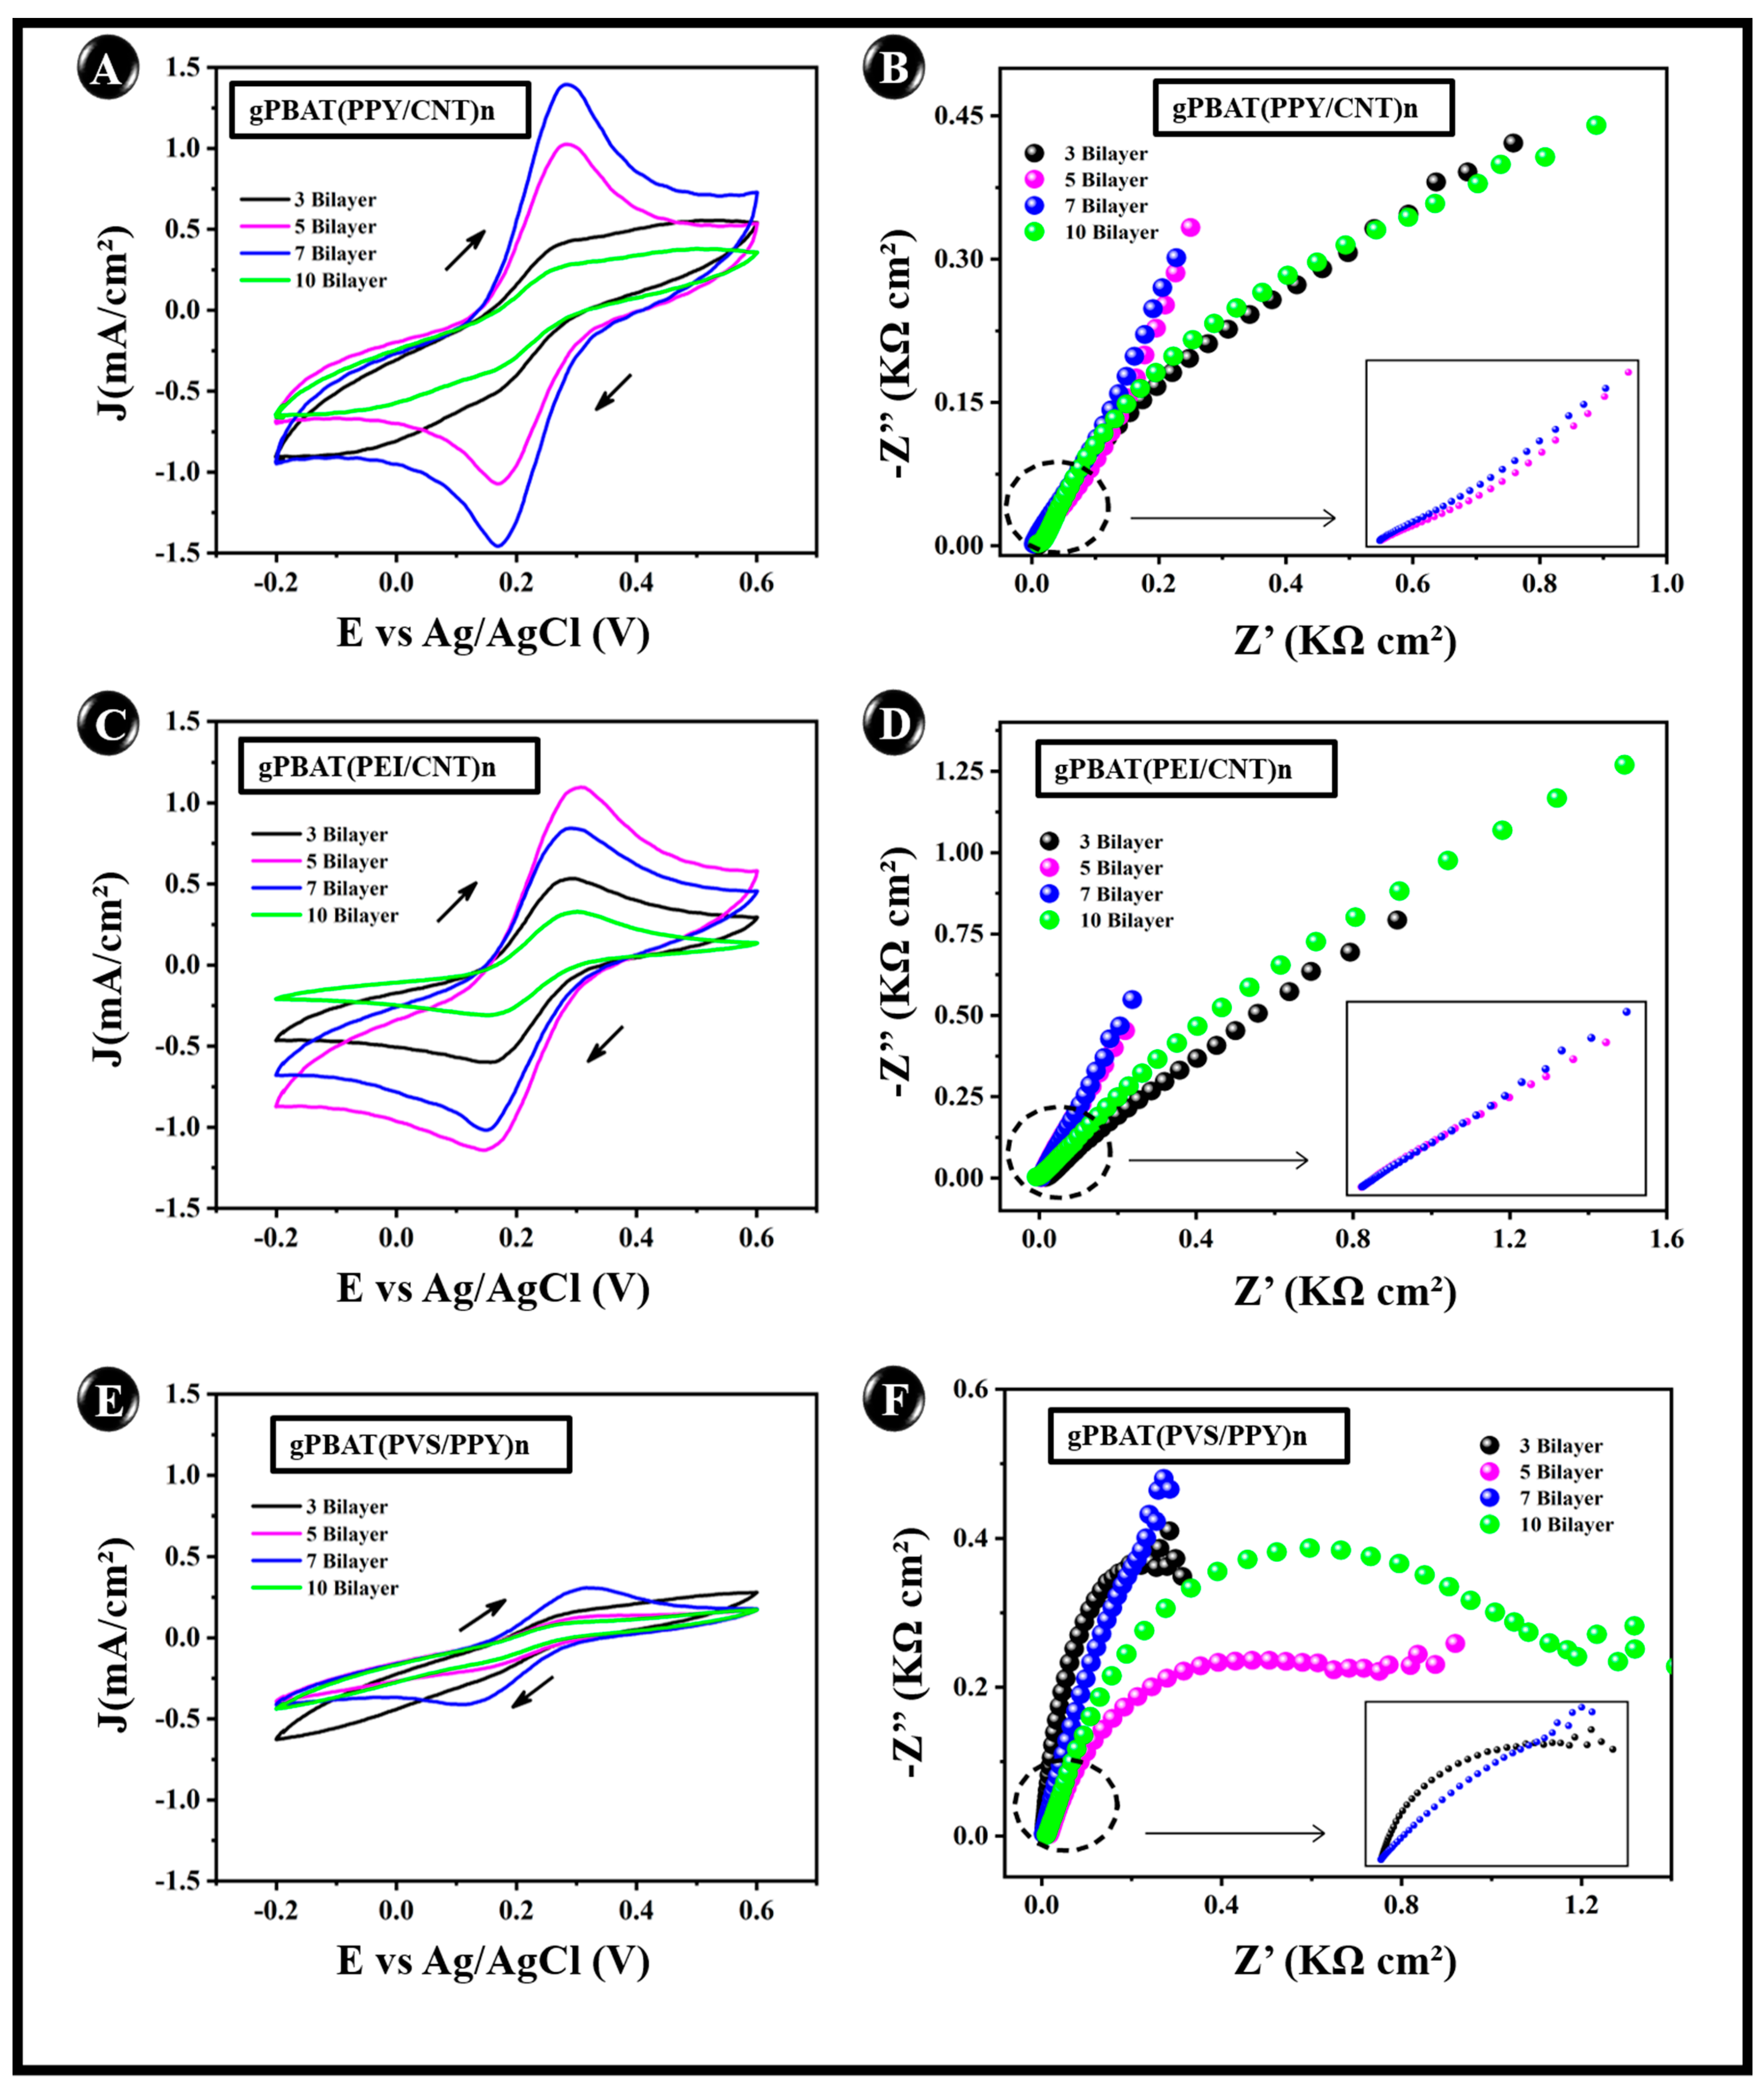
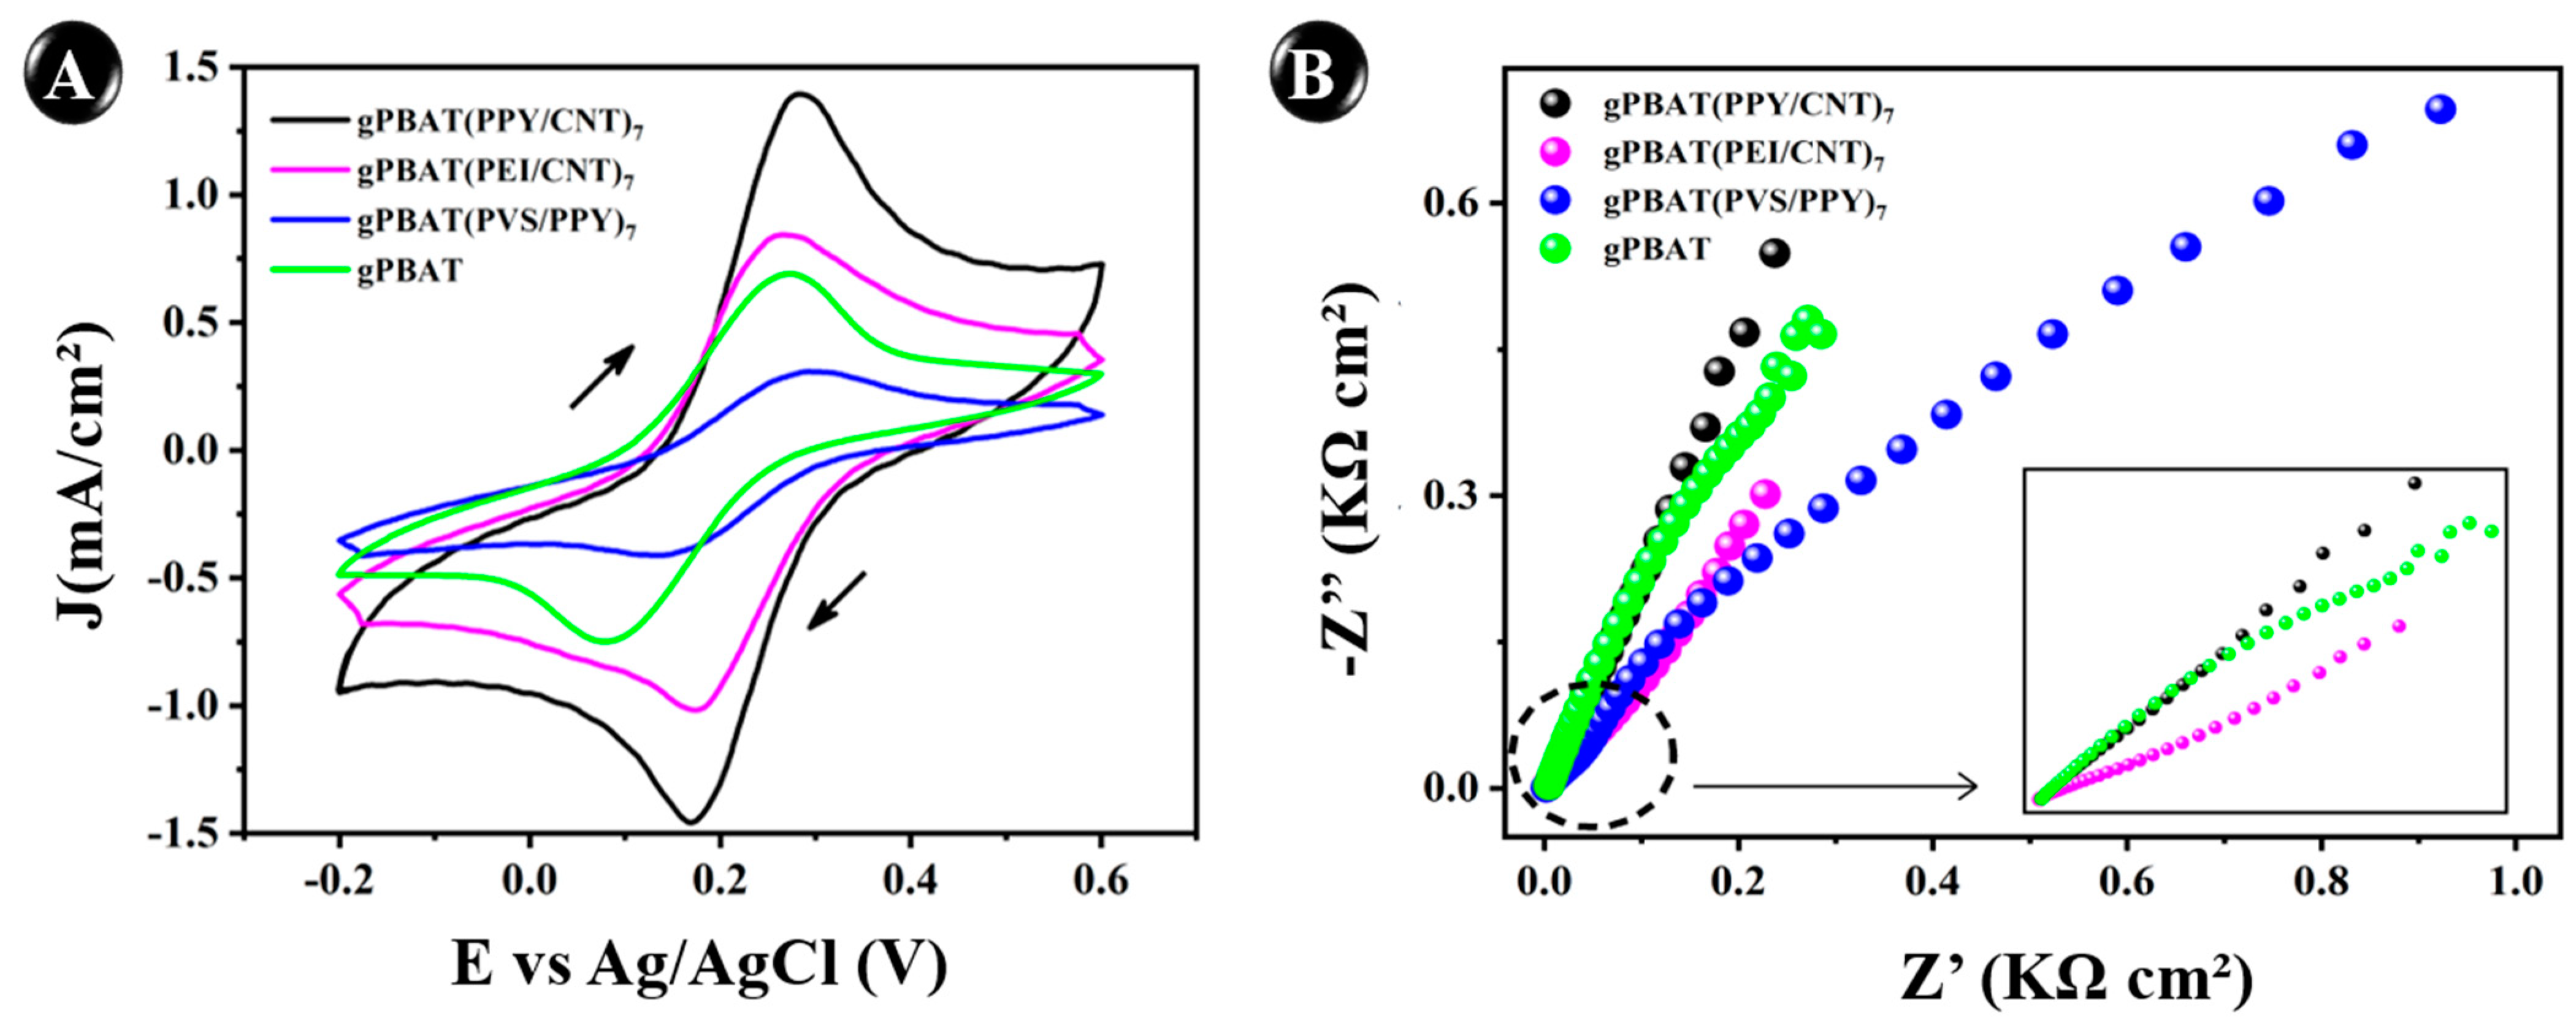
3.4. Electrochemical Behavior

The architectures of gPBAT(PPY/CNT)n, gPBAT(PEI/CNT)n, and gPBAT(PVS/PPY)n, with n = 7 and the pure gPBAT architecture, were compared via CV and EIS electrochemical techniques (Figure 5). As mentioned in the previous sections, the number of bilayers equal to seven was chosen because it represents the best electrochemical performance among the electrodes, especially gPBAT(PPY/CNT)7, with a higher current density value and lower Rct value. The measurements were performed on a standard redox probe solution of potassium hexacyanoferrate ([Fe(CN)6]3−/4− 5 mM) in 0.1 M KCl. A large and well-defined redox response was obtained for all electrodes. The current density versus different scanning speeds is presented in Figure S1 by plotting the cathodic/anodic peak. Using the Randles–Sevcik equation (Equation (1)) [26,27,28], it was possible to obtain parameters such as the electroactive area (A) (cm2), the charge transfer resistance (Rct), and the heterogeneous electron transfer constant (k0).
I P = ±   ( 2.69 × 10 5 ) n 3 2   A   D 1 2 C   v 1 2
The equation parameters are as follows: Ip is the peak current, n is the number of transferred electrons, A is the electroactive area (cm2), D is the diffusion coefficient of [Fe(CN)6]−3/4 in 0.1 M KCl solution (7.6 × 10⁻⁶ cm2 s−1), C is the concentration of [Fe(CN)6]−3/−4 (mol cm−3), and v is the scanning speed (V s−1). As described in Table 3, the corresponding electroactive area of gPBAT(PPY/CNT)7 film showed a 30% increase over the unmodified gPBAT. Moreover, the electrochemically active area of the gPBAT(PPY/CNT)7 LbL film displayed an increase of almost three times its geometric area (0.25 cm2).
From the Nyquist plot, we found Rct values for each electrode (Table 3). The values showed a lower Rct for the gPBAT(PPY/CNT)7 electrode (0.16 ± 0.02 KΩ cm2) than the other modified LbL films and the unmodified electrode, indicating that the electron transfer process was faster in the gPBAT(PPY/CNT)7 electrode unit. Then, the electron transfer rate constant (k0) [13,29] was determined from Equation (2):
k 0 = R T F 2 A   C   R C T
In the kinetic constant equation, R is the molar constant of the gas (8.314 J mol−1 K−1), T is the thermodynamic temperature (298 K), F is the Faraday constant (96,485 C mol−1), A is the electroactive area of the electrode (Table 3), and C is the concentration of electroactive species (5 × 10⁻⁶ mol cm−3). As expected, the k0 value obtained for the gPBAT(PPY/CNT)7 electrode unit was significantly higher than the other modified electrodes and the unmodified electrode, indicating that the electrochemical activity was higher for the gPBAT(PPY/CNT)7 LbL film. The architecture of gPBAT(PPY/CNT)7, which showed the best electrochemical results, was chosen for the electroanalytical detection of pesticides.

3.5. Electroanalytical Performance for the Detection of PQ
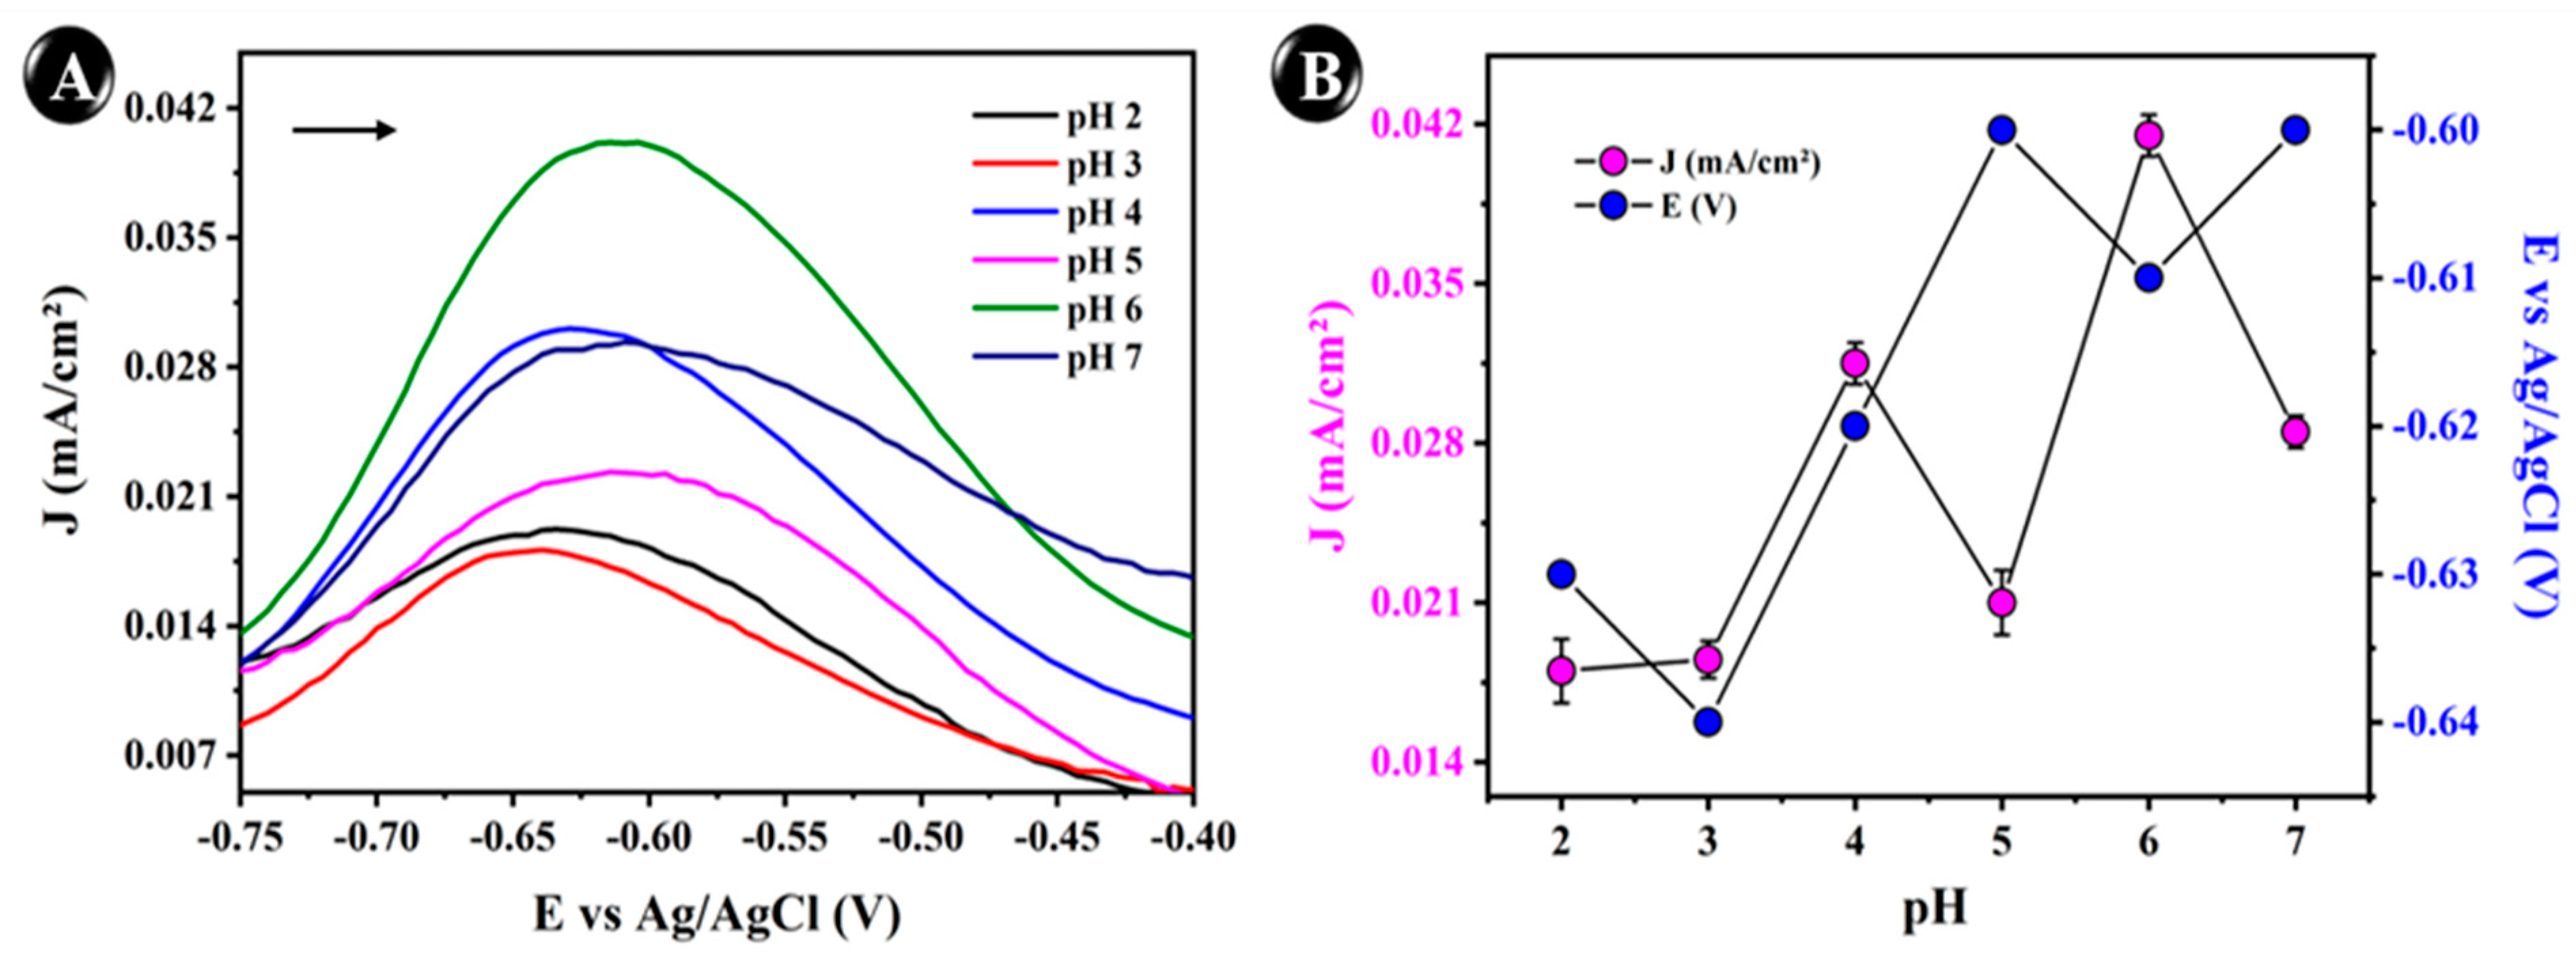
3.5.1. pH Study

Preliminary tests revealed the best results for the paraquat (PQ) quantification. They were obtained from DPV curves using the gPBAT(PPY/CNT)7 as a working electrode. A pH dependence study of paraquat (PQ) was carried out using DPV measurements over a phosphate-buffered solution (PBS) with pH varying from 2.0 to 7.0, using the gPBAT(PPY/CNT)7 electrode, as shown in Figure 6A. Among the different pH levels, pH 6 enhanced PQ electrochemical detection and led to the maximum current density value (J). In the studied pH range, the PQ is in a deprotonated form, since its pKa equals zero [30,31]. Analyzing the DPV results, it was observed that for all pH values, the PQ reduction profile was around −0.60. Moreover, the current density presented a better electrochemical response at pH 6. Figure 6B illustrates that the buffer solution at pH 6 was the best solution for PQ sensor performance because it had the highest current density, indicating that protons were directly involved in the electrochemical redox process [32]. Thus, the buffer solution at pH 6 was chosen for further analysis as the optimal analytical condition, presenting selectivity (low potential) and high detectability.

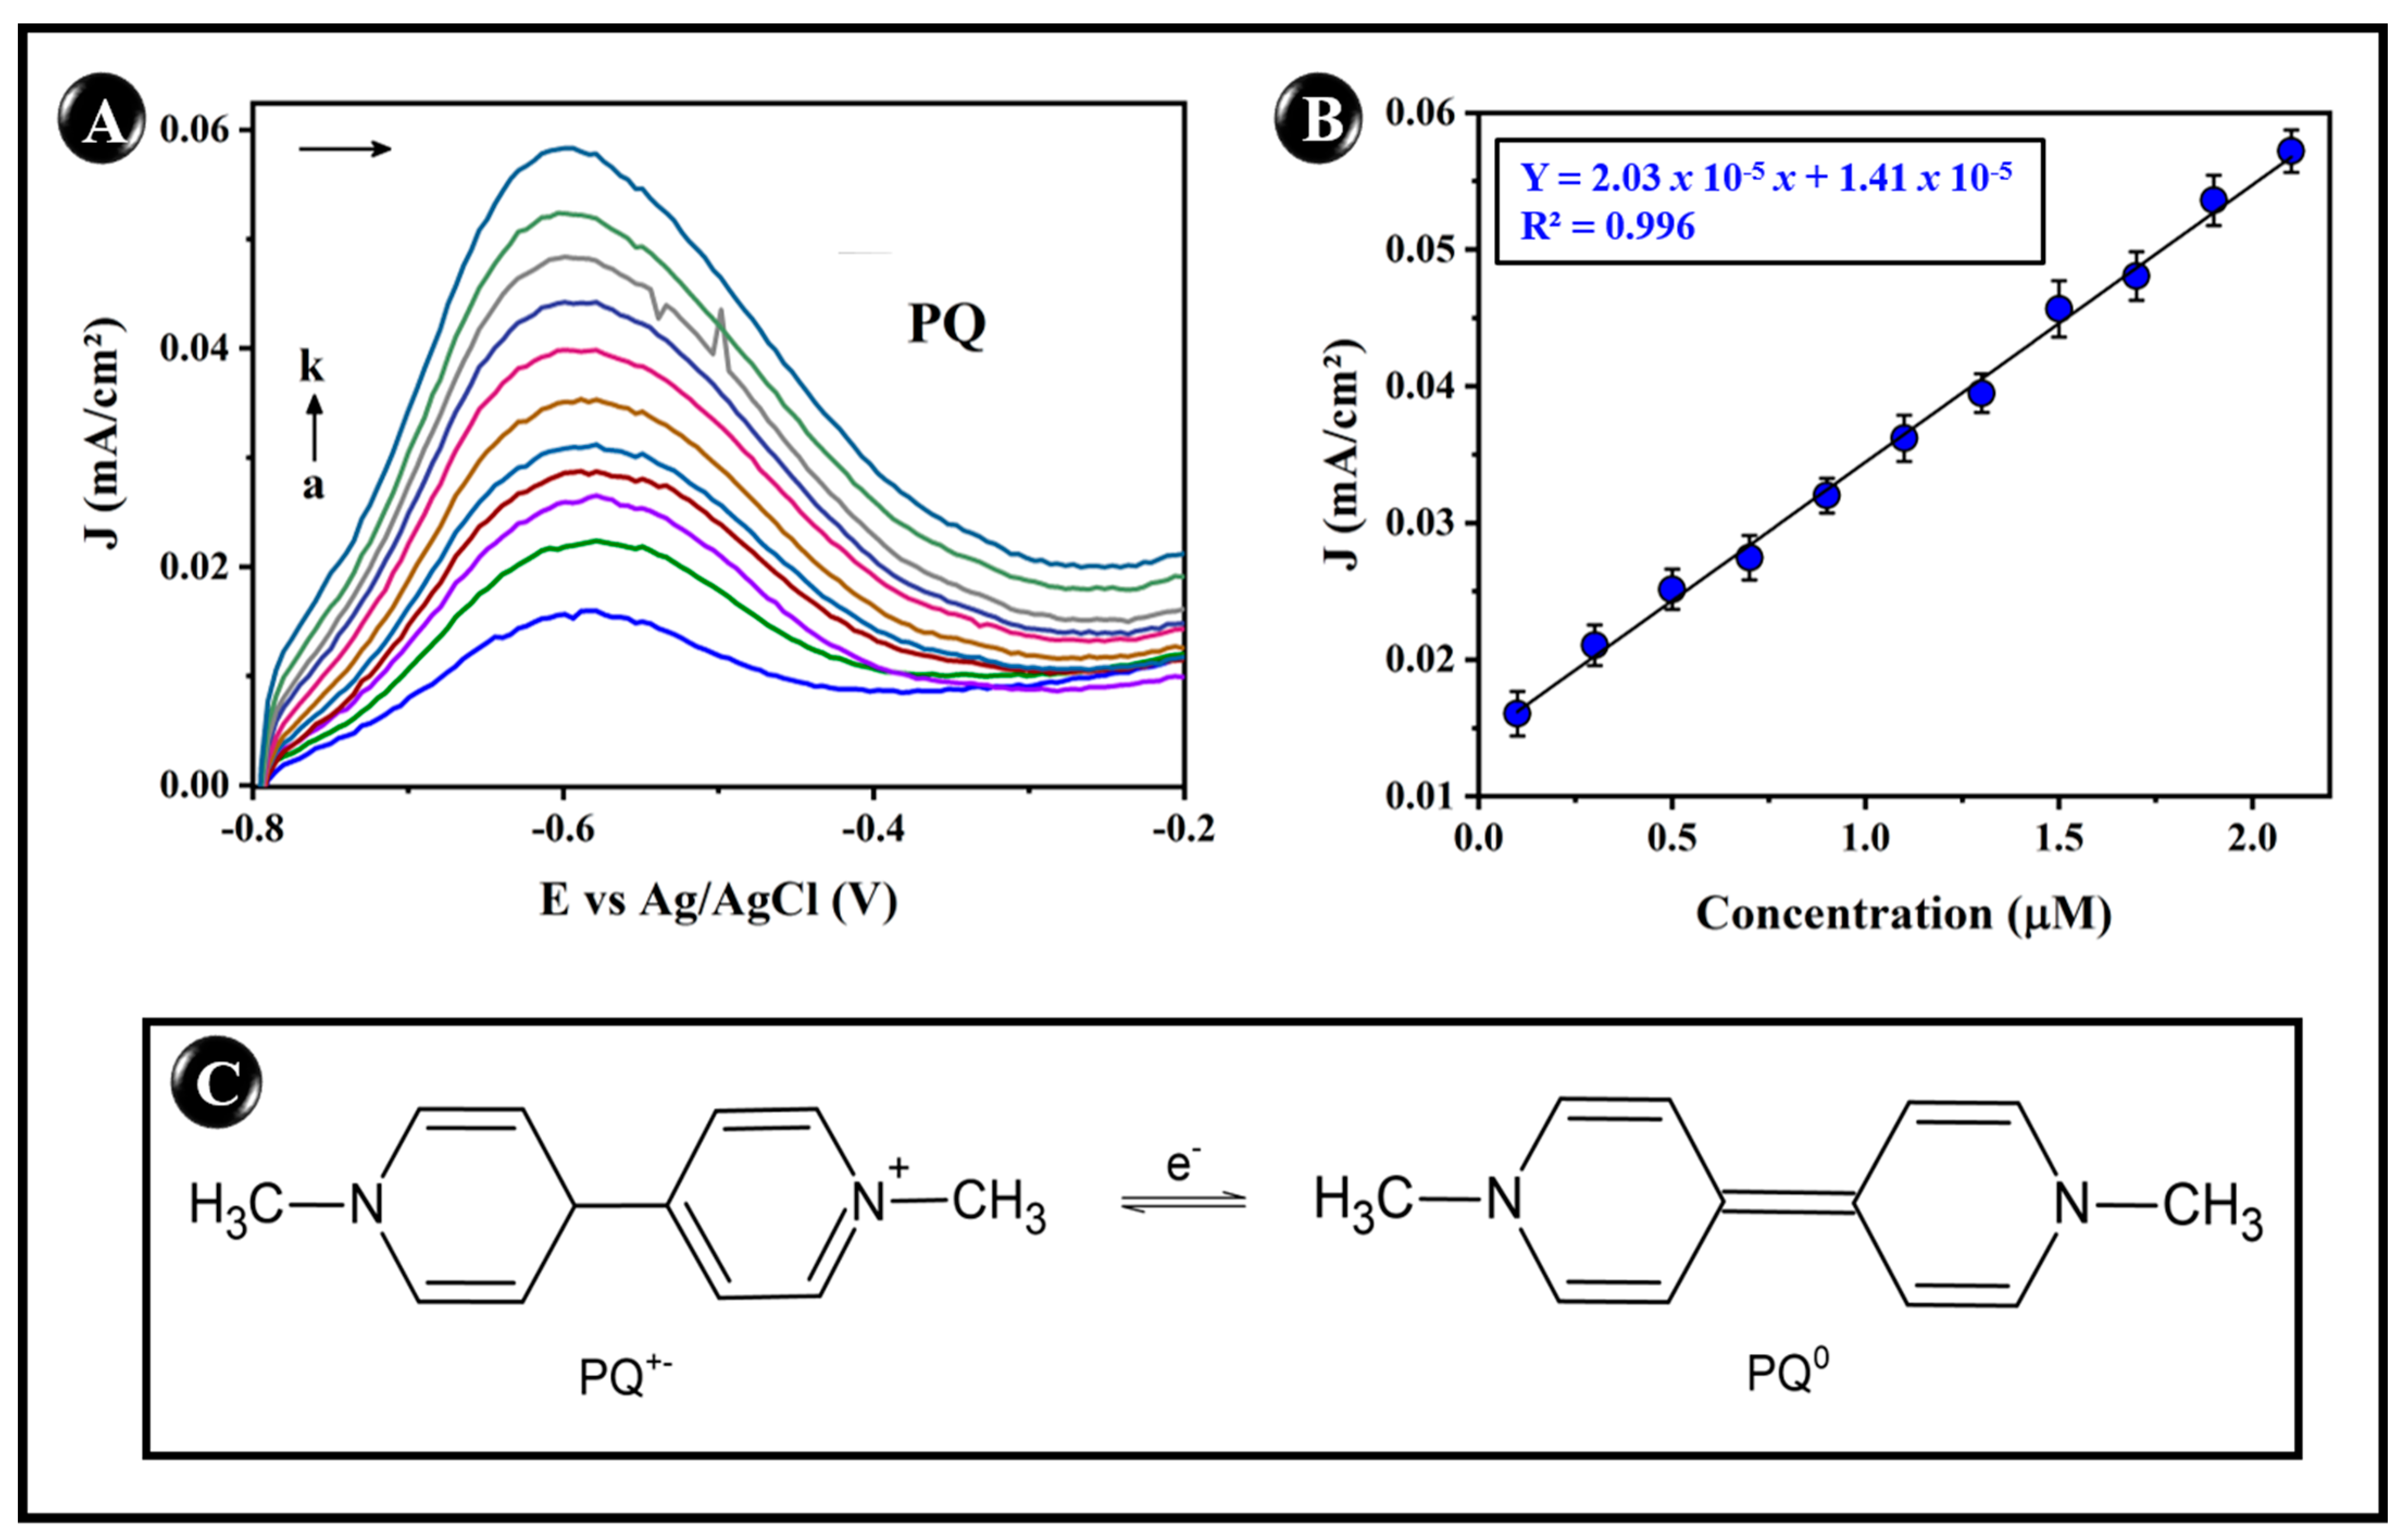
3.5.2. Determination of PQ on Modified gPBAT(PPY/CNT)7 Sensors Using DPV

The PQ molecule was quantified by obtaining DPV curves, in triplicate, over a concentration range of 0.1 to 2.1 µM in PBS at pH 6, using gPBAT(PPY/CNT)7 as a working electrode. The current peaked at −0.60 V and increased linearly with PQ concentration (Figure 7A). The calibration curve (Figure 7B) demonstrates that the current value increased linearly with PQ concentration from 0.1 to 2.1 µM, with a linear correlation of R² = 0.996 and a sensitivity of 2.05 × 10⁻⁵ ± 3.90 × 10⁻⁷ (A cm−2) (M)−1. The reaction mechanism (Figure 7C) governing the detection of PQ is shown. The molecule underwent an electrochemical reaction in two successive one-electron transfers, one at −0.60 V and the other at −1.0 V, as observed in the CV and DPV analyses (Figure S2). This behavior was also verified by other authors [33,34,35]. Therefore, in this work, only one reaction with a higher analytical signal (−0.6 V) was considered for further analysis. The behavior of this reaction corresponds to the control of the reaction via diffusion. At first, the reaction involves the reduction of the cation (PQ+). Subsequently, the reaction involves an electron, obtaining a neutral compound, in this case, PQ0. The limit of detection (LOD) and limit of quantification (LOQ) were calculated according to the method of Miller and Miller [36,37,38], using the equations L D = ( y 0 y B ) + 3 S y / x and L Q = 3.33 × L D . In this case, ( y 0 y B ) is the interception value after subtraction of the blank, and S y / x corresponds to the errors in the y-direction and LQ = 3.33 × LD. The LD and QL values were 0.073 µM and 0.243 µM, respectively, allowing for the use of the gPBAT(PPY/CNT)7 electrode for the detection of PQ at low concentrations. Furthermore, the analytical performance of this PQ sensor was compared with other electrochemical sensors in the literature, which are presented in Table 4. In summary, we can see that the produced sensor uses low concentrations of PQ, and the results are within the expected range found in the literature. The sensor mechanism basically allows us to obtain analytical information that depends on the ability of the device’s surface to recognize the species of interest selectively. Consequently, the interaction of the species onto the sensor surface results in the signal transduction to the detector, and the transmitted signal must be maximized with respect to electronic noise or experimental errors. To this end, the gPBAT(PPY/CNT)7 film facilitated the oxidative process between the sensor surface and the electrolyte solution. The sensor showed good portability and conductivity due to the high electron transfer and decreased interface resistance of the LbL film. The electrostatic interaction between PPY and CNTs significantly promoted the electron transfer [39,40,41].

3.5.3. Analysis of Real Water Samples

The gPBAT(PPY/CNT)7 sensor was evaluated using the addition–recovery methodology, based on which known quantities of PQ were added to the tap water sample. Measurements were carried out through the DPV analysis under optimized conditions. Table 5 presents the actual concentration values, the concentrations found, and the recovery values obtained for the tap water samples. The recoveries of PQ for the gPBAT(PPY/CTN)7 sensor ranged from 99.4% to 109.2%. These results indicate that the proposed sensor presents good sensitivity for real sample applications and routine analysis of this pollutant.

3.5.4. Reproducibility, Repeatability, Stability, and Selectivity

The reproducibility study (intra-day) of the gPBAT(PPY/CNT)7 electrode was obtained using ten different electrodes, using PQ at a concentration of 0.5 µM in 0.1 M PBS, with a scan rate of 50 mV·s−1, resulting in a relative standard deviation (RSD) equal to 0.16%. For the repeatability test, the sensor was used for six days (inter-day), resulting in an RSD = 1.76%, revealing that the sensitivity showed minimal loss. The stability study of the gPBAT(PPY/CNT)7 sensor was performed from an electrode used to detect PQ and subsequently stored in a container at room temperature for ten days. After this process, the sensor was subjected to the same type of detection and the same conditions as the one previously used. After that, it was possible to verify that the current signal peak decreased only 9.2% in relation to the initial PQ peak. Therefore, the electrode electrochemical behavior showed good stability and no change in current density (J).
Some possible interfering species were studied using DPV measurements, to verify the selectivity of the functionalized sensor in the determination of PQ. A concentration of 0.5 µM PQ in PBS at pH 6.0 was used for each of the following compounds at 0.5 µM concentration: hydroquinone, methyl parathion, and carbofuran [43,44,45,46]. However, the results showed that the analyzed compounds did not interfere in detecting the PQ molecule, with a signal deviation of ± 5%. Thus, the functionalized gPBAT electrode with (PPY/CNT)7 showed good selectivity for PQ detection with no interference from commonly coexisting substances. Furthermore, the fabricated electrode in this work can be used in other matrices, provided that a study can analyze its behavior in relation to changing pH, supporting electrolytes, temperature, etc.

4. Conclusions

In this work, we proposed modifying the gPBAT electrodes’ surface using the LbL technique. The physical characterization of the electrodes confirmed the nanostructured modification onto the gPBAT, which showed a decrease of ca. 16° in the contact angle in relation to pure gPBAT, indicating that the LbL film turned the electrode more hydrophilic. Through FTIR analysis, we observed the presence of a band in the region of 3360 cm−1, which is attributed to the O-H stretching of the hydroxyl group of water. The modified electrode was used for PQ detection using the DPV electrochemical technique. The concentration range for detection was 0.1–2.1 μM, with a detection limit of 0.073 μM and R² equal to 0.996. Modifying gPBAT with the (PPY/CNT)7 LbL film resulted in a sensor with excellent sensitivity, selectivity, and stability. In addition, the electrode is simple and easy to fabricate and needs small quantities of materials for surface modification. Therefore, the gPBAT(PPY/CNT)7 sensor is promising for application to detect pollutants in the environment.

Supplementary Materials

The following supporting information can be downloaded at https://www.mdpi.com/article/10.3390/chemosensors11080420/s1, Figure S1: CVs recorded in the different scan rate values for unmodified gPBAT and for the three architectures of LbL films: (A) gPBAT(PPY/CNT)7, (C) gPBAT(PEI/CNT)7, (E) gPBAT(PVS/PPY)7, and (G) gPBAT. Plots of cathodic/anodic peak current versus scan rate for: (B) gPBAT(PPY/CNT)7, (D) gPBAT(PEI/CNT)7, (F) gPBAT(PVS/PPY)7, and (H) gPBAT. The geometrical area for the electrode was 0.25 cm2. Conditions: cyclic voltammograms were measured in 0.1 mmol L−1 KCl solution containing 5.0 × 10⁻³ mol L−1 [Fe(CN)6]−3/−4, and potential range from −0.20 to 0.60 V (LbL films) and from −0.20 to 0.80 V (gPBAT); Figure S2: Electrochemical response for PQ sensor obtained in 0.1 M PBS solution, pH 6.0 by (A) CV and (B) DPV conditions: potential range of −1.7 V to −0.16 V with a scan rate of 50 mV·s−1; DPV conditions: sweep rate: 50 mV·s−1, amplitude 0.08 and potential range −1.2 V to −0.5 V.

Author Contributions

Conceptualization, S.F.A. and C.C.M.; methodology, C.C.M.; software, L.V.B.V.F.; validation, J.S.R., A.d.S.M.d.F., L.V.B.V.F. and A.d.B.; formal analysis, J.S.R. and A.d.S.M.d.F.; investigation, S.F.A. and C.C.M.; resources, S.F.A.; data curation, S.F.A. and C.C.M.; writing—original draft preparation, S.F.A. and C.C.M.; writing—review and editing, C.C.M. and L.V.B.V.F.; visualization, C.C.M.; supervision, M.F.; project administration, M.F.; funding acquisition, M.F. All authors have read and agreed to the published version of the manuscript.

Funding

This research was funded by CAPES grants numbers [88882.430936/2019-01] (ASMF), [88887.497915/2020-00] (CCM) [88887.803614/2023-00] (LVBVF) and São Paulo CNPq [144323/2002-2] (SFA), Research Foundation (FAPESP) [2020/12659-0].

Institutional Review Board Statement

Not applicable.

Informed Consent Statement

Not applicable.

Data Availability Statement

Data is unavailable due to privacy.

Acknowledgments

The authors would like to thank the Servier Medical Art image bank and the partnership with the Anton Paar company.

Conflicts of Interest

The authors declare no conflict of interest.

References

  1. Massumi, S.; Ahmadi, E.; Akbari, A.; Gholivand, M.B. Highly sensitive and selective sensor based on molecularly imprinted polymer for voltammetric determination of Nevirapine in biological samples. J. Electroanal. Chem. 2020, 876, 114508. [Google Scholar] [CrossRef]
  2. Zhao, L.; Xia, W.; Zhang, P. Economical conductive graphite-filled polymer composites via adjustable segregated structures: Construction, low percolation threshold, and positive temperature coefficient effect. J. Appl. Polym. Sci. 2021, 138, e50295. [Google Scholar] [CrossRef]
  3. Ferreira, A.M.; Tonda-Turo, C.; Mancuso, E.; Gentile, P. Multilayer nanoscale functionalization to treat disorders and enhance regeneration of bone tissue. Nanomed. Nanotechnol. Biol. Med. 2019, 19, 22–38. [Google Scholar] [CrossRef]
  4. Zhang, X.; Xu, Y.; Zhang, X.; Wu, H.; Shen, J.; Chen, R.; Xiong, Y.; Li, J.; Guo, S. Progress on the layer-by-layer assembly of multilayered polymer composites: Strategy, structural control and applications. Prog. Polym. Sci. 2019, 89, 76–107. [Google Scholar] [CrossRef]
  5. da Silva, J.L.; Buffon, E.; Beluomini, M.A.; Pradela-Filho, L.A.; Gouveia Araujo, D.A.; Santos, A.L.; Takeuchi, R.M.; Stradiotto, N.R. Non-enzymatic lactose molecularly imprinted sensor based on disposable graphite paper electrode. Anal. Chim. Acta 2021, 1143, 53–64. [Google Scholar] [CrossRef] [PubMed]
  6. Oh, B.; George, P. Conductive polymers to modulate the post-stroke neural environment. Brain Res. Bull. 2019, 148, 10–17. [Google Scholar] [CrossRef] [PubMed]
  7. Beluomini, M.A.; da Silva, J.L.; de Sá, A.C.; Buffon, E.; Pereira, T.C.; Stradiotto, N.R. Electrochemical sensors based on molecularly imprinted polymer on nanostructured carbon materials: A review. J. Electroanal. Chem. 2019, 840, 343–366. [Google Scholar] [CrossRef]
  8. Jang, D.; Farooq, S.Z.; Yoon, H.N.; Khalid, H.R. Design of a highly flexible and sensitive multi-functional polymeric sensor incorporating CNTs and carbonyl iron powder. Compos. Sci. Technol. 2021, 207, 108725. [Google Scholar] [CrossRef]
  9. Zubkiewicz, A.; Szymczyk, A.; Franciszczak, P.; Kochmanska, A.; Janowska, I.; Paszkiewicz, S. Comparing multi-walled carbon nanotubes and halloysite nanotubes as reinforcements in EVA nanocomposites. Materials 2020, 13, 3809. [Google Scholar] [CrossRef]
  10. Ariga, K.; Ito, M.; Mori, T.; Watanabe, S.; Takeya, J. Atom/molecular nanoarchitectonics for devices and related applications. Nano Today 2019, 28, 100762. [Google Scholar] [CrossRef]
  11. Maciel, C.C.; Freitas, A.; Medrades, J.; Ferreira, M. Simultaneous Determination of Catechol and Paraquat Using a Flexible Electrode of PBAT and Graphite Modified with Gold Nanoparticles and Copper Phthalocyanine (g-PBAT/AuNP/CuTsPc) LbL Film. J. Electrochem. Soc. 2022, 169, 27505. [Google Scholar] [CrossRef]
  12. Rosenberger, A.G.; Dragunski, D.C.; Muniz, E.C.; Módenes, A.N.; Alves, H.J.; Tarley, C.R.T.; Machado, S.A.S.; Caetano, J. Electrospinning in the preparation of an electrochemical sensor based on carbon nanotubes. J. Mol. Liq. 2020, 298, 112068. [Google Scholar] [CrossRef]
  13. Maciel, C.C.; de Lima, L.F.; Ferreira, A.L.; de Araujo, W.R.; Ferreira, M. Development of a flexible and disposable electrochemical sensor based on poly (butylene adipate-co-terephthalate) and graphite for hydroquinone sensing. Sens. Actuators Rep. 2022, 4, 100091. [Google Scholar] [CrossRef]
  14. Nasir, T.; Herzog, G.; Hébrant, M.; Despas, C.; Liu, L.; Walcarius, A. Mesoporous Silica Thin Films for Improved Electrochemical Detection of Paraquat. ACS Sens. 2018, 3, 484–493. [Google Scholar] [CrossRef] [PubMed]
  15. Sayyahmanesh, M.; Asgari, S.; Meibodi, A.S.E.; Ahooyi, T.M. Voltammetric Determination of Paraquat Using Graphite Pencil Electrode Modified with Doped Polypyrrole. Chem. Phys. 2016, 1, 1–11. [Google Scholar]
  16. Rashidipour, M.; Rasoulian, B.; Maleki, A.; Davari, B.; Pajouhi, N.; Mohammadi, E. Pectin/chitosan/tripolyphosphate encapsulation protects the rat lung from fibrosis and apoptosis induced by paraquat inhalation. Pestic. Biochem. Physiol. 2021, 178, 104919. [Google Scholar] [CrossRef]
  17. Maciel, C.C.; Barros, A.; Mazali, I.O.; Ferreira, M. Flexible biodegradable electrochemical sensor of PBAT and CNDs composite for the detection of emerging pollutants. J. Electroanal. Chem. 2023, 940, 117491. [Google Scholar] [CrossRef]
  18. Silva, J.S.; De Barros, A.; Constantino, C.J.L.; Simões, F.R.; Ferreira, M. Layer-by-layer films based on carbon nanotubes and polyaniline for detecting 2-chlorophenol. J. Nanosci. Nanotechnol. 2014, 14, 6586–6592. [Google Scholar] [CrossRef] [PubMed]
  19. Klunder, K.J.; Nilsson, Z.; Sambur, J.B.; Henry, C.S. Patternable Solvent-Processed Thermoplastic Graphite Electrodes. J. Am. Chem. Soc. 2017, 139, 12623–12631. [Google Scholar] [CrossRef]
  20. Perween, M.; Parmar, D.B.; Bhadu, G.R.; Srivastava, D.N. Polymer–graphite composite: A versatile use and throw plastic chip electrode. Analyst 2014, 139, 5919–5926. [Google Scholar] [CrossRef]
  21. Wei, Z.; Cai, C.; Huang, Y.; Wang, P.; Song, J.; Deng, L.; Fu, Y. Strong biodegradable cellulose materials with improved crystallinity via hydrogen bonding tailoring strategy for UV blocking and antioxidant activity. Int. J. Biol. Macromol. 2020, 164, 27–36. [Google Scholar] [CrossRef] [PubMed]
  22. Michalska, M.; Andrzejczuk, M.; Krawczyńska, A.; Roguska, A.; Nikiforow, K.; Żurek, P.; Sikora, A.; Peikertová, P. The effect of MWCNT modification on structural and morphological properties of Li4Ti5O12. Diam. Relat. Mater. 2021, 113, 108276. [Google Scholar] [CrossRef]
  23. Krajewski, M.; Liao, P.Y.; Michalska, M.; Tokarczyk, M.; Lin, J.Y. Hybrid electrode composed of multiwall carbon nanotubes decorated with magnetite nanoparticles for aqueous supercapacitors. J. Energy Storage 2019, 26, 101020. [Google Scholar] [CrossRef]
  24. Kim, G.M.; Kil, T.; Lee, H.K. A novel physicomechanical approach to dispersion of carbon nanotubes in polypropylene composites. Compos. Struct. 2021, 258, 113377. [Google Scholar] [CrossRef]
  25. Zaman, A.C.; Kaya, F.; Kaya, C. A study on optimum surfactant to multiwalled carbon nanotube ratio in alcoholic stable suspensions via UV–Vis absorption spectroscopy and zeta potential analysis. Ceram. Int. 2020, 46, 29120–29129. [Google Scholar] [CrossRef]
  26. MacLeod, A.J. A note on the Randles-Sevcik function from electrochemistry. Appl. Math. Comput. 1993, 57, 305–310. [Google Scholar] [CrossRef]
  27. Henstridge, M.C.; Laborda, E.; Dickinson, E.J.F.; Compton, R.G. Redox systems obeying Marcus–Hush–Chidsey electrode kinetics do not obey the Randles–Ševčík equation for linear sweep voltammetry. J. Electroanal. Chem. 2012, 664, 73–79. [Google Scholar] [CrossRef]
  28. Hernández-Pérez, L.; Carrillo-Abad, J.; Ortega, E.M.; Pérez-Herranz, V.; Montañés, M.T.; Martí-Calatayud, M.C. Voltammetric and electrodeposition study for the recovery of antimony from effluents generated in the copper electrorefining process. J. Environ. Chem. Eng. 2023, 11, 109139. [Google Scholar] [CrossRef]
  29. Shanmugasundaram, K.; Sai-Anand, G.; Gopalan, A.I.; Lee, H.G.; Yeo, H.K.; Kang, S.W.; Lee, K.P. Direct electrochemistry of cytochrome c with three-dimensional nanoarchitectured multicomponent composite electrode and nitrite biosensing. Sens. Actuators B Chem. 2016, 228, 737–747. [Google Scholar] [CrossRef]
  30. Kalinke, C.; Mangrich, A.S.; Marcolino-Junior, L.H.; Bergamini, M.F. Carbon Paste Electrode Modified with Biochar for Sensitive Electrochemical Determination of Paraquat. Electroanalysis 2016, 28, 764–769. [Google Scholar] [CrossRef]
  31. de Souza, D.C.; Orzari, L.O.; de Oliveira, P.R.; Kalinke, C.; Bonacin, J.A.; Malaspina, O.; Nocelli, R.C.F.; Janegitz, B.C. Electrochemical Sensor Based on Beeswax and Carbon Black Thin Biofilms for Determination of Paraquat in Apis mellifera Honey. Food Anal. Methods 2021, 14, 606–615. [Google Scholar] [CrossRef]
  32. Nematollahi, D.; Shayani-Jam, H.; Alimoradi, M.; Niroomand, S. Electrochemical oxidation of acetaminophen in aqueous solutions: Kinetic evaluation of hydrolysis, hydroxylation and dimerization processes. Electrochim. Acta 2009, 54, 7407–7415. [Google Scholar] [CrossRef]
  33. Kenne Dedzo, G.; Péguy Nanseu-Njiki, C.; Ngameni, E. Amperometric sensors based on sawdust film modified electrodes: Application to the electroanalysis of paraquat. Talanta 2012, 99, 478–486. [Google Scholar] [CrossRef] [PubMed]
  34. Ye, X.; Gu, Y.; Wang, C. Fabrication of the Cu2O/polyvinyl pyrrolidone-graphene modified glassy carbon-rotating disk electrode and its application for sensitive detection of herbicide paraquat. Sens. Actuators B Chem. 2012, 173, 530–539. [Google Scholar] [CrossRef]
  35. Garcia, L.L.C.; Figueiredo-Filho, L.C.S.; Oliveira, G.G.; Fatibello-Filho, O.; Banks, C.E. Square-wave voltammetric determination of paraquat using a glassy carbon electrode modified with multiwalled carbon nanotubes within a dihexadecylhydrogenphosphate (DHP) film. Sens. Actuators B Chem. 2013, 181, 306–311. [Google Scholar] [CrossRef]
  36. Miller, J.C.; Miller, J.N. Basic Statistical Methods for Analytical Chemistry Part 1. Statistics of Repeated Measurements. A review. Analyst 1988, 113, 1351–1356. [Google Scholar] [CrossRef]
  37. Ziegel, E.R. Statistics and Chemometrics for Analytical Chemistry. Technometrics 2004, 46, 498–499. [Google Scholar] [CrossRef]
  38. de Lima, L.F.; Daikuzono, C.M.; Miyazaki, C.M.; Pereira, E.A.; Ferreira, M. Layer-by-Layer nanostructured films of magnetite nanoparticles and polypyrrole towards synergistic effect on methylparaben electrochemical detection. Appl. Surf. Sci. 2020, 505, 144278. [Google Scholar] [CrossRef]
  39. Miyazaki, C.M.; Pereira, T.P.; Tavares Mascagni, D.B.; de Moraes, M.L.; Ferreira, M. Monoamine oxidase B layer-by-layer film fabrication and characterization toward dopamine detection. Mater. Sci. Eng. C-Mater. Biol. Appl. 2016, 58, 310–315. [Google Scholar] [CrossRef]
  40. Lettieri, R.; Cardova, L.; Gatto, E.; Mazzuca, C.; Monti, D.; Palleschi, A.; Placidi, E.; Drasar, P.; Venanzi, M. Hierarchical transfer of chiral information from the molecular to the mesoscopic scale by Langmuir-Blodgett deposition of tetrasteroid-porphyrins. New J. Chem. 2017, 41, 639–649. [Google Scholar] [CrossRef]
  41. Marangoni, V.S.; Martins, M.V.A.; Souza, J.A.; Oliveira, O.N.; Zucolotto, V.; Crespilho, F.N. The processing of polyelectrolyte-covered magnetite nanoparticles in the form of nanostructured thin films. J. Nanopart. Res. 2012, 14, 176. [Google Scholar] [CrossRef]
  42. Ribeiro, J.A.; Carreira, C.A.; Lee, H.J.; Silva, F.; Martins, A.; Pereira, C.M. Voltammetric determination of paraquat at DNA-gold nanoparticle composite electrodes. Electrochim. Acta 2010, 55, 7892–7896. [Google Scholar] [CrossRef]
  43. Buleandra, M.; Rabinca, A.A.; Mihailciuc, C.; Balan, A.; Nichita, C.; Stamatin, I.; Ciucu, A.A. Screen-printed Prussian Blue modified electrode for simultaneous detection of hydroquinone and catechol. Sens. Actuators B Chem. 2014, 203, 824–832. [Google Scholar] [CrossRef]
  44. de Sá, A.C.; Barbosa, S.C.; Raymundo-Pereira, P.A.; Wilson, D.; Shimizu, F.M.; Raposo, M.; Oliveira, O.N. Flexible carbon electrodes for electrochemical detection of bisphenol-a, hydroquinone and catechol in water samples. Chemosensors 2020, 8, 103. [Google Scholar] [CrossRef]
  45. Della Pelle, F.; Angelini, C.; Sergi, M.; Del Carlo, M.; Pepe, A.; Compagnone, D. Nano carbon black-based screen printed sensor for carbofuran, isoprocarb, carbaryl and fenobucarb detection: Application to grain samples. Talanta 2018, 186, 389–396. [Google Scholar] [CrossRef] [PubMed]
  46. Tan, X.; Hu, Q.; Wu, J.; Li, X.; Li, P.; Yu, H.; Li, X.; Lei, F. Electrochemical sensor based on molecularly imprinted polymer reduced graphene oxide and gold nanoparticles modified electrode for detection of carbofuran. Sens. Actuators B Chem. 2015, 220, 216–221. [Google Scholar] [CrossRef]
Figure 1. Outline of the gPBAT electrode modification procedure using LbL film gPBAT(PPY/CNT)n.
Chemosensors 11 00420 g001
Figure 2. Three LbL architectures in different (3 to 10) bilayer studies for gPBAT(PPY/CNT)n (A) CV and (B) EIS, gPBAT(PEI/CNT)n (C) CV and (D) EIS, and gPBAT(PVS/PPY)n (E) CV and (F) EIS. Conditions: CV was used over a potential range of −0.2 V to +0.6 V with a scan rate of 50 mV·s−1; EIS was employed over a frequency range of 0.1 Hz to 1 × 10⁵ Hz. All measurements were performed in 5.0 × 10⁻³ M K3[Fe(CN)6] medium containing 0.1 M KCl as a supporting electrolyte.
Chemosensors 11 00420 g002
Figure 3. Contact angle analysis: (A) gPBAT, (B) gPBAT(PPY/CNT)20 LbL film, (C) gPBAT(PEI/CNT)20 LbL film, and (D) gPBAT(PVS/PPY)20 LbL film. Morphological analysis using SEM: (E) gPBAT, (F) gPBAT(PPY/CNT)20, (G) gPBAT(PEI/CNT)20, and (H) gPBAT(PVS/PPY)20. FTIR spectra, (I) The changes in the gPBAT electrode after coating with the three types of nanostruc-tured LbL film.
Chemosensors 11 00420 g003
Figure 4. Raman analysis from three different spots on the LbL electrode surface for the following electrodes: (A) gPBAT/PEI/CNT, (B) gPBAT/CNT/PPY, and (C) gPBAT/PVS/PPY.
Chemosensors 11 00420 g004
Figure 5. Comparison of gPBAT(PPY/CNT)7, gPBAT(PEI/CNT)7, and gPBAT(PVS/PPY)7 architectures and gPBAT (pure) for CV (A) and EIS (B) parameters. Conditions: CV was used in the potential range of −0.2 V to +0.6 V with a scan rate of 50 mV·s−1; EIS was employed in the frequency range of 0.1 Hz to 1 × 10⁵ Hz. All measurements were performed in 5 mM K3[Fe(CN)6] medium containing 0.1 M KCl as a supporting electrolyte.
Chemosensors 11 00420 g005
Figure 6. (A) DPV profiles for PQ at 0.50 µM in the 0.1 M PBS solution, pH (2.0–7.0), using the gPBAT(PPY/CNT)7 electrode. (B) Effect of pH value on current density and anodic potential peaks for PQ (DPV conditions: scan rate 50 mV·s−1 and potential range from −0.75 V to 0.40 V).
Chemosensors 11 00420 g006
Figure 7. (A) Electrochemical response for PQ sensor obtained with DPV curves in 0.1 mM PBS (pH = 6.0) using gPBAT(PPY/CNT)7 electrochemical sensor with a concentration ranging from 0.1 to 2.1 µM (a to k). (B) The analytical curve obtained for PQ detection is based on the electrochemical response according to DPV measurements. (C) Electrochemical reaction mechanism proposed for PQ compound [33,34]. DPV conditions: sweep rate: 50 mV·s−1, amplitude 0.08, and potential range −0.80 V to 0.20 V.
Chemosensors 11 00420 g007
Table 1. Conditions for the LbL architecture fabrication. The concentrations for the PPY, CNT, PEI, and PVS solutions used were 0.1 mg mL−1, 0.01 mg mL−1; 1.0 mg mL−1, and 1.0 mg mL−1, respectively, at pH 3.0 in HCl solution.
ArchitecturesFirst LayerWashing Second Layer
gPBAT(PPY/CNT)n PPY (5 min)HCl solution pH 3.0 (30 s)CNT (5 min)
gPBAT(PEI/ CNT)n PEI (3 min)HCl solution pH 3.0 (30 s)CNT (5 min)
gPBAT(PVS/PPY)nPVS (3 min)HCl solution pH 3.0 (30 s)PPY (5 min)
Table 2. Zeta potential of LbL films at pH 7.
Filmζ-Potential (mV)
gPBAT(PPY/CNT)7−65.19
gPBAT(PEI/CNT)7−65.14
gPBAT(PVS/PPY)7−50.52
Table 3. Electrochemical parameters obtained for LbL electrodes and gPBAT (pure) in CV and EIS measurements. The geometric areas were 0.25 cm2 for all electrodes.
Parameters
Electrode UnitJ (mA/cm²)Rct (KΩ cm2)A (cm²)k0 (cm s−1)
gPBAT(PPY/CNT)71.41 ± 7.07 × 10−20.16 ± 0.020.843.96 × 10−4
gPBAT(PEI/CNT)70.84 ± 4.52 × 10−20.31 ± 0.040.703.60 × 10−4
gPBAT(PVS/PPY)70.31 ± 1.20 × 10−20.37 ± 0.080.362.16 × 10−4
g-PBAT 0.69 ± 4.80 × 10−20.33 ± 0.050.523.38 × 10−4
Table 4. Performance comparison of other sensors with the electrode proposed in this work.
Working ElectrodeSampleLinear Range (μM)LOD (µM)Reference
AuNPs/DNA/GEPQ5–10001.3[42]
GPE/PPY MICPPQ5–500.22[15]
Micro-Cu2O/PVP-GNs/GC-RDEPQ1–2000.26[34]
gPBAT/AuNPPQ100–20001.31[11]
gPBAT(PPY/CNT)7PQ0.1–2.10.073This work
Table 5. Determination of PQ in artificial water samples.
SampleAdded (mM)Found (mM)Recovery (%)
PQ0.500.55109.2
1.001.03103.4
1.701.6999.4
Disclaimer/Publisher’s Note: The statements, opinions and data contained in all publications are solely those of the individual author(s) and contributor(s) and not of MDPI and/or the editor(s). MDPI and/or the editor(s) disclaim responsibility for any injury to people or property resulting from any ideas, methods, instructions or products referred to in the content.

