Article

A DFT Study on Adsorption of SF6 Decomposition Products on Zr-MOF-808

1
State Key Laboratory of Alternate Electrical Power System with Renewable Energy Sources, North China Electric Power University, Baoding 071003, China
2
Hebei Provincial Key Laboratory of Power Transmission Equipment Security Defence, North China Electric Power University, Baoding 071003, China
*
Author to whom correspondence should be addressed.
Chemosensors 2023, 11(7), 402; https://doi.org/10.3390/chemosensors11070402
Submission received: 6 June 2023 / Revised: 7 July 2023 / Accepted: 15 July 2023 / Published: 18 July 2023
(This article belongs to the Section Materials for Chemical Sensing)

Abstract

:
Identifying the main byproducts of SF6 decomposition proves to be an effective strategy for determining the nature and severity of internal discharge faults in gas-insulated switchgears (GISs). In this research, it was suggested to utilize the coordination polymer Zr-MOF-808 as a sensor for the main byproducts of SF6 decomposition. This study examined the adsorption of SF6 and its main decomposition products (CF4, CS2, SO2, SO2F2, and SOF2) on Zr-MOF-808, utilizing Gaussian16 simulation software through a method anchored on quantum chemistry. Adsorption parameters were calculated and analyzed, including binding energy, charge transfer, adsorption distance, along with variations in bond length, bond angle, density of states, and frontier orbital of gas molecules. Our research indicated that the Zr-MOF-808 cluster demonstrated varying degrees of chemical adsorption for the six gases, leading to differential conductivity changes in each system following adsorption. Consequently, the detection of resistance value alterations in the materials would allow for the identification of the gas products.

1. Introduction

Metal–organic frameworks (MOFs), a novel class of coordination polymer materials, have seen extensive research over the past twenty years since their initial conceptual introduction [1,2,3,4]. They have emerged as excellent foundations for a variety of high-performing materials and applications [5,6,7,8]. The unique structures and properties of MOFs derive from the versatility in their design [9,10], their structural diversity and malleability [11,12,13], their customizable pore size, and their high specific surface area and pore volume [14,15]. These characteristics render them significant for applications in gas storage and separation, catalysis, energy storage for batteries, bio-medicine, among others [16,17,18,19,20,21,22,23]. Typically, MOFs’ distinctive properties show promise for addressing industrial application challenges such as CO2 capture, flue gas scrubbing, and enhancing natural gas (NG) and refinery off-gas (ROG) [24,25,26,27,28]. Nevertheless, limited research exists on the use of MOFs in power systems, particularly concerning the adsorption behavior of SF6 decomposition products like CF4, CS2, SO2, SOF2, SO2F2, and other gases, on MOFs materials.
SF6 gas finds extensive use as an arc-quenching medium in GISs. Unforeseen internal malfunctions in GISs usually stem from insulation defects, with early insulation failures potentially leading to partial discharges (PDs). During the operation of the equipment, these faults could instigate the decomposition of SF6 into lower fluorine sulfides (SFn, n = 1–5) [29,30,31]. Given the presence of minute amounts of O2 and H2O, these lower fluorine sulfides could further react to yield SO2, SOF2, SO2F2, and other primary products [32,33,34]. Should surface discharges occur in the basin insulator, SFn might produce CF4, CS2, and the like [35,36]. As such, detecting the types and concentrations of discharged SF6 decomposition products becomes critical for an early identification of equipment fault types and for a prompt evaluation of the GISs’ insulation level and operational status [37,38,39].
Gas sensors serve as efficient instruments for detecting SF6 decomposition products. Gas-sensitive materials, forming the core of this method, have garnered considerable interest from researchers over the past two decades. A study conducted by Yang, A. et al. revealed that infusing different noble metals into CeO2 nanoparticles can be an effective approach for engineering high-performance gas sensors for identifying SF6 decomposition products [40]. Research by Wang, Y. et al. demonstrated that the (101) polyhedron of the metal oxide TiO2, when altered with Pt(III), significantly enhanced the adsorption of SO2, SO2F2 and SOF2 [41]. Investigating the modification of the metal sulfide MoS2, Liu, H. et al. performed a comprehensive study on the adsorption properties and sensing behavior of an Ir-modified MoS2 monolayer for H2S, SO2, and SO2F2 using Density Functional Theory (DFT) [42]. Wang, X. et al. discovered that a Rh-doped HfSe2 monolayer exhibited good adsorption performance for SO2 gas [43]. Chen, D. et al. confirmed that graphene doped with different elements displayed effective adsorption performance for SF6 decomposition component gases [44,45]. Despite the impressive gas-sensing properties of these modified nanomaterials, the design and flexibility of inorganic materials are somewhat restricted, thereby limiting their potential for further development. As a novel category of coordination polymer, MOFs materials, thanks to their superior properties, are anticipated to offset the deficiencies of the aforementioned materials.
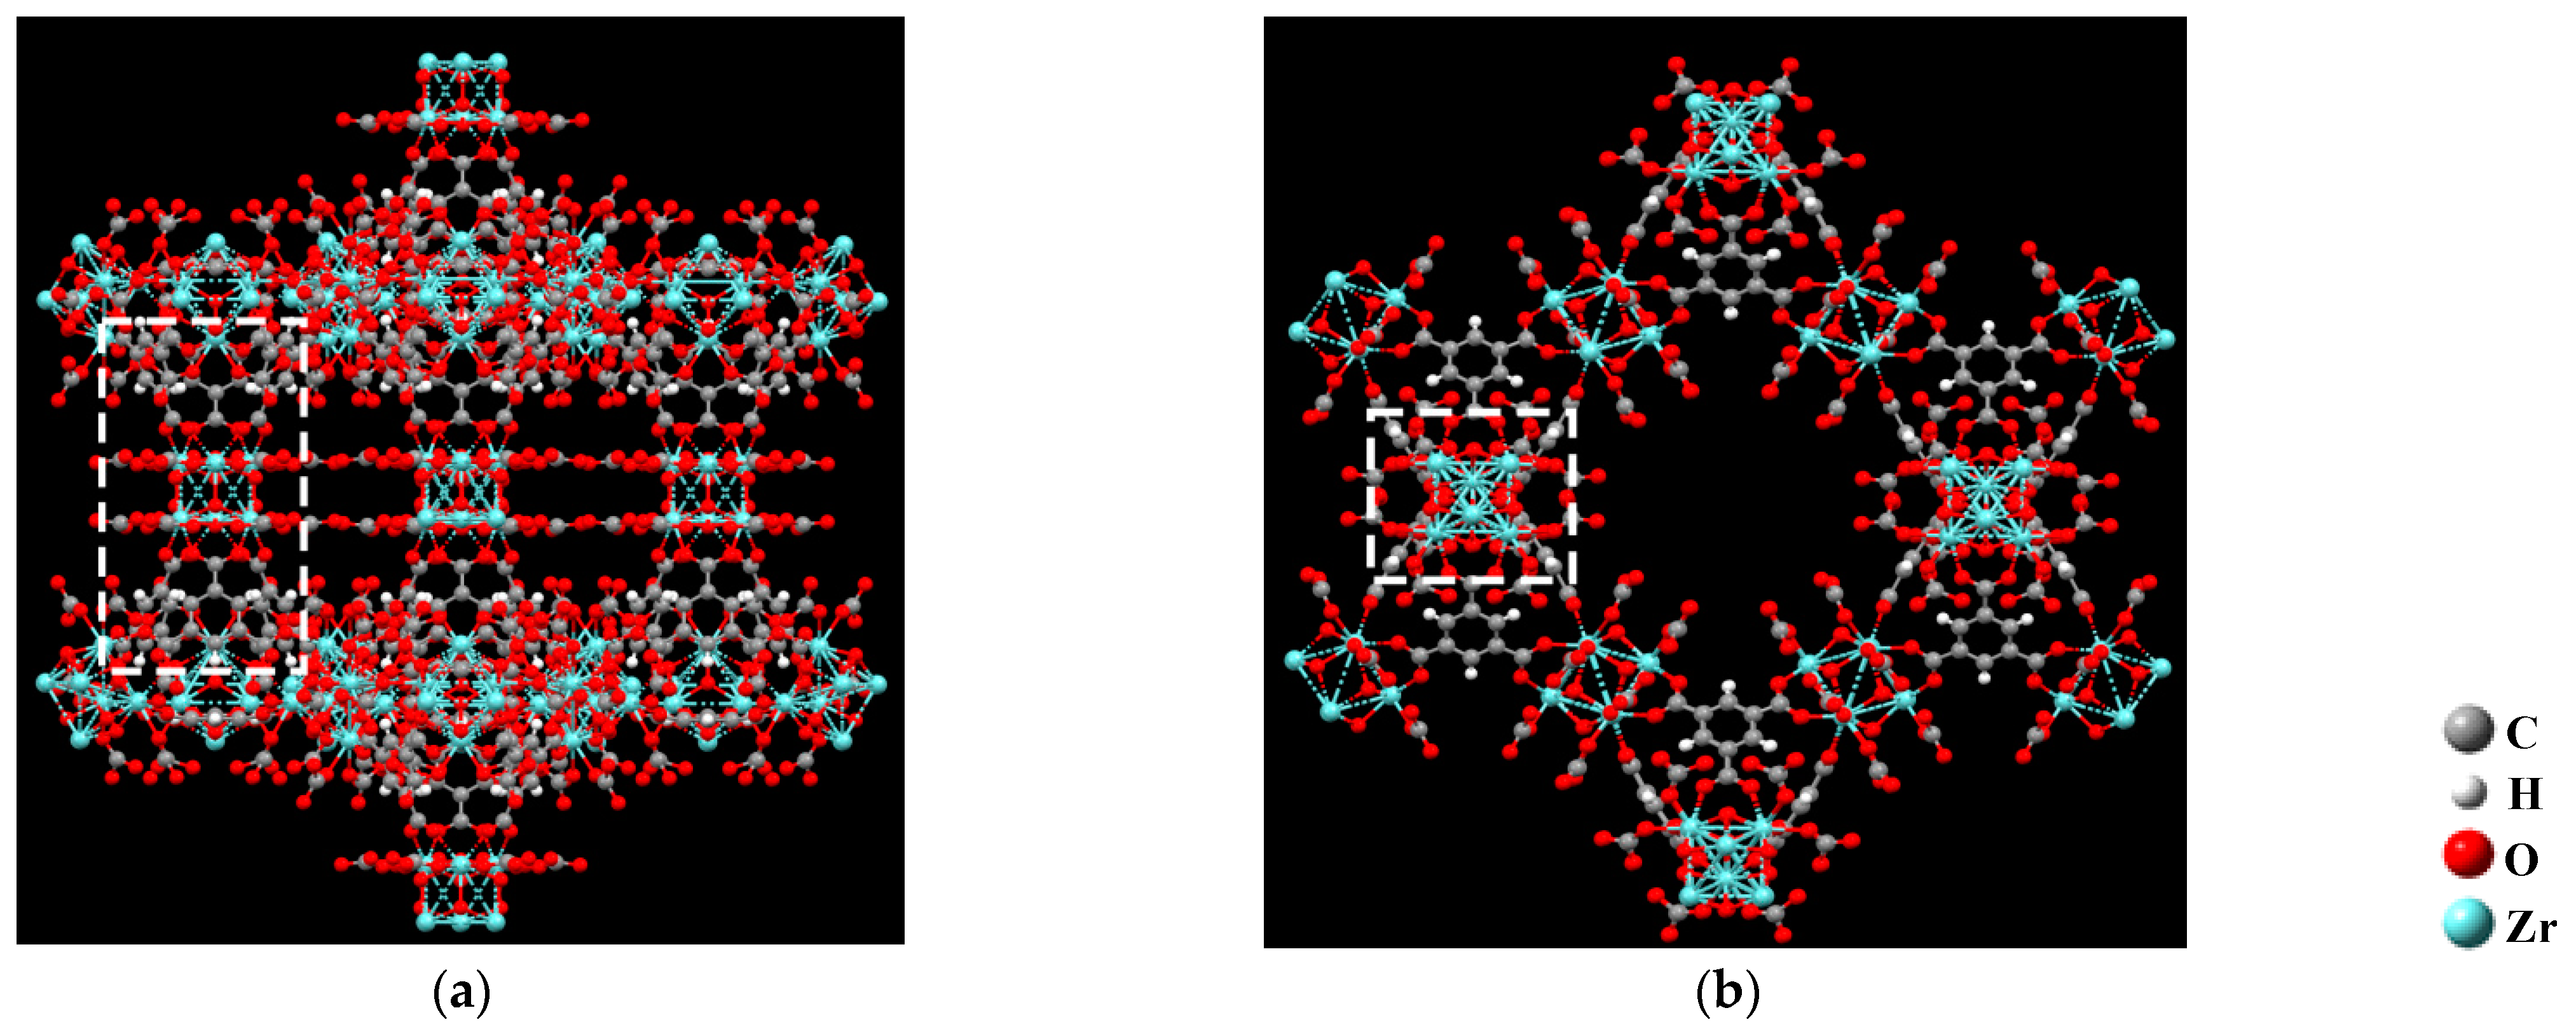
Zr-MOF-808, a novel coordination polymer material, employs Zr4+ as the central ion and 1,3,5 tribenzoic acid as the ligand. A detailed investigation conducted by Furukawa, H. et al. elaborated on the preparation methodology and structural analysis of Zr-MOF-808. Their research demonstrated that acid radical ions coordinated with Zr atoms, presenting themselves in an unordered manner as monodentate and bidentate ligands. Zr-MOF-808 exhibits a 6,3-connected three-dimensional structure, forming a tetrahedral cage with an interior pore size of 0.48 nm (Figure 1a). The unique design of these tetrahedral cages allows Zr-MOF-808 to establish a large adamantane cage, having an internal pore size of 1.84 nm (Figure 1b) via vertex sharing [46]. Its crystal structure is presently documented in the Cambridge structure database (DOI: 10.5517/cc12nc8c). A review of the crystal structure information file (CIF) in CCDC1002672 determined that the metal ion/ligand ratio in a Zr-MOF-808 unit cell stands at 39:8.
As this is a gas-sensing material, its crisscross pore structure with pore sizes of 0.48 nm and 1.84 nm creates a structural basis for the entry of six gas molecules—SF6, CF4, CS2, SO2, SO2F2, and SOF2—into the pores of the material (Figure 2). In these pores, the unsaturated coordination transition metal Zr4+ allows gas adsorption. This study explored the application of MOFs materials from a new perspective. For the first time, the coordination polymer Zr-MOF-808 was used as a gas-sensing material. The adsorption behaviors of discharged SF6 decomposition products on this material were studied and analyzed with a simulation method based on the principles of quantum chemistry. The application prospects of Zr-MOF-808 as an online gas-sensitive material for detecting SF6 decomposition products were theoretically predicted, which provided new ideas for research on the engineering applications of MOFs materials.

2. Calculation Methods

The modeling involved in this study was completed in the GaussView software, and the structural optimization and single-point adsorption calculation were performed with the Gaussian 16 software. In the application of Gaussian series in quantum chemistry simulation software, Sciortino, G. et al. found that PBE0 had a higher accuracy than those of B3LYP, BP86, and other functionals in the calculation of Ni (II) complexes. Def2-tzvp performed better than the LANL2DZ basis set [47]. The research on Debefve conducted by L.M. et al. showed that a combination of the PBE0 functional and def-tzvp performed best in the geometric optimization of mononuclear platinum complexes based on the DFT principle. In this study, we use the same exchange-correlation functional, basis set, and van der Waals action correction algorithm as in our previous research study [48]. We set the charge to 0 and the spin multiplicity to 1.
According to the .cif file in CCDC, there are 3800 atoms, 6272 chemical bonds, and 96 polyhedrons in each periodic structural unit of Zr-MOF-808. In order to simplify the calculation, Cluster 1 (Figure 3a) and Cluster 2 (Figure 3b) were extracted from the periodic structure of Zr-MOF-808 to simulate the adsorption states of gas molecules in pores with sizes of 0.48 nm and 1.84 nm, respectively. Then, we deleted one carboxyl group from each of the two saturated Zr atoms on the two clusters to simulate the unsaturated coordination metal sites generated during the synthesis of Zr-MOF-808.
Cluster 1 is a shared vertex of two tetrahedral cages. The core of Cluster 1 consists of six Zr atoms in an octahedral shape, and each Zr atom is connected to two benzene rings by carboxyl groups. The central region, which is wrapped in three benzene rings, forms the 0.48 nm pore of the tetrahedral cage. Upon deleting one of the carboxyl groups connected to the benzene ring and two Zr atoms, we analyzed the adsorption characteristics of gas molecules in the 0.48 nm pores. Cluster 2 is an octahedral cage comprising six Zr atoms and adjacent carboxyl groups. Upon deleting a carboxyl group near the 1.84 nm pore, the adsorption characteristics of gas molecules in the macropores of Zr-MOF-808 were simulated. The optimized clusters and molecular gas models are shown in Figure 4.
We calculate the binding energy (Ebinding) to reflect the changes in the total energy of each system during the adsorption process, which can reflect the strength of the adsorption interaction between the gas molecule and the Zr-MOF-808 cluster.
Ebinding = EMOF-gas + EBSSE − EMOF − Egas,
In Equation (1), EMOF-gas is the total energy of the system after Zr-MOF-808 adsorbed the gas molecules, and EBSSE is the corrected value of the basis-set superposition error (BSSE) throughout the counterpoise method proposed by Boys and Bernardi [49]. EMOF is the total energy of the Zr-MOF-808 clusters before adsorption, and Egas is the total energy of the gas molecules before adsorption.
We describe the gain and loss of electrons in the gas molecules and the Zr-MOF-808 cluster during the adsorption process by the transfer charge of the gas molecules.
Δ Q = Q 1 Q 2 ,
In Equation (2), ΔQ represents the charge transfer of the system, with Q1 signifying the charge of the gas molecules post-adsorption and Q2 indicating the charge of the gas molecules prior to adsorption. A positive ΔQ infers that the gas molecule has gained electrons, while a negative ΔQ suggests electron loss by the gas molecule.
The definition of the adsorption distance lies in the gap between a gas molecule and a Zr-MOF-808 adsorption site.
To obtain the density-of-states (DOS) curve, a Gaussian function was employed to broaden the discrete orbital occupation diagram. Further analysis of the gases’ chemical adsorption on Zr-MOF-808 was carried out using the total density of states, the gas density of states, and the local density of states.

3. Results and Discussion

The adsorption point calculations in this study were conducted by bringing six gas molecules perpendicularly close to the unsaturated Zr atoms in the Zr-MOF-808 clusters. Once the calculations converged, the binding energy and charge transfer were extracted, and the adsorption distance, bond length, and bond angle changes of the gas molecules were quantified using GaussView. The discrete orbital occupation information was imported into Multiwfn, broadened by Gaussian functions, and then plotted into continuous DOS curves to analyze the hybridization phenomena between atoms.

3.1. Parameters of Adsorption

The adsorption energies, charge transfer, and adsorption distance in the adsorption processes of the six gas molecules—SF6, CF4, CS2, SO2, SO2F2, and SOF2—on Zr-MOF-808 clusters are listed in Table 1.
According to the adsorption energy calculated with Formula (1) in this study, the relationships between the adsorption capacities of Cluster 1 and Cluster 2 for each gas were SO2 > SO2F2 > SOF2 > CS2 > SF6 > CF4. It can be seen from the slight difference in the adsorption energy values that the benzene ring had little effect on the adsorption energy, which is consistent with the results reported in the literature [50].
It can be seen in Formula (2) that the gas molecules lost electrons during the adsorption process, and Clusters 1 and 2 gained electrons. The gas transfer charge for Cluster 1 and 2 were the same throughout the adsorption process. After adsorption, the distance between gas molecules and metal sites in each system was also the same. Based on the comprehensive adsorption energy values, it could be speculated that when there were unsaturated Zr coordination atoms in the pores, the gas molecules were less affected by adsorption with different pore sizes.
Therefore, in the following, we only use Cluster 1 as the adsorption substrate to show the IGMH model and to analyze the changes in the bond length, bond angle, density of states, and frontier molecular orbital of gas molecules.

3.2. IGMH Model of the System after Adsorption

In recent years, the independent gradient model (IGM) method has become more and more popular in the visual analysis of intramolecular and intermolecular interactions. However, when IGM maps are used to study weak interactions on graphs, the isosurfaces are usually too convex, which may lead to errors in the analysis conclusions. An IGM based on the Hirshfeld molecular density partition (IGMH) was proposed by Tian, L. et al. to replace the free-state atomic density involved in the IGM method [51].
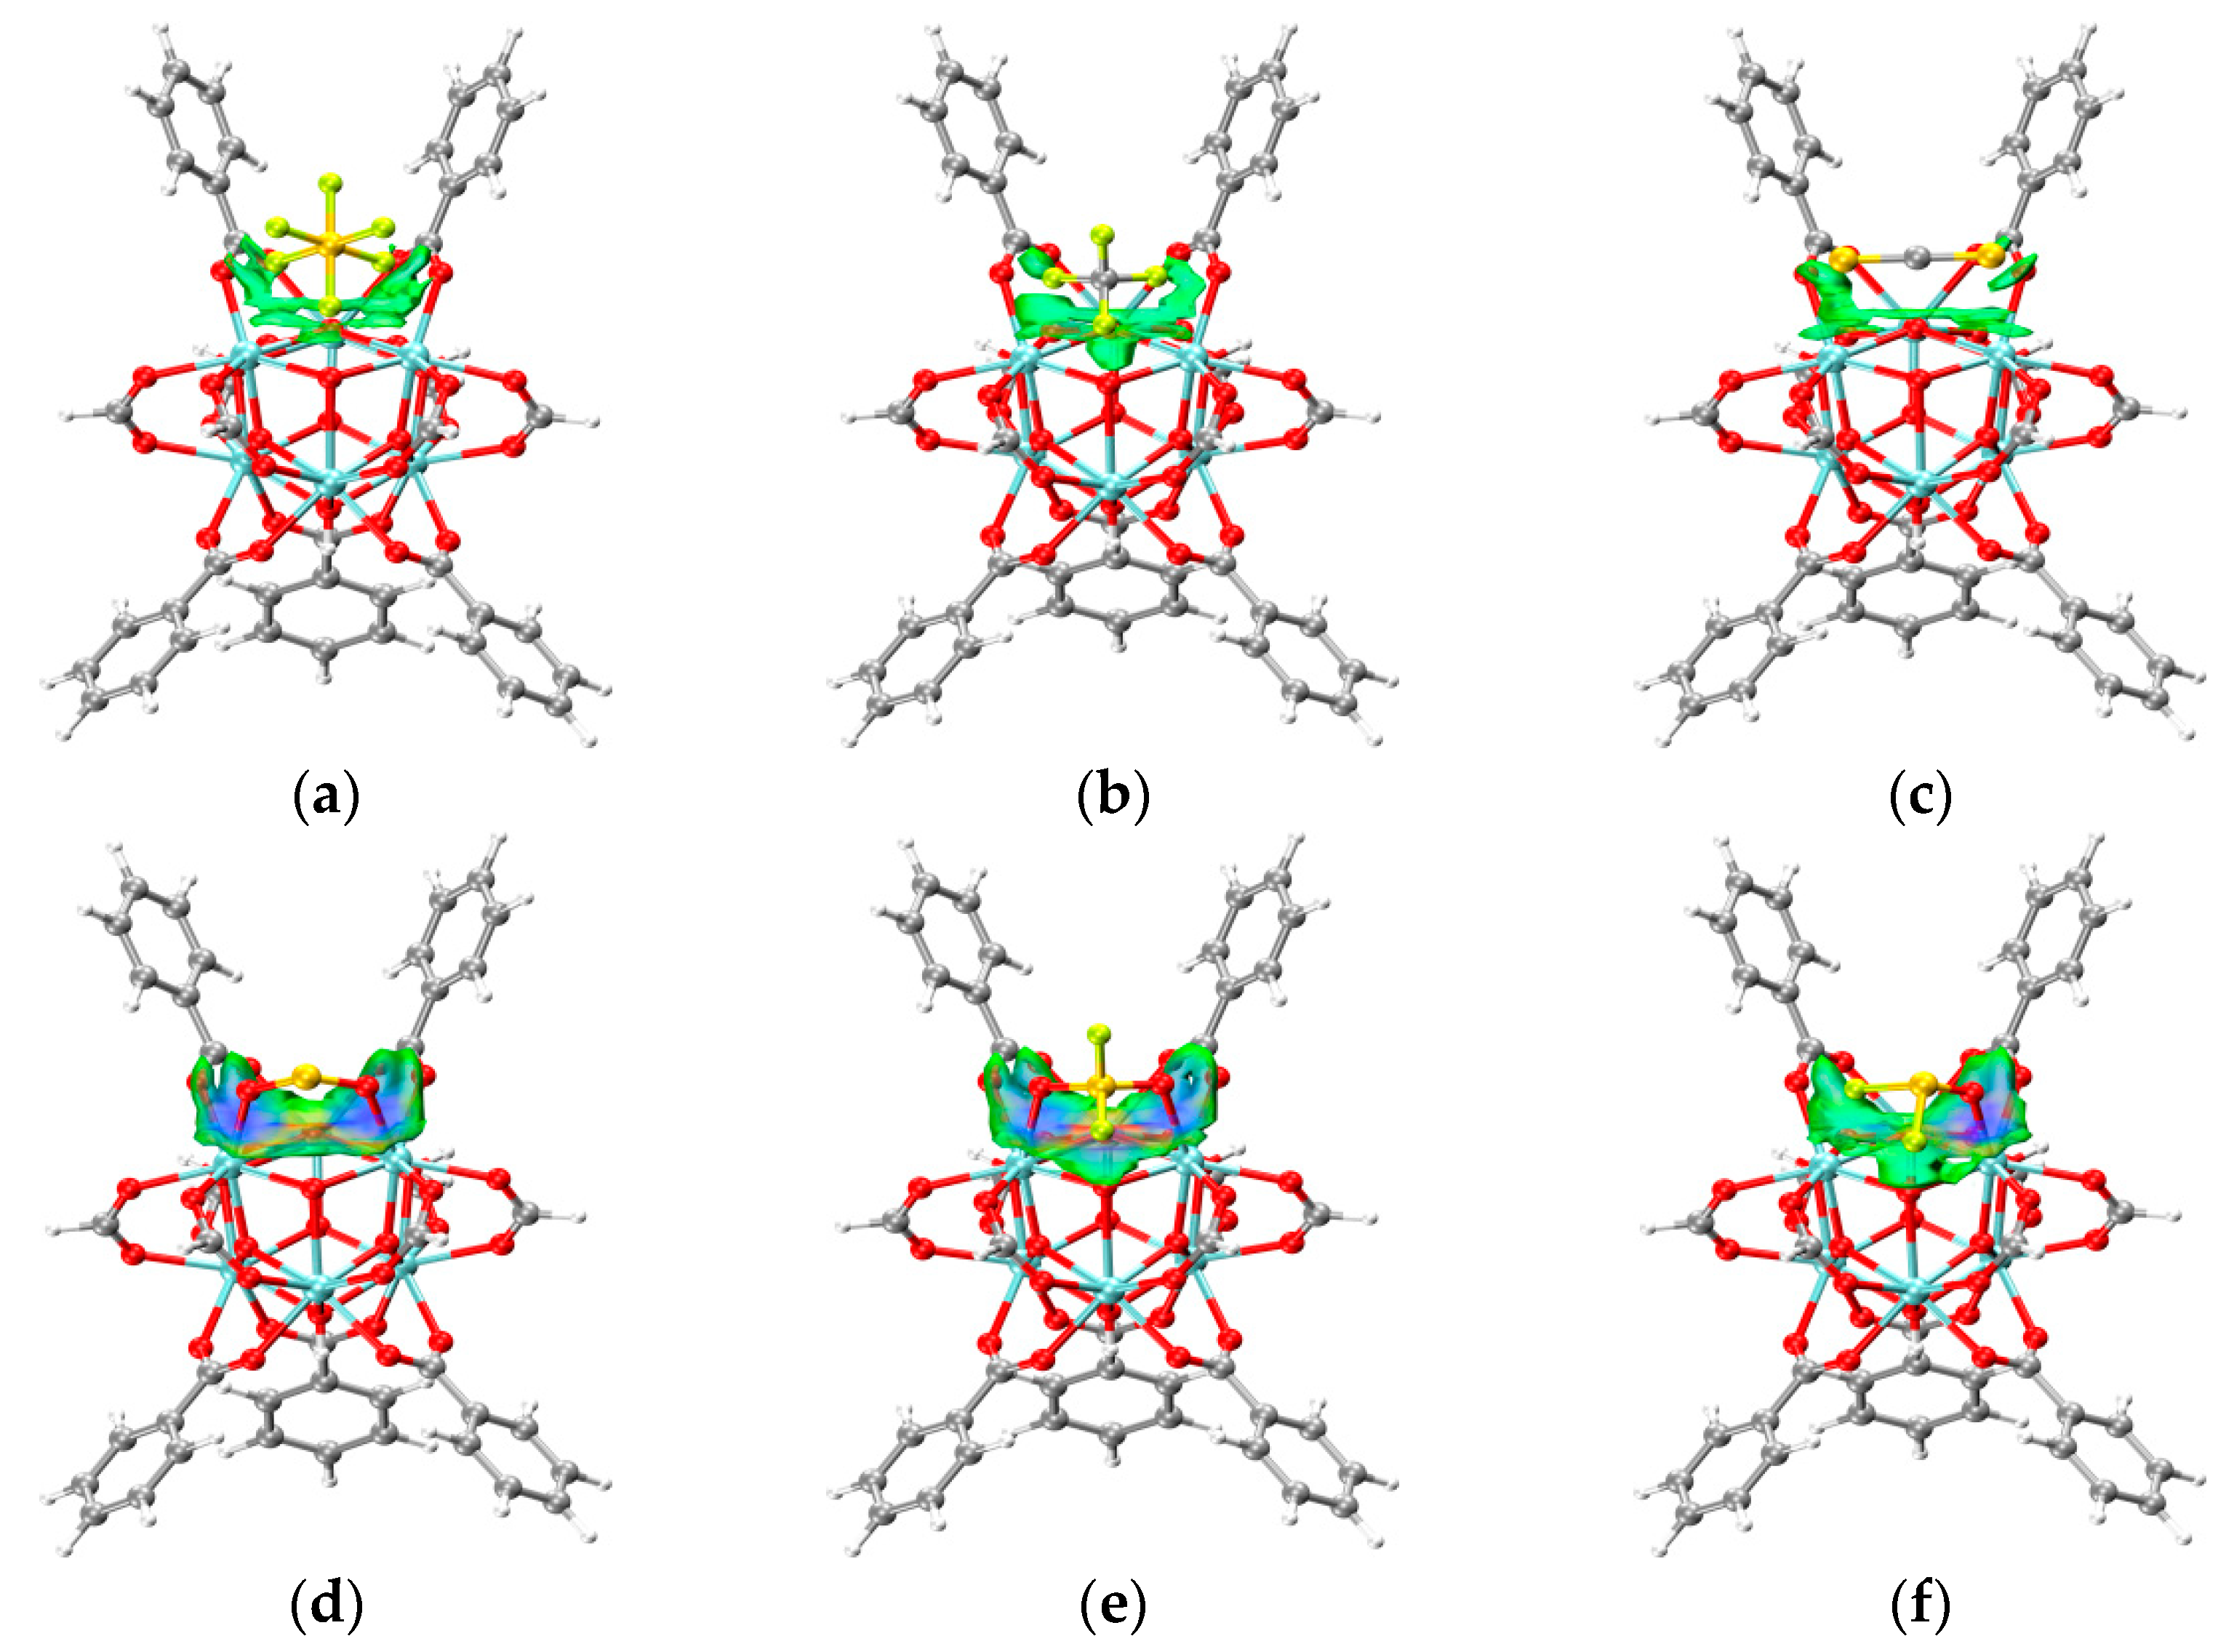
We used the sign(λ2)ρ function to project the type and intensity of interaction onto the isosurfaces of δg, δg_inter, and δg_intra with different colors. It can be seen from the colors of the isosurfaces in Figure 5a–c that the F atoms and S atoms in the CF4, SF6, and CS2 gases had weak interactions with the Zr atoms in the adsorbed substrate. There was a strong interaction between O atoms in SO2, SO2F2, and SOF2 gases and the Zr atoms in the adsorbed substrate (Figure 5d–f).

3.3. Changes in Bond Length and Bond Angle after the Adsorption of Gas Molecules

The changes in bond length and angle of the SF6, CF4, CS2, SO2, SO2F2, and SOF2 gas molecules before and after adsorption are shown in the Supplementary Material (Tables S1–S12).
There were slight changes in the bond lengths and bond angles of the six gas molecules due to adsorption, and the obvious changes in the bond angle (the atomic numbers are shown in Figure 4c–h are the following: The F(3)-S(1)-F(2) bond angle in SF6 decreased by 1.2°; the O(2)-S(1)-O(1) bond angle in SO2 decreased by 1.1°; the O(1)-S(1)-F(2) and O(2)-S(1)-F(2) bond angles in SO2F2 decreased by 2.21° and 2.24°, respectively, while the O(2)-S(1)-O(1) bond angle increased by 2.77°; the F(2)-S(1)-F(1) and O(1)-S(1)-F(1) bond angles in SOF2 increased by 1.43° and 1.46°.
The changes in the bond length and bond angle before and after the adsorption of these six gas molecules, together with the adsorption energy, adsorption distance, transfer charge, and IGMH model of each system after adsorption, strongly proved that the gas molecules and the adsorption substrate had different interactions.

3.4. The Changes in the Orbital Occupation of Each System before and after Gas Adsorption

Pomogaeva, A.V. et al. furnished a comprehensive account of how to transport the orbital occupation computation outcomes from Gaussian 16 software into the wave function analysis tool Multiwfn, in order to acquire discrete orbital occupation data at varying energy levels. Upon broadening with a Gaussian function, a continuous density of states (DOS) map can be generated [52].
This method is applied in this paper to analyze the congruence of the DOS curves of Zr’s 5s and 4d orbitals on Zr-MOF-808 with those of the outer orbitals of the active site atoms of SF6, CF4, CS2, SO2, SO2F2, and SOF2 gas molecules. This analysis assists in studying the hybridization occurrence between the cluster and gas molecules during the adsorption process.
  • The changes in the DOS of Zr-MOF-808 Cluster 1 after SF6 adsorption are shown in Figure 6a–c.
The changes in the DOS of Zr-MOF-808 cluster 1 after SF6 adsorption are shown in Figure 6a–c. Compared to the cluster before SF6 adsorption, a new DOS peak appears near the −2.02 eV position of the TDOS curve after gas adsorption, and the curve shows minor changes near energy positions such as 2.80 eV and 3.20 eV (Figure 6a). As combined with Figure 6b, it is known that the aforementioned changes in the TDOS curve are contributed by the SF6 molecules adsorbed by the cluster. Further comparison analysis of the PDOS curves (Figure 6c) concludes that the PDOS curves of the 4d orbitals of Zr atoms overlap with those of 2p orbitals of F atoms in −2.36~−1.70 eV section. This indicates that there is an orbital hybridization effect between Zr atoms and F atoms, which further reveals the chemical adsorption effect of cluster 1 on SF6.
2.
The changes in the DOS of Zr-MOF-808 Cluster 1 after CF4 adsorption are shown in Figure 7a–c.
Compared to the cluster before CF4 adsorption, a new DOS peak appears near the −2.02 eV position of the TDOS curve after gas adsorption, and the curve shows very minor changes at energy positions of 4.08 eV and 4.88 eV (Figure 7a). As combined with Figure 7(b), it is known that the aforementioned changes in the TDOS curve are contributed by the CF4 molecules adsorbed by the cluster. After further comparison analysis of the PDOS curves of the outer electrons of the atoms at the interaction points of the cluster and CF4 molecules (Figure 7c), it can be concluded that there is no overlap in the PDOS curves of the outer electron orbits of Zr atoms and F atoms in 21.76~5.44 eV section. This indicates that there is no orbital hybridization effect between Zr atoms and F atoms, which further reveals that there is basically no chemical adsorption effect of Cluster 1 on CF4.
3.
The changes in the DOS of Zr-MOF-808 Cluster 1 after CS2 adsorption are shown in Figure 8a–c.
Compared to the cluster before CS2 adsorption, a new DOS peak appears near the −2.32 eV position of the TDOS curve after gas adsorption, and the curve shows minor changes at energy positions such as −8.00 eV, −2.32 eV, and −0.65 eV (Figure 8a). As combined with Figure 8b, it is known that the aforementioned changes in the TDOS curve are contributed by the CS2 molecules adsorbed by the cluster. After further comparison analysis of the PDOS curves of the outer electrons of the atoms at the interaction points of the cluster and CS2 molecules (Figure 8c), it can be concluded that the PDOS curves of the 5s and 4d orbitals of Zr atoms overlap with the ones of 3p orbitals of S atoms in −2.62~−2.10 eV section. This indicates that there is an orbital hybridization effect between Zr atoms and S atoms, which further reveals the chemical adsorption effect of Cluster 1 on CS2.
4.
The changes in the DOS of Zr-MOF-808 Cluster 1 after SO2 adsorption are shown in Figure 9a–c.
Compared to the cluster before SO2 adsorption, a new DOS peak appears near the −4.80 eV position of the TDOS curve after gas adsorption, and the curve shows minor changes at energy positions such as −4.80 eV, 0.35 eV, and 2.79 eV (Figure 9a). As combined with Figure 9b, it is known that the aforementioned changes in the TDOS curve are contributed by the SO2 molecules adsorbed by the cluster. After further comparison analysis of the PDOS curves of the outer electrons of the atoms at the interaction points of the cluster and SO2 molecules (Figure 9c), it can be concluded that the PDOS curves of the 5s and 4d orbitals of Zr atoms overlap with the ones of 2p orbitals of O atoms in −5.16~−4.45 eV section. This indicates that there is an orbital hybridization effect between Zr atoms and O atoms, which further reveals the chemical adsorption effect of Cluster 1 on SO2.
5.
The changes in the DOS of Zr-MOF-808 Cluster 1 after SO2F2 adsorption are shown in Figure 10a–c.
Compared to the cluster before SO2F2 adsorption, no new DOS peak appears in the TDOS curve after gas adsorption, but the curve shows minor changes near energy positions such as −1.33 eV, 0.28 eV, and 1.73 eV (Figure 10a). As combined with Figure 10b, it is known that the aforementioned changes in the TDOS curve are contributed by the SO2F2 molecules adsorbed by the cluster. After further comparison analysis of the PDOS curves of the outer electrons of the atoms at the interaction points of the cluster and SO2F2 molecules (Figure 10c), it can be concluded that the DOS curves of the 4d orbitals of Zr atoms overlap with the ones of 2p orbitals of O atoms in −1.72~−1.01 eV sections. This indicates that there is an orbital hybridization effect between Zr atoms and O atoms, which further reveals the chemical adsorption effect of cluster 1 on SO2F2.
6.
The changes in the DOS of Zr-MOF-808 Cluster 1 after SOF2 adsorption are shown in Figure 11a–c.
Compared to the cluster before SOF2 adsorption, a new DOS peak appears near the −2.33 eV position of the TDOS curve after gas adsorption, and the curve shows minor changes at energy positions such as −2.33 eV, −1.28 eV, and 1.74 eV (Figure 11a). As combined with Figure 11b, it is known that the aforementioned changes in the TDOS curve are contributed by the SOF2 molecules adsorbed by the cluster. After further comparison analysis of the PDOS curves of the outer electrons of the atoms at the interaction points of the cluster and SOF2 molecules (Figure 11c), it can be concluded that the DOS curves of the 4d orbitals of Zr atoms overlap with those of 2p orbitals of O atoms and the 2p orbitals of F atoms in the −2.65~−2.01 eV section. This indicates that there is an orbital hybridization effect between Zr atoms, O atoms, and F atoms, which further reveals the chemical adsorption effect of Cluster 1 on SOF2.

3.5. Conductivity Analysis

In this section, the change in conductivity of the cluster after gas adsorption is qualitatively analyzed by calculating the HOMO-LUMO gap of the Zr-MOF-808 cluster before and after the adsorption process. Pham, H.Q. and other researchers have concluded that the electronic band structure of the MOFs periodic system can be reflected by the first-principles calculation of the organic linkers in a time-saving and simple way [53]. This conclusion is drawn from the comparison between the calculated values of the HOMO-LUMO gap of the organic linkers in MOFs materials and the experimental band gap values in the literature.
Therefore, we selected Cluster 1, which contains five benzene rings (organic linkers), as the object of analysis. By comparing the changes in the HOMO-LUMO gap before and after the adsorption process in each system, we can speculate on the impact of gas adsorption on the conductivity of Zr-MOF-808 material.
The changes in the HOMO–LUMO gap showed that when the Zr-MOF-808 clusters adsorbed these gases, the conductivity of each system had different degrees of change (as shown in Figure 12). The HOMO–LUMO gap of the CF4 and SO2F2 systems increased, and the conductivity decreased. The conductivity of the other systems increased, and the increase in the SO2 system was the most obvious.
Thus, it can be postulated that in real-world applications, when a resistance-type gas sensor, having Zr-MOF-808 as the gas-sensitive material, is used to evaluate whether SF6 has decomposed, the composition of the gas could be analyzed. This can be accomplished by comparing the resistance response variations of the material to the six gases under identical sensor electrode preparation conditions, the same gas flow rate, and an equal measurement temperature.

4. Conclusions

In this study, two clusters of Zr-MOF-808 material and six types of gas molecules (SF6, CF4, CS2, SO2, SO2F2, SOF2) were modeled by using GaussView software. The adsorption performance of the two Zr-MOF-808 clusters towards gases was simulated using Gaussian16 software, which is based on the principles of quantum chemistry. The main conclusions are as follows:
The Zr-MOF-808 cluster exhibits different adsorption characteristics for each gas molecule. Among the factors affecting the adsorption properties, the unsaturated coordination Zr atom contributes the most, while the benzene ring contributes the least. The clusters perform the same adsorption characteristics for the six gas molecules in the 0.48 nm and 1.84 nm pores of the Zr-MOF-808 structure. In addition, during the adsorption process, Zr atoms in the cluster exhibit electron-gaining behavior, while gas molecules exhibit electron-losing behavior. Furthermore, the adsorption effect causes minor changes in the bond length and bond angle of the gas molecules.
It is concluded from the changes in TDOS and the overlap of PDOS curves that the adsorption of Zr-MOF-808 clusters to CF4 belongs to the category of physical adsorption, while the adsorption to the other five gases belongs to chemical adsorption.
Changes in the HOMO-LUMO gap indicate that the chemical adsorption of gases by Zr-MOF-808 material leads to changes in the system’s conductivity. By comparing the difference in response of this material to the mixed gas in GISs and pure SF6 gas, it can be determined whether there is a fault inside the equipment.
Therefore, through detailed theoretical calculations in this study, Zr-MOF-808 is expected to become a gas-sensitive material for detecting SF6 discharge decomposition component gases.

Supplementary Materials

The following supporting information can be downloaded at: https://www.mdpi.com/article/10.3390/chemosensors11070402/s1, Table S1: The bond length changes of SF6 molecules after adsorption; Table S2: The bond angle changes of SF6 molecules after adsorption; Table S3: The bond length changes of CF4 molecules after adsorption; Table S4: The bond angle changes of CF4 molecules after adsorption; Table S5: The bond length changes of CS2 molecules after adsorption; Table S6: The bond angle changes of CS2 molecules after adsorption; Table S7: The bond length changes of SO2 molecules after adsorption; Table S8: The bond angle changes of SO2 molecules after adsorption; Table S9: The bond length changes of SO2F2 molecules after adsorption; Table S10: The bond angle changes of SO2F2 molecules after adsorption; Table S11: The bond length changes of SOF2 molecules after adsorption; Table S12: The bond angle changes of SOF2 molecules after adsorption.

Author Contributions

Methodology, visualization, formal analysis and writing—original draft, T.L.; supervision, F.L.; validation and investigation, F.L. and B.J.; conceptualization and supervision, T.L. and F.L.; visualization and supervision, F.L.; software and validation, T.L., F.L. and B.J.; supervision, writing—review and editing, F.L. and B.J. All authors have read and agreed to the published version of the manuscript.

Funding

This research was funded by Research and Application of SF6 Decomposition Component Detection Sensor Technology Based on Modified Nanomaterials, Electric Power Research Institute of Hainan Power Grid Co., Ltd.(730002021030103HH00008).

Institutional Review Board Statement

Not applicable.

Informed Consent Statement

Not applicable.

Data Availability Statement

Not applicable.

Conflicts of Interest

The authors declare no conflict of interest.

References

  1. Yaghi, O.M.; Li, H. Hydrothermal Synthesis of a Metal-Organic Framework Containing Large Rectangular Channels. J. Am. Chem. Soc. 1995, 117, 10401–10402. [Google Scholar] [CrossRef]
  2. Yaghi, O.M.; O’keeffe, M.; Ockwig, N.W.; Chae, H.K.; Eddaoudi, M.; Kim, J. Reticular synthesis and the design of new materials. Nature 2003, 423, 705–714. [Google Scholar] [CrossRef] [PubMed]
  3. Katayama, Y.; Kalaj, M.; Barcus, K.S.; Cohen, S.M. Self-Assembly of MOF Nanoparticle Monolayer sand Free-Standing Multilayers. J. Am. Chem. Soc. 2019, 141, 20000–20003. [Google Scholar] [CrossRef] [PubMed]
  4. Bi, S.; Banda, H.; Chen, M.; Niu, L.; Chen, M.; Wu, T.; Wang, J.; Wang, R.; Feng, J.; Chen, T.; et al. Molecular understanding of charge storage and charging dynamics in supercapacitors with MOF electrodes and ionic liquid electrolytes. Nat. Mater. 2020, 19, 552–558. [Google Scholar] [CrossRef] [PubMed]
  5. Kirchon, A.; Feng, L.; Drake, H.F.; Joseph, E.A.; Zhou, H.-C. From fundamentals to applications: A toolbox for robust and multifunctional MOF materials. Chem. Soc. Rev. 2018, 47, 8611–8638. [Google Scholar] [CrossRef]
  6. Hosono, N.; Uemura, T. Development of Functional Materials via Polymer Encapsulation into Meta-Organic Frameworks. B. Chem. Soc. JPN. 2021, 94, 2139–2148. [Google Scholar] [CrossRef]
  7. Gonzalez, M.I.; Turkiewicz, A.B.; Darago, L.E.; Oktawiec, J.; Bustillo, K.; Grandjean, F.; Long, G.J.; Long, J.R. Confinement of atomically defined-metal halide sheets in a metal-organic framework. Nature 2020, 577, 64–68. [Google Scholar] [CrossRef]
  8. Reddy, R.C.K.; Lin, J.; Chen, Y.; Zeng, C.; Lin, X.; Cai, Y.; Su, C.-Y. Progress of nanostructured metal oxides derived from metal-organic frameworks as anode materials for lithium-ion Batteries. Coordin. Chem. Rev. 2020, 420, 213434. [Google Scholar] [CrossRef]
  9. Luo, L.; Lo, W.-S.; Si, X.; Li, H.; Wu, Y.; An, Y.; Zhu, Q.; Chou, L.-Y.; Li, T.; Tsung, C.-K. Directional Engraving within SingleCrystalline Metal-Organic Framework Particles via Oxidative Linker Cleaving. J. Am. Chem. Soc. 2019, 141, 20365–20370. [Google Scholar] [CrossRef]
  10. Feng, L.; Yuan, S.; Zhang, L.-L.; Tan, K.; Li, J.-L.; Kirchon, A.; Liu, L.-M.; Zhang, P.; Han, Y.; Chabal, Y.J.; et al. Creating Hierarchical Pores by Controlled Linker Thermolysis in Multivariate Metal-Organic Frameworks. J. Am. Chem. Soc. 2018, 140, 2363–2372. [Google Scholar] [CrossRef] [Green Version]
  11. Karadeniz, B.; Žili, D.; Huskic, I.; Germann, L.S.; Fidelli, A.M.; Muratović, S.; Lončarić, I.; Etter, M.; Dinnebier, R.E.; Barišić, D.; et al. Controlling the polymorphism and topology transformation in porphyrinic zirconium metal-organic frameworks via mechanochemistry. J. Am. Chem. Soc. 2019, 141, 19214–19220. [Google Scholar] [CrossRef]
  12. Han, Y.; Chen, Y.; Ma, Y.; Bailey, J.; Wang, Z.; Lee, D.; Sheveleva, A.M.; Tuna, F.; McInnes, E.J.L.; Frogley, M.D.; et al. Control of the pore chemistry in metal-organic frameworks for efficient adsorption of benzene and separation of benzene/cyclohexane. Chem 2023, 9, 739–754. [Google Scholar] [CrossRef]
  13. Xu, W.; Thapa, K.B.; Ju, Q.; Fang, Z.; Huang, W. Heterogeneous catalysts based on mesoporous metal-organic frameworks. Coordin. Chem. Rev. 2018, 373, 199–232. [Google Scholar]
  14. Chen, B.; Eddaoudi, M.; Hyde, S.T.; O’Keeffe, M.; Yaghi, O.M. Interwoven metal-organic framework on a periodic minimal surface with extra-large pores. Science 2001, 291, 1021–1023. [Google Scholar] [CrossRef] [Green Version]
  15. Wen, Y.; Zhang, J.; Xu, Q.; Wu, X.-T.; Zhu, Q.-L. Pore surface engineering of metal-organic frameworks for heterogeneous catalysis. Coordin. Chem. Rev. 2018, 376, 248–276. [Google Scholar] [CrossRef]
  16. Hou, C.-C.; Xu, Q. Metal-Organic Frameworks for Energy. Adv. Energy Mater. 2018, 9, 1801307. [Google Scholar] [CrossRef]
  17. Fu, X.-P.; Wang, Y.-L.; Zhang, X.-F.; Krishna, R.; He, C.-T.; Liu, Q.-Y.; Chen, B. Collaborative pore partition and pore surface fluorination within a metal-organic framework for high-performance C2H2/CO2 separation. Chem. Eng. J. 2022, 432, 134433. [Google Scholar] [CrossRef]
  18. Tu, T.N.; Nguyen, H.T.D.; Tran, N.T. Tailoring the pore size and shape of the one-dimensional channels in iron-based MOFs for enhancing the methane storage capacity. Inorg. Chem. Front. 2019, 6, 2441–2447. [Google Scholar] [CrossRef]
  19. Wang, B.; Zhang, X.; Huang, H.; Zhang, Z.; Yildirim, T.; Zhou, W.; Xiang, S.; Chen, B. A microporous aluminum-based metal-organic framework for high methane, hydrogen, and carbon dioxide storage. Nano Res. 2021, 14, 507–511. [Google Scholar] [CrossRef]
  20. Li, J.; Han, X.; Zhang, X.; Sheveleva, A.M.; Cheng, Y.; Tuna, F.; McInnes, E.J.L.; McCormick McPherson, L.J.; Teat, S.J.; Daemen, L.L.; et al. Capture of nitrogen dioxide and conversion to nitric acid in a porous metal-organic framework. Nat. Chem. 2019, 11, 1085–1090. [Google Scholar] [CrossRef] [Green Version]
  21. Peng, S.; Bie, B.; Sun, Y.; Liu, M.; Cong, H.; Zhou, W.; Xia, Y.; Tang, H.; Deng, H.; Zhou, X. Metal-organic frameworks for precise inclusion of single-stranded DNA and transfection in immune cells. Nat. Commun. 2018, 9, 1293. [Google Scholar] [CrossRef] [PubMed] [Green Version]
  22. Li, H.; Lv, N.; Xue, L.; Liu, B.; Feng, J.; Ren, X.; Guo, T.; Chen, D.; Stoddart, J.F.; Gref, R.; et al. Composite CD-MOF nanocrystals-containing micro-spheres for sustained drug delivery. Nanoscale 2017, 9, 7454–7463. [Google Scholar] [CrossRef] [PubMed] [Green Version]
  23. Zhao, Y.; Zhuang, S.; Liao, L.; Wang, C.; Xia, N.; Gan, Z.; Gu, W.; Li, J.; Deng, H.; Wu, Z. A Dual Purpose Strategy to Endow Gold Nanoclusters with Both Catalysis Activity and Water Solubility. J. Am. Chem. Soc. 2020, 142, 973–977. [Google Scholar] [CrossRef]
  24. Zeng, L.; Wang, Z.; Wang, Y.; Wang, J.; Guo, Y.; Hu, H.; He, X.; Wang, C.; Lin, W. Photo-Activation of Cu Centers in Metal-Organic Frame- works for Selective CO2 Conversion to Ethanol. J. Am. Chem. Soc. 2020, 142, 75–79. [Google Scholar] [CrossRef]
  25. Liang, W.; Bhatt, P.M.; Shkurenko, A.; Adil, K.; Mouchaham, G.; Aggarwal, H.; Mallick, A.; Jamal, A.; Belmabkhout, Y.; Eddaoudi, M. A Tailor-Made Interpenetrated MOF with Exceptional Carbon-Capture Performance from Flue Gas. Chem 2019, 5, 950–963. [Google Scholar] [CrossRef] [Green Version]
  26. Gupta, N.K.; López-Olvera, A.; González-Zamora, E.; Martínez-Ahumada, E.; Ibarra, I.A. Sulfur Dioxide Capture in Metal-Organic Frameworks, Metal-Organic Cages, and Porous Organic Cages. ChemPlusChem 2022, 87, e202200131. [Google Scholar] [CrossRef] [PubMed]
  27. Brandt, P.; Nuhnen, A.; Lange, M.; Möllmer, J.; Weingart, O.; Janiak, C. Metal-Organic Frameworks with Potential Application for SO2 Separation and Flue Gas Desulfurization. ACS Appl. Mater. Inter. 2019, 11, 17350–17358. [Google Scholar] [CrossRef] [PubMed]
  28. Belmabkhout, Y.; Bhatt, P.M.; Adil, K.; Pillai, R.S.; Cadiau, A.; Shkurenko, A.; Maurin, G.; Liu, G.; Koros, W.J.; Eddaoudi, M. Natural gas upgrading using a fluorinated MOF with tuned H2S and CO2 adsorption selectivity. Nat. Energy 2018, 3, 1059–1066. [Google Scholar] [CrossRef]
  29. Zhuang, Y.; Hu, X.; Tang, B.; Wang, S.; Cui, A.; Hou, K.; He, Y.; Zhu, L.; Li, W.; Chu, J. Effects of SF6 decomposition components and concentrations on the discharge faults and insulation defects in GIS equipment. Sci. Rep. 2020, 10, 15039. [Google Scholar] [CrossRef]
  30. Cho, Y.S.; Hong, T.Y.; Youn, Y.W.; Sun, J.H.; Lee, S.-H. Study on the Correlation between Partial Discharge Energy and SF6 Decomposition Gas Generation. Energies 2020, 13, 4655. [Google Scholar] [CrossRef]
  31. Zeng, F.; Lei, Z.; Yang, X.; Tang, J.; Yao, Q.; Miao, Y. Evaluating DC Partial Discharge with SF6 Decomposition Characteristics. IEEE Trans. Power Deliv. 2019, 34, 1383–1392. [Google Scholar] [CrossRef]
  32. Rao, X.; Tang, J.; Zeng, F.; Li, D.; Xia, X.; Su, Y.; Lu, Y. Mechanism of Trace O2 on SF6 Characteristic Decomposed Components Under Spark Discharge. Plasma Chem. Plasma Process. 2020, 40, 469–481. [Google Scholar] [CrossRef]
  33. Liu, M. Decomposing Mechanism of SF6 under Positive DC Partial Discharge in the Presence of Trace H2O. ACS Omega 2020, 5, 13389–13395. [Google Scholar] [CrossRef]
  34. Tang, J.; Zeng, F.; Zhang, X.; Pan, J.; Yao, Q.; Hou, X.; Tang, Y. Relationship between Decomposition Gas Ratios and Partial Discharge Energy in GIS, and the Influence of Residual Water and Oxygen. IEEE Trans. Dielectr. Electr. Insul. 2014, 21, 1226–1234. [Google Scholar] [CrossRef]
  35. Zhang, X.; Tian, S.; Xiao, S.; Huang, Y.; Liu, F. Partial discharge decomposition characteristics of typical defects in the gas chamber of SF6 insulated ring network cabinet. IEEE Trans. Dielectr. Electr. Insul. 2017, 24, 1794–1801. [Google Scholar] [CrossRef]
  36. Beyer, C.; Jenett, H.; Kfockow, D. Influence of Reactive SFx, Gases on Electrode Surfaces After Electrical Discharges under SF6, Atmosphere. IEEE Trans. Dielectr. Electr. Insul. 2000, 7, 234–240. [Google Scholar] [CrossRef]
  37. Ammar, S.M.; Zulkurnain, A.-M.; Rai, N.A. SF6 Decomposed Component Analysis for Partial Discharge Diagnosis in GIS: A Review. IEEE Access 2022, 10, 27270–27288. [Google Scholar]
  38. Tang, J.; Yang, X.; Yang, D.; Yao, Q.; Miao, Y.; Zhang, C.; Zeng, F. Using SF6 Decomposed Component Analysis for the Diagnosis of Partial Discharge Severity Initiated by Free Metal Particle Defect. Energies 2017, 10, 1119. [Google Scholar] [CrossRef] [Green Version]
  39. Zeng, F.; Tang, J.; Zhang, X.; Xie, Y.; Yao, Q.; Miao, Y. Reconstructing and extracting information on SF6 decomposition characteristic components induced by partial overthermal fault in GIE. IEEE Trans. Dielectr. Electr. Insul. 2016, 23, 183–193. [Google Scholar] [CrossRef]
  40. Yang, A.; Li, W.; Chu, J.; Wang, D.; Yuan, H.; Zhu, J.; Wang, X.; Rong, M. Enhanced sensing of sulfur hexafluoride decomposition components based on noble-metal-functionalized cerium oxide. Mater. Design 2020, 187, 08391. [Google Scholar] [CrossRef]
  41. Wang, Y.; Gui, Y.; Ji, C.; Tang, C.; Zhou, Q.; Li, J.; Zhang, X. Adsorption of SF6 decomposition components on Pt3-TiO2(101) surface: A DFT study. Appl. Surf. Sci. 2018, 459, 242–248. [Google Scholar] [CrossRef]
  42. Liu, H.; Wang, F.; Hu, K.; Li, T.; Yan, Y.; Li, J. The adsorption and sensing performances of Ir-modified MoS2 monolayer toward SF6 decomposition products: A DFT study. Nanomaterials 2021, 11, 100. [Google Scholar] [CrossRef] [PubMed]
  43. Wang, X.; Liao, Y. Selective detection of SO2 in SF6 insulation devices by Rh- doped HfSe2 monolayer: A first-principles study. Appl. Phys. A Mater. 2019, 125, 468. [Google Scholar] [CrossRef]
  44. Chen, D.; Zhang, X.; Tang, J.; Cui, H.; Chen, Z.; Li, Y. Different doping of penta-graphene as adsorbent and gas sensing material for scavenging and detecting SF6 decomposed species. Sustain. Mater. Technol. 2019, 21, e00100. [Google Scholar] [CrossRef]
  45. Chen, D.; Tang, J.; Zhang, X.; Fang, J.; Li, Y.; Zhuo, R. Detecting decompositions of sulfur hexafluoride using reduced graphene oxide decorated with Pt nanoparticles. J. Phys. D Appl. Phys. 2018, 51, 185304. [Google Scholar] [CrossRef]
  46. Furukawa, H.; Gándara, F.; Zhang, Y.-B.; Jiang, J.; Queen, W.L.; Hudson, M.R.; Yaghi, O.M. Water Adsorption in Porous Metal–Organic Frameworks and Related Materials. J. Am. Chem. Soc. 2014, 136, 4369–4381. [Google Scholar] [CrossRef]
  47. Sciortino, G.; Lihi, N.; Czine, T.; Maréchal, J.-D.; Lledós, A.; Garribba, E. Accurate prediction of vertical electronic transitions of Ni(II) coordination compounds via time dependent density functional theory. Int. J. Quantum Chem. 2018, 118, e25655. [Google Scholar] [CrossRef]
  48. Lei, T.X.; Fan, X.Z.; Lv, F.C.; Jiang, B.W. Theoretical Study on Adsorption Behavior of SF6 Decomposition Components on Mg-MOF-74. Nanomaterials 2023, 13, 1705. [Google Scholar] [CrossRef]
  49. Zhang, X.; Wu, J.; Yan, H.; Chen, H.; Mao, W.; Dai, G. Insight into the nature of the noncovalent interactions of furan, pyridine, and pyrazine with AtX. J. Mol. Model. 2023, 29, 13. [Google Scholar] [CrossRef]
  50. Li, S.; Zhu, S.; Zhou, Q.; Gui, Y.; Wei, X. Adsorption mechanism of decomposition gas of SF6 circuit breaker on MOF-505 analogue. Vacuum 2021, 183, 109816. [Google Scholar] [CrossRef]
  51. Tian, L.; Qinxue, C. Independent gradient model based on Hirshfeld partition (IGMH): A new method for visual study of interactions in chemical systems. J. Comput. Chem. 2022, 43, 539–555. [Google Scholar]
  52. Pomogaeva, A.V.; Scheer, M.; Timoshkin, A.Y. Why Do B–P and Al–P Polymers Differ? Structures, Stability, and Electronic Properties of Chain and Ring [H2PEH2]n Oligomers (E=B, Al; n = 1–15). Chem. Eur. J. 2018, 24, 17046–17054. [Google Scholar] [CrossRef] [PubMed]
  53. Pham, H.Q.; Mai, T.; Pham-Tran, N.-N. Engineering of Band Gap in Metal-Organic Frameworks by Functionalizing Organic Linker: A Systematic Density Functional Theory Investigation. J. Phys. Chem. C 2014, 118, 4567–4577. [Google Scholar] [CrossRef]
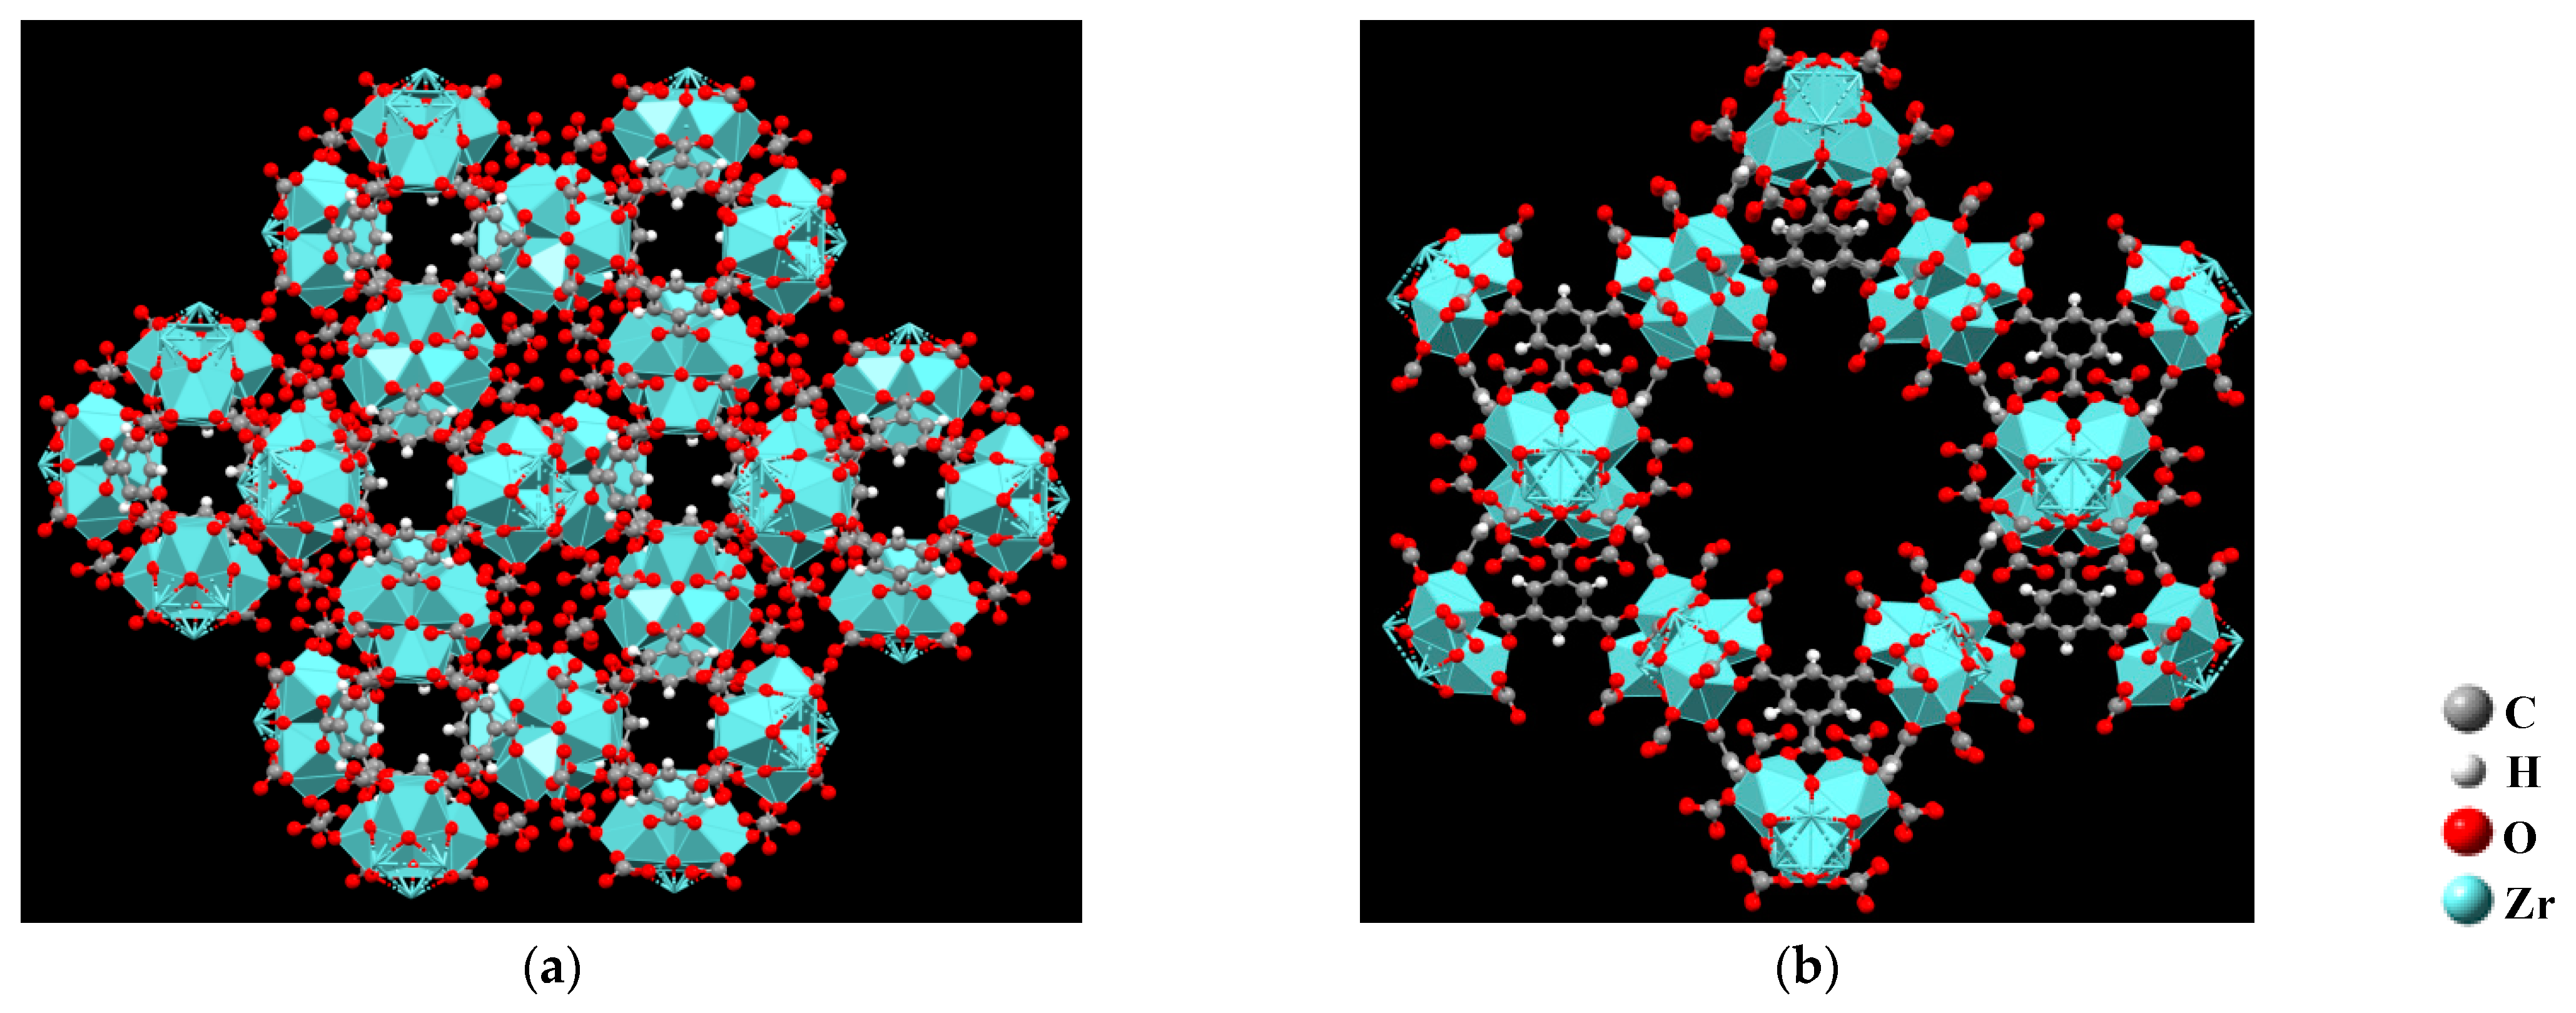
Figure 1. Two pore sizes of Zr-MOF-808: (a) 0.48 nm; (b) 1.84 nm.
Chemosensors 11 00402 g001
Figure 2. Adsorption simulation of six gases in Zr-MOF-808 pores.
Chemosensors 11 00402 g002
Figure 3. Two pore sizes of Zr-MOF-808: (a) Cluster 1; (b) Cluster 2.
Chemosensors 11 00402 g003
Figure 4. Structure optimized model of Cluster1, Cluster2, and gases: (a) Cluster 1; (b) Cluster 2; (c) SF6; (d) CF4; (e) CS2; (f) SO2;(g) SO2F2; (h) SOF2.
Chemosensors 11 00402 g004
Figure 5. IGMH model of gas molecules on Zr-MOF-808 cluster: (a) SF6; (b) CF4; (c) CS2; (d) SO2; (e) SO2F2; (f) SOF2.
Chemosensors 11 00402 g005
Figure 6. DOS changes of Cluster 1 after adsorbing SF6: (a) TDOS curves of Zr-MOF-808 Cluster 1 before and after gas adsorption; (b) The contribution of Cluster 1 and SF6 molecules in the TDOS curve after adsorption; (c) The outer electron PDOS curves of Zr and F atoms.
Chemosensors 11 00402 g006
Figure 7. DOS changes of Cluster 1 after adsorbing CF4: (a) TDOS curves of Zr-MOF-808 Cluster 1 before and after gas adsorption; (b) The contribution of Cluster 1 and CF4 molecules in the TDOS curve after adsorption; (c) The outer electron PDOS curves of Zr and F atoms.
Chemosensors 11 00402 g007
Figure 8. DOS changes of Cluster 1 after adsorbing CS2: (a) TDOS curves of Zr-MOF-808 Cluster 1 before and after gas adsorption; (b) The contribution of Cluster 1 and CS2 molecules in the TDOS curve after adsorption; (c) The outer electron PDOS curves of Zr and S atoms.
Chemosensors 11 00402 g008
Figure 9. DOS changes of Cluster 1 after adsorbing SO2: (a) TDOS curves of Zr-MOF-808 Cluster 1 before and after gas adsorption; (b) The contribution of Cluster 1 and SO2 molecules in the TDOS curve after adsorption; (c) The outer electron PDOS curves of Zr and O atoms.
Chemosensors 11 00402 g009
Figure 10. DOS changes of Cluster 1 after adsorbing SO2F2: (a) TDOS curves of Zr-MOF-808 Cluster 1 before and after gas adsorption; (b) The contribution of cluster 1 and SO2F2 molecules in the TDOS curve after adsorption; (c) The outer electron PDOS curves of Zr and O atoms.
Chemosensors 11 00402 g010
Figure 11. DOS changes of Cluster 1 after adsorbing SOF2: (a) TDOS curves of Zr-MOF-808 Cluster 1 before and after gas adsorption; (b) The contribution of Cluster 1 and SOF2 molecules in the TDOS curve after adsorption; (c) The outer electron PDOS curves of Zr and O atoms.
Chemosensors 11 00402 g011
Figure 12. The frontier molecular orbital distributions of Zr-MOF-808 after adsorbing gas molecules.
Chemosensors 11 00402 g012
Table 1. Adsorption energies, charge transfer, and adsorption distance.
ClusterGasSF6CF4CS2SO2SO2F2SOF2
Cluster 1Adsorption energy (eV)−0.218−0.223−0.354−0.544−0.526−0.399
transfer charge (e)0.1500.1450.1470.3210.2990.282
Adsorption distance (Å)3.0833.0773.2352.2232.5622.532
Cluster 2Adsorption energy (eV)−0.225−0.218−0.338−0.599−0.518−0.451
transfer charge (e)0.1500.1450.1470.3210.2990.282
Adsorption distance (Å)3.0833.0773.2352.2232.5622.532
Disclaimer/Publisher’s Note: The statements, opinions and data contained in all publications are solely those of the individual author(s) and contributor(s) and not of MDPI and/or the editor(s). MDPI and/or the editor(s) disclaim responsibility for any injury to people or property resulting from any ideas, methods, instructions or products referred to in the content.