Abstract
Cylindrospermopsin (CYN) is a freshwater algal toxin produced during the proliferation of harmful cyanobacteria, known as cyanobacterial algal blooms (cyano-HABs). Recently, the effects of global warming have facilitated the growth of cyano-HABs, leading to their worldwide occurrence and an increase in toxin-related damage to aquatic ecosystems. CYN is known to exhibit strong cell toxicity upon ingestion, inhibiting protein synthesis and glutathione production and, ultimately, leading to cell death. In addition to cell toxicity, CYN exhibits skin toxicity, genotoxicity, and hepatotoxicity. It can also affect other organs, such as the kidneys (causing tubular necrosis), thymus (causing atrophy), and heart (causing pericardial and myocardial hemorrhage). The standard method used for CYN detection to date, enzyme-linked immunosorbent assay (ELISA), has several drawbacks: it is complex, time-consuming, and requires trained researchers. Recently, biosensors have been shown to offer numerous advantages, such as their simplicity, portability, and rapidity, making them suitable for onsite applications. Consequently, recent studies have actively explored the latest biosensor-based technologies for CYN detection. This review discusses the recent advances in CYN detection platforms that utilize several types of biosensors.
Keywords:
cyanobacteria; cyanotoxin; cylindrospermopsin; biosensor; electrochemical; optical; microarray 1. Introduction
Cyanobacteria have had a significant impact on the evolution of life and have contributed to ecosystem formation [1]. However, under specific conditions, the excessive proliferation of cyanobacteria can lead to the formation of harmful algal blooms known as cyano-HABs [2]. This can cause severe water pollution, resulting in ecological destruction and economic loss [3]. Recent industrialization rises in temperature due to global warming and accelerated eutrophication have promoted cyano-HABs, leading to an increase in their frequency and scale [4,5,6,7,8,9,10]. Cyano-HABs are responsible for the production of secondary metabolites, including toxins known as cyanotoxins, which cause green water, odor, and toxicity in aquatic environments such as rivers, lakes, and ponds [11,12,13]. When ingested, cyanotoxins can cause severe functional impairments in the liver and nervous system of humans and animals, leading to death. Based on their toxic effects, cyanotoxins are classified as hepatotoxins (microcystins [MC] and nodularins), cytotoxins (cylindrospermopsin [CYN]), neurotoxins (anatoxin-a, homoanatoxin-a, anatoxin-a(S), saxitoxin [STX], and beta-methylamino-L-alanine), and dermatoxins (lyngbya toxins and aplysiatoxins) [14]. Among these, the most common cyanotoxin, microcystin-LR (MC-LR), is frequently generated, widely distributed worldwide, and has been extensively studied [15]. However, research on CYN is limited.
CYN is a cyanobacterial toxin that gained prominence as an important cytotoxin following human CYN poisoning (hepatoenteritis) on Palm Island, northern Queensland, Australia, in 1979 [16]. This toxin is produced by several cyanobacterial genera, including Cylindrospermopsis raciborskii (C. raciborskii), Aphanizomenon ovalisorum, Anabaena bergii, Raphidiopsis curvata, Umezakia natans, and Lyngbia [17,18,19,20,21,22,23,24,25,26], and is found worldwide, including in Israel, New Zealand, Europe, Japan, China, Thailand, and other regions [27,28,29,30,31,32,33,34].
CYN exhibits strong cellular toxicity, inhibits protein synthesis and glutathione production, and causes genotoxicity [35] and cell death [36]. Additionally, CYN is hepatotoxicity, but it can also affect other organs, such as the kidneys (tubular necrosis), thymus (atrophy), and heart (pericardial and myocardial hemorrhage) [37,38,39]. CYN is commonly found in Europe, Asia, Oceania, and North America, with median concentrations ranging from 0.5 to 2.5 μg/L. The highest reported concentration was 1050 μg/L in farm water supplies in central Queensland, Australia [40]. Contamination of freshwater with CYN can have serious implications for public health and can result in significant harm and loss. Therefore, it is important to monitor CYN concentrations in real-time to detect the occurrence of cyano-HABs rapidly and prevent intoxication via ingestion and contact with toxins.
In 2003, Humpage and Falconer used an oral administration study in mice to estimate the no-observed adverse effect level (NOAEL) of CYN. They proposed a practical drinking water CYN guideline value of 1 μg/L, considering a WHO standard weight of 60 kg, water consumption of 2.0 L/day, and an estimated intake of 0.9 ratios of total toxin intake from drinking water [41]. Subsequently, in 2015, the U.S. Environmental Protection Agency (EPA) developed health advisories for cyanobacterial toxins, recommending ≤0.7 μg/L for bottle-fed infants and preschool children and ≤3.0 μg/L for school-age children and adults for CYN [42]. Recently, the US EPA released draft ambient water quality criteria for swimming advisory levels of 4 and 8 μg/L for MC-LR and CYN, respectively [43]. To prevent CYN intoxication effectively, a detection platform with portability, rapidity, accessibility to nonexperts, and sensitivity for detecting trace amounts of CYN is required. Efforts to detect CYN include high-performance liquid chromatography [19,44], liquid chromatography–tandem mass spectrometry (LC-MS/MS) [45], and enzyme-linked immunosorbent assays (ELISA). However, using LC-MS/MS for onsite analysis is impractical because of its bulky and complex instrumentation. Moreover, this analysis requires significant time, cost, specialized technicians, and complex sample preparation procedures. ELISA is commonly used for the quantitative analysis of total toxins. It does not require heavy and expensive equipment but involves complex detection steps, extensive analysis time, and trained researchers. The mouse bioassay has also been widely used; however, it does not facilitate rapid toxin monitoring.
Biosensors are gaining attention as alternatives to conventional toxin detection methods. A biosensor is an analytical device composed of three units, a bioreceptor that allows specific binding or biochemical interactions with the target analyte, an electrode, and a signal transducer [46]. When complementary binding or biochemical reactions occur between the bioreceptor and target analyte, they cause changes in physicochemical properties (such as pH variation, electron transfer, mass change, heat transfer, absorption, or release of gas or specific ions) proportional to their concentration, generating a detectable signal for analysis [47]. Biosensors are classified into various types based on the transducer and detection platform used, including electrochemical, electrical, and optical classifications [48]. Electrochemical-based biosensors utilize the oxidative/reductive signal changes resulting from the binding of biological receptors and analytes [49]. Electrochemical bio-sensors consist of three electrodes: reference, counter, and working electrodes, which are categorized as potential, current measurement, voltage-current, and impedance biosensors [50]. Electrical biosensors, mostly based on field-effect transistors (FETs), involve a semiconductor channel connecting the source and drain electrodes, with a bio-receptor immobilized on the sensing material. When a bias voltage is applied, electrical characteristics such as electrical conductivity are modulated by the gate electrode depending on the analyte binding, generating a signal [51]. FET-based biosensors exhibit high detection capability and sensitivity for both neutral and charged biomolecules. Optical sensors utilize surface plasmon resonance, Raman scattering, fluorescence, and colorimetry to analyze the changes in optical signals according to biological reactions [52]. They can also be categorized based on the type of bioreceptor used, such as genetic sensors, immunosensors, aptasensors, and enzyme sensors. The most widely used biological receptors are antibodies and aptamers. Antibodies generate antigen–antibody complexes through specific binding with antigens. However, they have disadvantages such as difficult production, high manufacturing costs, sensitivity to temperature and conditions, and short lifespan. In contrast, aptamers can be produced in vitro, exhibit high thermal stability, and are resistant to denaturation and degradation, making them cost-effective. Aptamers are produced through an affinity-based method called SELEX (systematic evolution of ligands by exponential enrichment) and can possess specificity for nearly all targets, including proteins, toxic molecules, and cells [53].
Biosensors offer excellent accessibility through relatively simple measurement procedures and low costs, making them suitable for mass production. Moreover, research on enhancing their functionality for onsite applications is ongoing. To achieve rapid detection, Park et al. [54] significantly reduced the reaction time of the target analyte, MC-LR, with the bioreceptor, from 3 h to 10 min by using an alternating current electrothermal flow, thereby greatly reducing the overall detection time. Research has also been conducted to amplify signals and detect substances at ultralow concentrations by introducing nanomaterials onto the electrode surface to enhance sensitivity [55,56]. In addition to improving the performance of electrodes, studies on integrating biosensor signal transduction and control via smartphones to reduce costs significantly and make them user-friendly, thereby increasing the feasibility of biosensor applications, are ongoing [57]. Scott et al. [58] designed a portable, fully integrated platform for point-of-care electrochemical readout and operation, enabling remote control via a smartphone application using Bluetooth low energy. This overcomes the drawbacks of expensive and bulky commercial potentiostats and facilitates easy use and data interpretation by non-experts. Such biosensor research and development has contributed to the development of field-ready biosensor platforms capable of real-time detection of viruses, microorganisms, and toxins, with the concept of field-ready biosensors gaining attention. An example of this is the self-diagnostic kit used for COVID-19 in 2019, in which patients with suspected infections directly collected samples to determine the presence or absence of the pathogen.
Biosensors could be effective in the detection and monitoring of CYN. Despite the risks associated with CYN and the need for its detection, research on CYN biosensors has been limited to date. In this review, studies on CYN detection using biosensors were classified according to detection techniques, such as electrochemical, optical, and microarray, for discussion.
2. Electrochemical-Based Detection
In electrochemical biosensors, when a target substance binds to the biological receptors on the sensor surface, the physical or chemical reactions allow biological information regarding the analyte to be converted into electrical current or voltage signals [50,59]. More specifically, electrochemical reactions occur between the analyte or ions and electrolytes in the space between the electrode surface or electrodes, leading to oxidation–reduction reactions [60]. This electrochemical technology is cost-effective and miniaturized, making it highly applicable to portable devices [61]. Additionally, electrochemical biosensing utilizing aptamers has been applied in various areas, such as disease diagnosis [62], viral detection [63], and environmental monitoring [64], due to their high selectivity, low cost, and rapid results [65].
Electrochemical biosensors are typically controlled using a three-electrode system [59]. The three-electrode system consists of a working electrode composed of a chemically stable conductive material, a reference electrode coated with silver/silver chloride (Ag/AgCl), and a platinum wire counter electrode. In this system, the reference electrode protects the half-cell potential from changes as the charge passes through the counter electrode [66].
Electrochemical sensors can be classified into potential-difference, amperometric, and impedance-measurement biosensors based on the type of data observed [59]. Potential-difference measurement biosensors measure changes in signals for the analyte generated by an applied voltage [67]. Amperometric sensors continuously measure the current generated by the oxidation–reduction reactions of electrochemically active species on the sensor surface [68]. Impedance-measurement methods monitor resistance and reactance [66]. Cyclic voltammetry (CV) is a technique commonly used in electrochemical biosensors. It obtains information about oxidation–reduction potentials through changes in current values generated by applying triangular wave voltages in a three-electrode system [69,70]. Electrochemical impedance spectroscopy (EIS) is a powerful electrochemical measurement tool that analyzes the electrical characteristics of the interface investigating electrode reactions [71,72]. EIS can be used to monitor processes that affect the conductivity, impedance, and capacitance of electrochemical systems [69,73]. CV and EIS are commonly performed together to obtain information about changes in the redox potential and electron transfer resistance of a biosensor surface caused by a bioanalyte [64,69,74]. In this section, we describe impedance biosensors for CYN detection using CV and EIS.
Impedance Measurement Sensor
Recently, Elshafey et al. developed a label-free electrochemical-based aptasensor for the sensitive detection of CYN [64]. They selected the CYN9 aptamer sequence, which undergoes conformational changes upon binding to CYN, can be detected using circular dichroism (CD) and modified with a disulfide probe. Figure 1a shows a schematic of the fabricated aptasensor, which formed a self-assembled monolayer. To minimize the nonspecific adsorption of the aptamer, its secondary structure was enhanced by blocking it with 6-mercapto-1-hexanol. Changes in the electronic transmission resistance (Ret) resulting from structural changes in the aptamer induced by aptamer–CYN binding were monitored using CV and EIS. Figure 1b shows the electrochemical monitoring results of the response of the aptasensor to CYN binding. Figure 1(bB) shows the results of the EIS measurements performed on the [Fe(CN)6]4–/3– solution at equimolar concentrations. The Bare Gold electrode exhibited the smallest resistance (indicated by the diameter of the semicircle in the graph) due to fast electron transfer (represented by the black line). In contrast, the electrode modified with the negatively charged disulfide-transformed aptamer showed increased resistance due to the electrostatic repulsion with the [Fe(CN)6]4–/3– ions (represented by the red curve). After CYN binding (represented by the blue curve), the resistance decreased, indicating structural changes in the aptamer and increased accessibility of the redox marker due to folding. This Ret behavior was consistent with the current behavior observed in CV (Figure 1(bA)), confirming the CYN-detection capability of the aptasensor. Figure 1(cB) shows the calibration graph of the aptasensor based on the EIS results obtained at various CYN concentrations. The graph was calibrated using Δ[Ro-R/Ro%] and showed a linear dependence on CYN concentration. The limit of detection (LOD) for the fabricated aptasensor was determined to be 0.039 μg/L, demonstrating higher sensitivity than that (0.040 μg/L) of the commercial ELISA kit. The successful development of an electrochemically based CYN detection aptasensor highlights its potential as a tool for environmental monitoring in the field.
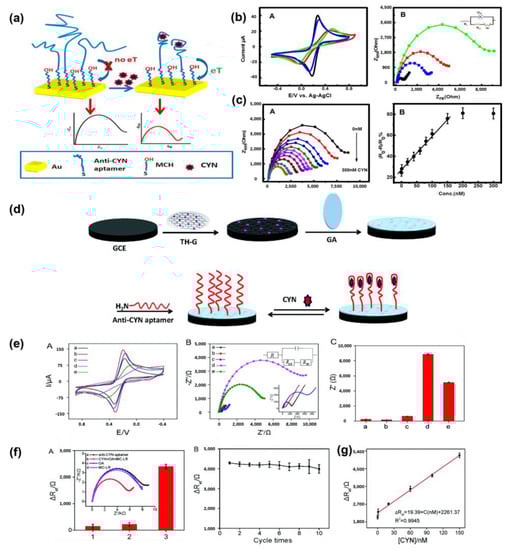
Figure 1.
(a) Schematic diagram of fabrication of label-free electrochemical aptasensor for detecting CYN. (b) (A) Cyclic voltammograms measured at a scan rate of 100 mV/s for each sensor manufacturing process. (B) Nyquist plot for each manufacturing process of the sensor (105~3 Hz, 0.21 V DC potential and 5 mV AC amplitude) Curves according to Au, Au/CYN9, Au/CYN9/MCH and Au/CYN9/MCH/CYN (60 nM) are black, red, blue and green curves. (c) (A) Nyquist plots of sensors measured at CYN concentrations of 0, 0.1, 1.0, 20, 40, 60, 80, 100, 150, 200, and 300 nM. (B) Linear regression curve with the result of A corrected by ΔR/Ro%. Reproduced with permission from Ref. [64]. Copyright 2014 American Chemical Society. (d) Schematic diagram of label-free CYN detection aptasensor fabricated through covalent bonding of TH-G (thio-nine-graphene) nanocomposite modified electrode and ami-no-substituted CYN aptamer. (e) (A) Cyclic voltammogram and (B) Nyquist plot and equivalent circuit for each stage of the sensor manufacturing process (a. bare GCE (black), b. GCE/TH-G (red), c. GCE/TH-G/GA (blue), d. GCE/TH-G/GA/anti-CYN aptamer (purple) and e. GCE/TH-G/GA/anti-CYN aptamer/80 nM CYN (green)). (C) Electron transfer resistance for (A). (f) (A) Selectivity of aptamersensors through impedance measurement of Okada acid (OA) and Microcystin-LR (MC-LR) (B) ΔRet value change according to sensor reuse cycle (g) ΔRet linear regression curve for EIS measurements by concentration of CYN. Reproduced with permission from Ref. [74]. Copyright 2015 Royal Society of Chemistry.
Zhao et al. developed a label-free impedimetric aptasensor for CYN detection with low detection limits, high selectivity, and reproducibility [74]. Figure 1d shows a schematic of the aptasensor fabricated through the covalent coupling of a thionine–graphene (TH-G) nanocomposite-modified electrode and an amino-substituted CYN aptamer. The aptasensor was fabricated by inducing covalent coupling between the amino groups of the amino-CYN aptamer and aldehyde groups of glutaraldehyde (GA)-treated TH-G nanocomposite-modified electrode (TH-G/GCE). Figure 1(eA,B) shows the CV and impedance spectrum for each manufacturing process of the sensor. In Figure 1(eA,B), it was confirmed that TH-G has excellent electrical conductivity through an increase in peak current and a decrease in Ret of CGE/TH-G compared to bare GCE. Figure 1(eC) shows the Ret value for each process step. The Ret value decreased noticeably when CYN was bound to the aptasensor, together with the decrease in surface resistance by TH-G. These results demonstrate the improvement of CYN detection efficiency through the introduction of TH-G nano-materials.
The LOD of the fabricated sensor was 0.117 ng/mL within the dynamic range of 0.39 to 78 ng/mL. Impedance measurements were also conducted to evaluate the selectivity and reproducibility of the sensor. Figure 1(fA) shows the excellent selectivity of the aptasensor towards CYN through impedance measurements against okada acid and MC-LR. Figure 1(fB) shows the Ret values representing the initial response of the aptasensor after 10 re-uses, indicating high reproducibility with a relative standard deviation of less than 2.1%. Furthermore, impedance measurements at various CYN concentrations in freshwater (ranging from 1.0 nM to 150 nM) demonstrated a low LOD of 0.146 ng/mL, highlighting the practicality of the fabricated sensor for onsite measurements (Figure 1g). The label-free and sensitive electrochemical aptasensor for CYN detection was developed to establish an onsite diagnostic platform for CYN detection for use in environmental monitoring.
An electrochemical-based CYN detection biosensor using aptamers combines the stability of aptamers with the sensitivity and miniaturization potential of electrochemical tools, thereby offering the potential for onsite monitoring in the field.
3. Optical-Based Detection
Optical-based biosensors convert the interactions between biomolecular recognition elements into optical signals, such as light absorption, reflection, or emission [75]. These can be broadly categorized into labeled and label-free systems. In labeled systems, optical signals are generated using colorimetric, fluorescent, or luminescent methods.
3.1. Fluorescence
Fluorescent biosensors have been developed based on the colorimetric signals exhibited by fluorescent dyes. The intensity of the fluorescence signal changes depending on the amount or concentration of the target substance present [76]. Fluorescence-based biosensors have great advantages in that they are capable of simple and rapid analysis as compared to several other reported detection methods. However, unnecessary transformations can occur; therefore, it can only be used as a simple bioreceptor. Aptamers are simple biological receptors, and biosensors based on aptamers and fluorescence have been reported [70].
Chinnappan et al. reported graphene oxide (GO)–aptamer biosensors for exploring the binding regions of high-affinity aptamers for detecting CYN [77]. Off/on fluorescence was designed to probe the binding region with the essential nucleotides in the long aptamer. The binding ability and sensitivity were improved by removing nonessential nucleotides from the aptamer [78,79]. In their study, graphene exhibited excellent fluorescence-quenching properties and was used to quench aptamer fluorescence. The truncated aptamer with a fluorescence label of 25 nM was titrated with increasing GO in the dynamic range of about 0–50 μg/mL to derive the optimal concentration ratio, and the fluorescence intensity was measured in the 515 nm wavelength range. The designed biosensor uses aptamer fluorescence as a probe for detecting CYN. They found that approximately 45% of the fluorescence was recovered at a concentration of 50 nM CYN. These properties are identical to those that confirmed significant signal enhancement by the small molecules of CYN on a GO surface. These findings suggested that the FAM (6-carboxyfluorescein)-labeled sequence is highly involved in the formation of the aptamer–CYN complex [74,80]. CYN, the target material, forms a strong complex with the aptamer, and the GO–aptamer π–π stacking interaction becomes unstable, resulting in a loss of interaction with GO. Therefore, the aptamer–CYN complex is released into the solution, and its fluorescence is recovered. The LOD of the aptasensor presented in this study was 17 pM, which is six times lower than the LOD reported in a long aptamer study [81].
Zheng et al. developed an aptamer-based biosensor for the detection of multiple cyanotoxins using a smartphone [82]. Four aptamer sequences with high cyanotoxin-binding ability were selected and bound to a cyanotoxin-free aptamer sequence using a single-stranded DNA (ssDNA) dye. The ssDNA dye forms a fluorescent signal, and when a cyanotoxin is present, the fluorescent dye is displaced to form a cyanotoxin–aptamer complex, which reduces the fluorescence signal. Figure 2a,b show the detection mechanism of the proposed biosensor and the absorption and emission spectra of the ssDNA dye. To characterize the analytical performance of the proposed biosensor, the dissociation constants (Kd) of the four aptamer complexes were semiquantitatively determined by nonlinear least-squares fitting using the Hill equation [83]. Digital analysis of the emitted fluorescence was performed using a readout platform combining a microfluidic chip and a 3D-printed imaging attachment. Figure 2c shows the operational flow of the microfluidic chip and a fluorescence image obtained using a smartphone. In the presented biosensor, the ratio of the aptamer to dye was about 1:20 for the best LOD, and when measured for four aptamers by using a fluorometer, the LOD was reported to be between 0.54 nM and 1.8 nM.
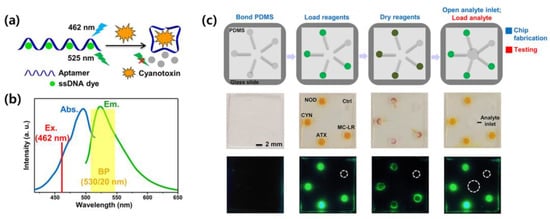
Figure 2.
(a) Detection mechanism of fluorescence-based aptamer sensors, (b) Absorption and emission spectra of the ssDNA dye superimposed with excitation and detection windows. (c) Operation flowchart of the microfluidic chip. First line is schematic illustration showing the fabrication (blue) and testing (red) steps of the chip. The second and third lines are corresponding smartphone brightfield and fluorescent images of the chip, respectively. Reproduced with permission from Ref. [82]. Copyright 2019 American Chemical Society.
These studies used fluorescence and aptamers that strongly bind to target molecules. Although it has advantages in that it is simple and fast, it is necessary to focus on the development of biosensors using various constituent materials because their uses and performance vary greatly depending on the characteristics of biomolecules.
DNA microarray technology is a powerful research tool that allows the parallel measurement of thousands of genes, enabling the rapid analysis of samples and offering versatile applications in various diagnostic fields [84,85]. Oligonucleotide microarray technology has been widely applied in molecular biology and has shown great potential in environmental diagnostics [86]. Using microarray technology, genes involved in biological events can be identified, and the interactions between genes can be analyzed. This not only accelerates molecular biology experiments but also enables new experimental approaches [87]. Protein microarray technology allows the detection and quantification of proteins within an organism. Antibodies immobilized on the micro-array chip selectively capture antigens, prioritizing antigen recognition over the secondary fluorescently labeled detection antibodies targeting different epitopes of the same antigen. Similar to ELISAs, antibody-based microarrays enable protein detection [88].
The Bickman research team demonstrated a portable biosensor system called MBio, for the rapid and simultaneous detection of MC and CYN in freshwater. This study involves conducting multiplex fluorescence immunoassays using a platform based on a portable, disposable cartridge that combines planar waveguide illumination, fluorescence imaging, and microarray technology [89]. The MBio cartridge was formed by printing toxin–protein conjugates using a non-contact dispenser on a waveguide made of a low-autofluorescence polymer resin. Figure 3a shows a cross-sectional schematic of the competitive immunoassay array. The detection reagent was a freeze-dried mixture of fluorescent-labeled antibodies against MC and CYN. Figure 3b shows an array image under the analysis conditions: in the absence of toxins, antibodies bind to the MC- and CYN-conjugates, creating bright spots, whereas in the presence of toxins, binding is competitively inhibited, resulting in reduced fluorescent signals. The analysis focused on a detection range of 1 μg/L to enable sensitive onsite diagnostics. Figure 3b,c present the standard curves for the MC and CYN analyses, respectively, with the output intensity normalized to the intensity at the cutoff point (B0). The reported dynamic range at 80% inhibitory concentration (IC80) was 0.4–3.1 μg/L for MC and 0.7–2.7 μg/L for CYN. These results demonstrated the development of a rapid and sensitive simultaneous screening method for detecting MC and CYN cyanotoxins. The development of an MC and CYN multiplex analysis system holds the potential for monitoring harmful cyanobacterial toxins in the field.
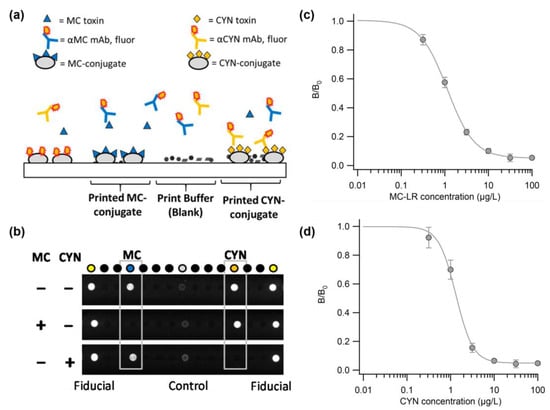
Figure 3.
(a) Schematic of competitive immunoassay array for CYN and MC. (b) Representative images of immunoassay arrays in MC (blue) and CYN(orange) under various conditions. Another arrangement is a print buffer blank and fluid control unit. (c) Standard curve for analysis by concentration of diluted MC-LR. (d) Standard curve for analysis by concentration of diluted CYN. Reproduced with permission from Ref. [89]. Copyright 2018 American Chemical Society.
These studies have advantages in terms of simplicity and speed by utilizing fluorescent aptamers that exhibit strong binding to target molecules. However, due to the varying characteristics of biomolecules, the purpose and performance of biosensors can vary significantly. Therefore, it is necessary to develop biosensors using a variety of components to accommodate the specific properties of biomolecules.
3.2. Surface Plasmon Resonance
The labeling approach carries the risk of introducing errors depending on the binding characteristics and conditions of the labeled molecules [90]. Surface plasmon resonance (SPR) is a well-established optical sensor-based approach that allows the real-time characterization of binding reactions without the need for labeling with radioactive or fluorescent substances. It can be applied to various biological systems, such as proteins, oligonucleotides, oligosaccharides, peptides, virus particles, and cells [91,92,93,94,95,96].
SPR biosensors rely on the resonance of surface plasmon waves to observe changes in the sensor surface through variations in reflected light [97]. When an electromagnetic wave is incident at the interface between two media with opposite sign permittivities, such as metals and dielectrics, the charged particles oscillate and generate a surface plasma wave (surface plasmon wave) [98]. This surface plasmon wave attenuates the intensity of the reflected light at a specific angle, known as the SPR angle, and responds sensitively to surface changes in the dielectric layer adjacent to the metal layer. The sensor surface, composed of functional self-assembled monolayers generated using various methods, such as amine, aldehyde, or thiol coupling, undergoes changes upon specific binding to the target molecule in an unknown solution [99]. This enables the quantification of analyte concentrations and real-time monitoring of binding reactions [90,100].
Elliott et al. developed monoclonal and polyclonal antibodies for the detection of CYN and characterized them using ELISA and SPR [101]. To form immunoreactive protein conjugates, CYN was coupled with bovine thyroglobulin (BTG) via the carbodiimide reaction (CYN–acid–BTG, CYN–succinate–BTG), acid anhydride reaction (CYN–acid to BTG), epoxy linker (CYN–BTG), and modified Mannich reaction (CYN–KLH and CYN–OVA). Rabbits were immunized with an immunogen to produce polyclonal antibodies, and mice were used to produce monoclonal antibodies. SPR was used to evaluate the sensitivity and specificity of antibodies. The carboxymethylated surface of a CM5-certified biosensor chip (Cytiva, U.S.A) was equilibrated at room temperature and activated using an amine-coupling kit. Jeffamine (0.1 M) in phosphate buffer was sequentially exposed to the sensor surface, followed by ethanoldiamine (1 M), and CYN was activated using EDC/NHS, epoxy chemistry, or formaldehyde chemistry, according to the immunoreactive protein-conjugation method. Activated CYN was immobilized by binding to Jeffamine or ethylenediamine linkers. For antibody screening, test sera were diluted 100-fold and injected onto the surface at a flow rate of 12 μL/min for evaluation by SPR. This revealed that only the antibodies produced by the modified Mannich reaction exhibited suitable antibody affinity. The characterized monoclonal and polyclonal antibodies achieved a sensitivity range of 27–131 pg/mL and 4.4–11.1 ng/mL (Figure 4), respectively, as determined by ELISA and SPR. In their study, highly sensitive antibodies that bind to CYN were developed, and an SPR biosensor was fabricated to demonstrate real-time CYN analysis.
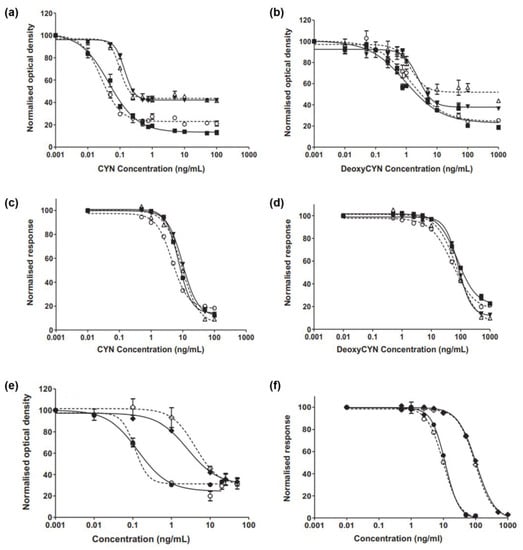
Figure 4.
(a) Calibration curves for polyclonal antibodies determined by ELISA for (a) CYN and (b) deoxyCYN and by SPR for (c) CYN and (d) deoxyCYN (○ Polyclonal 1; ■ Polyclonal 2; △ Polyclonal 3; ▼ Polyclonal 4) Calibration curves for monoclonal antibodies determined by (e) ELISA and (f) SPR for CYN and deoxyCYN (○ CYN monoclonal 1; ◇ deoxyCYN monoclonal 1; ● CYN monoclonal 2; ◆ deoxyCYN monoclonal 2) Reproduced with permission from Ref. [101]. Copyright 2013 Elsevier.
4. Overview of Cyanotoxin Detection Biosensors
Biosensors are suitable for cyanotoxin detection due to their low cost, simplicity, and rapidity. Various strategies utilizing different transducers and detection platforms have been reported to enhance biosensor performance, as discussed above. Strategies involving electrochemistry, optics, and microarrays are being extensively researched because of the demand for cost-effective biosensor technologies; however, they have certain practical limitations. Table 1 presents an overview of the advantages and disadvantages of each technique. Among the biomaterials used as bioreceptors, aptamers are utilized as antibody alternatives because of their high specificity, stability compared to antibodies, cost-effectiveness, and ease of synthesis and manipulation. In addition, aptamers can easily incorporate multiple functional groups at their ends, enhancing their reactivity towards sensor surfaces and various nanoparticles, thereby expanding their detection capabilities. Nanostructures based on noble metals, carbon, and transition metal dichalcogenides have been utilized to enhance signal sensitivity [55,56]. The introduction of suitable nanoparticles increases the electrode surface area, thereby increasing the biomolecule contact area and utilizing their electrical and chemical characteristics for applications. Table 2 provides information on the characteristics of the biosensors developed for CYN detection, including the bioreagents used. Unlike cyanotoxins that have been extensively studied until recently, such as MC-LR [54,102,103,104,105] and Saxitoxin [106,107,108,109], biosensor development for CYN remains lacking. Therefore, in addition to the electrochemical and optical detection studies presented in this paper, it is urgent to actively promote research to detect CYN toxins harmful to the environment and biological systems by integrating various detection platforms and nanomaterials, bioreceptors, and microfluidic technologies.

Table 1.
Advantages and disadvantages of each detection technique.
Table 2.
CYN detection biosensor.
5. Conclusions
This review discussed biosensors used for the detection of CYN. CYN, released by cyanobacteria in a soluble form, is present in large quantities in affected water and remains resistant to microbial degradation for extended periods if the water temperature remains low. Dissolved CYN can persist even after the cyanobacteria disappear and can pass through filtration or coagulation processes, potentially entering the final drinking water supply [119]. Therefore, monitoring and rapidly responding to the increasing presence of CYN in freshwater sources and drinking water is crucial. Given the increasing incidence of cyano-HABs and the globally reported need for CYN monitoring, further development, and research are urgently required. In addition to biosensor development, simplified sample pretreatment processes should be developed to enable rapid onsite diagnosis. To commercialize the construction of field-ready CYN biosensors, several problems should be solved. (1) Adequate pre-treatment method should be established on the field without heavy centrifugation equipment. (2) High responsive bioprobe required to detect CYN in the freshwater that contained various residues, salts, and pollutants. An antibody is a good option for this purpose, but it is still expensive for biosensor mass production. While the aptamer is a cheaper and faster production than antibodies, it is less sensitive and selective compared to antibodies. (3) Hand-held biosensors should have a high signal-to-ratio response, signal fidelity, and low sample loading volume for CYN detection. A small amount of CYN in the freshwater hampers the serious harmful effect on humans and other living organisms. So, a hand-held biosensor with high-sensitivity fabrication is essential for this purpose. Therefore, the development of CYN biosensors should meet those requirements is crucial for future field-ready cytotoxin monitoring systems.
Author Contributions
Conceptualization, T.L. and Y.K., methodology, Y.K. writing—original draft preparation, Y.K., Y.Y., M.J. and S.K., writing—review and editing, C.P. Y.K., Y.Y. and T.L., supervision, Y.K. and T.L., project administration, Y.K. All authors have read and agreed to the published version of the manuscript.
Funding
This research was supported by Korea Environment Industry&Technology Institute (KEITI) through the program for the management of aquatic ecosystem health, funded by Korea Ministry of Environment (MOE). (2020003030001) by the Industrial Core Technology Development Program (20009121, Development of early diagnostic system of peritoneal fibrosis by multiplex detection of exosomal nucleic acids and protein markers) funded by the Ministry of Trade, Industry and Energy (MOTIE, Korea) and by the National Research Foundation of Korea (NRF) grant funded by the Korea government (MSIT) (No.2021R1C1C1005583) and by the excellent researcher support project of Kwangwoon University in 2023.
Institutional Review Board Statement
Not applicable.
Informed Consent Statement
Not applicable.
Data Availability Statement
Not applicable.
Conflicts of Interest
The authors declare no conflict of interest.
References
- Skulberg, O.M. Cyanobacteria/Cyanotoxin Research—Looking Back for the Future: The Opening Lecture of the 6th ICTC, Bergen, Norway. Environ. Toxicol. Int. J. 2005, 20, 220–228. [Google Scholar] [CrossRef]
- Ibelings, B.W.; Chorus, I. Accumulation of cyanobacterial toxins in freshwater “seafood” and its consequences for public health: A review. Environ. Pollut. 2007, 150, 177–192. [Google Scholar] [CrossRef]
- Huisman, J.; Codd, G.A.; Paerl, H.W.; Ibelings, B.W.; Verspagen, J.M.H.; Visser, P.M. Cyanobacterial Blooms. Nat. Rev. Microbiol. 2018, 16, 471–483. [Google Scholar] [CrossRef]
- Ho, J.C.; Michalak, A.M.; Pahlevan, N. Widespread Global Increase in Intense Lake Phytoplankton Blooms since the 1980s. Nature 2019, 574, 667–670. [Google Scholar] [CrossRef]
- Paerl, H.W. Mitigating Toxic Planktonic Cyanobacterial Blooms in Aquatic Ecosystems Facing Increasing Anthropogenic and Climatic Pressures. Toxins 2018, 10, 76. [Google Scholar] [CrossRef]
- Burford, M.A.; Carey, C.C.; Hamilton, D.P.; Huisman, J.; Paerl, H.W.; Wood, S.A.; Wulff, A. Perspective: Advancing the research agenda for improving understanding of cyanobacteria in a future of global change. Harmful Algae 2020, 91, 101601. [Google Scholar] [CrossRef]
- O’Neil, J.M.; Davis, T.W.; Burford, M.A.; Gobler, C.J. The Rise of Harmful Cyanobacteria Blooms: The Potential Roles of Eutrophication and Climate Change. Harmful Algae 2012, 14, 313–334. [Google Scholar] [CrossRef]
- Glibert, P.M. Harmful Algae at the Complex Nexus of Eutrophication and Climate Change. Harmful Algae 2020, 91, 101583. [Google Scholar] [CrossRef]
- Wells, M.L.; Karlson, B.; Wulff, A.; Kudela, R.; Trick, C.; Asnaghi, V.; Berdalet, E.; Cochlan, W.; Davidson, K.; De Rijcke, M. Future HAB science: Directions and challenges in a changing climate. Harmful Algae 2020, 91, 101632. [Google Scholar] [CrossRef]
- McCabe, R.M.; Hickey, B.M.; Kudela, R.M.; Lefebvre, K.A.; Adams, N.G.; Bill, B.D.; Gulland, F.M.; Thomson, R.E.; Cochlan, W.P.; Trainer, V.L. An unprecedented coastwide toxic algal bloom linked to anomalous ocean conditions. Geophys. Res. Lett. 2016, 43, 10366–10376. [Google Scholar] [CrossRef]
- Dittmann, E.; Fewer, D.P.; Neilan, B.A. Cyanobacterial toxins: Biosynthetic routes and evolutionary roots. FEMS Microbiol. Rev. 2013, 37, 23–43. [Google Scholar] [CrossRef]
- Carmichael, W.W. Cyanobacteria secondary metabolites—The cyanotoxins. J. Appl. Bacteriol. 1992, 72, 445–459. [Google Scholar] [CrossRef]
- Park, J.A.; Seo, Y.; Sohn, H.; Park, C.; Min, J.; Lee, T. Recent trends in biosensors based on electrochemical and optical techniques for cyanobacterial neurotoxin detection. BioChip J. 2022, 16, 146–157. [Google Scholar] [CrossRef]
- Svirčev, Z.; Lalić, D.; Bojadžija Savić, G.; Tokodi, N.; Drobac Backović, D.; Chen, L.; Meriluoto, J.; Codd, G.A. Global geographical and historical overview of cyanotoxin distribution and cyanobacterial poisonings. Arch. Toxicol. 2019, 93, 2429–2481. [Google Scholar] [CrossRef]
- Sundaravadivelu, D.; Sanan, T.T.; Venkatapathy, R.; Mash, H.; Tettenhorst, D.; Danglada, L.; Frey, S.; Tatters, A.O.; Lazorchak, J. Determination of Cyanotoxins and Prymnesins in Water, Fish Tissue, and Other Matrices: A Review. Toxins 2022, 14, 213. [Google Scholar] [CrossRef]
- Bourke, A.T.C.; Hawes, R.B.; Neilson, A.; Stallman, N.D. An Outbreak of Hepato-Enteritis (the Palm Island Mystery Disease) Possibly Caused by Algal Intoxication. Toxicon 1983, 21, 45–48. [Google Scholar] [CrossRef]
- Byth, S. Palm Island Mystery Disease. Med. J. Aust. 1980, 2, 40–42. [Google Scholar] [CrossRef]
- Schembri, M.A.; Neilan, B.A.; Saint, C.P. Identification of genes implicated in toxin production in the cyanobacterium Cylindrospermopsis raciborskii. Environ. Toxicol. Int. J. 2001, 16, 413–421. [Google Scholar] [CrossRef]
- Burford, M.A.; Willis, A.; Chuang, A.; Man, X.; Orr, P.T. Recent insights into physiological responses to nutrients by the cylindrospermopsin producing cyanobacterium, Cylindrospermopsis raciborskii. J. Oceanol. Limnol. 2018, 36, 1032–1039. [Google Scholar] [CrossRef]
- Burford, M.A.; Beardall, J.; Willis, A.; Orr, P.T.; Magalhaes, V.F.; Rangel, L.M.; Azevedo, S.M.F.O.E.; Neilan, B.A. Understanding the Winning Strategies Used by the Bloom-Forming Cyanobacterium Cylindrospermopsis Raciborskii. Harmful Algae 2016, 54, 44–53. [Google Scholar] [CrossRef]
- Komárek, J.; Kling, H. Variation in six planktonic cyanophyte genera in Lake Victoria (East Africa). Algol. Stud./Arch. Für Hydrobiol. Suppl. Vol. 1991, 61, 21–45. [Google Scholar]
- McGregor, G.B.; Fabbro, L.D. Dominance of Cylindrospermopsis raciborskii (Nostocales, Cyanoprokaryota) in Queensland tropical and subtropical reservoirs: Implications for monitoring and management. Lakes Reserv. Res. Manag. 2000, 5, 195–205. [Google Scholar] [CrossRef]
- Saker, M.L.; Nogueira, I.C.; Vasconcelos, V.M.; Neilan, B.A.; Eaglesham, G.K.; Pereira, P. First report and toxicological assessment of the cyanobacterium Cylindrospermopsis raciborskii from Portuguese freshwaters. Ecotoxicol. Environ. Saf. 2003, 55, 243–250. [Google Scholar] [CrossRef]
- Shaw, G.R.; Sukenik, A.; Livne, A.; Chiswell, R.K.; Smith, M.J.; Seawright, A.A.; Norris, R.L.; Eaglesham, G.K.; Moore, M.R. Blooms of the cylindrospermopsin containing cyanobacterium, Aphanizomenon ovalisporum (Forti), in newly constructed lakes, Queensland, Australia. Environ. Toxicol. Int. J. 1999, 14, 167–177. [Google Scholar] [CrossRef]
- Ballot, A.; Ramm, J.; Rundberget, T.; Kaplan-Levy, R.N.; Hadas, O.; Sukenik, A.; Wiedner, C. Occurrence of Non-Cylindrospermopsin-Producing Aphanizomenon Ovalisporum and Anabaena Bergii in Lake Kinneret (Israel). J. Plankton Res. 2011, 33, 1736–1746. [Google Scholar] [CrossRef]
- Stüken, A.; Campbell, R.J.; Quesada, A.; Sukenik, A.; Dadheech, P.K.; Wiedner, C. Genetic and Morphologic Characterization of Four Putative Cylindrospermopsin Producing Species of the Cyanobacterial Genera Anabaena and Aphanizomenon. J. Plankton Res. 2009, 31, 465–480. [Google Scholar] [CrossRef]
- Chiswell, R.K.; Shaw, G.R.; Eaglesham, G.; Smith, M.J.; Norris, R.L.; Seawright, A.A.; Moore, M.R. Stability of Cylindrospermopsin, the Toxin from the Cyanobacterium, Cylindrospermopsis Raciborskii: Effect of PH, Temperature, and Sunlight on Decomposition. Environ. Toxicol. Int. J. 1999, 14, 155–161. [Google Scholar] [CrossRef]
- Stirling, D.J.; Quilliam, M.A. First Report of the Cyanobacterial Toxin Cylindrospermopsin in New Zealand. Toxicon 2001, 39, 1219–1222. [Google Scholar] [CrossRef]
- Harada, K.I.; Ohtani, I.; Iwamoto, K.; Suzuki, M.; Watanabe, M.F.; Watanabe, M.; Terao, K. Isolation of Cylindrospermopsin from a Cyanobacterium Umezakia Natans and Its Screening Method. Toxicon 1994, 32, 73–84. [Google Scholar] [CrossRef]
- Li, R.; Carmichael, W.W.; Brittain, S.; Eaglesham, G.K.; Shaw, G.R.; Mahakhant, A.; Noparatnaraporn, N.; Yongmanitchai, W.; Kaya, K.; Watanabe, M.M. Isolation and Identification of the Cyanotoxin Cylindrospermopsin and Deoxy-Cylindrospermopsin from a Thailand Strain of Cylindrospermopsis Raciborskii (Cyanobacteria). Toxicon 2001, 39, 973–980. [Google Scholar] [CrossRef]
- Li, R.; Carmichael, W.W.; Brittain, S.; Eaglesham, G.K.; Shaw, G.R.; Liu, Y.; Watanabe, M.M. First report of the cyanotoxins cylindrospermopsin and deoxycylindrospermopsin from Raphidiopsis curvata (Cyanobacteria). J. Phycol. 2001, 37, 1121–1126. [Google Scholar] [CrossRef]
- Banker, R.; Carmeli, S.; Hadas, O.; Teltsch, B.; Porat, R.; Sukenik, A. Identification of Cylindrospermopsin in Aphanizomenon ovalisporum (Cyanophyceae) Isolated from Lake Kinneret, Israel 1. J. Phycol. 1997, 33, 613–616. [Google Scholar] [CrossRef]
- Fastner, J.; Heinze, R.; Humpage, A.R.; Mischke, U.; Eaglesham, G.K.; Chorus, I. Cylindrospermopsin Occurrence in Two German Lakes and Preliminary Assessment of Toxicity and Toxin Production of Cylindrospermopsis Raciborskii (Cyanobacteria) Isolates. Toxicon 2003, 42, 313–321. [Google Scholar] [CrossRef]
- Preußel, K.; Stüken, A.; Wiedner, C.; Chorus, I.; Fastner, J. First Report on Cylindrospermopsin Producing Aphanizomenon Flos-Aquae (Cyanobacteria) Isolated from Two German Lakes. Toxicon 2006, 47, 156–162. [Google Scholar] [CrossRef]
- Humpage, A.R.; Fontaine, F.; Froscio, S.; Burcham, P.; Falconer, I.R. Cylindrospermopsin genotoxicity and cytotoxicity: Role of cytochrome P-450 and oxidative stress. J. Toxicol. Environ. Health Part A 2005, 68, 739–753. [Google Scholar] [CrossRef]
- Bazin, E.; Huet, S.; Jarry, G.; Hégarat, L.L.; Munday, J.S.; Humpage, A.R.; Fessard, V. Cytotoxic and Genotoxic Effects of Cylindrospermopsin in Mice Treated by Gavage or Intraperitoneal Injection. Environ. Toxicol. 2012, 27, 277–284. [Google Scholar] [CrossRef]
- Terao, K.; Ohmori, S.; Igarashi, K.; Ohtani, I.; Watanabe, M.F.; Harada, K.I.; Ito, E.; Watanabe, M. Electron Microscopic Studies on Experimental Poisoning in Mice Induced by Cylindrospermopsin Isolated from Blue-Green Alga Umezakia Natans. Toxicon 1994, 32, 833–843. [Google Scholar] [CrossRef]
- Falconer, I.R.; Hardy, S.J.; Humpage, A.R.; Froscio, S.M.; Tozer, G.J.; Hawkins, P.R. Hepatic and renal toxicity of the blue–green alga (cyanobacterium) Cylindrospermopsis raciborskii in male Swiss albino mice. Environ. Toxicol. Int. J. 1999, 14, 143–150. [Google Scholar] [CrossRef]
- Froscio, S.M.; Humpage, A.R.; Burcham, P.C.; Falconer, I.R. Cylindrospermopsin-induced protein synthesis inhibition and its dissociation from acute toxicity in mouse hepatocytes. Environ. Toxicol. Int. J. 2003, 18, 243–251. [Google Scholar] [CrossRef]
- Yang, Y.; Yu, G.; Chen, Y.; Jia, N.; Li, R. Four decades of progress in cylindrospermopsin research: The ins and outs of a potent cyanotoxin. J. Hazard. Mater. 2021, 406, 124653. [Google Scholar] [CrossRef]
- Humpage, A.R.; Falconer, I.R. Oral toxicity of the cyanobacterial toxin cylindrospermopsin in male Swiss albino mice: Determination of no observed adverse effect level for deriving a drinking water guideline value. Environ. Toxicol. Int. J. 2003, 18, 94–103. [Google Scholar] [CrossRef]
- U.S. EPA. Drinking Water Health Advisory for the Cyanobacterial Microcystin Toxins; U.S. EPA: Washington, DC, USA, 2015; pp. 1–75.
- U.S. EPA. Human Health Recreational Ambient Water Quality Criteria or Swimming Advisories for Microcystins and Cylindrospermopsin; U.S. EPA: Washington, DC, USA, 2016; p. 185.
- Hawkins, P.R.; Chandrasena, N.R.; Jones, G.J.; Humpage, A.R.; Falconer, I.R. Isolation and Toxicity of Cylindrospermopsis Raciborskii from an Ornamental Lake. Toxicon 1997, 35, 341–346. [Google Scholar] [CrossRef]
- Eaglesham, G.K.; Norris, R.L.; Shaw, G.R.; Smith, M.J.; Chiswell, R.K.; Davis, B.C.; Neville, G.R.; Seawright, A.A.; Moore, M.R. Use of HPLC-MS/MS to monitor cylindrospermopsin, a blue–green algal toxin, for public health purposes. Environ. Toxicol. Int. J. 1999, 14, 151–154. [Google Scholar] [CrossRef]
- Vo-Dinh, T.; Cullum, B. Biosensors and biochips: Advances in biological and medical diagnostics. Fresenius J. Anal. Chem. 2000, 366, 540–551. [Google Scholar] [CrossRef]
- Velasco-Garcia, M.N.; Mottram, T. Biosensor technology addressing agricultural problems. Biosyst. Eng. 2003, 84, 1–12. [Google Scholar] [CrossRef]
- Fracchiolla, N.S.; Artuso, S.; Cortelezzi, A. Biosensors in clinical practice: Focus on oncohematology. Sensors 2013, 13, 6423–6447. [Google Scholar] [CrossRef]
- Diculescu, V.C.; Chiorcea-Paquim, A.; Oliveira-Brett, A.M. Applications of a DNA-electrochemical biosensor. TrAC Trends Anal. Chem. 2016, 79, 23–36. [Google Scholar] [CrossRef]
- Singh, A.; Sharma, A.; Ahmed, A.; Sundramoorthy, A.K.; Furukawa, H.; Arya, S.; Khosla, A. Recent advances in electrochemical biosensors: Applications, challenges, and future scope. Biosensors 2021, 11, 336. [Google Scholar] [CrossRef]
- Sedki, M.; Shen, Y.; Mulchandani, A. Nano-FET-enabled biosensors: Materials perspective and recent advances in North America. Biosens. Bioelectron. 2021, 176, 112941. [Google Scholar] [CrossRef]
- Xu, L.; Shoaie, N.; Jahanpeyma, F.; Zhao, J.; Azimzadeh, M.; Al, K.T. Optical, electrochemical and electrical (nano) biosensors for detection of exosomes: A comprehensive overview. Biosens. Bioelectron. 2020, 161, 112222. [Google Scholar] [CrossRef]
- Tuerk, C.; Gold, L. Systematic evolution of ligands by exponential enrichment: RNA ligands to bacteriophage T4 DNA polymerase. Science 1990, 249, 505–510. [Google Scholar] [CrossRef]
- Park, J.A.; Kwon, Y.; Le, X.A.; Vu, T.H.; Park, H.; Lee, H.; Choi, H.K.; Park, C.; Kim, M.I.; Lee, T. Construction of a rapid electrochemical biosensor consisting of a nanozyme/aptamer conjugate for waterborne microcystin detection. Analyst 2023, 148, 2536–2543. [Google Scholar] [CrossRef]
- Park, H.; Kim, G.; Seo, Y.; Yoon, Y.; Min, J.; Park, C.; Lee, T. Improving Biosensors by the Use of Different Nanomaterials: Case Study with Microcystins as Target Analytes. Biosensors 2021, 11, 525. [Google Scholar] [CrossRef]
- Shi, F.; Xu, J.; Hu, Z.; Ren, C.; Xue, Y.; Zhang, Y.; Li, J.; Wang, C.; Yang, Z. Bird nest-like zinc oxide nanostructures for sensitive electrochemical glucose biosensor. Chin. Chem. Lett. 2021, 32, 3185–3188. [Google Scholar] [CrossRef]
- Huang, X.; Xu, D.; Chen, J.; Liu, J.; Li, Y.; Song, J.; Ma, X.; Guo, J. Smartphone-Based Analytical Biosensors. Analyst 2018, 143, 5339–5351. [Google Scholar] [CrossRef]
- Scott, A.; Pandey, R.; Saxena, S.; Osman, E.; Li, Y.; Soleymani, L. A Smartphone Operated Electrochemical Reader and Actuator That Streamlines the Operation of Electrochemical Biosensors. ECS Sens. Plus 2022, 1, 014601. [Google Scholar] [CrossRef]
- Zhang, Z.; Zhou, J.; Du, X. Electrochemical Biosensors for Detection of Foodborne Pathogens. Micromachines 2019, 10, 222. [Google Scholar] [CrossRef]
- Zhang, S.; Wright, G.; Yang, Y. Materials and Techniques for Electrochemical Biosensor Design and Construction. Biosens. Bioelectron. 2000, 15, 273–282. [Google Scholar] [CrossRef]
- Hammond, J.L.; Formisano, N.; Estrela, P.; Carrara, S.; Tkac, J. Electrochemical biosensors and nanobiosensors. Essays Biochem. 2016, 60, 69–80. [Google Scholar]
- Nur, Y.; Gaffar, S.; Hartati, Y.W.; Subroto, T. Applications of electrochemical biosensor of aptamers-based (APTASENSOR) for the detection of leukemia biomarker. Sens. Bio-Sens. Res. 2021, 32, 100416. [Google Scholar] [CrossRef]
- Park, G.; Lee, M.; Kang, J.; Park, C.; Min, J.; Lee, T. Selection of DNA aptamer and its application as an electrical biosensor for Zika virus detection in human serum. Nano Converg. 2022, 9, 41. [Google Scholar] [CrossRef]
- Elshafey, R.; Siaj, M.; Zourob, M. In vitro selection, characterization, and biosensing application of high-affinity cylindrospermopsin-targeting aptamers. Anal. Chem. 2014, 86, 9196–9203. [Google Scholar] [CrossRef]
- He, L.; Huang, R.; Xiao, P.; Liu, Y.; Jin, L.; Liu, H.; Li, S.; Deng, Y.; Chen, Z.; Li, Z. Current signal amplification strategies in aptamer-based electrochemical biosensor: A review. Chin. Chem. Lett. 2021, 32, 1593–1602. [Google Scholar] [CrossRef]
- Ronkainen, N.J.; Halsall, H.B.; Heineman, W.R. Electrochemical biosensors. Chem. Soc. Rev. 2010, 39, 1747–1763. [Google Scholar] [CrossRef]
- Abdulbari, H.A.; Basheer, E.A. Electrochemical biosensors: Electrode development, materials, design, and fabrication. ChemBioEng Rev. 2017, 4, 92–105. [Google Scholar] [CrossRef]
- Grieshaber, D.; MacKenzie, R.; Vörös, J.; Reimhult, E. Electrochemical Biosensors—Sensor Principles and Architectures. Sensors 2008, 8, 1400–1458. [Google Scholar] [CrossRef]
- Seo, Y.; Yoon, Y.; Lee, M.; Jang, M.; Kim, T.H.; Kim, Y.; Yoo, H.Y.; Min, J.; Lee, T. Rapid Electrochemical Biosensor Composed of DNA Probe/Iridium Nanoparticle Bilayer for Aphanizomenon Flos-Aquae Detection in Fresh Water. Colloids Surf. B Biointerfaces 2023, 225, 113218. [Google Scholar] [CrossRef]
- Park, G.; Park, H.; Park, S.C.; Jang, M.; Yoon, J.; Ahn, J.H.; Lee, T. Recent Developments in DNA-Nanotechnology-Powered Biosensors for Zika/Dengue Virus Molecular Diagnostics. Nanomaterials 2023, 13, 361. [Google Scholar] [CrossRef]
- Wang, S.; Zhang, J.; Gharbi, O.; Vivier, V.; Gao, M.; Orazem, M.E. Electrochemical impedance spectroscopy. Nat. Rev. Methods Prim. 2021, 1, 41. [Google Scholar] [CrossRef]
- Retter, U.; Lohse, H. Electrochemical Impedance Spectroscopy. Electroanal. Methods Guid. Exp. Appl. 2010, 3, 207–229. [Google Scholar]
- Magar, H.S.; Hassan, R.Y.A.; Mulchandani, A. Electrochemical Impedance Spectroscopy (Eis): Principles, Construction, and Biosensing Applications. Sensors 2021, 21, 6578. [Google Scholar] [CrossRef]
- Zhao, Z.; Chen, H.; Ma, L.; Liu, D.; Wang, Z. A Label-Free Electrochemical Impedance Aptasensor for Cylindrospermopsin Detection Based on Thionine-Graphene Nanocomposites. Analyst 2015, 140, 5570–5577. [Google Scholar] [CrossRef]
- Noh, S.; Kim, J.; Kim, G.; Park, C.; Jang, H.; Lee, M.; Lee, T. Recent Advances in Crp Biosensor Based on Electrical, Electrochemical and Optical Methods. Sensors 2021, 21, 3024. [Google Scholar] [CrossRef]
- Kim, J.; Noh, S.; Park, J.A.; Park, S.C.; Park, S.J.; Lee, J.H.; Ahn, J.H.; Lee, T. Recent Advances in Aptasensor for Cytokine Detection: A Review. Sensors 2021, 21, 8491. [Google Scholar] [CrossRef]
- Chinnappan, R.; AlZabn, R.; Fataftah, A.K.; Alhoshani, A.; Zourob, M. Probing high-affinity aptamer binding region and development of aptasensor platform for the detection of cylindrospermopsin. Anal. Bioanal. Chem. 2020, 412, 4691–4701. [Google Scholar] [CrossRef]
- Ku, T.; Zhang, T.; Luo, H.; Yen, T.M.; Chen, P.; Han, Y.; Lo, Y. Nucleic acid aptamers: An emerging tool for biotechnology and biomedical sensing. Sensors 2015, 15, 16281–16313. [Google Scholar] [CrossRef]
- Adachi, T.; Nakamura, Y. Aptamers: A Review of Their Chemical Properties. Molecules 2019, 24, 4229. [Google Scholar] [CrossRef]
- Chinnappan, R.; Rahamn, A.A.; AlZabn, R.; Kamath, S.; Lopata, A.L.; Abu-Salah, K.M.; Zourob, M. Aptameric biosensor for the sensitive detection of major shrimp allergen, tropomyosin. Food Chem. 2020, 314, 126133. [Google Scholar] [CrossRef]
- Lu, Z.; Chen, X.; Wang, Y.; Zheng, X.; Li, C.M. Aptamer Based Fluorescence Recovery Assay for Aflatoxin B1 Using a Quencher System Composed of Quantum Dots and Graphene Oxide. Microchim. Acta 2015, 182, 571–578. [Google Scholar] [CrossRef]
- Li, Z.; Zhang, S.; Yu, T.; Dai, Z.; Wei, Q. Aptamer-based fluorescent sensor array for multiplexed detection of cyanotoxins on a smartphone. Anal. Chem. 2019, 91, 10448–10457. [Google Scholar] [CrossRef]
- Hu, J.; Easley, C.J. A simple and rapid approach for measurement of dissociation constants of DNA aptamers against proteins and small molecules via automated microchip electrophoresis. Analyst 2011, 136, 3461–3468. [Google Scholar] [CrossRef]
- Stekel, D. Microarray Bioinformatics; Cambridge University Press: Cambridge, UK, 2003; ISBN 052152587X. [Google Scholar]
- Marzancola, M.G.; Sedighi, A.; Li, P.C. DNA microarray-based diagnostics. Microarray Technol. Methods Appl. 2016, 1368, 161–178. [Google Scholar]
- Castiglioni, B.; Rizzi, E.; Frosini, A.; Sivonen, K.; Rajaniemi, P.; Rantala, A.; Mugnai, M.A.; Ventura, S.; Wilmotte, A.; Boutte, C. Development of a universal microarray based on the ligation detection reaction and 16S rRNA gene polymorphism to target diversity of cyanobacteria. Appl. Environ. Microbiol. 2004, 70, 7161–7172. [Google Scholar] [CrossRef]
- Blohm, D.H.; Guiseppi-Elie, A. New developments in microarray technology. Curr. Opin. Biotechnol. 2001, 12, 41–47. [Google Scholar] [CrossRef]
- Witt, M.; Walter, J.; Stahl, F. Aptamer microarrays—Current status and future prospects. Microarrays 2015, 4, 115–132. [Google Scholar] [CrossRef]
- Bickman, S.R.; Campbell, K.; Elliott, C.; Murphy, C.; O’Kennedy, R.; Papst, P.; Lochhead, M.J. An innovative portable biosensor system for the rapid detection of freshwater cyanobacterial algal bloom toxins. Environ. Sci. Technol. 2018, 52, 11691–11698. [Google Scholar] [CrossRef]
- Estrela, P.; Damborský, P.; Švitel, J.; Katrlik, J. Optical biosensors. Essays Biochem. 2016, 60, 91–100. [Google Scholar] [CrossRef]
- Meyer, M.H.; Hartmann, M.; Keusgen, M. SPR-based immunosensor for the CRP detection—A new method to detect a well known protein. Biosens. Bioelectron. 2006, 21, 1987–1990. [Google Scholar] [CrossRef]
- Hong, L.; Lu, M.; Dinel, M.; Blain, P.; Peng, W.; Gu, H.; Masson, J. Hybridization conditions of oligonucleotide-capped gold nanoparticles for SPR sensing of microRNA. Biosens. Bioelectron. 2018, 109, 230–236. [Google Scholar] [CrossRef]
- Suda, Y.; Arano, A.; Fukui, Y.; Koshida, S.; Wakao, M.; Nishimura, T.; Kusumoto, S.; Sobel, M. Immobilization and Clustering of Structurally Defined Oligosaccharides for Sugar Chips: An Improved Method for Surface Plasmon Resonance Analysis of Protein−Carbohydrate Interactions. Bioconjugate Chem. 2006, 17, 1125–1135. [Google Scholar] [CrossRef]
- Liu, F.; Luo, Z.; Ding, X.; Zhu, S.; Yu, X. Phage-displayed protein chip based on SPR sensing. Sens. Actuators B Chem. 2009, 136, 133–137. [Google Scholar] [CrossRef]
- Szunerits, S.; Saada, H.; Pagneux, Q.; Boukherroub, R. Plasmonic approaches for the detection of SARS-CoV-2 viral particles. Biosensors 2022, 12, 548. [Google Scholar] [CrossRef]
- Yanase, Y.; Araki, A.; Suzuki, H.; Tsutsui, T.; Kimura, T.; Okamoto, K.; Nakatani, T.; Hiragun, T.; Hide, M. Development of an optical fiber SPR sensor for living cell activation. Biosens. Bioelectron. 2010, 25, 1244–1247. [Google Scholar] [CrossRef]
- Cho, Y.J. Surface Plasmon Resonance Biosensors: Principle and Applications. Korean Soc. Food Eng. Kor 2003, 7, 54–59. [Google Scholar]
- Homola, J.; Yee, S.S.; Gauglitz, G. Surface plasmon resonance sensors. Sens. Actuators B Chem. 1999, 54, 3–15. [Google Scholar] [CrossRef]
- Wijaya, E.; Lenaerts, C.; Maricot, S.; Hastanin, J.; Habraken, S.; Vilcot, J.; Boukherroub, R.; Szunerits, S. Surface plasmon resonance-based biosensors: From the development of different SPR structures to novel surface functionalization strategies. Curr. Opin. Solid State Mater. Sci. 2011, 15, 208–224. [Google Scholar] [CrossRef]
- Situ, C.; Mooney, M.H.; Elliott, C.T.; Buijs, J. Advances in surface plasmon resonance biosensor technology towards high-throughput, food-safety analysis. TrAC Trends Anal. Chem. 2010, 29, 1305–1315. [Google Scholar] [CrossRef]
- Elliott, C.T.; Redshaw, C.H.; George, S.E.; Campbell, K. First development and characterisation of polyclonal and monoclonal antibodies to the emerging fresh water toxin cylindrospermopsin. Harmful Algae 2013, 24, 10–19. [Google Scholar] [CrossRef]
- Tian, M.; Wang, J.; Li, C.; Wang, Z.; Liu, G.; Lv, E.; Zhao, X.; Li, Z.; Cao, D.; Liu, H. Qualitative and quantitative detection of microcystin-LR based on SERS-FET dual-mode biosensor. Biosens. Bioelectron. 2022, 212, 114434. [Google Scholar] [CrossRef]
- Wei, X.; Wang, S.; Zhan, Y.; Kai, T.; Ding, P. Sensitive identification of microcystin-LR via a reagent-free and reusable electrochemical biosensor using a methylene blue-labeled aptamer. Biosensors 2022, 12, 556. [Google Scholar] [CrossRef]
- Li, Y.; Si, S.; Huang, F.; Wei, J.; Dong, S.; Yang, F.; Li, H.; Liu, S. Ultrasensitive label-free electrochemical biosensor for detecting linear microcystin-LR using degrading enzyme MlrB as recognition element. Bioelectrochemistry 2022, 144, 108000. [Google Scholar] [CrossRef]
- Mohamed, A.; Walsh, R.; Cherif, M.; Hafez, H.A.; Ropagnol, X.; Vidal, F.; Perreault, J.; Ozaki, T. High-sensitivity small-molecule detection of microcystin-LR cyano-toxin using a terahertz-aptamer biosensor. Analyst 2021, 146, 7583–7592. [Google Scholar] [CrossRef]
- Qiang, L.; Zhang, Y.; Guo, X.; Gao, Y.; Han, Y.; Sun, J.; Han, L. A rapid and ultrasensitive colorimetric biosensor based on aptamer functionalized Au nanoparticles for detection of saxitoxin. RSC Adv. 2020, 10, 15293–15298. [Google Scholar] [CrossRef] [PubMed]
- Ullah, N.; Noureen, B.; Tian, Y.; Du, L.; Chen, W.; Wu, C. Label-Free Detection of Saxitoxin with Field-Effect Device-Based Biosensor. Nanomaterials 2022, 12, 1505. [Google Scholar] [CrossRef] [PubMed]
- Park, J.A.; Kwon, N.; Park, E.; Kim, Y.; Jang, H.; Min, J.; Lee, T. Electrochemical biosensor with aptamer/porous platinum nanoparticle on round-type micro-gap electrode for saxitoxin detection in fresh water. Biosens. Bioelectron. 2022, 210, 114300. [Google Scholar] [CrossRef]
- Noureen, B.; Ullah, N.; Tian, Y.; Du, L.; Chen, W.; Wu, C.; Wang, P. An electrochemical PAH-modified aptasensor for the label-free and highly-sensitive detection of saxitoxin. Talanta 2022, 240, 123185. [Google Scholar] [CrossRef] [PubMed]
- da Silva, E.; Souto, D.; Barragan, J.; de Giarola, F.J.; de Moraes, A.; Kubota, L.T. Electrochemical biosensors in point-of-care devices: Recent advances and future trends. ChemElectroChem 2017, 4, 778–794. [Google Scholar] [CrossRef]
- Bunney, J.; Williamson, S.; Atkin, D.; Jeanneret, M.; Cozzolino, D.; Chapman, J. The use of electrochemical biosensors in food analysis. Curr. Res. Nutr. Food Sci. J. 2017, 5, 183–195. [Google Scholar] [CrossRef]
- Dutta, G. Electrochemical biosensors for rapid detection of malaria. Mater. Sci. Energy Technol. 2020, 3, 150–158. [Google Scholar] [CrossRef]
- Ronkainen-Matsuno, N.J.; Thomas, J.H.; Halsall, H.B.; Heineman, W.R. Electrochemical immunoassay moving into the fast lane. TrAC Trends Anal. Chem. 2002, 21, 213–225. [Google Scholar] [CrossRef]
- Hu, R.; Liu, T.; Zhang, X.; Huan, S.; Wu, C.; Fu, T.; Tan, W. Multicolor fluorescent biosensor for multiplexed detection of DNA. Anal. Chem. 2014, 86, 5009–5016. [Google Scholar] [CrossRef] [PubMed]
- Lu, X.; Dong, X.; Zhang, K.; Han, X.; Fang, X.; Zhang, Y. A gold nanorods-based fluorescent biosensor for the detection of hepatitis B virus DNA based on fluorescence resonance energy transfer. Analyst 2013, 138, 642–650. [Google Scholar] [CrossRef] [PubMed]
- Frye, J.G.; Jesse, T.; Long, F.; Rondeau, G.; Porwollik, S.; McClelland, M.; Jackson, C.R.; Englen, M.; Fedorka-Cray, P.J. DNA microarray detection of antimicrobial resistance genes in diverse bacteria. Int. J. Antimicrob. Agents 2006, 27, 138–151. [Google Scholar] [CrossRef] [PubMed]
- Zhou, J.; Qi, Q.; Wang, C.; Qian, Y.; Liu, G.; Wang, Y.; Fu, L. Surface plasmon resonance (SPR) biosensors for food allergen detection in food matrices. Biosens. Bioelectron. 2019, 142, 111449. [Google Scholar] [CrossRef]
- Gold Standard Diagnosstics. Available online: https://www.goldstandarddiagnostics.com/pub/media/productattachments/files/c/y/cylindrospermopsin-elisa-user-guide-522011.pdf (accessed on 10 May 2023).
- World Health Organization. Cyanobacterial Toxins: Cylindrospermopsins. In Guidelines for Drinking-Water Quality and Guidelines for Safe Recreational Water Environments; WHO: Geneva, Switzerland, 2020; pp. 290–307. [Google Scholar]


Disclaimer/Publisher’s Note: The statements, opinions and data contained in all publications are solely those of the individual author(s) and contributor(s) and not of MDPI and/or the editor(s). MDPI and/or the editor(s) disclaim responsibility for any injury to people or property resulting from any ideas, methods, instructions or products referred to in the content. |
© 2023 by the authors. Licensee MDPI, Basel, Switzerland. This article is an open access article distributed under the terms and conditions of the Creative Commons Attribution (CC BY) license (https://creativecommons.org/licenses/by/4.0/).