Abstract
Nowadays, innovation in food technologies is fundamental and consumers are increasingly aware and demanding. To create a final product that is more and more appealing, health and safety guidelines are pushing towards new challenges. It is precisely due to the high quality required by the producers that the aim discussed in this project has been conceived. Until today, the controls on the entire production line have been slowed down by the limitations of the technologies involved, including the high cost of instrumentation for microbiological analysis, the need for qualified personnel to carry them out, the long execution times and the invasiveness of the techniques themselves. This project has, therefore, proposed a user-friendly solution that is minimally invasive, fast and at a lower cost. This system makes use of classical microbiological analysis and, in parallel, use of an innovative electronic-nose small sensor system (S3+), which can be trained to recognize the volatile fingerprint of a specific product and customized for a specific use. The aim of this project was to develop a system that is able to detect the mold contamination on fruit and vegetable jams and marmalades, using a new kind of innovative metal semiconductor gas sensor (MOS) device. The application of this technology has, therefore, made it possible to classify various samples of uncontaminated and contaminated fruit and vegetable preparations. Thanks to the classification implemented by a data-driven algorithm, it has been possible to build an anomaly detector that is able to recognize the occurrence of possible contamination, thus acting as an early alert system in the food chain. All this will occur in less than 1 min once the system is trained, in contrast with classical microbiological or chemical techniques that normally require longer timeframes to obtain a result and involve the use of reagents, increasing the costs.
1. Introduction
Vegetable and fruit jams are products characterized by widespread use. Marmalades and jams are a mixture of fruits (or vegetables), which, through appropriate cooking, are brought to have a gelled consistency. In general, jellies, jams and preserves are produced by crushing fruits (or vegetables) and straining juices to make a product with a spread-like consistency. This type of food has such deep roots because its invention made it possible to preserve a very wide range of products for long periods [].
Its origins have distant roots in time, dating back to ancient Rome, where it was necessary to be able to preserve fruit, harvested in season, so that it could be enjoyed during times when there was none. This technique has made it possible to preserve fruits and vegetables since ancient times, even to those who lived far from the area of cultivation. In addition to the versatility of these types of products, the sweetness and the flavor have made them the preference of many consumers []. As a matter of fact, jams are consumed all over the world, especially in Europe and North America, by people of all ages on a daily basis.
The fruit and vegetable jam market is projected to register a CAGR (compounded average growth rate) of 4.90% during the forecast period 2022–2027, experiencing increasing demand worldwide []. Although the method for obtaining this product has changed very little over the years, the desire for novelty on the part of consumers has pushed and further expanded the market share. Another trend that is pushing and guiding the market for consumers and producers of this product is certainly that of the reduction or replacement of traditional sugars. However, reducing ingredients such as sugars or stabilizers in favor of more natural and less artificial products has brought the problem of possible microbial contamination to the surface. In fact, by making the product more natural, more favorable environments are created for the growth of any contamination. This is one of the reasons for this study.
With regard to the Italian market, the demand is quite large given that Italy is the second-largest fruit producing country in Europe []. Consequently, Italian export of jams is quite dynamic, with exports estimated at several million dollars, allowing it to be considered one of the greater exporters of jams and marmalades.
Currently, jam production is a highly controlled process, following a few basic steps described in Figure 1 [], which make the product safe and appealing to the consumer []. All steps are finely regulated by HACCP according to European and Italian guidelines, and all the products must comply with specific rules of hygiene and treatment [,]. Generally, these products are subjected to a large number of quality control and sterility techniques during their production. All these measures are implemented during the production line to ensure a product that is not only safe, but that is appreciated by the consumer.
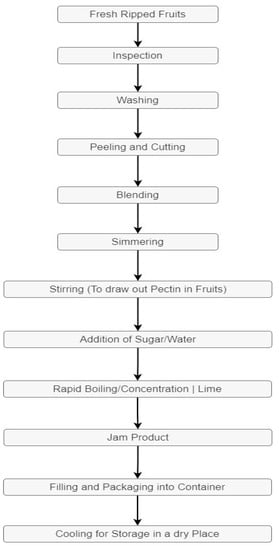
Figure 1.
Jams and marmalades flow chart.
The non-conformities of the jams and marmalades can be divided into three macro categories of causes:
- Physical agents.
- Chemical agents.
- Microbiological contamination.
The non-conformity given by microbiological contamination is probably the main problem for jam industries. As a matter of fact, it would cause a visual alteration of the product and change the taste and smell. All the non-conformities would make it unappreciated and, in some cases, unhealthy for the consumer. Consequently, it is necessary to put in prevention measures in order to prevent a product from being contaminated by exogenous agents. A solution would be to adapt different techniques for the specific problem. In fact, there are three main categories of biological agents: bacteria, yeasts and molds. Due to the intrinsic parameters of jams, a marmalade is more susceptible to be colonized by molds. These are filamentous fungi in the form of intertwined masses, called mycelium, which are highly dispersive structures due to their capacity to easily break in little fragments, and are a risk for secondary contamination. The main fungal species of plant, vegetables or food products are []:
- Fusarium spp., plant pathogenic species that causes rot in potatoes, onions and tomatoes [].
- Alternaria spp., brown mycelium responsible for the deterioration of different food products [].
- Botrytis spp., mold that causes gray/black rot in fruit during the harvest. Among all, the most common species is B. cinerea, which produces alterations in apples, pears, raspberries, strawberries, grapes, blueberries, citrus fruits and some stone fruits [].
- Penicillium spp., which can cause rotting and alterations in plants [].
- Aspergillus spp., mycelia that are typically widespread in nature and typically found on plants. Some species may produce aflatoxins and toxic compounds [].
- Rhizopus spp., mycelia that grow on fruits and vegetables, altering many foods. They are by far the most present species in food products, giving rise to rotten apples, pears, fruit with hazel, figs, grapes and many others [].
- Mucor spp., gray/white mycelium that abounds in plant products [].
- Cladosporium spp., which may cause limited rot in stone fruit. The most common species in fruits and vegetables, in general, are C. herbarum and C. cladosporioides [].
- Trichothecium spp., of which, T. roseum is the most important, producing the pink rottenness of the fruit which may also contain mycotoxins [].
The aim of this project was to develop a system that is able to detect the mold contamination on fruit and vegetable jams and marmalades. In this study, the focus was on microbiological contamination. As a matter of fact, the principal goal was to preserve the chemical, physical, organoleptic and nutritional characteristics of fruit and vegetables, ensuring safety at every stage of the process and also allowing for the identification of any sources of microbial contamination. The classic methods of microbiological analysis would be utilized in parallel with the new technology developed by Nano Sensor System S.r.l. (NASYS) (Nano Sensor Systems, NASYS Spin-Off University of Brescia, 25125 Brescia, Italy): the nano-sensor device with metal oxides (MOS) S3+, a technique based on the analysis of the volatile fingerprint of the matrix, particularly appreciated for its high sensitivity, quick responses and low costs []. MOS sensors are conductometric gas sensors, also named chemiresistors, based on semiconducting metal oxides, whose electrical properties are modulated by redox interactions with adsorbing gaseous molecules. Over the past 50 years, thousands of results have been reported on the characteristics and performance of conductometric sensors based on various semiconductive metal oxides. For this purpose, tin dioxide, the most widely used material for gas detection, was chosen. In order to have SnO2 sensors with great stability, even for long periods of use, the crystallite size has been reduced in the last 20 years to achieve a significant increase in sensor performance.
In this article, the sensors, the technique and how the samples were prepared and analyzed will first be explained. Then, there will be an overview of the results obtained through statistical analysis. Lastly, artificial intelligence (AI) model code to recognize mold contamination will be shown.
2. Materials and Methods
2.1. Sample Preparation
In order to broaden the spectrum of recognition of mold contamination by the sensor device S3, two different classes of sample were analyzed. Firstly, the uncontaminated jam samples of different kinds of fruit jams were analyzed. Secondly, the same samples were artificially contaminated in a controlled environment in order to train the sensors to recognize the contamination with respect to the safe sample. The first phase for the implementation of the contamination was to prepare a stock solution of spores. Previously isolated endogenous mold was grown in Rose Bengal Agar Base until it reached confluency, at which point, to promote the sporulation, the Petri dishes were placed in an incubator at 50 °C in order to fully exsiccate the content of the Petri dishes. In sterile conditions, a section of the exsiccated media was placed in a 9 mL sterile physiological solution and vortexed vigorously to promote the dispersion of the spores in the solution. Afterward, different serial dilutions were performed to reach a final concentration of 350 CFU/g of jam.
2.2. Small Sensor System (S3)
2.2.1. Analysis Instrument
During this project, different types of sensors were tested in terms of response time, stability and reproducibility. All the tested sensors were independently produced by the NASYS Sensor Laboratory.
At first, the trials were performed using the following sensors:
- Rheotaxial Growth Thermal Oxidation (RGTO): the RGTO technique allows the user to obtain a specific rough surface and this is an advantage as it provides a high surface-to-volume ratio and reactivity with gaseous species.
- Nanowires: this technique assures optimal crystalline quality and a very high length-to-width ratio, which promotes great sensitivity as well as long-term material stability for prolonged operation.
Despite some good results [], neither of these two techniques assured reproducibility and scalability over time for this specific application. As a consequence, new kinds of MOS sensors were used to carry out the analysis. These ones were projected, produced and tailored by NASYS specialists on this specific application. These sensors were created using a screen-printing machine. In this technique, metal oxide pastes are prepared with nanosized powder for the sensing elements, as well as for the heaters and electrodes. The powders are primarily composed of SnO2, with the inclusion of different proportions of catalysts or dopants. Consequently, the powders are deposited on the substrate with the serigraphic technique via a screen-printing machine, then dried and fired.
The tailored sensor was obtained after deep training and trials on the specific matrix. In order to obtain the best response and to analyze the biggest concentration of the volatilome’s products, different kinds of sensing layers were included on the final array. The differences between these were obtained, focusing particularly on three parameters:
- 1.
- Types of materials;
- 2.
- Ranging of the sensor doping;
- 3.
- Temperature of the firing (from 600 °C to 750 °C).
Given that we have found that three sensors are sufficient to have excellent results for numerous applications, a sensor array with three sensing layers on a single fused quartz substrate was designed and then made. This triple sensor had the conductive tracks between the sensing layers in Pt thick films, as well as the heater placed in the back of the device. Both the tracks and the sensors were made with the precision screen-printing technique. Finally, the most suitable array of sensors was discovered. Two different triple sensors were projected in order to maintain the six most performant sensors that had been developed.
Triple sensor 1 working temperature 500 °C:
- Sensor 1 → SnO2-Pd fired at 700 °C;
- Sensor 2 → SnO2 fired at 700 °C;
- Sensor 3 → SnO2-Au fired at 700 °C.
Triple sensor 2 working temperature 400 °C:
- Sensor 1 → SnO2-Pd fired at 650 °C;
- Sensor 2 → SnO2 fired at 650 °C;
- Sensor 3 → SnO2-Au fired at 650 °C.
SEM pictures of these two differently fired sensors are shown in Figure 2.
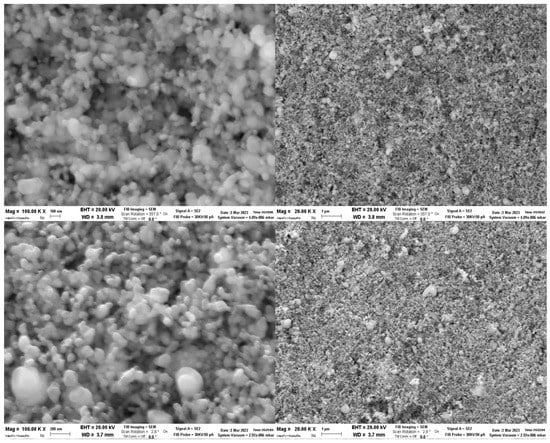
Figure 2.
SEM analysis. On top: SEM images about SnO2-Pd fired at 650°C. Below: SEM images about SnO2-Pd fired at 700 °C.
As it is generally known [], the temperature of firing and the working temperature of gas sensors are two fundamental parameters that can strongly impact the response and the reaction to the VOCs. After that, the final analysis to build the dataset started. To obtain data from contaminated products, laboratory tests on forced contaminated samples were carried out. Specifically, it was decided to monitor the evolution of the contamination. Therefore, an analysis of the safe jam product was performed. Subsequently, an analysis of the evolution of the contamination up to a maximum of 5 days was performed. This was repeated for each flavor. The analysis was carried out with the so-called S3+ device (Figure 3), an acronym for small sensor systems. This tool is produced by Nano Sensor Systems S.r.l. (Reggio Emilia, Italy, www.nasys.it (accessed on 18 February 2022)). This S3+ device represents an innovative electronic nose equipped with the described MOS sensors. The system allows the user to collect and analyze the data acquired in the Cloud, making S3+ an IoT device for the management and control of signals. The sensing mechanism involves a change in electrical resistance caused by the adsorption of gases on the semiconductor surface, which strongly depends on the stoichiometry and the presence of surface catalysts []. Furthermore, the sensing properties are influenced by microstructural characteristics, such as the grain size of the semiconductor particles, the geometry and the connectivity between the particles [].
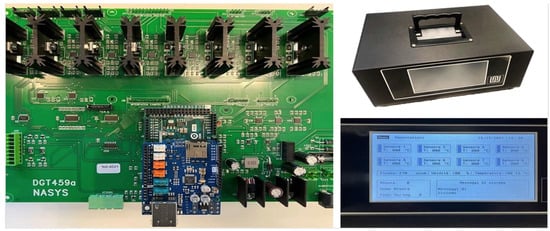
Figure 3.
Small sensory systems—S3+.
This kind of technology has already been used with considerable success in other previous projects in the field of quality control and food technology [,]. The S3+ is an IoT device which enables the collection of data in the cloud and creates storage. The dataset formed is able to be analyzed with different statistical techniques []. S3+ is composed of three essential parts:
- 1.
- The sensor chamber, which contains the array of sensors studied for the specific application. The chamber is separated from the environment, in order to prevent any possibility of noise coming from the outside space, except for an inlet and an outlet path for the passage of volatile compounds. At the same time, it was decided to add other types of sensors to control several parameters during the analysis that could influence the final response. These are the temperature, humidity and flow sensor.
- 2.
- The fluid dynamic system is formed by a pump (Knf, model: NMP05B), polyurethane tubes, an electro valve and a metal cylinder, which contains activated carbon. The activated carbon is fundamental in order to filter any type of odor in the environment that may alter the final response.
- 3.
- The electronic board transduces the chemical signal (VOCs) to the electrical signal (Ω). It also controls the conditioning and the maintenance of the selected temperature of the sensors, which is an important parameter for the detection of volatile compounds, and the other sensors implemented on the system. At the end, the system will automatically send the data to the dedicated Web app on the Microsoft Azure platform.
2.2.2. Analysis Conditions
Figure 4 shows the complete flowsheet. The reactions between the oxygen species adsorbed on the surface of the sensor and the molecules that pass by lead to the variation in the concentration of charge carriers in the sensing material, affecting its electrical conductance [,].
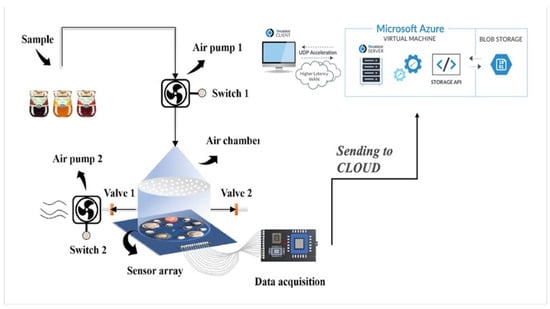
Figure 4.
Flow sheet sensor analysis.
After several different setup attempts, it was noticed that the best performance, in terms of reproducibility and standardization, would have been obtained collecting the gas sample from a unique conditioned sample. Specifically, this setup, shown in Figure 5, involves the connection of the sensor system to a single sterile jar placed in a thermostatic bath at 35 °C with 60 g of jam inside, equipped with gas-tight inputs. In this way, there were two main phases during the analysis, repeated 10 times for all sample analyzed, to obtain 10 replicates each:
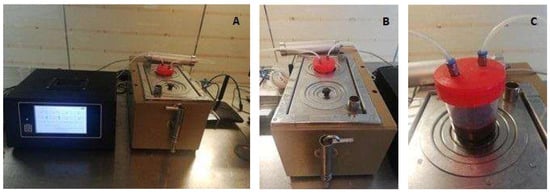
Figure 5.
Experimental setup. S3+ (A) linked to a single sterile jar placed in a thermostatic bath (B) at 35 °C with 60 g of jam inside (C), equipped with gas-tight inputs.
- 1.
- Withdrawal of air filtered through activated carbon, parallelly conditioning of the sample at 35 °C to promote the volatile compounds concentration in the headspace
- 2.
- Volatilome sampling.
As a matter of fact, this system would allow researchers to obtain a response in terms of contamination with the following advantages with respect to traditional microbiological methods.
- Low costs;
- Far less time-consuming;
- Accuracy;
- Not need to train a specialist.
Indeed, as well known [], microbiological methods require a significant amount of trained manual labor, are time-consuming and require huge investments in terms of costs of materials.
In order to create the correct model, further measurements and analysis were performed, obtaining the aromatic profiles of several products tested. The different fruit and vegetable jam recipes analyzed were: orange, asparagus, strawberry, mango, maracuja, blackberry, cranberry and currant.
2.2.3. S3+ Data Processing and Analysis
The data signals collected by different sensor arrays must be preprocessed before they are interpreted. Common signal preprocessing methods include baseline processing, normalization and feature extraction and selection. The preprocessing step is mandatory given that the e-nose device collects the sensor’s raw response, which is influenced by many factors, such as pumping system effectiveness, noise, temperature, humidity and odor retention after the cleaning procedure []. Therefore, raw signals were first preprocessed using baseline normalization with respect to R0, i.e., the initial resistance value, in order to set the beginning of the signal to the same value, e.g., zero. Moreover, to analyze the data, a Savitzky–Golay filter was applied for the purpose of reducing the noise and smoothing the data to obtain a more precise signal without distorting its tendency. Then, a different set of features was computed to compress the data dimension. The minimum value of each signal is extracted and used as a discriminative feature between the two examined classes: untainted and contaminated. Principal component analysis (PCA) and radar charts have been employed to visualize results of the previous step.
Finally, in order to compute a reference model for each class, the median curve between all replicas of each class was computed, as well as the average standard deviation. The generated model is useful to identify and detect observations that deviate in a significant way from the majority of collected data; in other words, to detect anomalies, which, in this application, refers to product contamination.
3. Results and Discussion
3.1. Visualization of Data Collected
The expression “anomaly detection” refers to the identification of rare events that deviate significantly from the majority of the data. In this context, the term “anomaly” refers to the degree of contamination of the product. By analyzing the responses of the sensors for both the uncontaminated product and the contaminated product, it was possible to design a data-driven algorithm. The profile was obtained by suitably filtering the signals coming from the sensors and finding the median vector [], thus obtaining a reference trend for the family of signals recorded by each sensor.
It was, therefore, possible to calculate how much a new measurement deviated from the respective trend and to report the anomaly, i.e., a possible case of product contamination. As for the measurements carried out in the laboratory, there were signals indicating the possible correlation between the contamination and the average change in resistance recorded by the sensors. Figure 6A shows some trends that report the first measurements acquired, divided by taste and integrated with the PCA (principal component analysis) shown in Figure 6B. PC1 is the component with a larger load, reaching the values of 96.2%. The sum of the explained variance of PC1 and PC2 is 99.3%, so the two principal components selected for the visualization are able to explain the variation in the data.
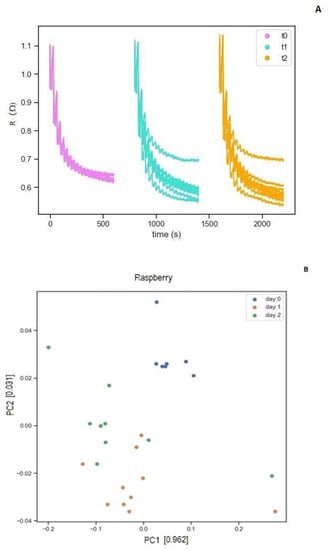
Figure 6.
Raspberry jam sample sensor analysis. (A) shows the sensor response graph. On the y-axis is the electrical resistance (Ω), on the x-axis is the time in seconds (s). (B) shows the data elaboration by PCA.
It is already possible to note that the application of sensors allows for the detection of discrimination from the first day of contamination.
The graphs shown in Figure 6 describe the analysis of a raspberry jam sample. Three different time points were monitored from this taste:
- T0-> Sample without forced contamination;
- T1-> First day after forced contamination;
- T2-> Second day after forced contamination,
Graph “Figure 6A” shows the sensors’ responses. Graph “Figure 6B” shows the PCA calculated from the measurements taken from the sensors. Each point corresponds to a different measurement, and the three colors correspond to the days when the measurements were taken. As it is possible to see, the hyperplane shows three different clusters.
The discrimination has been possible thanks to the evolution of the volatilome of the product during the period considered. As a matter of fact, mold metabolism and growth promote the release of different VOCs in different concentrations []. This assures an evolution of the entire volatile fingerprint between the safe product and the contaminated product. The results were confirmed by classical microbiological counts on PCA media, obtaining total counts of 7 CFU/g at T0, 23 CFU/g at T1 and 31 CFU/g at T2.
The degree of separation between contaminated and uncontaminated products is not always marked and evident in the first days of contamination, and it is also dependent on the specific ingredients of the product. For instance, a product containing ginger (Figure 6) will have a lower degree of contamination than another in the same time period due to the strong antimicrobial action it exerts []. The results were confirmed by classical microbiological counts on PCA media, obtaining total counts of 7 CFU/g at T0 and 10 CFU/g at T2.
Indeed, as it is shown in Figure 7A,B, the T0 and T2 clusters from the lemon–ginger jam sample are less discriminated. This is because the antimicrobial action can coincide with the mold growth []. As a consequence, the release of VOCs metabolism is opposed and the evolution of the volatile fingerprint is far lower [].
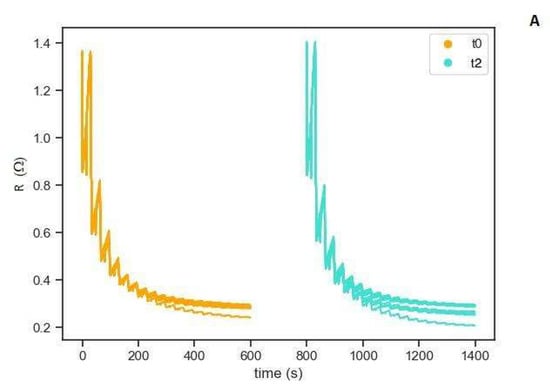
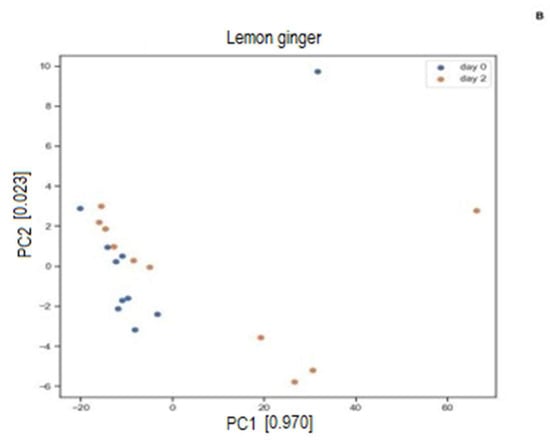
Figure 7.
Lemon–ginger jam sample sensor analysis. (A) shows the sensor response graph. On the y-axis is the electrical resistance (Ω), on the x-axis is the time in seconds (s). (B) shows the data elaboration by PCA.
3.2. Contamination Detection through Designed Model
The graphs shown in Figure 8 illustrate the contribution of the sensors in determining the degree of contamination of the product. The blue line indicates the aromatic profile of the uncontaminated product, while the orange line shows the profile of the contaminated product. Based on the above data, it is possible to affirm that as the degree of contamination increases, the distance between the two profiles increases. As a premise, each type of compound, in the same time frame, seems to respond differently to contamination. To detect possible contamination, the designed model-based algorithm requires the setting of a threshold value typical of each product, beyond which an anomaly can be reported. The thresholds are measured over the distance between the uncontaminated flavor profile and the contaminated one. Set the class S as the standard class, which includes the measurements of the uncontaminated product, and class A as the anomaly class, that of the contaminated product. In order to determine thresholds, readings of the sensors for each class are extracted and the minimum values are computed, then the median of the minima are evaluated for each class. The difference between the medians is taken as the threshold for incoming measures. The designed algorithm takes as input the time series of new measurements performed, each composed of six sensor readings, and gives in output a Boolean variable “is anomaly”. It is True if the time series is anomalous with respect to the standard class, otherwise it is False. The decision process is given in this code:
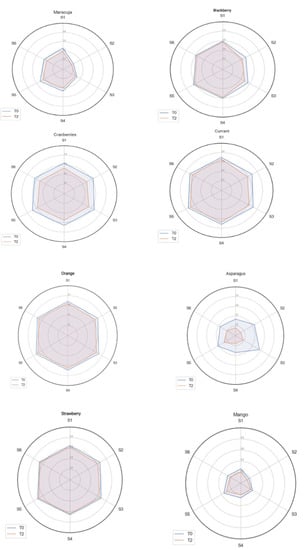
Figure 8.
Aromatic profiles of tested jams, analyzed through the designed algorithm model.
FUN Contamination_Detection (new_signals, thresholds):
FOR EACH Sensor:
Condition <- minimum(Sensor) < corresponding_threshold
IF Condition:
INCREMENT counter
// voting
IF counter >= 3:
is_anomaly <- True
RETURN is_anomaly
This algorithm detects anomalies in incoming data by comparing sensor readings to thresholds and voting. The use of this algorithm and the use of the predefined set of threshold values also opens the possibility of evaluating the quality of a given product, allowing timely intervention if anomalies occur.
4. Conclusions
Overall, it was possible to build a data-driven algorithm able to discriminate the samples according to their changeable contamination over time. This was possible thanks to a new type of chemical semiconductor oxide (MOX) gas sensor tailored by NASYS specialists on this specific application and on these specific matrices. The device used for the analysis is called a small sensor system, or S3+, an electronic nose developed by Nano Sensor Systems S.r.l,. In order to obtain this, several trials were undertaken to find the most suitable array of sensors able to detect the majority of the volatile fingerprint of jam samples. Consequently, a huge and deep data analysis was performed to build the algorithm of anomaly detection. This study continues a subject of great interest, the monitoring of food contamination, which is currently highly investigated. Even if big steps forward have been made, the research about the detection of mold contamination in complex matrices in jam via MOS sensors and AI must continue in order to improve the performances and the automaticity.
The data visualization was processed by statistical multivariate analysis of principal component analysis (PCA). In addition, the radar chart for each taste analyzed was performed to give a better vision of the results. Indeed, thanks to this analysis it was possible to design a data-driven algorithm, identifying anomalous measurements thanks to the comparison with thresholds defined by the distance between contaminated and uncontaminated class of the dataset collected.
Based on this, the gas sensors were able to classify the volatilome of jam samples according to the mold contamination identified in this analysis. This would give producers the opportunity to insert an alert system online to detect anomalies relating to food safety.
Author Contributions
Conceptualization, G.G., E.N.-C. and V.S.; methodology, G.G., E.N.-C., P.P. and V.S.; software, G.G. and D.G.; validation, P.P., I.Z. and A.T.; formal analysis, G.G., E.N.-C., P.P. and V.S.; investigation, G.G., E.N.-C., P.P. and V.S.; resources, P.P., I.Z. and A.T.; data curation, G.G., L.B., C.M. and A.S.; writing—original draft preparation, G.G., E.N.-C. and V.S.; writing—review and editing, G.G., E.N.-C. and V.S.; visualization, G.G., E.N.-C. and P.P.; supervision, V.S., I.Z., G.S. and A.T. All authors have read and agreed to the published version of the manuscript.
Funding
This research was co-funded by “Menz and Gasser S.p.A.” and “Autonomous Province of Trento”, Legge provinciale 13 December 1999, n. 6 e ss.mm. art. 5: Aiuti per la promozione della ricerca e sviluppo—art. 14: Procedura negoziale. Domanda di agevolazione di data 31 August 2018—pratica n. 38-18. Progetto “NanoSensorFood”.
Institutional Review Board Statement
Not applicable.
Informed Consent Statement
Not applicable.
Data Availability Statement
Not applicable.
Conflicts of Interest
The authors declare no conflict of interest.
References
- Williams, D.C.; Lim, M.H.; Chen, A.O.; Pangborn, R.M.; Whitaker, J.R. Blanching of vegetables for freezing: Which indicator enzyme to choose. Food Technol. 1986, 40, 130–140. [Google Scholar]
- Teuteberg, H.J. Food History in Switzerland. In European Food History: A Research Review; Leicester University Press: Leicester, UK, 1992; pp. 168–198. [Google Scholar]
- Jam, Jelly, and Preserves Market—Growth, Trends, COVID-19 Impact, and Forecast (2022–2027). Available online: https://www.researchandmarkets.com/reports/4774893/jam-jelly-and-preserves-market-growth (accessed on 6 March 2023).
- Skrede, G. Quality characterisation of strawberries for industrial jam production. J. Sci. Food Agric. 2021, 33, 48–54. [Google Scholar] [CrossRef]
- Ijioma, B.C.; Osuji, C.M.; Okafor, D.C.; Agunwa, I.M.; Ofoedu, C.E.; Onyeka, E.U.; Adikaibe, C.C. Effect of the Inclusion of Fruit Peel on Consumer Acceptability, Dietary Fiber and Chemical Properties of Jam Products. AJFSN 2017, 5, 69–76. [Google Scholar]
- INOX FER, Dal Frutto al Vasetto—Produzione di Marmellate e Confetture. Available online: https://www.inox-fer.com/dal-frutto-al-vasetto/ (accessed on 21 December 2022).
- Barreiros, M.L.; Barreiros, A.L.B.S.; Ribeiro, A.R.C.; Santos Leite Neta, M.; Narain, N. Volatile Constituents of Cajá-Umbu (Spondias Sp.), Fruit Obtained by Simultaneous Distillation and Extraction and Solid Phase Microextraction. Acta Hortic. 2018, 1198, 265–272. [Google Scholar] [CrossRef]
- Leistner, L. Mould-fermented foods: Recent developments. Food Biotechnol. 1990, 4, 433–441. [Google Scholar] [CrossRef]
- Ma, L.J.; Geiser, D.M.; Proctor, R.H.; Rooney, A.P.; O’Donnell, K.; Trail, F.; Gardiner, D.M.; Manners, J.M.; Kazan, K. Fusarium pathogenomics. Annu. Rev. Microbiol. 2013, 67, 399–416. [Google Scholar] [CrossRef]
- Lou, J.; Fu, L.; Peng, Y.; Zhou, L. Metabolites from Alternaria fungi and their bioactivities. Molecules 2013, 18, 5891–5935. [Google Scholar] [CrossRef]
- Schumacher, J. How light affects the life of Botrytis. Fungal Genet. Biol. 2017, 106, 26–41. [Google Scholar] [CrossRef]
- Olsen, M.; Lindqvist, R.; Bakeeva, A.; Su-lin, L.L.; Sulyok, M. Distribution of mycotoxins produced by Penicillium spp. inoculated in apple jam and crème fraiche during chilled storage. Int. J. Food Microbiol. 2019, 292, 13–20. [Google Scholar] [CrossRef]
- Pohůnek, V.; Adamcova, M.; Kulišanová, I.; Šístková, I.; Rohlik, B.A.; Ševčík, R. Thermal inactivation of Aspergillus lacinosus ascospores as a function of temperature and soluble solids content in fruit jam. J. Food Nutr. Res. 2019, 58, 275–282. [Google Scholar]
- Moghim, H.; Taghipoor, S.; Shahinfard, N.; Kheiri, S.; Khabbazi, H. Comparative study on the antifungal activity of hydroalcoholic extract of Iranian Propolis and Royal jelly against Rhizopus oryzae. J. HerbMed Pharmacol. 2015, 4, 89–92. [Google Scholar]
- Nieminen, T.; Neubauer, P.; Sivelä, S.; Vatamo, S.; Silfverberg, P.; Salkinoja-Salonen, M. Volatile compounds produced by fungi grown in strawberry jam. LWT—Food Sci. Technol. 2008, 41, 2051–2056. [Google Scholar] [CrossRef]
- Zambelli, P.; Fernandez-Arrojo, L.; Romano, D.; Santos-Moriano, P.; Gimeno-Perez, M.; Poveda, A.; Gandolfi, R.; Fernández-Lobato, M.; Molinari, F.; Plou, F.J. Production of fructooligosaccharides by mycelium-bound transfructosylation activity present in Cladosporium cladosporioides and Penicilium sizovae. Process Biochem. 2014, 49, 2174–2180. [Google Scholar] [CrossRef]
- Hamid, M.I.; Hussain, M.; Ghazanfar, M.U.; Raza, M.; Liu, X.Z. Trichothecium roseum causes fruit rot of tomato, orange, and apple in Pakistan. Plant Dis. 2014, 98, 1271. [Google Scholar] [CrossRef] [PubMed]
- Núñez-Carmona, E.; Abbatangelo, M.; Zottele, I.; Piccoli, P.; Tamanini, A.; Comini, E.; Sberveglieri, G.; Sberveglieri, V. Nanomaterial gas sensors for online monitoring system of fruit jams. Foods 2019, 8, 632. [Google Scholar] [CrossRef]
- Fioravanti, A.; Morandi, S.; Pedrazzo, A.R.; Cecone, C.; Manzoli, M.; Zanetti, M.; Bracco, P.; Mazzocchi, M.; Lettieri, S.; Marani, P.; et al. Investigation of the key parameters for gas sensing through comparison of electrospun and sol-gel semiconducting oxides. Ceram. Int. 2022, 48, 20948–20960. [Google Scholar] [CrossRef]
- Greco, G.; Núñez-Carmona, E.; Abbatangelo, M.; Fava, P.; Sberveglieri, V. How coffee capsules affect the volatilome in espresso coffee. Separations 2021, 8, 248. [Google Scholar] [CrossRef]
- Abbatangelo, M.; Núñez-Carmona, E.; Duina, G.; Sberveglieri, V. Multidisciplinary approach to characterizing the fingerprint of Italian EVOO. Molecules 2019, 24, 1457. [Google Scholar] [CrossRef]
- Genzardi, D.; Greco, G.; Núñez-Carmona, E.; Sberveglieri, V. Real Time Monitoring of Wine Vinegar Supply Chain through MOX Sensors. Sensors 2022, 22, 6247. [Google Scholar] [CrossRef]
- Cukrov, L.M.; McCormick, P.G.; Galatsis, K.; Wlodarski, W. Gas sensing properties of nanosized tin oxide synthesised by mechanochemical processing. Sens. Actuators B Chem. 2001, 77, 491–495. [Google Scholar] [CrossRef]
- Núñez-Carmona, E.; Abbatangelo, M.; Sberveglieri, V. Internet of Food (IoF), Tailor-Made Metal Oxide Gas Sensors to Support Tea Supply Chain. Sensors 2021, 21, 4266. [Google Scholar] [CrossRef]
- Navarini, L.; Rivetti, D. Water quality for Espresso coffee. Food Chem. 2010, 122, 424–428. [Google Scholar] [CrossRef]
- Greco, G.; Carmona, E.N.; Sberveglieri, G.; Genzardi, D.; Sberveglieri, V. A New Kind of Chemical Nanosensors for Discrimination of Espresso Coffee. Chemosensors 2022, 10, 186. [Google Scholar] [CrossRef]
- Lyhs, U. Microbiological methods. In Fishery Products: Quality, Safety and Authenticity; Blackwell Publishing Ltd.: Hoboken, NJ, USA, 2009; pp. 318–348. [Google Scholar]
- Liang, Z.; Tian, F.; Yang, S.X.; Zhang, C.; Sun, H.; Liu, T. Study on Interference Suppression Algorithms for Electronic Noses: A Review. Sensors 2018, 18, 1179. [Google Scholar] [CrossRef]
- Astola, J.; Haavisto, P.; Neuvo, Y. Vector median filters. Proc. IEEE 1990, 78, 678–689. [Google Scholar] [CrossRef]
- Morath, S.U.; Hung, R.; Bennett, J.W. Fungal volatile organic compounds: A review with emphasis on their biotechnological potential. Fungal Biol. Rev. 2012, 26, 73–83. [Google Scholar] [CrossRef]
- Beristain-Bauza, S.D.C.; Hernández-Carranza, P.; Cid-Pérez, T.S.; Ávila-Sosa, R.; Ruiz-López, I.I.; Ochoa-Velasco, C.E. Antimicrobial activity of ginger (Zingiber officinale) and its application in food products. Food Rev. Int. 2019, 35, 407–426. [Google Scholar] [CrossRef]
- Manik, M. Nutritional Composition, Bioactive Compounds and Antioxidant Activity of Different Variety (White Sugar, Brown Sugar & Honey) of Fig Jam (Ficus carica L.). Ph.D. Thesis, Chattogram Veterinary & Animal Sciences University, Chittagong, Bangladesh, 2022. [Google Scholar]
- Ambreetha, S.; Marimuthu, P.; Mathee, K.; Balachandar, D. Rhizospheric and endophytic Pseudomonas aeruginosa in edible vegetable plants share molecular and metabolic traits with clinical isolates. J. Appl. Microbiol. 2022, 132, 3226–3248. [Google Scholar] [CrossRef]
Disclaimer/Publisher’s Note: The statements, opinions and data contained in all publications are solely those of the individual author(s) and contributor(s) and not of MDPI and/or the editor(s). MDPI and/or the editor(s) disclaim responsibility for any injury to people or property resulting from any ideas, methods, instructions or products referred to in the content. |
© 2023 by the authors. Licensee MDPI, Basel, Switzerland. This article is an open access article distributed under the terms and conditions of the Creative Commons Attribution (CC BY) license (https://creativecommons.org/licenses/by/4.0/).