Abstract
In the present work, a study was carried out with the aim of enhancing the performance of electrochemical biosensors based on Co3O4:Fe2O3 heterojunctions. Specifically, the redox behavior of screen–printed carbon electrodes (SPCEs) modified with Co3O4:Fe2O3 (0.5 wt%:x wt%) nanocomposites, where x ranged from 0.1 to 0.5 wt%, was examined in detail. The hybrid nanocomposites were synthesized using the sol-gel auto-combustion method. Several characterization methods were performed to investigate the morphology, microstructure, and surface area of the pure Co3O4, pure Fe2O3, and the synthesized Co3O4:Fe2O3 nanocomposites. Using cyclic voltammetry (CV) tests, the electrochemical behavior of the modified electrodes toward the dopamine (DA) molecules was investigated. The modified Co3O4:Fe2O3, (0.5 wt%, x = 0.4 wt%)/SPCE resulted in a sensor with the best electrochemical performance toward DA. A high linear relationship between DA concentrations and the faradic current variation (ipa (μA) = 0.0736 + 0.1031 CDA (μA) and R2 = 0.99) was found in the range of 10–100 μM. The sensitivity value was computed to be 0.604 µA µM−1cm−2 and the limit of detection (LOD) 0.24 µM. Based on the characterization and electrochemical results, it can be suggested that the formation of Co3O4:Fe2O3 heterostructures provides a large specific surface area, an increased number of electroactive sites at the metal oxide interface and a p–n heterojunction, thus ensuring a remarkable enhancement in the electrochemical response towards DA.
1. Introduction
Dopamine (DA) is a neurotransmitter secreted directly by the brain, capable of activating cellular response. It is also related to spreading pleasure and the habit of drugs. Low levels of DA are responsible for the onset of diseases such as Parkinson’s disease. Accumulation can also lead to numerous diseases, such as cardiovascular disease, Alzheimer’s disease, and cancer [1,2,3,4]. Thus, it is fundamental to detect DA precisely and efficiently. Numerous approaches have been established to identify this biomolecule, including photoluminescence, spectrophotometry, electrochemical sensors, and chemoluminescence [5]. Electrochemical sensors appeal to our consideration because of their high sensitivity, low cost, and time-saving features [6].
There are various enzyme-based electrochemical sensors in the literature for the determination of DA [7] and its precursors, such as tyrosine [8] and phenylalanine [9], but all of them show difficulties in use, due to the presence of the enzymes themselves. For this reason, alternative materials for the development of these sensors are much studied.
In recent times, screen-printed carbon electrode (SPCE) electrochemical sensors have been largely used in different fields such as in medicine, the environment and so on [10,11]. The SPCE based on heterostructures and nano-heterojunction derivatives that are based on metal oxides (MOs) has received great interest. Furthermore, the use of screen-printed carbon electrodes (SPCEs) as transducer substrates for electrochemical sensors represent a key point in today’s technology since these devices are well known to be cheap and suitable for low-cost mass production. In addition, these electrodes can be easily modified by suitable electrocatalysts, which greatly enhances the sensing capability of SPCEs utilized for the detection of different analytes. Further, they fit easily when applied to the point-of-care field, being portable and completely operated by the patients themselves.
The use of metal oxides for sensing was restricted for many decades to detect gaseous species [12]. However, in the last decades, their application in electrochemical sensors for developing enzyme-free devices has grown in an accelerated manner [13]. Indeed, nowadays, they play a prominent role for the development of novel sensors, exhibiting better properties due to their high conductivity, fast charge mobility, and large specific area, along with strong mechanical and thermal characteristics. Further, these nanostructures can provide enhanced electrocatalytic properties towards many biomolecules of interests.
Composites based on metal oxides, such as cobalt oxide (Co3O4), and iron oxide (Fe2O3), are gaining a lot of attention for sensing applications. Pristine cobalt and iron oxide, prepared by the thermal stirring method, have superior conductivity due to better preservation of material structures [14,15]. Further, Co3O4:Fe2O3 nanocomposites may exhibit good electrochemical performances [16]. For example, these nanocomposites are among the most attractive materials owing to their unique peroxidase-like activity [17]. Many methods are used to prepare Co3O4:Fe2O3 nanocomposites, including the hydrothermal reaction method, ultrasonic chemical method, micro-emulsion method, co-precipitation method, iron salt high-temperature pyrolysis method, and so on [18,19]. Among these, sol-gel is the most conventional method [20].
In this paper, we synthesized pure Co3O4 and Fe2O3 nanoparticles by the co-precipitation method and then, by using the sol-gel auto-combustion method, obtained the Co3O4:Fe2O3 nanocomposites, varying the Co3O4 and Fe2O3 nanoparticle ratio. The structural, morphological, and optical properties of cobalt oxide-loaded iron oxide were studied. Nanocomposites with different Co3O4:Fe2O3 ratios (0.5 wt%: x = 0.1, 0.2, 0.3, 0.4, 0.5 wt%) were employed for the detection of DA using cyclic voltammetry as an electrochemical technique. Even if DA detection is, as above mentioned, of outmost importance in clinical medicine, here, our main objective was to study the electrochemical performances of the developed sensors based on Co3O4:Fe2O3 heterojunctions towards dopamine, chosen as a model compound. To our best knowledge, there is no work reporting this composite formulation in electrochemical sensors.
The electrochemical tests of a screen-printed electrode modified with Co3O4:Fe2O3 nanocomposites demonstrate that they could efficiently detect dopamine better than the bare SPCE and modified Co3O4/SPCE and Fe2O3/SPCE. The results obtained from the tests conducted, indicated Co3O4:Fe2O3 (0.1 wt%:0.4 wt%) as the best nanocomposite heterostructure for DA electroanalytical determination.
2. Materials and Methods
2.1. Materials
Cobalt oxide nanoparticles (Co3O4), and hematite iron oxide nanoparticles (Fe2O3), were prepared by using pure grade nitrates (99.99%) supplied by Sigma Aldrich Italy.
2.2. Synthesis of Co3O4:Fe2O3 Nanocomposites
Co3O4:Fe2O3 nanocomposites with different Co3O4 and Fe2O3 ratios (0.5 wt%: x = (0.1, 0.2, 0.3, 0.4 and 0.5 wt%)) were synthesized by using a two-step procedure. First, the pure Co3O4 and Fe2O3 materials were prepared by the precipitation method. Co3O4 was dissolved in hydrochloric acid (HCl) and continuously stirred at room temperature until the solution became transparent and uniform. Then, various quantities of hematite (from 0.001 to 0.005 mol) were dissolved in 5 M citric acid (HOC(CO2H) (CH2CO2H)2) solution and stirred at room temperature till the solution became transparent and uniform. Subsequently, Co3O4 and Fe2O3 solutions were mixed and placed on a heating plate at a temperature of ~350 °C. The materials were fully burned, obtaining five samples with different Fe2O3/Co3O4 molar ratios. Finally, the powdered samples were annealed in a glass furnace for 2 h at 400 °C. The five samples were identified as
where x and y indicate the molar composition of two components (i.e., 0.2Fe2O3/1Co3O4, 0.4Fe2O3/1Co3O4, 0.6Fe2O3/1Co3O4, 0.8Fe2O3/1Co3O4, 1Fe2O3/1Co3O4). The Fe2O3 molar % was calculated as:
x = Fe2O3/y = Co3O4,
Fe2O3 (molar %) = [(mol Fe2O3/(mol Fe2O3 + mol Co3O4)) × 100].
2.3. Characterization Methods
X-ray powder diffraction (XRD) analysis was performed using a D2 Phaser Bruker diffractometer operating at 30 kV in the range 10–90° (2-θ), at a scanning rate of 0.02° s−1. Scanning electron microscopy (SEM) images were acquired by Zeiss 1540XB FE SEM (Zeiss, Germany) instrument operating at 10 kV. The B.E.T. surface area and porosity of samples were evaluated by nitrogen adsorption and desorption isotherm carried out at 77 K by a Quantachrome ASiQwin instrument (Anton Paar Companies, Graz, Austria). The samples were dried at 100 °C and degassed for 2 h, before starting the analysis. Fourier transform infrared spectroscopy (FT-IR) spectra were collected by a Perkin Elmer Spectrum 100 spectrometer equipped with a universal ATR sampling. Raman spectra were collected with an XploRA Plus microspectrometer (Horiba, Kyoto, Japan) equipped with a diode laser emitting at 638 nm. The measurements were performed at room temperature using a 100× microscope objective (Olympus M-Plan, NA = 0.90, WD = 210 μm), both for excitation and collection of the scattered signal, which was dispersed by 1200 grating onto a CCD detector (Syncerity, Horiba).
2.4. Electrode Fabrication
Commercial screen-printed carbon electrodes (SPCEs) were purchased from Dropsens, Spain. The basic sensing electrodes used (DRP-100, named SPCE) were composed of a 4 mm diameter carbon working electrode, a silver pseudo-reference electrode, and a carbon auxiliary electrode. The electrodes were then modified with pure Co3O4, pure Fe2O3, and Co3O4:Fe2O3 composites. The appropriate modification amount was 50μL which was determined by the study of different amounts (30 μL, 50 μL, 70 μL, 100 μL). Then, the Co3O4:Fe2O3 nanocomposite material was sonicated in water (1 mg/1μL) and ultrapure water successively for 15 min. Then, typically, 30 and 50 μL of Co3O4:Fe2O3 nanocomposite (1 mg/1μL) were dropped on the SPCE surface and dried at room temperature overnight, as shown in Figure 1.
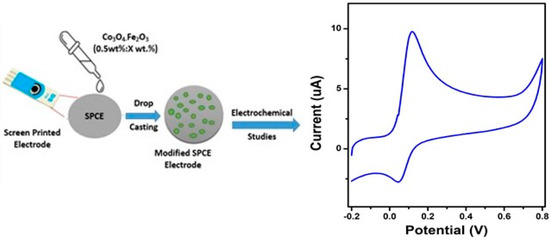
Figure 1.
SPCE modification process using Co3O4:Fe2O3 nanocomposites and CV response toward the determination of DA.
2.5. Electrochemical Tests
Electrochemical analyses were conducted with a DropSens µStat 400 potentiostat, using Dropview 8400 software for data processing. Electrical impedance spectroscopy (EIS) analyses were performed using a potentiostat Galvanostat by Metrohom autolab. The electrochemical tests for dopamine were performed in 10 mL of 0.01 M phosphate buffer solution (PBS, pH = 7.4) containing 0.0076 g (5 mM) of DA. The CV tests were performed in the potential range [−0.2 V to −0.8 V] at 0.05 V/s scan rate on unmodified and modified SPCEs in PBS solution containing DA at different concentrations ranging from 0 to 100 µM. Five different samples from the same batch and two pure samples were analyzed using the same procedure.
3. Results and Discussion
3.1. Structural and Morphological Characterization
In Figure 2, an example of the characterizations carried out by XRD, SEM and EDX is presented, which revealed the typical structure and morphology of the synthesized Fe2O3:Co3O4 nanocomposites.
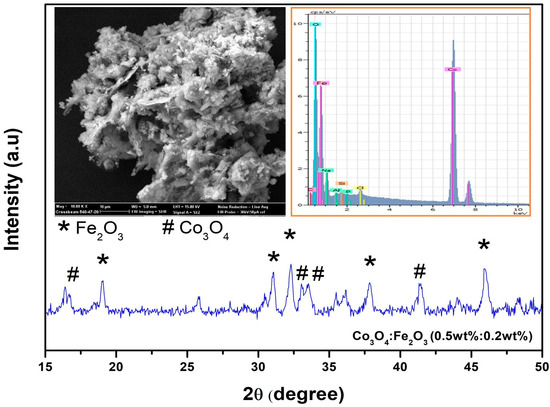
Figure 2.
XRD pattern of prepared Co3O4:Fe2O3 (0.5 wt%:0.2 wt%) nanocomposite; insets show SEM and EDX of pure Co3O4 and Co3O4:Fe2O3 (0.5 wt%:0.4 wt%) nanocomposite.
XRD analysis showed the diffraction peaks of cubic Co3O4 and tetragonal Fe2O3, with space groups Fd3m and P, respectively, confirming that in the synthesized product cobalt oxide and iron oxide single-phase nanoparticles were present. SEM images showed that all the samples were composed of nanoparticles with an irregular shape. EDX spectra confirmed the presence of Co, Fe, and O in all the composite samples.
Additional characterization studies were also performed. First, BET surface area and porosity of the samples were evaluated by nitrogen adsorption and desorption isotherms at 77 K. A summary of the structural properties of the samples derived by N2 adsorption-desorption isotherms, such as BET surface area, pore volume, and radius, are reported in Table 1. The data obtained provided evidence that the BET surface area was enhanced by increasing the amount of Fe2O3, reaching a maximum value for the nanocomposites with 0.2% of Fe2O3. It is noteworthy that the other structural parameters (i.e., pore volume and pore radius) also changed with respect to the values associated with the pure oxides, reflecting the high interaction between them.

Table 1.
Surface area, pore volume and pore radius for the pure Fe2O3, Co3O4 nanoparticles, and Fe2O3/Co3O4 nanocomposites.
ATR-FTIR spectra of pure Co3O4, Fe2O3, and Co3O4–Fe2O3 nanocomposites recorded in the wavenumber range from 500 to 4000 cm−1 are presented in Figure 3. The absorption peaks at 3485 cm−1, 2929 cm−1, and 2858 cm−1 were attributed to the –OH stretching, which agrees with the literature data [21,22,23]. The absorption peaks at 469 cm−1 and 654 cm−1 corresponding to the Fe-O stretch confirmed the successful synthesis of Co3O4–Fe2O3 nanocomposites, respectively.
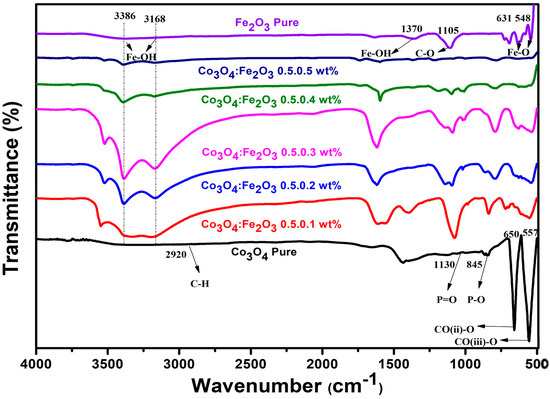
Figure 3.
ATR-FTIR pattern of prepared Co3O4:Fe2O3 nanocomposites.
A Raman characterization (see Figure 4) was also performed. For the pure Fe2O3, four main Raman peaks were observed, in agreement with the other literature [24,25]. The Raman mode located at 218 cm−1 was identified for the A1g mode while the vibrational Raman peaks related to Eg’ modes were observed at 288 cm−1, 401 cm−1 and 602 cm−1 [14,26]. According to Nagaraj et al., [25], Eg is due to the Fe–O stretching involving two iron and oxygen atoms. For pure Co3O4, we observed five major Raman modes. The three F2g modes were located at 193 cm−1, 516 cm−1, and 613 cm−1 (F2g1, F2g2, F2g3, respectively) [24]. The peak at 474 cm−1 was assigned to the E2g mode, while the one located at 682 cm−1 was assigned to A1g [24,27,28]. Regarding the Co3O4:Fe2O3, by analogy with the work of Choya et al. [28], the influence of Fe2O3 in the Co3O4 lattice was analyzed based on the shift of the A1g Raman mode observed at 682 cm−1 in the Co3O4 spectrum, which was considered as reference. According to this prior work, the redshift of the A1g signal indicated spinel distortion [29]. In the composite samples, the full width at half maximum (FWHM) of the A1g Raman mode was also found to change in respect to pure Co3O4, i.e., it increased as the amount of Fe2O3 in the nanocomposite ratio grew (Figure 4b).
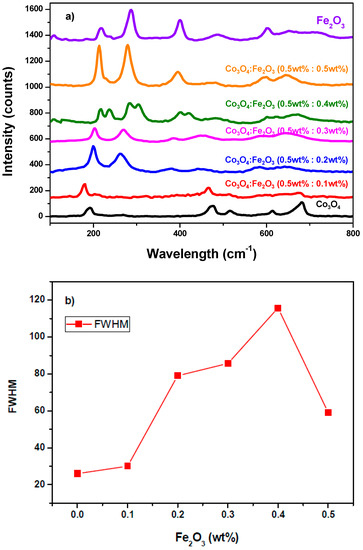
Figure 4.
(a) Raman spectra of pure Fe2O3 (purple line), pure Co3O4 (black line), and Fe2O3:Co3O4 nanocomposites at different wt% ratio on SPCE using 16.6 mW power; (b) FWHM of A1g Raman peak vs. the percentage of Fe in the nanocomposite.
The highest value of FWHM was obtained for Co3O4:Fe2O3 (0.5 wt%:0.4 wt%) which may have been due to a higher cobalt spinel distortion [29]. Moreover, a shift towards lower energies was observed for the F2g2 and E2g Raman modes while increasing the Fe2O3, which agreed with other works [24,27] and may be due to the effective interaction between the components of the Co3O4:Fe2O3 nanocomposite. Table 2 presents the vibrational Raman modes obtained in this work, compared with the literature, and their assignments.

Table 2.
Raman vibrational modes.
3.2. Electrochemical Characterization of Modified SPCE
Cyclic voltametric (CV) and electrochemical impedance spectroscopy (EIS) tests were performed in 10 mM ferrocyanide solution (K3Fe(CN)6) for all modified electrodes. Figure 5a shows the Nyquist plot (i.e., plotting imaginary impedance (−Z″) versus real impedance (Z′)) of the modified and unmodified electrodes in 10 mM ferrocyanide solution in PBS solution.
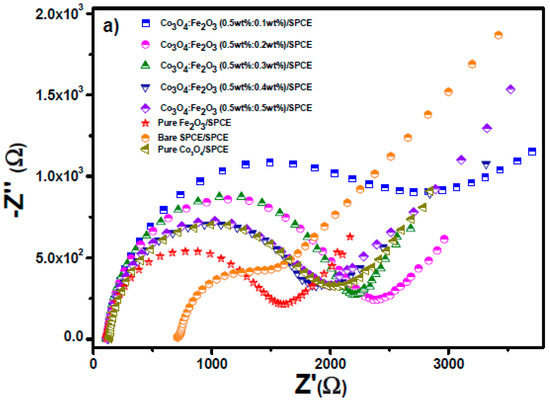
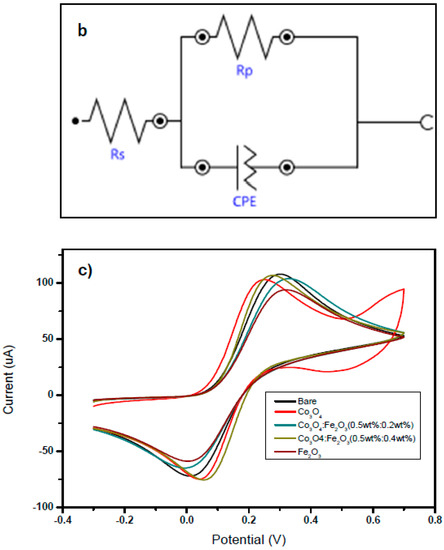
Figure 5.
(a) Nyquist plot of modified SPCE electrodes. (b) Equivalent circuit. (c) CV tests on the unmodified and modified electrodes carried out in 10 mM [Fe(CN)6]3−/4− solution.
Using the fitting function by the Nova software, the equivalent circuit (Figure 5b) and the Randles parameters were determined and are reported in Table 3. Based on this EIS analysis, it is noteworthy that increasing the amount of Fe2O3 in the nanocomposite leads to a decrease in the circle radius, related to the charge transfer resistance RCT, indicating the fast kinetic features of the composite-modified electrodes [30]. The conductivity feature is identified with the Randles parameter Rs. Modified electrodes display an increase in Rs value with respect to bare SPCEs, likely because of the greater distance of the solution from the electrode surface.

Table 3.
Randles parameters of the modified electrodes.
Figure 5c reports the CV analysis carried out in 10 mM [Fe(CN)6]3−/4− solution, in the −0.3–0.7 V potential range. It was noted that the addition of Fe2O3 improved the electrochemical characteristics (e.g., the oxidation/reduction peaks of Fe(CN)6]3−/4− were narrower) of the bare SPCE and Co3O4–modified electrode.
Then, one more test was performed to select the best electrode for the detection of DA. First, we performed an optimization test to find the appropriate amount of the modifier to drop cast on the modified electrode (30, 50, 70 and 100 µL). The CV test was performed in a phosphate buffer solution (PBS, pH = 7.4, C = 0.01 M) containing 50 µM of DA. On all the modified SPCE electrodes, the anodic peak of DA was obtained at about 0.1 V. The highest oxidation peak current was obtained when modifying the working electrode with 50µL.
When evaluating the response to 50 µM of dopamine, the best electrochemical performance was displayed by the Co3O4:Fe2O3(0.5 wt%:0.4 wt%) nanocomposite-based SPCE (see Figure S1 and Figure 6).
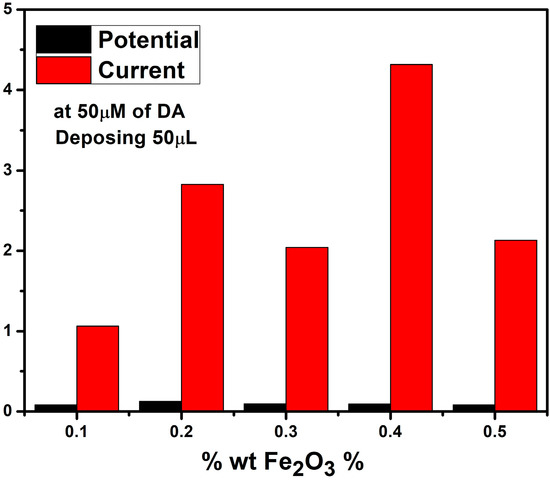
Figure 6.
Histogram of the response of the response to 50 µM of DA by the different Fe2O3 nanocomposites.
From these findings, the current decreased due to the variation in wt% of Fe2O3 from 0.1 to 0.3, and the potential increased due to the increase in the mass transport between the electrolyte and the electrode surface. Surprisingly, the current increased again to reach a higher value than that obtained with x = 0.1%, then decreased to a similar current value compared to Fe2O3 wt. 0.2%.
To discover if the electrochemical behavior of DA on Co3O4:Fe2O3 (0.5 wt%:0.4 wt%)/SPCE is diffusion or adsorption controlled, the variation of scan rate versus anodic peak was plotted, see Figure 7a. Indeed, by increasing the scan rate from 0.02 to 0.4 V/s, a slight shift in the potential was noted, indicating that the mass transport had decreased. Figure 7b illustrates a linear variation of the scan rate root versus the anodic current with R2 = 0.99 for both bare/SPCE and Co3O4:Fe2O3 (0.5 wt%:0.4 wt%)/SPCE. These findings show that the redox reaction was diffusion controlled for the prior electrode, see Figure 7b.
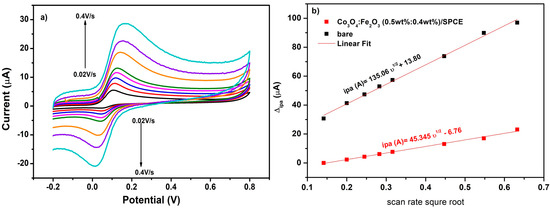
Figure 7.
(a) Scan rate variation from 0.02 V/s to 0.4 V/s on Co3O4:Fe2O3 (0.5 wt%:0.4 wt%)/SPCE 100µM of DA in 10 mM Fe(CN)6]3/4−; (b) current of anodic (black line) and cathodic (red line) peaks versus square root of scan rate.
According to previous work, we determined the active surface area (A) through the Randles-Sevcik equation [30]:
where C is the concentration in mol cm−3, n is the number of electrons, ν is the scan rate, and D is the diffusion coefficient of the electrolyte [Fe(CN)6]3/4− expressed in cm2/s equal to 7.6 × 10⁻⁶ cm2 s−1. The anodic peak current (Ipa) is expressed in µA. From this equation, the active surface area of Co3O4:Fe2O3 was found to be 1.45 × 10⁻² cm−2, that is, almost 20 times greater compared to that of bare/SPCE.
3.3. Electroanalytical Dopamine Determination
Herein, we first tested the electroanalytical performance of two modified electrodes (Fe2O3/SPCE and Co3O4/SPCE) for the determination of DA compared with the bare SPCE electrode. The CV tests were performed in PBS solution containing different concentrations of DA ranging from 0 to 100 µM at [−0.2–0.8 V] potential range and 0.05 V/s scan rate. The results of this test are shown in the following Figure 8a–c. According to the results, the Co3O4/SPCE sensor displays the poorest electroanalytical behavior toward the redox reaction of dopamine while bare and Fe2O3/SPCE electrodes depict similar performance.
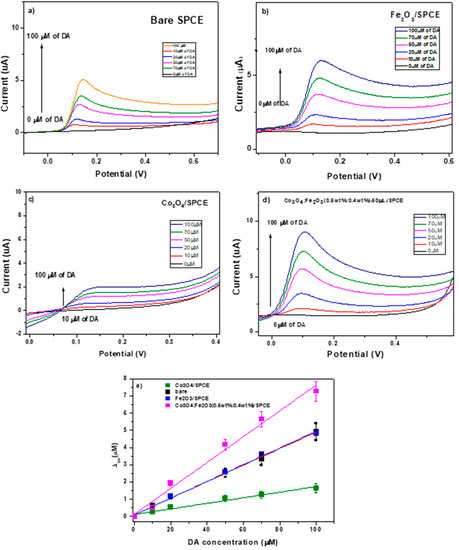
Figure 8.
(a) CV test in the presence of DA on bare SPCE; (b) calibration curves vs. DA concentrations for SPCE, Fe2O3/SPCE, and Co3O4/SPCE; (c) CV test in the presence of DA on Co3O4:Fe2O3 (0.5 wt%:0.4 wt%)/SPCE, and (d) comparison of calibration curves of modified and unmodified electrodes. (e) calibration curve.
We also carried out a CV test under the same conditions on the Co3O4:Fe2O3 (0.5 wt%:0.4 wt%)/SPCE for the determination of DA at different concentrations, see Figure 8d. Compared to the bare and pure modified SPCE electrodes, Co3O4:Fe2O3 (0.5 wt%:0.4 wt%)/SPCE showed better electroanalytical performance where the DA Faradic current exhibited an increase of ~2-fold. Figure 8c presents the calibration curves of the modified and unmodified SPCEs electrodes where the peak current varied linearly with DA concentration. The regression equations of bare/SPCE, Fe2O3/SPCE, Co3O4/SPCE and Co3O4:Fe2O3 (0.5 wt%:0.4 wt%)/SPC are ipa (μA) = 0.047 + 0.103 CDA (μA), ipa (μA) = 0.048 + 0.099 CDA (μA), ipa (μA) = 0.016 + 0.119 CDA (μA), and ipa (μA) = 0.0736 + 0.1031 CDA (μA), respectively. The sensitivity (S) of this electrode was computed from the calibration curve, and the limit of detection (LOD) was determined by equation
where SD is the standard deviation and σ is the slope determined from the calibration curve, that were found to be 0.604 µA µM−1cm−2 and 0.24 µM, respectively.
LOD = 3.3 SD/σ,
Based on the microstructural and electrochemical results obtained, we just report below a brief discussion of the electrochemical sensing mechanism of Co3O4–Fe2O3 heterojunctions. Figure 9 show the relationship between the FWHM value obtained by the above reported Raman measurements for the different Co3O4:Fe2O3 heterostructures and the response (defined by the current peak) to dopamine. This finding suggests that cobalt spinel distortion introduced by Fe2O3 is a key factor in enhancing the electrochemical characteristics for dopamine detection.
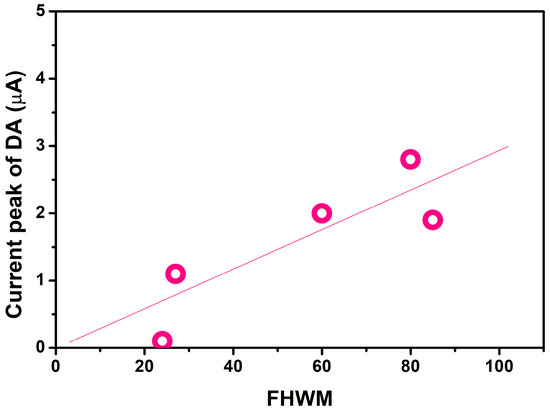
Figure 9.
Relationship between the FWHM value obtained for the various Co3O4:Fe2O3 heterostructures and the response to dopamine.
The distortion caused a change in the structural parameters of the composite heterostructures compared to the single metal oxides. Specifically, an increase in surface area was noted (see Table 1), leading to an enhancement in the number of more active sites. In any case, based on the other characterizations carried out, it cannot be excluded that other factors contributed to the enhanced response of the Co3O4:Fe2O3 heterostructures towards the target analyte. The superior sensing performances of the composites in comparison to the corresponding single phase metal oxides may indeed be due to the build-up of potential barriers at the p–n interface. The same finding was reported in other research. For example, because of the introduction of the p–n junction interface and the high catalytic activity of ZnO NPs, Liang and collaborators found that the sensitivity to DA was enhanced significantly [31]. Co3O4–Fe2O3 p–n heterojunctions have attracted much attention for improving gas-sensing performance [32,33] and for their excellent electrocatalytic activity for OER in alkaline solution [34], but no work has been reported about their use in electrochemical sensors. So, more detailed work is necessary to obtain the information that would be helpful in formulating a reliable hypothesis for the sensing mechanism. Nevertheless, considering the higher electron transfer or lower charge transfer resistance (see value of RCT in Table 3) of the nanocomposite samples and, thus, the higher electrochemical activity, it can be assumed that p–n junctions play a decisive role in the sensing mechanism.
Summarizing, the results obtained may be due to all these factors: (ⅰ) the increase in surface area which also improves the DA approach to the electrode surface; (ⅱ) the formation of numerous and more active sites at the Co3O4:Fe2O3 interface; (ⅲ) the improved electrical properties due to p–n junctions. Hence, a plausible sensing mechanism for dopamine detection implies that the target analyte adsorbs easily and in higher quantity on the Co3O4:Fe2O3 heterostructure hybrid nanoparticles. Better interaction between the heterostructured electrocatalyst and DA leads to better oxidation and sensitive detection. This step also helps to activate the hydroxyl group of DA towards electro-oxidation, thus, resulting in an improved electron transfer with the electrode. Overall, the formation of the Co3O4:Fe2O3 heterostructure reduces the impedance and increases the availability of electrons which is the crucial step for electrochemical sensing.
A comparison of the analytical parameters for the detection of DA on our modified electrode with previous sensors reported in the literature is presented in Table 4, below. Based on these reference papers, the performances of the proposed modified electrode are good, also considering the simple materials used and its easy and cost-effective preparation.

Table 4.
Comparison of the analytical parameters of our modified electrode and previous sensors reported in the literature for the detection of DA.
3.4. Interference Tests
In addition to the good electrochemical response toward DA determination observed with Co3O4:Fe2O3 (0.5 wt%:0.4 wt%)/SPCE, we checked the response to analytes other than DA in 0.01 M PBS solution and at a scan rate of 0.05 V/s. The chosen analytes were uric acid (UA), folic acid (FA), and L-tyrosine. As depicted in Figure 10a, the tyrosine (Tyr) oxidation peak can be clearly observed on the modified electrode at ~0.6 V. The DA faradic current remained constant when increasing L-Tyr concentration from 20 to 200µM. In Figure 10b, after widening the potential applied up to 1.1 V, we also observed the oxidation peak at ~0.8 V, due to the redox Fe2+/Fe3+ process [43] and FA (~1.0 V) added as another analyte. As shown, also after the addition of all these analytes, the peak current related to dopamine remained well stable.
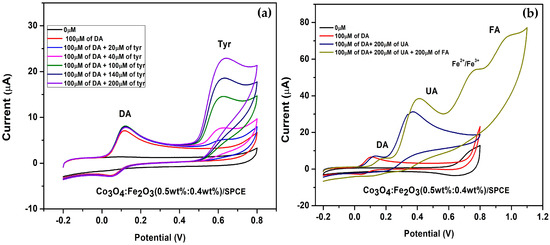
Figure 10.
Selectivity test of Co3O4:Fe2O3 (0.5 wt%:0.4 wt%)/SPCE in PBS containing 100 µM of DA and (a) L-Tyrosine at different concentrations ranging from 0 to 100 µM, (b) 200 µM of UA and 200µM of FA.
The above tests are helpful, anyway, when trying to develop a practical sensor for dopamine detection. These future studies are planned with the primary objective of optimizing the performance for dopamine detection in order to develop a practical sensor.
4. Conclusions
In this paper, we modified SPCEs using different Co3O4:Fe2O3 heterojunctions and tested them toward the determination of DA. Through this study, the formation of Co3O4:Fe2O3 (0.5 wt%:0.4 wt%) resulted in a nanocomposite with the best performance in the determination of DA. Using this modified SPCE, an increment in the faradic current towards DA was observed when compared to unmodified and other modified Co3O4:Fe2O3/SPCEs with a sensitivity and limit of detection (LOD) equal to 0.604 µA µM−1cm−2 and 0.24 µM, respectively. This modified electrode showed further good selectivity toward L-Tyr, UA, and riboflavin. These results were attributed to the formation of Co3O4:Fe2O3 heterostructures, as confirmed by XRD, Raman, and FTIR characterization analysis. The enhanced-sensing mechanism was also discussed, which could be explained by the synergistic effects induced by the larger specific surface area and consequently an enhanced adsorption of DA compared to the single metal oxides. The p–n junction formed also played a key role in enhancing the electrochemical response to DA. Due to the above-reported promising results, we plan future studies with the objective of optimizing the performance of dopamine detection and try to develop a sensor for practical application in clinical medicine.
Supplementary Materials
The following supporting information can be downloaded at: https://www.mdpi.com/article/10.3390/chemosensors11070379/s1, Figure S1: CV curves of the response to 50 µM of DA by the different Fe2O3 nanocomposites.
Author Contributions
Conceptualization, M.K. and M.H.; synthesis of Fe2O3, Co3O4, and Fe2O3-Co3O4 nanocomposites; BET characterization: V.B.; Raman characterization: K.A., A.F. (Antonino Foti) and P.G.G.; electrode preparation: K.A. and M.K.; Raman investigation: K.A., A.F. (Antonino Foti) and P.G.G.; BET investigation: V.B.; ATR-FTIR investigation: K.A. and M.K.; electrochemical investigation: K.A., M.K., A.F. (Angelo Ferlazzo); writing—original draft preparation, M.K., K.A.; writing—review and editing, G.N.; supervision M.H., C.E. and G.N. All authors have read and agreed to the published version of the manuscript.
Funding
This research received no external funding.
Institutional Review Board Statement
Not applicable.
Informed Consent Statement
Not applicable.
Data Availability Statement
Not applicable.
Conflicts of Interest
The authors declare no conflict of interest.
References
- Moujalled, D.; Strasser, A.; Liddell, J.R. Molecular Mechanisms of Cell Death in Neurological Diseases. Cell Death Differ. 2021, 28, 2029–2044. [Google Scholar] [CrossRef] [PubMed]
- Pan, X.; Kaminga, A.C.; Wen, S.W.; Wu, X.; Acheampong, K.; Liu, A. Dopamine and Dopamine Receptors in Alzheimer’s Disease: A Systematic Review and Network Meta-Analysis. Front. Aging Neurosci. 2019, 11, 175. [Google Scholar] [CrossRef] [PubMed]
- Grant, C.E.; Flis, A.L.; Ryan, B.M. Understanding the Role of Dopamine in Cancer: Past, Present and Future. Carcinogenesis 2022, 43, 517–527. [Google Scholar] [CrossRef] [PubMed]
- Lakard, S.; Pavel, I.-A.; Lakard, B. Electrochemical Biosensing of Dopamine Neurotransmitter: A Review. Biosensors 2021, 11, 179. [Google Scholar] [CrossRef]
- Grieshaber, D.; MacKenzie, R.; Vörös, J.; Reimhult, E. Electrochemical Biosensors—Sensor Principles and Architectures. Sensors 2008, 8, 1400–1458. [Google Scholar] [CrossRef]
- Sargazi, S.; Fatima, I.; Hassan Kiani, M.; Mohammadzadeh, V.; Arshad, R.; Bilal, M.; Rahdar, A.; Díez-Pascual, A.M.; Behzadmehr, R. Fluorescent-Based Nanosensors for Selective Detection of a Wide Range of Biological Macromolecules: A Comprehensive Review. Int. J. Biol. Macromol. 2022, 206, 115–147. [Google Scholar] [CrossRef]
- Taheri, R.A.; Eskandari, K.; Negahdary, M. An Electrochemical Dopamine Aptasensor Using the Modified Au Electrode with Spindle-Shaped Gold Nanostructure. Microchem. J. 2018, 143, 243–251. [Google Scholar] [CrossRef]
- Varmira, K.; Mohammadi, G.; Mahmoudi, M.; Khodarahmi, R.; Rashidi, K.; Hedayati, M.; Goicoechea, H.C.; Jalalvand, A.R. Fabrication of a Novel Enzymatic Electrochemical Biosensor for Determination of Tyrosine in Some Food Samples. Talanta 2018, 183, 1–10. [Google Scholar] [CrossRef]
- Ferlazzo, A.; Espro, C.; Iannazzo, D.; Neri, G. Determination of Phenylalanine by a Novel Enzymatic PHD/SPE Biosensor. IEEE Trans. Instrum. Meas. 2023, 72, 9508308. [Google Scholar] [CrossRef]
- Abid, K.; Zribi, R.; Maalej, R.; Foti, A.; Khaskhoussi, A.; Gucciardi, P.G.; Neri, G. Electrochemical and Sensing Properties of AuNps-2D-MoS2/SPCE for Folic Acid Determination. FlatChem 2022, 36, 100433. [Google Scholar] [CrossRef]
- Okpara, E.C.; Nde, S.C.; Fayemi, O.E.; Ebenso, E.E. Electrochemical Characterization and Detection of Lead in Water Using SPCE Modified with BiONPs/PANI. Nanomaterials 2021, 11, 1294. [Google Scholar] [CrossRef]
- Neri, G. First Fifty Years of Chemoresistive Gas Sensors. Chemosensors 2015, 3, 1. [Google Scholar] [CrossRef]
- Fazio, E.; Spadaro, S.; Corsaro, C.; Neri, G.; Leonardi, S.G.; Neri, F.; Lavanya, N.; Sekar, C.; Donato, N.; Neri, G. Metal-Oxide Based Nanomaterials: Synthesis, Characterization and Their Applications in Electrical and Electrochemical Sensors. Sensors 2021, 21, 2494. [Google Scholar] [CrossRef] [PubMed]
- Liu, L.; Wang, Y.; Liu, Y.; Wang, S.; Li, T.; Feng, S.; Qin, S.; Zhang, T. Heteronanostructural Metal Oxide-Based Gas Microsensors. Microsyst. Nanoeng. 2022, 8, 85. [Google Scholar] [CrossRef] [PubMed]
- Kumarage, G.W.C.; Comini, E. Low-Dimensional Nanostructures Based on Cobalt Oxide (Co3O4) in Chemical-Gas Sensing. Chemosensors 2021, 9, 197. [Google Scholar] [CrossRef]
- Sun, C.; Huang, H.; Wang, J.; Liu, W.; Yang, Z.; Yu, X.-F. Applications of Electrochemical Biosensors Based on 2D Materials and Their Hybrid Composites in Hematological Malignancies Diagnosis. Technol. Cancer Res. Treat. 2022, 21, 15330338221142996. [Google Scholar] [CrossRef]
- Agnihotri, A.S.; Varghese, A.; Nidhin, M. Transition Metal Oxides in Electrochemical and Bio Sensing: A State-of-Art Review. Appl. Surf. Sci. Adv. 2021, 4, 100072. [Google Scholar] [CrossRef]
- Zhou, Z.; Liu, X.; Chan, H. Synthesis of Fe3O4 Nanoparticles from Emulsions. J. Mater. Chem. 2001, 11, 1704–1709. [Google Scholar] [CrossRef]
- Wu, W.; Wu, Z.; Yu, T.; Jiang, C.; Kim, W.-S. Recent Progress on Magnetic Iron Oxide Nanoparticles: Synthesis, Surface Functional Strategies and Biomedical Applications. Sci. Technol. Adv. Mater. 2015, 16, 023501. [Google Scholar] [CrossRef]
- Choi, H.K.; Lee, M.-J.; Lee, S.N.; Kim, T.-H.; Oh, B.-K. Noble Metal Nanomaterial-Based Biosensors for Electrochemical and Optical Detection of Viruses Causing Respiratory Illnesses. Front. Chem. 2021, 9, 672739. [Google Scholar] [CrossRef]
- Chen, W.; Yi, P.; Zhang, Y.; Zhang, L.; Deng, Z.; Zhang, Z. Composites of Aminodextran-Coated Fe3O4 Nanoparticles and Graphene Oxide for Cellular Magnetic Resonance Imaging. ACS Appl. Mater. Interfaces 2011, 3, 4085–4091. [Google Scholar] [CrossRef]
- Izadiyan, Z.; Shameli, K.; Miyake, M.; Hara, H.; Mohamad, S.E.B.; Kalantari, K.; Taib, S.H.M.; Rasouli, E. Cytotoxicity Assay of Plant-Mediated Synthesized Iron Oxide Nanoparticles Using Juglans Regia Green Husk Extract. Arab. J. Chem. 2020, 13, 2011–2023. [Google Scholar] [CrossRef]
- Qin, H.; Wang, C.M.; Dong, Q.Q.; Zhang, L.; Zhang, X.; Ma, Z.Y.; Han, Q.R. Preparation and Characterization of Magnetic Fe3O4–Chitosan Nanoparticles Loaded with Isoniazid. J. Magn. Magn. Mater. 2015, 381, 120–126. [Google Scholar] [CrossRef]
- Bhushan, M.; Kumar, Y.; Periyasamy, L.; Viswanath, A.K. Antibacterial Applications of α-Fe2O3/Co3O4 Nanocomposites and Study of Their Structural, Optical, Magnetic and Cytotoxic Characteristics. Appl. Nanosci. 2018, 8, 137–153. [Google Scholar] [CrossRef]
- Basavegowda, N.; Mishra, K.; Rok Lee, Y. Synthesis, Characterization, and Catalytic Applications of Hematite (α-Fe2O3) Nanoparticles as Reusable Nanocatalyst. Adv. Nat. Sci. Nanosci. Nanotechnol. 2017, 8, 025017. Available online: https://iopscience.iop.org/article/10.1088/2043-6254/aa6885 (accessed on 29 June 2023). [CrossRef]
- Lu, J.-F.; Tsai, C.-J. Hydrothermal Phase Transformation of Hematite to Magnetite. Nanoscale Res. Lett. 2014, 9, 230. [Google Scholar] [CrossRef]
- Li, J.; Lu, G.; Wu, G.; Mao, D.; Guo, Y.; Wang, Y.; Guo, Y. The Role of Iron Oxide in the Highly Effective Fe-Modified Co3O4 Catalyst for Low-Temperature CO Oxidation. RSC Adv. 2013, 3, 12409–12416. [Google Scholar] [CrossRef]
- Farhadi, S.; Javanmard, M.; Nadri, G. Characterization of Cobalt Oxide Nanoparticles Prepared by the Thermal Decomposition. Acta Chim. Slov. 2016, 63, 335–343. [Google Scholar] [CrossRef]
- Choya, A.; de Rivas, B.; Gutiérrez-Ortiz, J.I.; González-Velasco, J.R.; López-Fonseca, R. Synthesis, Characterization and Kinetic Behavior of Supported Cobalt Catalysts for Oxidative after-Treatment of Methane Lean Mixtures. Materials 2019, 12, 3174. [Google Scholar] [CrossRef]
- Laschuk, N.; Easton, E.; Zenkina, O. Reducing the Resistance for the Use of Electrochemical Impedance Spectroscopy Analysis in Materials Chemistry. RSC Adv. 2021, 11, 27925–27936. [Google Scholar] [CrossRef]
- Liang, J.-J.; Zhao, M.-G.; Ding, L.-J.; Fan, S.-S.; Chen, S.-G. Fabrication of the ZnO/NiO p–n Junction Foam for the Enhanced Sensing Performance. Chin. Chem. Lett. 2017, 28, 670–674. [Google Scholar] [CrossRef]
- Xu, K.; Gao, J.; Chen, P.; Zhan, C.; Yang, Y.; Wang, Z.; Yang, Y.; Yang, L.; Yuan, C. Interface Engineering of Fe2O3@Co3O4 Nanocubes for Enhanced Triethylamine Sensing Performance. Ind. Eng. Chem. Res. 2022, 61, 8057–8068. [Google Scholar] [CrossRef]
- Xu, K.; Zhao, W.; Yu, X.; Duan, S.; Zeng, W. MOF-derived Co3O4/Fe2O3 p-n hollow cubes for improved acetone sensing characteristics. Phys. E Low Dimens. Syst. Nanostruct. 2020, 118, 113869. [Google Scholar] [CrossRef]
- Yue, H.Y.; Wu, P.F.; Huang, S.; Gao, X.; Song, S.S.; Wang, W.Q.; Zhang, H.J.; Guo, X.R. Electrochemical Determination of Dopamine in the Presence of Uric Acid Using WS2 Nanospheres-Carbon Nanofibers. J. Electroanal. Chem. 2019, 833, 427–432. [Google Scholar] [CrossRef]
- Mahesh, K.P.O.; Shown, I.; Chen, L.-C.; Chen, K.-H.; Tai, Y. Flexible Sensor for Dopamine Detection Fabricated by the Direct Growth of α-Fe2O3 Nanoparticles on Carbon Cloth. Appl. Surf. Sci. 2018, 427, 387–395. [Google Scholar] [CrossRef]
- Yang, Y.; Zhu, C.; Zhang, Y.; Xie, Y.; Lv, L.; Chen, W.; He, Y.; Hu, Z. Construction of Co3O4/Fe2O3 nanosheets on nickel foam as efficient electrocatalyst for the oxygen evolution reaction. J. Phys. Chem. Solids 2021, 148, 109680. [Google Scholar] [CrossRef]
- Cai, L.; Hou, B.; Shang, Y.; Xu, L.; Zhou, B.; Jiang, X.; Jiang, X. Synthesis of Fe3O4/Graphene Oxide/Pristine Graphene Ternary Composite and Fabrication Electrochemical Sensor to Detect Dopamine and Hydrogen Peroxide. Chem. Phys. Lett. 2019, 736, 136797. [Google Scholar] [CrossRef]
- Oğuz, M.; Aykaç, A.; Sen, M. Highly Sensitive and Selective Electrochemical Detection of Dopamine and Uric Acid Using Sea Urchin-like Tungsten Oxide Nanostructure Modified SPCE. ChemRxiv 2020, 3, 2011–2023. [Google Scholar] [CrossRef]
- Peik-See, T.; Pandikumar, A.; Nay-Ming, H.; Hong-Ngee, L.; Sulaiman, Y. Simultaneous Electrochemical Detection of Dopamine and Ascorbic Acid Using an Iron Oxide/Reduced Graphene Oxide Modified Glassy Carbon Electrode. Sensors 2014, 14, 15227–15243. [Google Scholar] [CrossRef]
- Ranku, M.N.; Uwaya, G.E.; Fayemi, O.E. Electrochemical Detection of Dopamine at Fe3O4/SPEEK Modified Electrode. Molecules 2021, 26, 5357. [Google Scholar] [CrossRef]
- Liu, T.; Zhang, X.; Fu, K.; Zhou, N.; Xiong, J.; Su, Z. Fabrication of Co3O4/NiCo2O4 Nanocomposite for Detection of H2O2 and Dopamine. Biosensors 2021, 11, 452. [Google Scholar] [CrossRef]
- Chelly, S.; Chelly, M.; Zribi, R.; Gdoura, R.; Bouaziz-Ketata, H.; Neri, G. Electrochemical Detection of Dopamine and Riboflavine on a Screen-Printed Carbon Electrode Modified by AuNPs Derived from Rhanterium Suaveolens Plant Extract. ACS Omega 2021, 6, 23666–23675. [Google Scholar] [CrossRef]
- Kabtamu, D.M.; Lin, G.-Y.; Chang, Y.-C.; Chen, H.-Y.; Huang, H.-C.; Hsu, N.-Y.; Chou, Y.-S.; Wei, H.-J.; Wang, C.-H. The Effect of Adding Bi3+ on the Performance of a Newly Developed Iron–Copper Redox Flow Battery. RSC Adv. 2018, 8, 8537–8543. [Google Scholar] [CrossRef]
Disclaimer/Publisher’s Note: The statements, opinions and data contained in all publications are solely those of the individual author(s) and contributor(s) and not of MDPI and/or the editor(s). MDPI and/or the editor(s) disclaim responsibility for any injury to people or property resulting from any ideas, methods, instructions or products referred to in the content. |
© 2023 by the authors. Licensee MDPI, Basel, Switzerland. This article is an open access article distributed under the terms and conditions of the Creative Commons Attribution (CC BY) license (https://creativecommons.org/licenses/by/4.0/).