Review

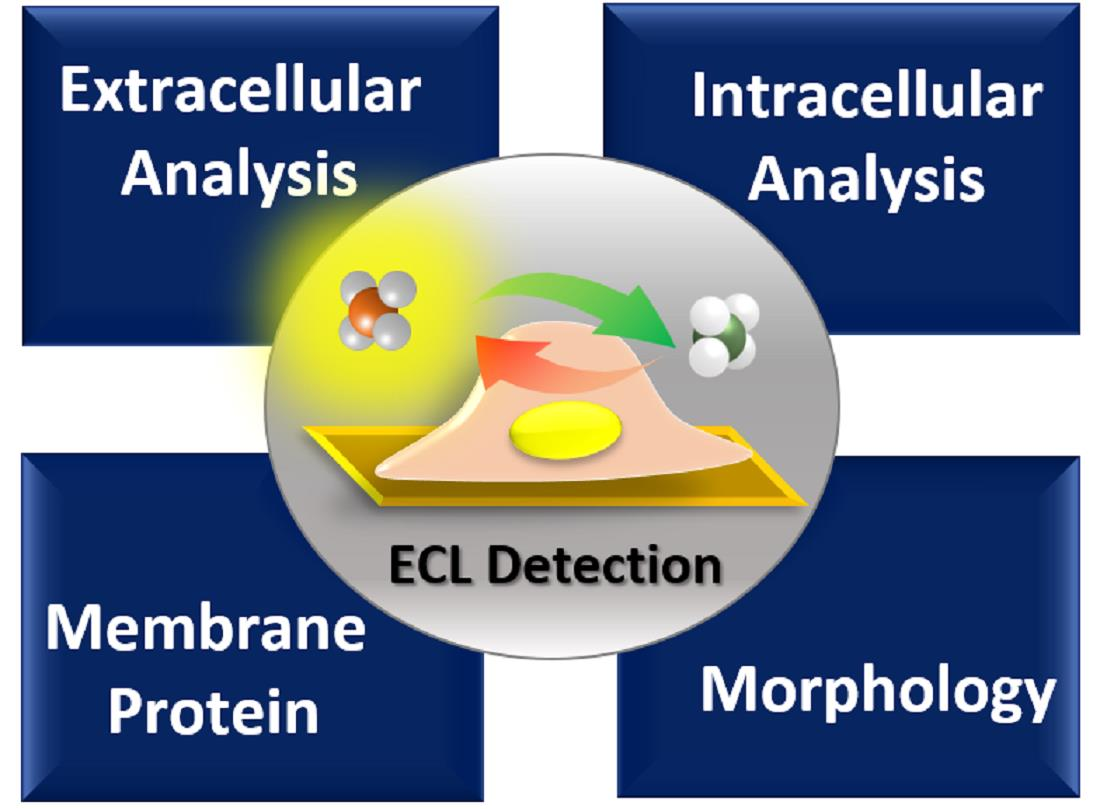
Recent Advances in Electrochemiluminescence-Based Single-Cell Analysis

1
Institute of Nanochemistry and Nanobiology, School of Environmental and Chemical Engineering, Shanghai University, Shanghai 200444, China
2
Shanghai Information Center for Life Sciences, Shanghai Institute of Nutrition and Health, University of Chinese Academy of Sciences, Chinese Academy of Sciences, Shanghai 200031, China
*
Author to whom correspondence should be addressed.
These authors contributed equally to this work.
Chemosensors 2023, 11(5), 281; https://doi.org/10.3390/chemosensors11050281
Submission received: 28 March 2023 / Revised: 29 April 2023 / Accepted: 5 May 2023 / Published: 7 May 2023
(This article belongs to the Special Issue Electrochemical Biosensors: Current Status and Future Perspectives)

Abstract

:
In recent years, the increasing demand for highly sensitive tracking of life processes has promoted scientists to explore advanced analytical techniques. Developing universal analytical methods to detect individual differences and temporal changes among cells is crucial for fundamental study and clinical applications. Among existing technologies, the electrochemiluminescence (ECL) approach has attracted attention for various purposes, such as detecting biomolecules, monitoring cellular activities, imaging subcellular structures, and evaluating cell viability. ECL analysis and imaging provide high sensitivity, low background noise, and spatiotemporal resolution for single-cell analysis. In this review, we explore the evolution of ECL technology in cell analysis and emphasize single-cell assays, including detecting released cellular molecules and surface biomarkers, analysing intracellular components, imaging cell membranes, and cell adhesion. We first briefly introduce the mechanism and apparatus for ECL-based single-cell analysis and, subsequently, focus on four aspects of research related to single-cell analysis and imaging. Furthermore, the latest advances in ECL-driven photodynamic therapy and super-resolution ECL microscopy are also discussed. Finally, we discuss the current obstacles and prospects for ECL single-cell analysis.

Graphical Abstract

1. Introduction

Health issues have emerged as a crucial concern in contemporary human society. Since cells represent living organisms’ fundamental structural and functional units, analyzing living cells holds significant value in various fields, ranging from fundamental biological research to pharmaceutical and clinical diagnosis [1]. Despite its wide use, traditional population-averaged assays often obscure many of the biological functions of cells. Single-cell analysis is an emerging area that provides a meaningful understanding of the cellular and functional differences in a morphologically identified cell population and has developed rapidly in recent years [2]. The objective of the single-cell analysis is to gain insight into the mechanisms of cellular functionality, requiring an understanding of all cellular components, including protein, DNA, RNA, and cellular metabolites [3]. In the past decades, many reports on single-cell analysis have been published, thanks to the rapid development of analytical techniques, such as fluorescence microscopy [4,5,6], mass spectrometry [7,8], photoelectrochemical [9], surface-enhanced Raman scattering [10], and electrochemistry [11,12], etc. Among these methods, fluorescence microscopy using fluorescence labeling to monitor the specific structure and function of cells, is the most widely used for cellular analysis. The evolution of super-resolved fluorescence microscopy has extensively promoted biological studies [13,14]. Optical techniques allow the monitoring of dynamic changes for living cells with high spatiotemporal resolution. However, the external light source may influence the cell functions, and most fluorescent molecules suffer from photo blinking and bleaching. Electrochemical methods such as scanning electrochemical microscopy (SECM) and ultra-microelectrode are highly sensitive [15,16], however, SECM is limited by the time-consuming scanning process, which results in a low temporal resolution. Additionally, traditional microelectrodes exhibit low detection throughput.
Electrochemiluminescence, also called electrogenerated chemiluminescence (ECL), is the production of light by an excited luminophore species generated at the surface of the electrode during an electrochemical reaction [17,18,19]. ECL starts from an electron-transfer process, which triggers a cascade of chemical reactions and generates an excited state of the luminophore. The excited luminophore relaxes to the ground state by emitting a photon. Owing to its integration of electrochemical and spectroscopic methods, ECL possesses several advantages, including excellent sensitivity, low background noise, good temporal and spatial control, fast response speed, high throughput and non-necessity of the usage of an external light source, which differs from most other electrochemical techniques [17,20]. Since the discovery of ECL emission in the 1960s by Santhanam & Bard [21] and Short & Hercules [22], ECL has been used in many fields such as the environmental analysis [23,24,25,26], clinical application [27,28] and cellular analysis [29,30]. In recent years, the ECL detection of single cells became a remarkable research field, especially with the aid of ECL microscopy (ECLM). Combining electrochemical triggering and optical readout, ECLM exhibits advantages including low background, high throughput, high temporal resolution, and low reagent consumption. Without an extrinsic illumination source, the local photothermal effect is limited in ECLM.
In this review, we explore recent studies for single-cell analysis using ECL technique. We provide a brief overview of the ECL mechanisms using ruthenium and luminol, and describe ECL instruments, including conventional intensity-based setups and ECLM. Our primary focus is on the analysis and imaging of single cells by ECL from aspects including extracellular measurement, intracellular measurement, imaging of membrane proteins, and imaging of morphologic change of cells. Finally, the challenges and opportunities for the outlook on ECL detection of single cells are discussed.

2. ECL Systems and Apparatus

2.1. Mechanistic Pathways

ECL is produced by the luminescence process arising from high-energy electron transfer reaction of electronic materials. Since the 1960s, the annihilation and coreactant pathways have been reported and well-studied as two mechanisms of ECL [19]. Depending on the luminophores, the ECL system can be roughly split into organic, inorganic, and nanomaterial systems [31]. Among them, ruthenium complexes, luminol, and their derivatives are the most employed luminophores for the cellular analysis due to their high luminescence efficiency, solubility in an aqueous medium, and the ability to achieve efficient ECL emission at a physiological pH. The mechanisms of these two systems are introduced as follows.
Ruthenium based systems. In a classic ECL detection system, tris(2,20-bipyridyl) ruthenium (II)(Ru(bpy)32+) and its derivatives are important organometallic complex involved in inorganic systems [32]. Ru(bpy)32+ produces ECL through both annihilation and co-reactant pathways. Compared with the annihilation pathway, the co-reactant pathway requires only single potential sweeping in one direction. And it is more efficient for bioanalysis. Co-reactants can be classified into two categories, namely, “oxidative-reductive” co-reactants and “reductive-oxidative” ones. Common anodic co-reactants include tripropylamine (TPrA) and oxalate (C2O42−) [31,33,34]. The Ru(bpy)32+/TPrA (tri-n-propylamine) pair has been extensively studied, and at least four possible mechanisms have been proposed. The most typical reaction route is described as follows Equations (1)–(5):
R u ( b p y ) 3 2 + e R u ( b p y ) 3 3 +
T P r A e T P r A + ·
T P r A + · T P r A · + H +
T P r A · + R u ( b p y ) 3 3 + R u ( b p y ) 3 2 + * + p r o d u c t
R u ( b p y ) 3 2 + * R u ( b p y ) 3 2 + + h v
Besides, Cathodic co-reactants, such as peroxydisulfate (S2O82−) and hydrogen peroxide (H2O2), are also widely used in bioanalysis. For example, Ru(bpy)32+/S2O82− belongs to the “reductive-oxidative” system. Ru(bpy)32+ is reduced to Ru(bpy)3+ by applying a suitable reduction potential to the electrode. S2O82− is also reduced on the electrode to form a strong oxidizing intermediate simultaneously. The redox reaction between the intermediate S O 4 · and Ru(bpy)3+ produces excited R u ( b p y ) 3 2 + * , which emitted a photon Equations (6)–(9):
R u ( b p y ) 3 2 + + e R u ( b p y ) 3 +
R u ( b p y ) 3 + + S 2 O 8 2 R u ( b p y ) 3 2 + + S O 4 · + S O 4 2
R u ( b p y ) 3 + + S O 4 · R u ( b p y ) 3 2 + * + S O 4 2
R u ( b p y ) 3 2 + * R u ( b p y ) 3 2 + + h v
Luminol-based systems. Luminol (5-amino-2,3-dihydro-1,4-phthalazinedione) is one of the most commonly used luminophores for ECL cellular analysis. Generally, luminol is deprotonated in aqueous solutions to generate an anion that can undergo electrochemical oxidation to a diazaquinone form. Hydrogen peroxide is generally an integral part of most luminol ECL-related studies. Since hydrogen peroxide is generated in several biological processes or released from cells through oxidative stress, its detection is usually coupled with luminol ECL. Besides, other reactive oxygen species (ROSs), such as the peroxide anion HOO and the superoxide radical O2•−, can accelerate the generation of the 3-aminophtalate excited state to enhance the ECL emission of luminol. In the presence of hydrogen peroxide, this intermediate species undergoes further oxidation to 3-aminophtalate in its excited state, which subsequently relaxes to the ground state through the emission of a photon in the blue range (λECL = 425 nm) [35,36,37]. The most typical reaction route is described as follows Equations (10)–(14):
L H L · + e + H +
H 2 O 2 O 2 + 2 H + + 2 e
L · + O 2 O 2 · + L
L · + O 2 · L O 2 2
L O 2 2 A P 2 + N 2 + h v
L represents luminol. AP2− is on luminol’s behaviour, gets two oxygen atoms and loses two nitrogen atoms.

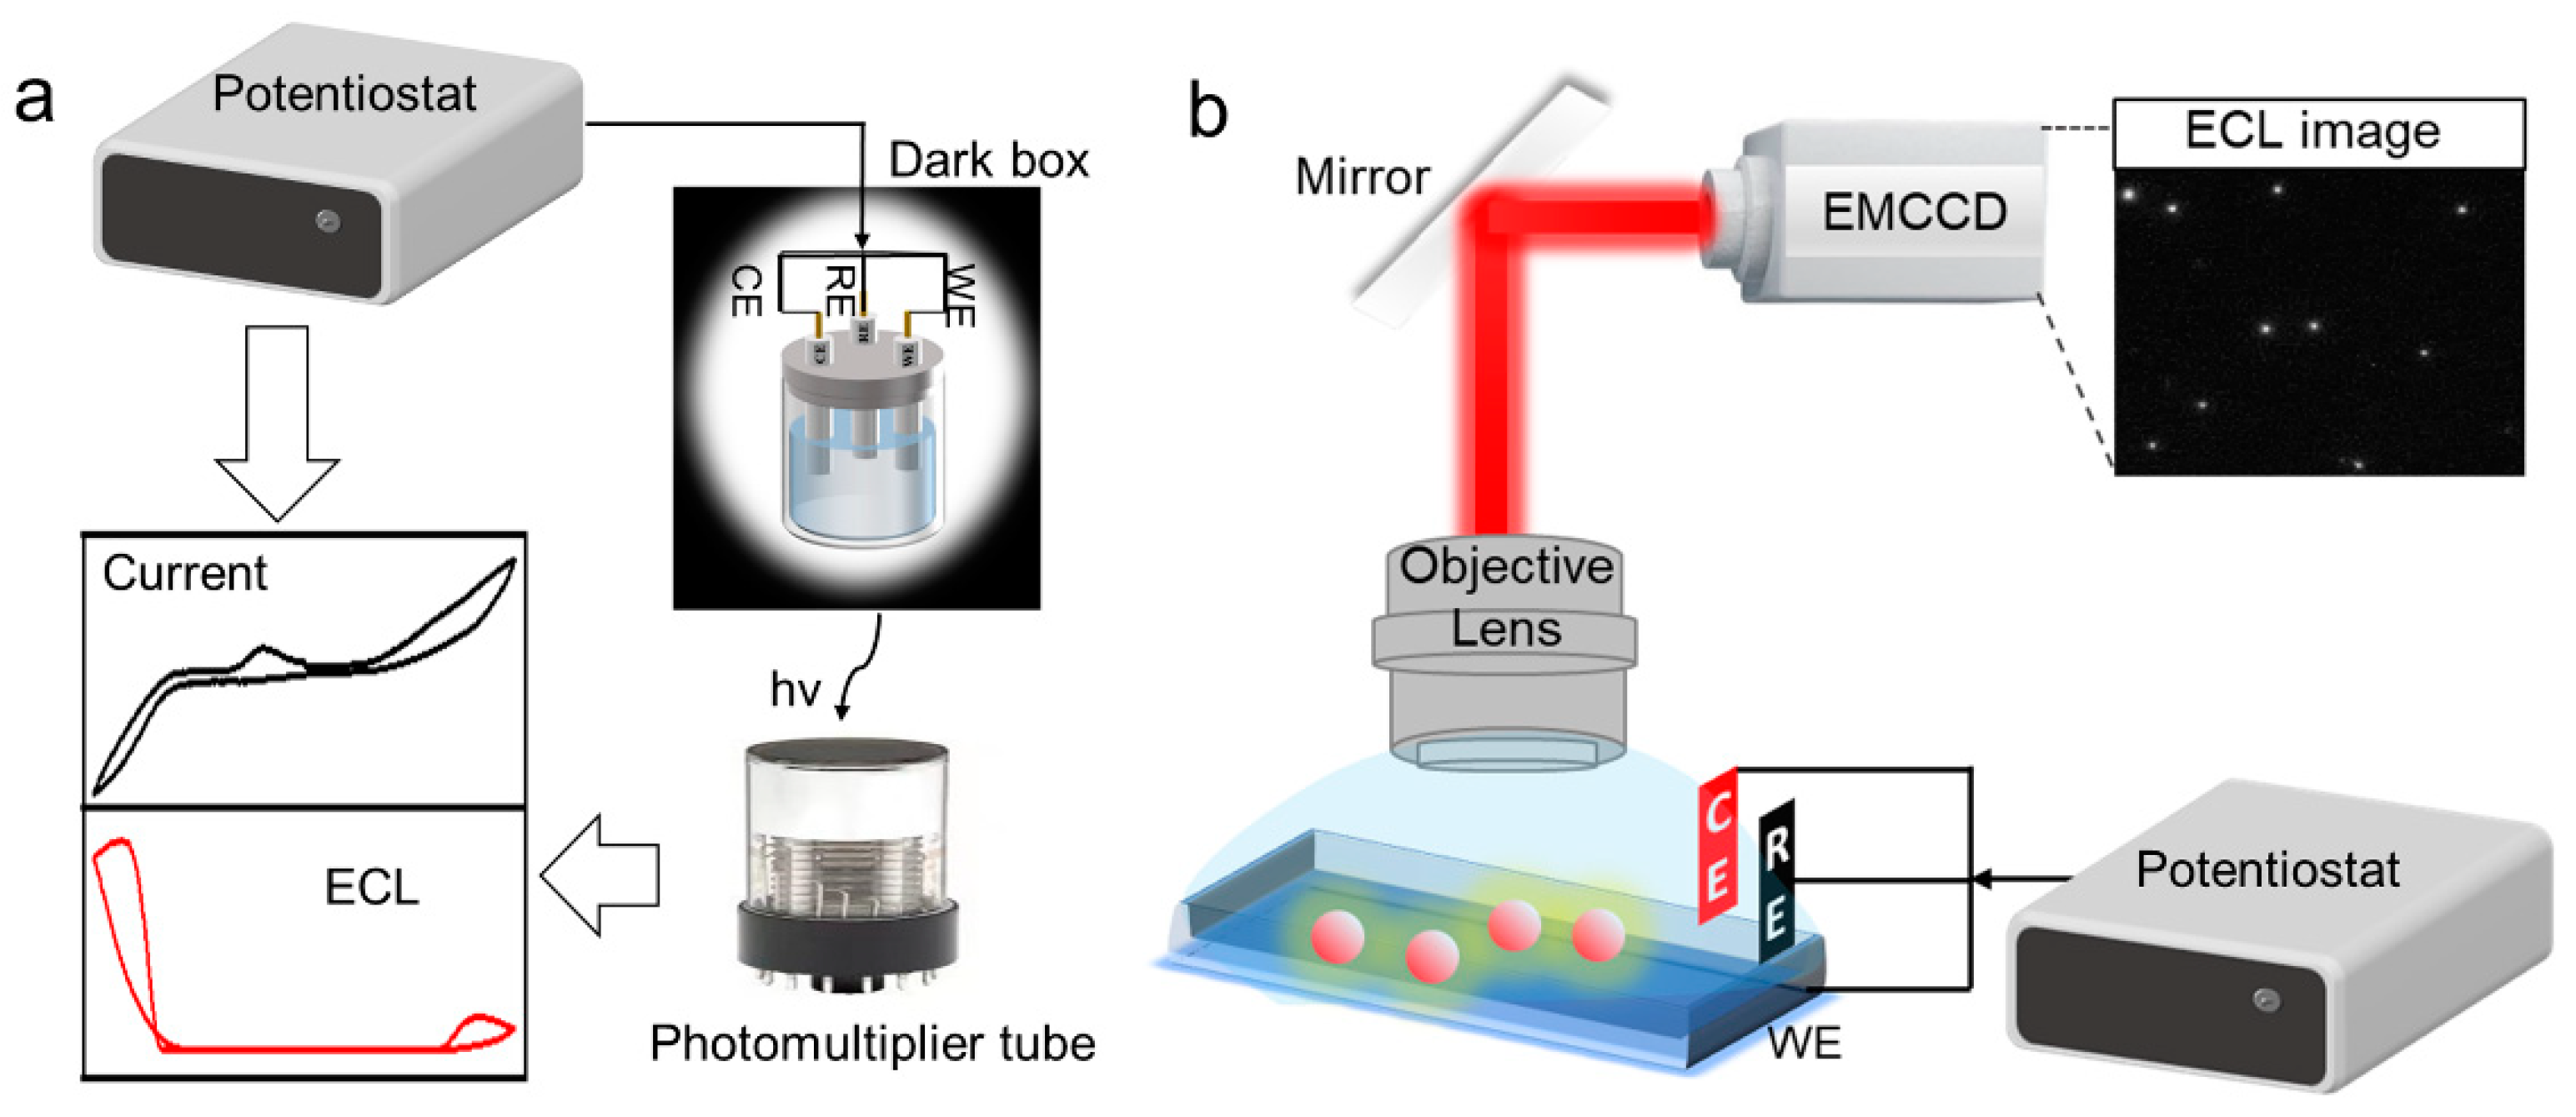
2.2. Fundamental Apparatus

A conventional ECL system mainly includes an electrochemical signal excitation system and an optical signal detection system. The basic principle is to utilize the relationship between the amount of analyte and the ECL intensity of the system and quantitatively or semi-quantitatively measure the concentration of the analyte. The intensity-based ECL detection setup is relatively simple. A photomultiplier tube (PMT), an electrochemical cell and an electrochemical workstation are required (Figure 1a). The PMT converts weak light into an electrical signal. It is widely used because of its low dark current and high photometric sensitivity. The electrochemical cell is usually placed in a dark box to avoid interference from natural light during measurements. The design of electrochemical cells usually adopts a three-electrode system and bipolar electrode (BPE), a well-established wireless approach where both ends can undergo oxidation and reduction reactions simultaneously [38]. Commercial ECL instruments have been developed to synchronize the PMT and electrochemical workstation to record the light and electrical signals simultaneously.
The imaging-based ECL detection device is called ECL microscopy (ECLM). An ECL imaging system mainly consists of two parts: the electrochemical signal driving part and the optical signal acquisition equipment (Figure 1b). On the whole, the basic setup of ECLM generally includes an electrochemical workstation, an electrochemical cell and a bright field microscope equipped with a charge-coupled device (CCD) or an electron-multiplying CCD (EMCCD) [39]. CCD and EMCCD hardware can collect ECL images and output ECL signals in image form. These fundamental apparatuses provide both optical images and electrochemical currents to meet the development requirements of visualization, high-throughput, and diversified information analysis science. They will play a positive role in developing ECL imaging-based systems [40,41].

3. Single-Cell Analysis

Cells are the smallest structural unit of a living organism. Many practical applications have confirmed that it is of great significance to study the expression of cell function in the whole organism and the vast heterogeneity of cells [42]. In cell biology, traditional population average analysis is based on many cells. However, because of cellular heterogeneities, single-cell monitoring can provide more accurate information about cellular processes [43,44,45,46,47]. The rapid development of ECL technology offers a more detailed view of cellular processes by avoiding analytical lapses due to overall averaging, allowing early diagnosis, and assisting the development of drugs and vaccines. In addition, ECLM offers the possibility for direct visual inspection of single cells and the evaluation of biomolecular expression at the single-cell level [43,46,47,48,49]. With the development of high-throughput, informative ECL technology, morphologic and metabolic analyses at the single-cell level are becoming more convenient and providing valuable information for various biological and medical research applications.

3.1. Extracellular Measurement

In studies on cell physiology, it is necessary to detect extracellular molecules such as neurotransmitters, hydrogen peroxide, ATP and ions. Through the extracellular measurement by the ECL technique, researchers can gain insights into cellular behavior, including metabolic processes, gene expression, and other cellular activities.
Hydrogen peroxide is often involved in various cellular functions, regulating the cellular signal transduction pathways as one kind of commonly released cellular molecule. Researchers have been working to establish more sensitive and reliable strategies for detecting H2O2 concentration at the single-cell level. Cui et al. synthesized single semiconductive TiO2 nanoparticles to sense the local efflux of hydrogen peroxide from single living cells [50]. Since the oxygen vacancy on the surface of TiO2 nanoparticles has a high affinity for H2O2, it allows electrons and surface-trapped holes at the nanoparticles to produce superoxide continuously and OH, the co-reactant of luminol. The steady-state luminescence during ECL imaging is correlated with the concentration of hydrogen peroxide. Jian et al. developed MIL−88B(Fe)/TiO2 nanotube-supported Ti wires as microelectrodes for the sensing of H2O2 from single cancer cells by ECL analysis (Figure 2) [51]. TiO2 nanotubes (TiNTs) grew vertically around Ti wires with anodization, which not only acted as a luminophore but also increased the surface area of the ECL electrode. Integrating with MIL−88B(Fe), TiO2-made H2O2 sensors have high sensitivity, a minimum detection limit of 0.1 nM, and a wide-range linear response to a concentration of up to 10 mM. In addition, the intrinsic photocatalytic activity of the MIL−88B(Fe)/TiO2 heterostructure enabled the sensor to self-clean during the photocatalytic process for reuse. Besides, Liu et al. designed a chitosan and nano-TiO2-modified fluoride-doped tin oxide conductive glass (FTO/TiO2/CS) [52]. Increasing the distance between the cell and the FTO via a chitosan film with a certain thickness could solve the negative effect of steric hindrance of cells on the bare electrode, which led to the low light intensity in the cell region, relative to the background. With increased space, more ECL reagents could exist below the cells, which ensured high sensitivity for H2O2 quantitative analysis. Furthermore, modifying TiO2 improved the signal-to-noise ratio effectively and heightened the ECL visual signal in the luminol solution. The light intensity was related to the H2O2 concentration on FTO/TiO2/CS, which could measure the H2O2 released from cells at the single-cell level.
Besides, Jiang’s group designed an analysis system by placing a pinhole (the diameter is 100 μm) below the electrode to determine the amount of membrane−active cholesterol and observe its heterogeneity at the single-cell level [53]. In this work, the cholesterol oxidase reacted with the active cholesterol on the cell membrane to produce hydrogen peroxide, significantly promoting the determination of cholesterol intensity. Afterwards, they prepared a high throughput multi-microelectrode array consisting of eight cell-sized microwells. Under the control of the multiplexer, the voltage was applied to eight microelectrodes in sequence, and PMT would record the luminescence of each microelectrode [54]. Later, Jiang’s group sequentially designed cholesterol oxidase/Triton X−100 packed microelectrodes to detect plasma membrane cholesterol [55]. The microcapillary at the tip of the Pt layer coating was filled with a mixture of Triton X−100 and cholesterol oxidase. When the tip was in contact with the cellular membrane, the Triton X−100 on the tip reacted with the membrane in contact to make it permeable. Then it released cholesterol for the reaction with cholesterol oxidase. Compared with the connection of cholesterol oxidase on the electrode surface in previous literature, the oxidase packed in the tip aqueous solution had a higher turnover rate causing a stronger electrochemical signal. Subsequently, they codetermined different contents of cholesterol and sphingomyelin in single living cells by treating cells sequentially with cholesterol oxidase and enzyme cocktail to produce H2O2 [56,57].
As the most abundant neurotransmitter in the brain, dopamine (DA) homeostasis is associated with various neurological diseases, so it is very important to analyze it effectively. Wang et al. proposed an ECL imaging microarray (CEIM) chip, which can capture a single or a few cells and limit the DA released by a single living cell to an individual microwell, thus achieving in situ and high-throughput quantitative detection of DA [42]. As shown in Figure 3, the ITO surface at the bottom of the microwells was functionalized by combining DA aptamer with co-reactant-embedded polymer dots (Pdots), which gave the chip the ability to recognize the target dopamine secreted by cells. Under the applied potential of +1.4 V, the captured electrochemical oxidation products of DA in individual microwell could quench the strong ECL signal emitted by Pdots, enabling quantitative detection of DA. In addition, it could be confirmed through imaging that the microarray structure could confine a single cell in an individual microwell and avert crosstalk between microwells.

3.2. Intracellular Measurement

Intracellular measurement is also an essential topic for the study of cell physiology. For example, the evaluation of intracellular glucose is essential for the study of cellular activity. To analyze intracellular glucose at the single-cell level, Jiang’s group kept individual cells in cell-sized microwells (30 μm in diameter and height) on Au−ITO slides and then introduced triton X−100 and reacted with glucose oxidase to generate H2O2 [58]. They imaged 64 individual cells on ITO slides in 60 s and observed that all the microwells were brighter, thus detecting intracellular glucose. In addition, they designed the electrochemical visualization of hydrogen peroxide inside a single cell by a novel luminol-Au microelectrode, which could be recorded using EMCCD (Figure 4) [59]. The microelectrode made by mixing chitosan and luminol was filled into the tip opening of the capillary, which was coated with the thin layers of polyvinyl chloride/nitrophenyl octyl ether (PVC/NPOE) and gold. As a result, the capillary with a tip opening of 1–2 μm could be inserted into a cell, and the bright luminescence could be seen at the tip under positive potential. In addition to imaging hydrogen peroxide inside a cell, they also studied the efflux of hydrogen peroxide from single living cells [60]. They optimized double potential mode coupling of an upright optical configuration, requiring only the ITO electrode to make H2O2 visible at concentrations as low as 10 μM. A few years later, they cultured HeLa cells on vertically aligned silica microchannels (SMCs)-coated ITO slides, which restricted the lateral diffusion of the efflux of hydrogen peroxide generated in the ECL process [61]. This work made maps of hydrogen peroxide from single cells with sub-micron spatial resolution possible.
Further, Jiang and co-workers reported a high-throughput ECL analysis of intracellular glucose via gold-coated polydimethylsiloxane (PDMS) chip with cell-sized microwells [62]. They treated cells with triton X−100 and glucose oxidase simultaneously. Triton X−100 would induce the release of intracellular glucose, and proportioned H2O2 would be obtained under the catalyzation by glucose oxidase. Since the whole PDMS slide was covered with a gold layer, the microwell had a proper depth to restrict hydrogen peroxide. The luminescence intensity was correlated with the intracellular glucose level, which can accurately measure the glucose intensity for single cells. For a higher spatial resolution of the ECL imaging, Jiang’s team invented a nanopipette for intracellular analysis of single cells in 2020 (Figure 5) [63]. They structured an open bipolar ECL device using a Pt deposit which decorated the inside walls of a nanopipette tip. The voltage drop was limited within the nanopipette tip, which generated ECL emission from luminol at low voltage. The porous structure of the Pt deposit allows for the electrochemical transport of intracellular molecules into the nanopipette, which permits enzymatic reactions. Thus, the intracellular concentrations of hydrogen peroxide or glucose and the intracellular sphingomyelinase activity are measured in vivo.
In addition to analysing small molecules, proteins and enzymes in single cells could be analyzed by highly sensitive ECL technique. In 2021, Jiang’s group reported drop-on-demand microkits with a diameter of about 20 μm to measure the activity of acetylcholinesterase in a brain slice with single-cell resolution [64]. Micro-capillaries filled with pre-packed kit components were suspended a few micrometers above the brain slice. When a voltage was applied, the micro-droplet produced at the capillary tip descended into contact with the cell in the slice on demand. Then the kit components in the droplet react with the acetylcholinesterase from the cells to generate H2O2. In 2022, Jiang and colleagues developed a wireless bipolar electrochemical luminescence (BPE-ECL) model for visualizing the KDM1/LSD1 antigen in the nucleus of a single MCF-7 cell [65]. This model employed single-walled carbon nanotubes (SWCNTs) linked with anti-KDM1/LSD1 protein antibodies. Owing to the good cellular permeability and biocompatibility of SWCNTs, the single-walled carbon nanotube-antibody complex could be loaded into cells to detect the corresponding KDM1/LSD1 antigen. The gel formation in the capillaries produced a porous structure with a pore size of 70 μm, which is appropriate for retaining a single cell. The luminescent body L012 was utilized to enable electrochemical imaging of intracellular proteins within a single cell through a bright ECL generated by the nanotube present in the cell. Zhang and co-workers combined phosphorylated DNA(p-DNA) and hairpin DNA(h-DNA) onto AuNPs to prepare the biological barcode probe (h-DNA /AuNPs/p-DNA), which acts as a carrier of ECL signal reagent (Ru(phen)32+) [66]. A gold ultramicroelectrode modified with the peptide prepared by a self-assembly technique was inserted into the nucleus to phosphorylate the peptide in the presence of endogenous CK2 and adenosine 5′-triphosphate (ATP). The phosphorylated peptide was coupled to H-DNA /AuNPs/ P-DNA via Zr4+. Finally, Ru(phen)32+ was inserted into h-DNA, and the ECL intensity was recorded under TPA. This ECL technology was employed for monitoring CK2 in HeLa cells in the range of 0.005–0.2 U/mL and a lower detection limit of 0.001 U/mL owing to the small background from the modified peptide gold ultramicroelectrodes and the good sensitivity of h-DNA/AuNPs/p-DNA.
Imaging of cell organs by ECLM has been achieved recently. In 2021, Sojic and co-workers designed a label-free shadow electrochemiluminescence microscope (SECL) for specific subcellular structures to image individual functional living mitochondria deposited on the electrode surface based on the significant negative optical contrast provided by SECL [67]. The system was composed of the freely-diffusing [Ru(bpy)3]2+ dye for a sacrificial TPA co-reactant. This caused the single mitochondria to deposit on the bare electrode to prevent the local diffusion of the ECL reagent and thus caused shadows in local regions to make the image more distinct. In the meantime, Zhu and co-workers designed a biological co-reactant-enhanced ECL microscopy which enabled the ECL imaging of intracellular structure and dynamic transport at single cells for the first time [68]. The ECL microscope utilized Ru(bpy)32+ as the optical readout and an electrocatalytic molecular antenna that connected the extracellular and intracellular environments to generate homogeneous chemical oxidation of Ru(bpy)33+ at the electrode surface. Because the ECL emission layer could extend to the diffusion thickness of Ru(bpy)33+, the entire cell height could be intracellular image structures, as depicted in Figure 6. The unique imaging mode of bio-co-reactant enhanced ECL microscopy can avoid multiple labelling steps and visualize multiple substructures in a single cell concurrently.

3.3. ECL Imaging of Membrane Proteins

The visualization of cellular surface structures and proteins is one of the most critical topics in single-cell studies. In 2017, Sojic’s group first reported surface-confined microscopy on single-image cells and their membrane proteins [69]. They used a biotinylation process to specifically label cell surface proteins by selecting CNT-based inkjet-printed disposable electrodes. ECL was localized to cell borders using streptavidin-ruthenium complexes (SA@Ru(bpy)32+) linked to specific antigens on the membrane or the plasma membrane by immune recognition. (Figure 7a). As shown in Figure 7b, ECL imaging results were different from photoluminescence imaging. Unlike PL images, which showed the entire cell membrane and its various sub-structures, ECL was essentially localized at the cell borders. The difference can be associated with the unique mechanism of ECL generation, and the introduction of ECL microscopy helps elucidate the mechanism of ECL [70]. The mechanism involves only the oxidation of TPrA on the electrode, called the low-oxidation potential (LOP) ECL mechanism. The important intermediates in LOP, TPrA and TPrA•+ exist in the vicinity of the electrode, and their diffusion distances are limited because of their short lifetime. The light area observed on the border of the cells shows that the middle part of the cells is not luminous because there are no oxidation products of TPrA accessing this area.
Soon afterwards, they showed the first example combining photobleaching and single-cell ECL [71]. Biotinylated proteins in the plasma membranes of mammalian Chinese hamster ovary (CHO) cells were labeled with SA@Ru and then fixed with a cross-linking reagent, paraformaldehyde (PFA), to block the diffusion of the SA@Ru labels attached to the proteins of the cell membrane. The labeled membrane regions of fixed cells were selected for co-photobleaching and then imaged with photoluminescence (PL) and ECL. The fixation of the photobleached label on the cell membrane resulted in the same excited state of the photo- and electro-excitation, which enabled the ECL microscope to reveal a linear correlation between the ECL decrease and the loss of PL.
Jiang’s group established ECL-based capacitance microscopy for label-free imaging of carcinoembryonic antigen (CEA) on single MCF-7 cells without an ECL tag for the first time [72]. In their work, a square-wave voltage with a frequency of as high as 1.5 kHz was applied to the working electrode, with 1 pg of CEA antigen visualized by this strategy. When a nonconductive antibody (without ECL tags) is bound to the surface or cell membrane, the drop in local capacitance can result in a relatively significant potential drop (Vdl) on the double layer of the local electrode surface, which can be used to promote the enhancement of ECL at the binding regions. Furthermore, CEA on a single cell membrane could be imaged through the capacitance change after the formation of the antigen−antibody complex (Figure 8a). Besides, Jiang’s team designed a guanine-rich single-stranded DNA (G-ssDNA)-loaded high-index faceted gold nano-flower (Hi-AuNF) as the probe and the luminophore of Ru(bpy)32+ for the ECL imaging of CEA on the cell membrane [73]. Hi-AuNF has the advantage of super-catalytic performance and a huge specific surface area to serve as an ECL enhancer and a carrier for G-ssDNA. Moreover, G-ssDNA-Apt can be formed by adding an aptamer of CEA into the G-ssDNA to recognize the overexpression of CEA on the cell membrane. As shown in Figure 8b, the difference between CEA overexpression for human breast cancer cells (MCF-7) and non-CEA expression for human skeletal muscle cells (HSMC) images suggests that Hi-AuNF@G-ssDNA-Apt had the selective recognition of express CEA.
In 2019, Liu et al. constructed a novel dual ECL imaging system to simultaneously evaluate the expression of epidermal growth factor receptor (EGFR) and phosphatidylserine (PS) on the cell surface [74]. They used a CNTSP/PLL/FA/BS electrode as a platform to fix cells as well as the anodic ECL probe (Au@L012) and the cathodic probe (graphitic-phase C3N4 (g-C3N4)) to label EGFR and PS separately. The degree of apoptosis can be reflected by the ratio of Au@L012 and g-C3N4 during a potential scanning when cells undergo apoptosis, for which EGFR decreases, and the PS on the cell surface is increased. Later, a dual intramolecular electron transfer strategy was designed by Ju’s group [75] for in situ ECL microimaging of membrane protein on a single living cell, resulting in a co-reactant embedded ECL system for the first time. Diethylamine conjugated polymer dots (TEA-Pdots) significantly enhanced ECL emission by shortening the electron transfer path and reducing the complexity of radical intermediates transport without co-reactants in the solution. They used streptavidin and TEA-Pdots (SA@TEA-Pdots) as a label, which binds human epidermal growth factor receptor 2 (HER2) to better image the entire basal membrane protein.
Yuan’s group constructed an ultrasensitive ECL biosensor for detecting mucin1 (MUC1) on MCF-7 cancer cells by using ABEI cross-linked NH2-BDC as an organic bridging ligand to synthesize an indicator of an ABEI@Fe-MIL-101 nanomaterial having a high ECL luminous efficiency [76]. This work would enhance ECL intensity significantly because large amounts of ABEI were loaded in the skeleton structure of Fe-MIL-101 and dissolved oxygen which was transformed to superoxide radicals (O2•−). Besides, Qiu et al. designed a novel single-cell analysis platform to evaluate the expression of a multifunctional cell surface adhesion receptor on the cell membrane called CD44 [77]. They increased the sensitivity of ECL sensing using ZnCQDs nanocomposites as ECL probes and amplified the ECL signal by loading magnetic beads. Furthermore, Long et al. designed the MUA-spaced single-cell sensor to improve the intensity by 37.5 ± 3.9% of the CD44 receptor expression on MCF-7 single cells [78]. An 11-mercaptoundecanoic acid (MUA)-spaced sensing interface to prop up single cells and leave a space under cells for Au@Cu-Pb CQD nanoprobe labeling. They found that ECL intensity increased by increasing the mercapto acids with carbon chain lengths (MA-Cn, n = 2, 4, 6, 11) on the substrates of electrodeposited PANI/AuNPs films and reached a maximum when n = 11. In addition, 90 degrees produced a maximum intensity after setting the different slant angles of ITO electrodes at 30°, 60°, and 90°, which showed that vertical placement helped to increase the effective interspace for single-cell labelling. Cao et al. displayed closed bipolar electrodes with ECL (BPEs-ECL) imaging platform to image the prostate-specific antigen (PSA) on cancer cell surfaces [79]. Synergistic amplification of ECL detection was achieved by integrating Au/ITO hybrid BPEs dipped in K3Fe-(CN)6 to perform cathodic amplification and Ru(bpy)32+@SiO2/Au NPs as a signal reporter to perform anodic amplification.

3.4. ECL Imaging of Morphologic Change of Cells

Morphological analysis of living cells has received much attention in cell research. In single-cell analysis, ECL microscopy can be used to study the properties of individual cells, including their size, shape, and surface composition. ECL microscopy became a valuable tool for single-cell analysis by detecting morphological changes at the single-cell level, providing essential insights into cellular biology and disease processes. Zhang et al. displayed the morphological analysis of living MCF-7 cells on electrode surfaces under external stimulation using a simple negative ECL imaging method [80]. The intensity of ECL on the electrode surface without cells was higher than on the electrode surface with cells because the electron transfer of Ru(bpy)32+ and TPrA on the electrode surface was affected by cells nourished on the electrode surface. ECL images of light and dark reveal the morphological characteristics of living cells, including cell shape, average cell boundary, etc.
Su’s group developed a label-free method to image cell-matrix adhesions of single living cells at the subcellular level [81]. The ECL was produced by free diffusion luminophores on indium tin oxide electrodes modified with silica nanochannel membrane (SNM), forming a visual contrast between the adhesion site and the non-contact region. It was characterized by bright luminescence on bare surfaces. At the same time, cell-matrix adhesion (as an inhibitor) and steric hindrance sites of ECL response appeared as dark shadows under an ECL microscope, as described in Figure 9. Therefore, this label-free imaging method could be utilized to sensitively image cell-matrix adhesion structures and the collective migration of living cells. Recently, they applied this method to examine the cell-microenvironment interactions on different biomimetic surface materials [45].
During the past few decades, significant efforts have been made to develop optical sectioning methods with thickness tunability as a desirable requirement. Zhu’s group developed a temperature-tuned ECL layer to image single-cell morphologies at different heights by recording the evolution of shadow regions of adherent cells [82]. A temperature-tuned ECL microscopy was developed to generate an adjustable ECL layer, thereby allowing fine and reversible regulation of the thickness of the ECL layer. Finite element simulation demonstrated that the ECL layer could reach any desired height within the range of 5.3~12.1 mm by controlling electrode temperature (Te). By subtracting ECL images acquired at adjacent Te values, the morphologies of single cells at various heights along the vertical direction can be modeled. The high spatiotemporal resolution of ECL microscopy enables direct visualization of the ECL layer following temperature manipulation.
As is commonly known, nucleolin plays essential roles in accommodating the survival and apoptosis of cancer cells. Gao et al. built a new ECL biosensor and the mesoporous silica nanoparticles (MSN)@ PMA@ doxorubicin (DOX) probe for imaging of nucleolin in a single HeLa cell and for the collaborative therapy of tumors [83]. Due to its porous structure, the MSN could be used as a drug carrier for loading both DOX and PMA. The MSN@PMA@DOX probe could be specifically opened by nucleolin after entering the HeLa cells and then released PMA and DOX (Figure 10). PMA could induce cells to produce ROS and enable ECL imaging of the nucleolin. Because ROS could damage the DNA and protein in tumor cells, it subsequently cooperated with DOX, thereby inhibiting genetic substances and nucleic acids to make cancer cells apoptotic. Therefore, constructing dual-function nanoprobes can not only image cells at the subcellular level but also effectively kill cancer cells.
Due to the advantages, including low invasiveness, excellent spatiotemporal controllability, and few side effects, photodynamic therapy (PDT) is receiving significant attention in clinical research to treat various diseases, especially cancer therapy. In 2019, Zhang et al. established ECL-microscopy and nanoprobe to image intracellular miRNA-21 in a single HeLa cell by EMCCD and induced cancer cell apoptosis by combining ROS therapy and photothermal therapy [84]. They utilized gold nanocages (Au NCs) with hollow interiors and photothermal properties filled with the PMA as ECL probes, which were closed by DNA-1 and DNA-2 bio gates. After that, Au NCs@PMA probes could be recognized and opened by miRNA-21 in HeLa cells. PMA was then released and induced HeLa cells to produce ROS. H2O2, as a component of ROS, is a co-reactant to react with luminol to emit light and allows ECL imaging of miRNA-21 in single cancer cells. Moreover, the Au NCs@PMA probes not only possessed the sensitive imaging of miRNA-21 but also could combine ROS therapy and photothermal therapy to induce cancer cell apoptosis.
In 2022, Chen et al. proposed an ECL strategy for photodynamic therapy (PDT) and in-situ monitoring of the cell pyroptosis process [85]. Through the ECL-PDT method, the dynamic process of gradual morphological changes, the variation of cell-matrix adhesions, and the increase of cell membrane permeability during the therapy process could be monitored with good spatiotemporal resolution. In the ECL-PDT system, the Ru(bpy)32+ −TPA−chlorin e6 (Ce6) design could kill cancer cells. The luminescence generated by Ru(bpy)32+−TPA pair was beneficial to the optical readout for ECL imaging and could be absorbed by photosensitizer Ce6 as an excitation light source and then produce ROS to kill cancer cells (Figure 11). During the ECL-PDT, cell swelling, plasma membrane vacuolation, decreased cell matrix connection, and increased cell membrane permeability were observed by ECLM. This unique technique offers fresh insights into dynamic cellular processes and the promising potential of ECL in therapeutic applications.
In recent years, with the continuous progress of ECL imaging microscopy technology and its high demand in bioanalysis, single-molecule ECL bioassay strategies based on super-resolution ECL microscopy have been developed to make imaging and direct quantification of single biomolecules possible. By localizing the ECL events of the labeled molecules, imaging single biomolecules is realized, which allows mapping the spatial distribution of biomolecules with ECL to gain quantitative single-molecule insights. In 2021, Feng’s group first demonstrated optical imaging of single-molecule electrochemical reactions in an aqueous solution and its use for super-resolution microscopy. They utilized a chemiluminescent response involving a ruthenium complex electrochemically generated at an electrode and directly captured single photons of the electrochemiluminescence of individual reactions, realizing super-resolved imaging for the adhesion dynamics of live cells with high spatiotemporal resolution [86]. This method has several advantages over existing techniques for single-molecule electrochemistry, such as increased sensitivity, low background noise, and fast imaging speed. Also, it avoids potential interference from laser-induced problems such as photobleaching and autofluorescence in super-resolution fluorescence microscopy imaging. Furthermore, by localizing the photons with high precision, they could reconstruct super-resolution images of single-molecule reactions on various electrodes and biological samples. In addition, the molecular dynamics and heterogeneity of redox reactions on different electrode materials could also be revealed.

4. Conclusions and Outlook

Since the first use of ECL as a technique for cell detection in the 1990s, ECL has gradually been applied to deeper analyses for diversified information in cellular and subcellular activities. Nanopipette, surface-confined ECLM, label-free and co-reactant-embedded ECL strategies have provided cutting-edge sensing platforms for measuring small biomolecules, protein expression, and cellular physiological processes at single-cell or even the subcellular level. The high-throughput ECL single-cell analysis will allow for the rapid and simultaneous analysis of large numbers of cells. It will significantly increase the speed and efficiency of cellular analysis. The real-time imaging and analysis of living cells may play an increasingly important role in studying cellular processes and the underlying mechanisms of disease.
The significant improvement of ECL instruments provides new opportunities for single-cell analysis. Integration of ECL with other methods, such as those employing image algorithms [87], can significantly improve resolution and achieve high spatial and temporal analysis. Such work is expected to broaden the application of ECL in single-cell research. In addition, developing ECL luminophores with high efficiency may significantly improve the sensitivity of ECL analysis and imaging resolution. We believe rapid development of cellular analysis by ECL can be expected in the coming years.

Author Contributions

Conceptualization, C.-H.X. and W.Z.; Writing—original draft preparation, Q.-N.H. and Y.-X.Y.; Writing—review and editing, Z.-Y.M.; Supervision, W.Z. All authors have read and agreed to the published version of the manuscript.

Funding

This research was funded by the National Natural Science Foundation (21974061 and 22074063) of China.

Institutional Review Board Statement

Not applicable.

Informed Consent Statement

Not applicable.

Data Availability Statement

Data sharing not applicable.

Conflicts of Interest

The authors declare no conflict of interest.

References

  1. Guo, S.C.; Tao, S.C.; Dawn, H. Microfluidics-based on-achip systems for isolating and analysing extracellular vesicles. J. Extracell. Vesicles 2018, 7, 1508271. [Google Scholar] [CrossRef] [PubMed]
  2. Ding, H.; Guo, W.; Su, B. Electrochemiluminescence Single-Cell Analysis: Intensity-and Imaging-Based Methods. ChemPlusChem 2020, 85, 725–733. [Google Scholar] [CrossRef] [PubMed]
  3. Eberwine, J.; Bartfai, T. Single cell transcriptomics of hypothalamic warm sensitive neurons that control core body temperature and fever response: Signaling asymmetry and an extension of chemical neuroanatomy. Pharmacol. Ther. 2011, 129, 241–259. [Google Scholar] [CrossRef] [PubMed]
  4. Feng, H.; Wang, X.; Xu, Z.; Zhang, X.; Gao, Y. Super-resolution fluorescence microscopy for single cell imaging. Single Cell Biomed. 2018, 1068, 59–71. [Google Scholar]
  5. Endesfelder, U. From single bacterial cell imaging towards in vivo single-molecule biochemistry studies. Essays Biochem. 2019, 63, 187–196. [Google Scholar]
  6. Miyashiro, T.; Goulian, M. Single-cell analysis of gene expression by fluorescence microscopy. Methods Enzymol. 2007, 423, 458–475. [Google Scholar]
  7. Tsuyama, N.; Mizuno, H.; Masujima, T. Molecular and functional analysis of cellular phenomena using single-cell mass spectrometry. Biol. Pharm. Bull. 2012, 35, 1425–1431. [Google Scholar] [CrossRef]
  8. Masuda, K.; Abouleila, Y.; Ali, A.; Yanagida, T.; Masujima, T. Live single-cell mass spectrometry (LSC-MS) for plant metabolomics. Plant Metab. Methods Protoc. 2018, 1778, 269–282. [Google Scholar]
  9. Wang, H.Y.; Xu, Y.T.; Wang, B.; Yu, S.Y.; Shi, X.M.; Zhao, W.W.; Jiang, D.; Chen, H.Y.; Xu, J.J. A Photoelectrochemical Nanoreactor for Single-Cell Sampling and Near Zero-Background Faradaic Detection of Intracellular microRNA. Angew. Chem. 2022, 134, e202212752. [Google Scholar]
  10. Gregas, M.K.; Yan, F.; Scaffidi, J.; Wang, H.N.; Vo-Dinh, T. Characterization of nanoprobe uptake in single cells: Spatial and temporal tracking via SERS labeling and modulation of surface charge. Nanomed. Nanotechnol. Biol. Med. 2011, 7, 115–122. [Google Scholar] [CrossRef]
  11. Zhang, J.; Zhou, J.; Pan, R.; Jiang, D.; Burgess, J.D.; Chen, H.Y. New frontiers and challenges for single-cell electrochemical analysis. ACS Sens. 2018, 3, 242–250. [Google Scholar] [CrossRef] [PubMed]
  12. Xu, H.; Yang, D.; Jiang, D.; Chen, H.Y. Phosphate assay kit in one cell for electrochemical detection of intracellular phosphate ions at single cells. Front. Chem. 2019, 7, 360. [Google Scholar] [CrossRef] [PubMed]
  13. Schmid, V.J.; Cremer, M.; Cremer, T. Quantitative analyses of the 3D nuclear landscape recorded with super-resolved fluorescence microscopy. Methods 2017, 123, 33–46. [Google Scholar] [CrossRef] [PubMed]
  14. Strickfaden, H. Reflections on the organization and the physical state of chromatin in eukaryotic cells. Genome 2021, 64, 311–325. [Google Scholar] [CrossRef]
  15. Venugopal, V.; Venkatesh, V.; Northcutt, R.G.; Maddox, J.; Sundaresan, V.B. Nanoscale polypyrrole sensors for near-field electrochemical measurements. Sens. Actuators B Chem. 2017, 242, 1193–1200. [Google Scholar] [CrossRef]
  16. Bai, S.J.; Prinz, F.B. In vivo electrochemical impedance measurement on single cell membrane. Microelectron. Eng. 2011, 88, 3094–3100. [Google Scholar] [CrossRef]
  17. Li, L.; Chen, Y.; Zhu, J.J. Recent advances in electrochemiluminescence analysis. Anal. Chem. 2017, 89, 358–371. [Google Scholar] [CrossRef]
  18. Valenti, G.; Fiorani, A.; Li, H.; Sojic, N.; Paolucci, F. Essential role of electrode materials in electrochemiluminescence applications. ChemElectroChem 2016, 3, 1990–1997. [Google Scholar] [CrossRef]
  19. Richter, M.M. Electrochemiluminescence (ecl). Chem. Rev. 2004, 104, 3003–3036. [Google Scholar] [CrossRef]
  20. Bard, A.J. A life in electrochemistry. Annu. Rev. Anal. Chem. 2014, 7, 1–21. [Google Scholar] [CrossRef]
  21. Santhanam, K.S.V.; Bard, A.J. Chemiluminescence of electrogenerated 9,10-Diphenylanthracene anion radical1. J. Am. Chem. Soc. 1965, 87, 139–140. [Google Scholar] [CrossRef]
  22. Short, G.D.; Hercules, D.M. Electroluminescence of organic compounds. The role of gaseous discharge in the excitation process. J. Am. Chem. Soc. 1965, 87, 1439–1442. [Google Scholar] [CrossRef]
  23. Munawar, A.; Zafar, F.; Majeed, S.; Irfan, M.; Khan, H.U.; Yasmin, G.; Akhtar, N. Bioinspired NC coated ZnO based electrochemiluminescence sensor for dopamine screening from neuroblastoma patient. J. Electroanal. Chem. 2021, 895, 115469. [Google Scholar] [CrossRef]
  24. Zhu, X.; Kou, F.; Xu, H.; Yang, G. A rapid and sensitive electrochemiluminescent sensor for nitrites based on C3N4 quantum dots on C3N4 nanosheets. RSC Adv. 2016, 6, 105331–105337. [Google Scholar] [CrossRef]
  25. Wang, B.; Zhong, X.; Chai, Y.; Yuan, R. Ultrasensitive electrochemiluminescence biosensor for organophosphate pesticides detection based on carboxylated graphitic carbon nitride-poly (ethylenimine) and acetylcholinesterase. Electrochim. Acta 2017, 224, 194–200. [Google Scholar] [CrossRef]
  26. Fang, Y.M.; Song, J.; Zheng, R.J.; Zeng, Y.M.; Sun, J.J. Electrogenerated chemiluminescence emissions from CdS nanoparticles for probing of surface oxidation. J. Phys. Chem. C 2011, 115, 9117–9121. [Google Scholar] [CrossRef]
  27. Ibáñez, D.; González-García, M.B.; Hernández-Santos, D.; Fanjul-Bolado, P. Understanding the ECL interaction of luminol and Ru(bpy)32+ luminophores by spectro-electrochemiluminescence. Phys. Chem. Chem. Phys. 2020, 22, 18261–18264. [Google Scholar] [CrossRef]
  28. Song, L.; Wu, J.; Zhang, G.; Liu, P.; Kuang, G.; Fu, Y. Novel gold nanoparticles functionalized Mo-polydopamine hollow sphere as an efficient quencher in conjugated microporous polymer electrochemiluminescent system. Sens. Actuators B Chem. 2021, 344, 130130. [Google Scholar] [CrossRef]
  29. Xu, J.; Jiang, D.; Qin, Y.; Xia, J.; Jiang, D.; Chen, H.Y. C3N4 nanosheet modified microwell array with enhanced electrochemiluminescence for total analysis of cholesterol at single cells. Anal. Chem. 2017, 89, 2216–2220. [Google Scholar] [CrossRef]
  30. Zhou, H.; Ding, K.; Yu, Q.; Wang, H.; Liu, J.; Wang, Z. Enhanced electrochemiluminescence ratiometric cytosensing based on surface plasmon resonance of Au nanoparticles and nanosucculent films. Biosens. Bioelectron. 2021, 189, 113367. [Google Scholar] [CrossRef]
  31. Hu, L.; Xu, G. Applications and trends in electrochemiluminescence. Chem. Soc. Rev. 2010, 39, 3275–3304. [Google Scholar] [CrossRef] [PubMed]
  32. Tokel, N.E.; Bard, A.J. Electrogenerated chemiluminescence. IX. Electrochemistry and emission from systems containing tris (2, 2′-bipyridine) ruthenium (II) dichloride. J. Am. Chem. Soc. 1972, 94, 2862–2863. [Google Scholar] [CrossRef]
  33. Miao, W.; Choi, J.P.; Bard, A.J. Electrogenerated chemiluminescence 69: The Tris (2, 2 ‘-bipyridine) ruthenium (II),(Ru (bpy) 32+)/Tri-n-propylamine (TPrA) system revisited A new route involving TPrA•+ Cation Radicals. J. Am. Chem. Soc. 2002, 124, 14478–14485. [Google Scholar] [CrossRef] [PubMed]
  34. Hesari, M.; Ding, Z. Electrogenerated chemiluminescence: Light years ahead. J. Electrochem. Soc. 2015, 163, H3116. [Google Scholar] [CrossRef]
  35. Guo, W.; Liu, Y.; Cao, Z.; Su, B. Imaging analysis based on electrogenerated chemiluminescence. J. Anal. Test. 2017, 1, 1–17. [Google Scholar] [CrossRef]
  36. Wang, Y.; Jiang, D.; Chen, H.Y. Electrochemiluminescence analysis of hydrogen peroxide using L012 modified electrodes. J. Anal. Test. 2020, 4, 122–127. [Google Scholar] [CrossRef]
  37. Chen, M.M.; Xu, C.H.; Zhao, W.; Chen, H.Y.; Xu, J.J. Observing the structure-dependent electrocatalytic activity of bimetallic Pd–Au nanorods at the single-particle level. Chem. Commun. 2020, 56, 3413–3416. [Google Scholar] [CrossRef]
  38. Arora, A.; Eijkel, J.C.; Morf, W.E.; Manz, A. A wireless electrochemiluminescence detector applied to direct and indirect detection for electrophoresis on a microfabricated glass device. Anal. Chem. 2001, 73, 3282–3288. [Google Scholar] [CrossRef]
  39. Zu, Y.; Ding, Z.; Zhou, J.; Lee, Y.; Bard, A.J. Scanning optical microscopy with an electrogenerated chemiluminescent light source at a nanometer tip. Anal. Chem. 2001, 73, 2153–2156. [Google Scholar] [CrossRef]
  40. Zhang, H.R.; Wang, Y.Z.; Wu, M.S.; Feng, Q.M.; Shi, H.W.; Chen, H.Y.; Xu, J.J. Visual electrochemiluminescence detection of telomerase activity based on multifunctional Au nanoparticles modified with G-quadruplex deoxyribozyme and luminol. Chem. Commun. 2014, 50, 12575–12577. [Google Scholar] [CrossRef]
  41. Deiss, F.; LaFratta, C.N.; Symer, M.; Blicharz, T.M.; Sojic, N.; Walt, D.R. Multiplexed sandwich immunoassays using electrochemiluminescence imaging resolved at the single bead level. J. Am. Chem. Soc. 2009, 131, 6088–6089. [Google Scholar] [CrossRef]
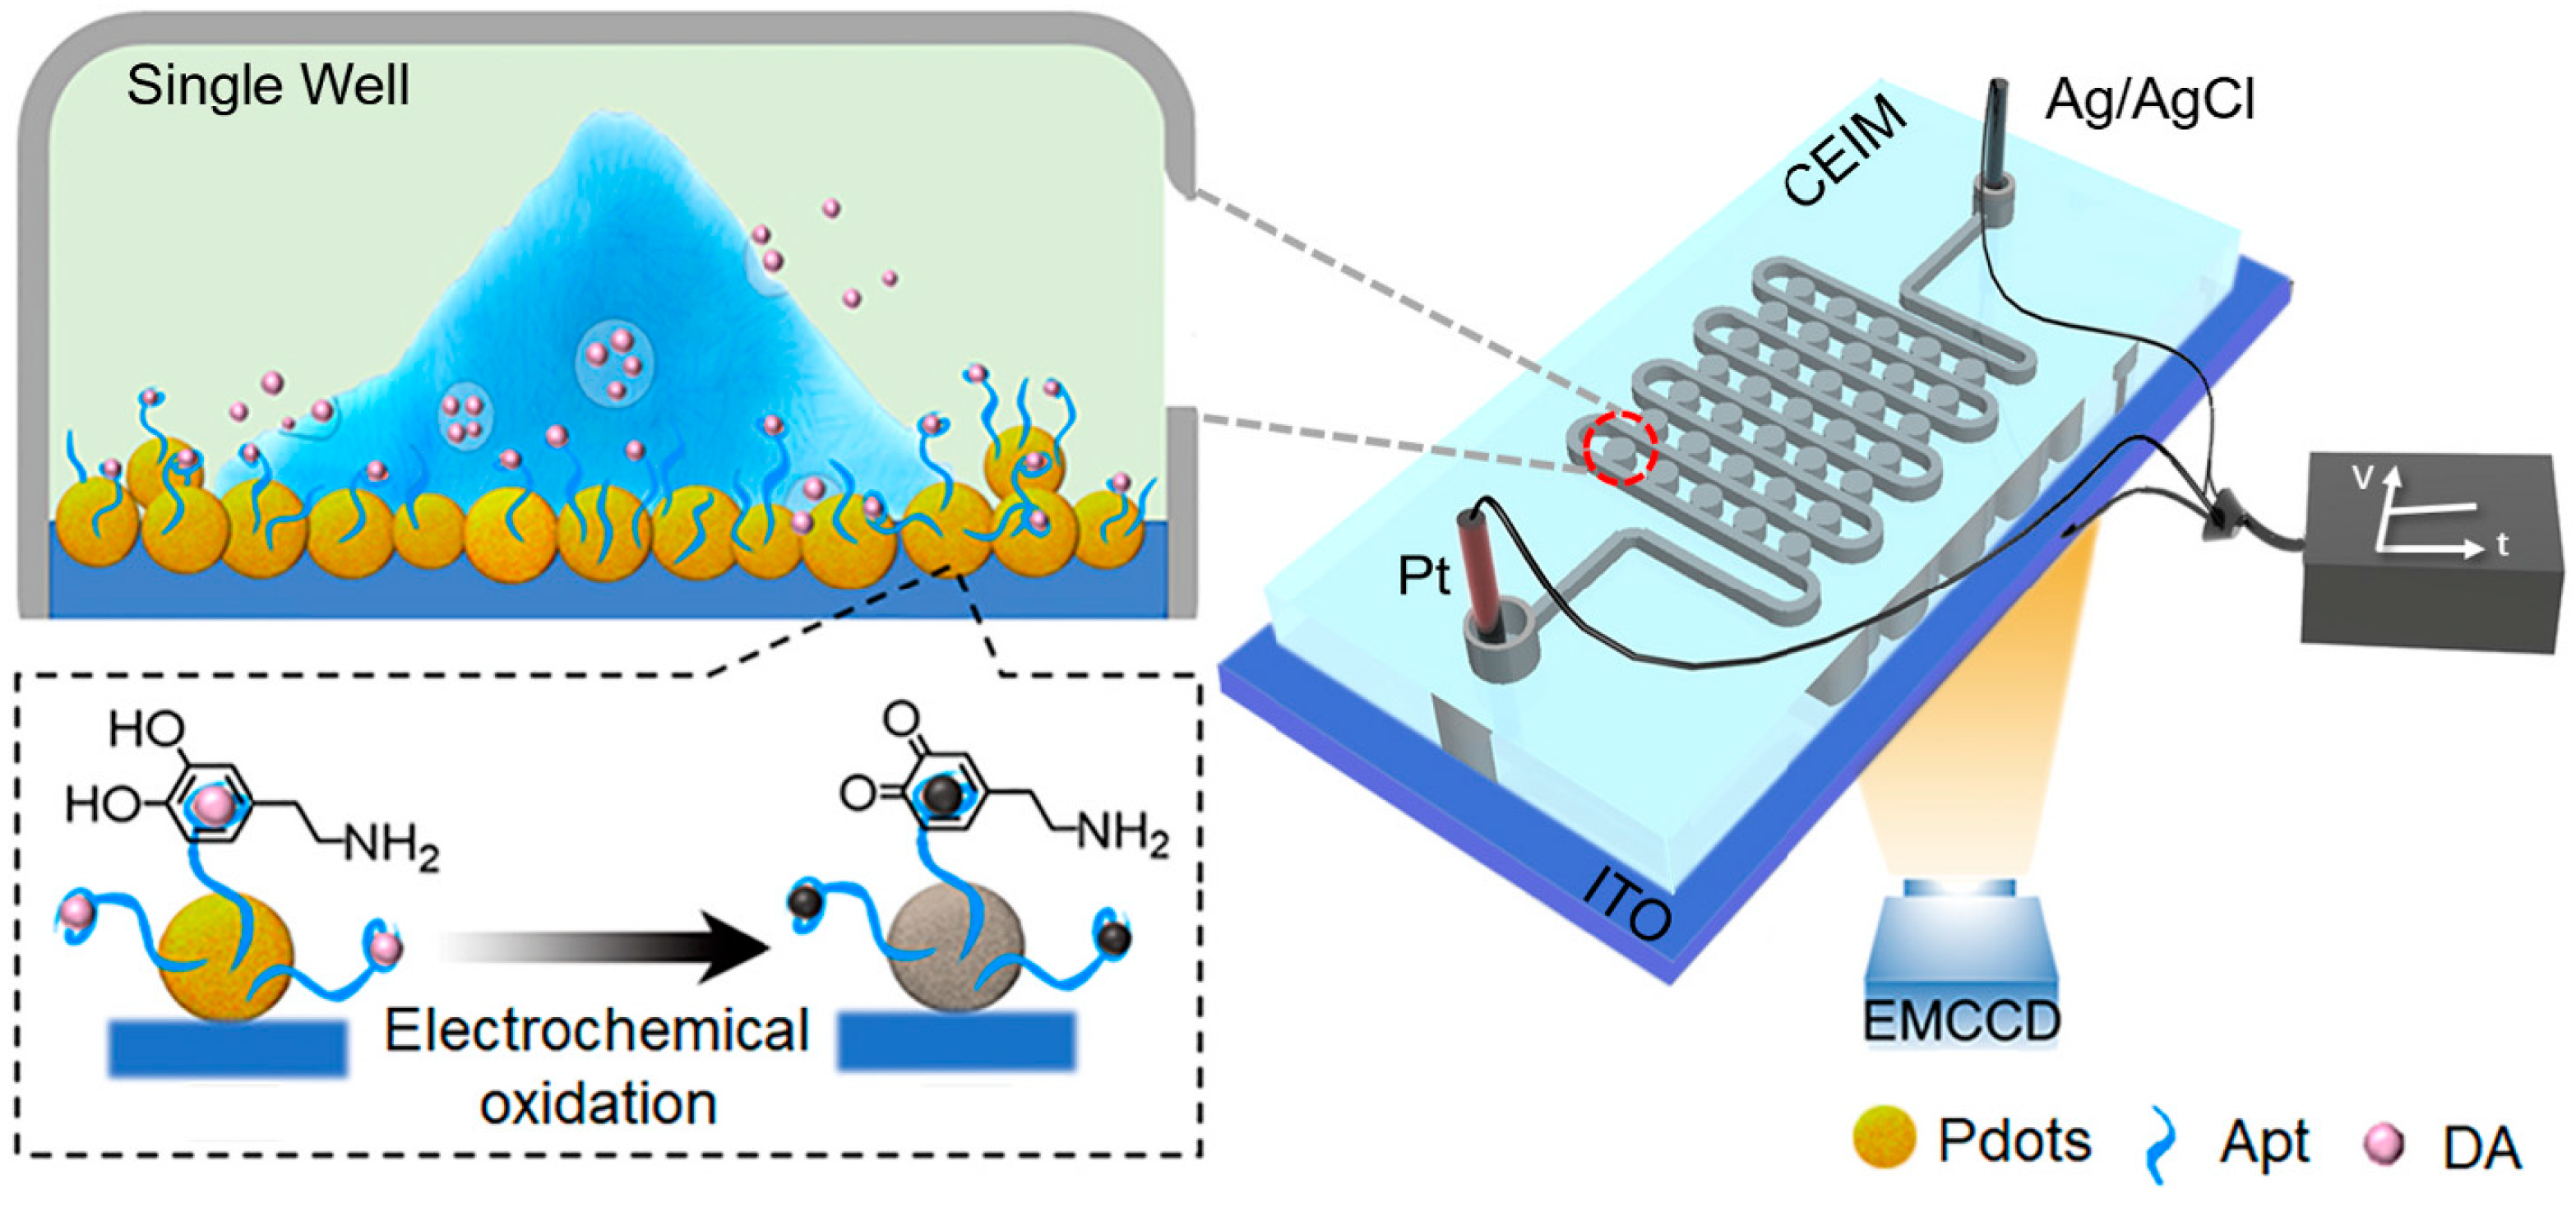
  42. Wang, N.; Ao, H.; Xiao, W.; Chen, W.; Li, G.; Wu, J.; Ju, H. Confined electrochemiluminescence imaging microarray for high-throughput biosensing of single cell-released dopamine. Biosens. Bioelectron. 2022, 201, 113959. [Google Scholar] [CrossRef]
  43. Zhang, Z.; Ma, C.; Xu, Q.; Zhu, J.J. Recent progress in electrochemiluminescence microscopy analysis of single cells. Analyst 2022, 147, 2884–2894. [Google Scholar] [CrossRef] [PubMed]
  44. Zhao, W.; Chen, H.Y.; Xu, J.J. Electrogenerated chemiluminescence detection of single entities. Chem. Sci. 2021, 12, 5720–5736. [Google Scholar] [CrossRef] [PubMed]
  45. Ding, L.; Ding, H.; Zhou, P.; Xi, L.; Su, B. Surface-Sensitive Imaging Analysis of Cell–Microenvironment Interactions by Electrochemiluminescence Microscopy. Anal. Chem. 2022, 94, 10885–10892. [Google Scholar] [CrossRef] [PubMed]
  46. Ding, H.; Su, B.; Jiang, D. Recent Advances in Single Cell Analysis by Electrochemiluminescence. ChemistryOpen 2022, 12, e202200113. [Google Scholar] [CrossRef]
  47. Yang, Q.; Huang, X.; Gao, B.; Gao, L.; Yu, F.; Wang, F. Advances in electrochemiluminescence for single-cell analysis. Analyst 2023, 148, 9–25. [Google Scholar] [CrossRef]
  48. Knezevic, S.; Bouffier, L.; Liu, B.; Jiang, D.; Sojic, N. Electrochemiluminescence microscopy: From single objects to living cells. Curr. Opin. Electrochem. 2022, 35, 101096. [Google Scholar] [CrossRef]
  49. Meng, C.; Knezevic, S.; Du, F.; Guan, Y.; Kanoufi, F.; Sojic, N.; Xu, G. Recent advances in electrochemiluminescence imaging analysis. eScience 2022, 2, 591–605. [Google Scholar] [CrossRef]
  50. Cui, C.; Chen, Y.; Jiang, D.; Chen, H.Y.; Zhang, J.; Zhu, J.J. Steady-state electrochemiluminescence at single semiconductive titanium dioxide nanoparticles for local sensing of single cells. Anal. Chem. 2018, 91, 1121–1125. [Google Scholar] [CrossRef]
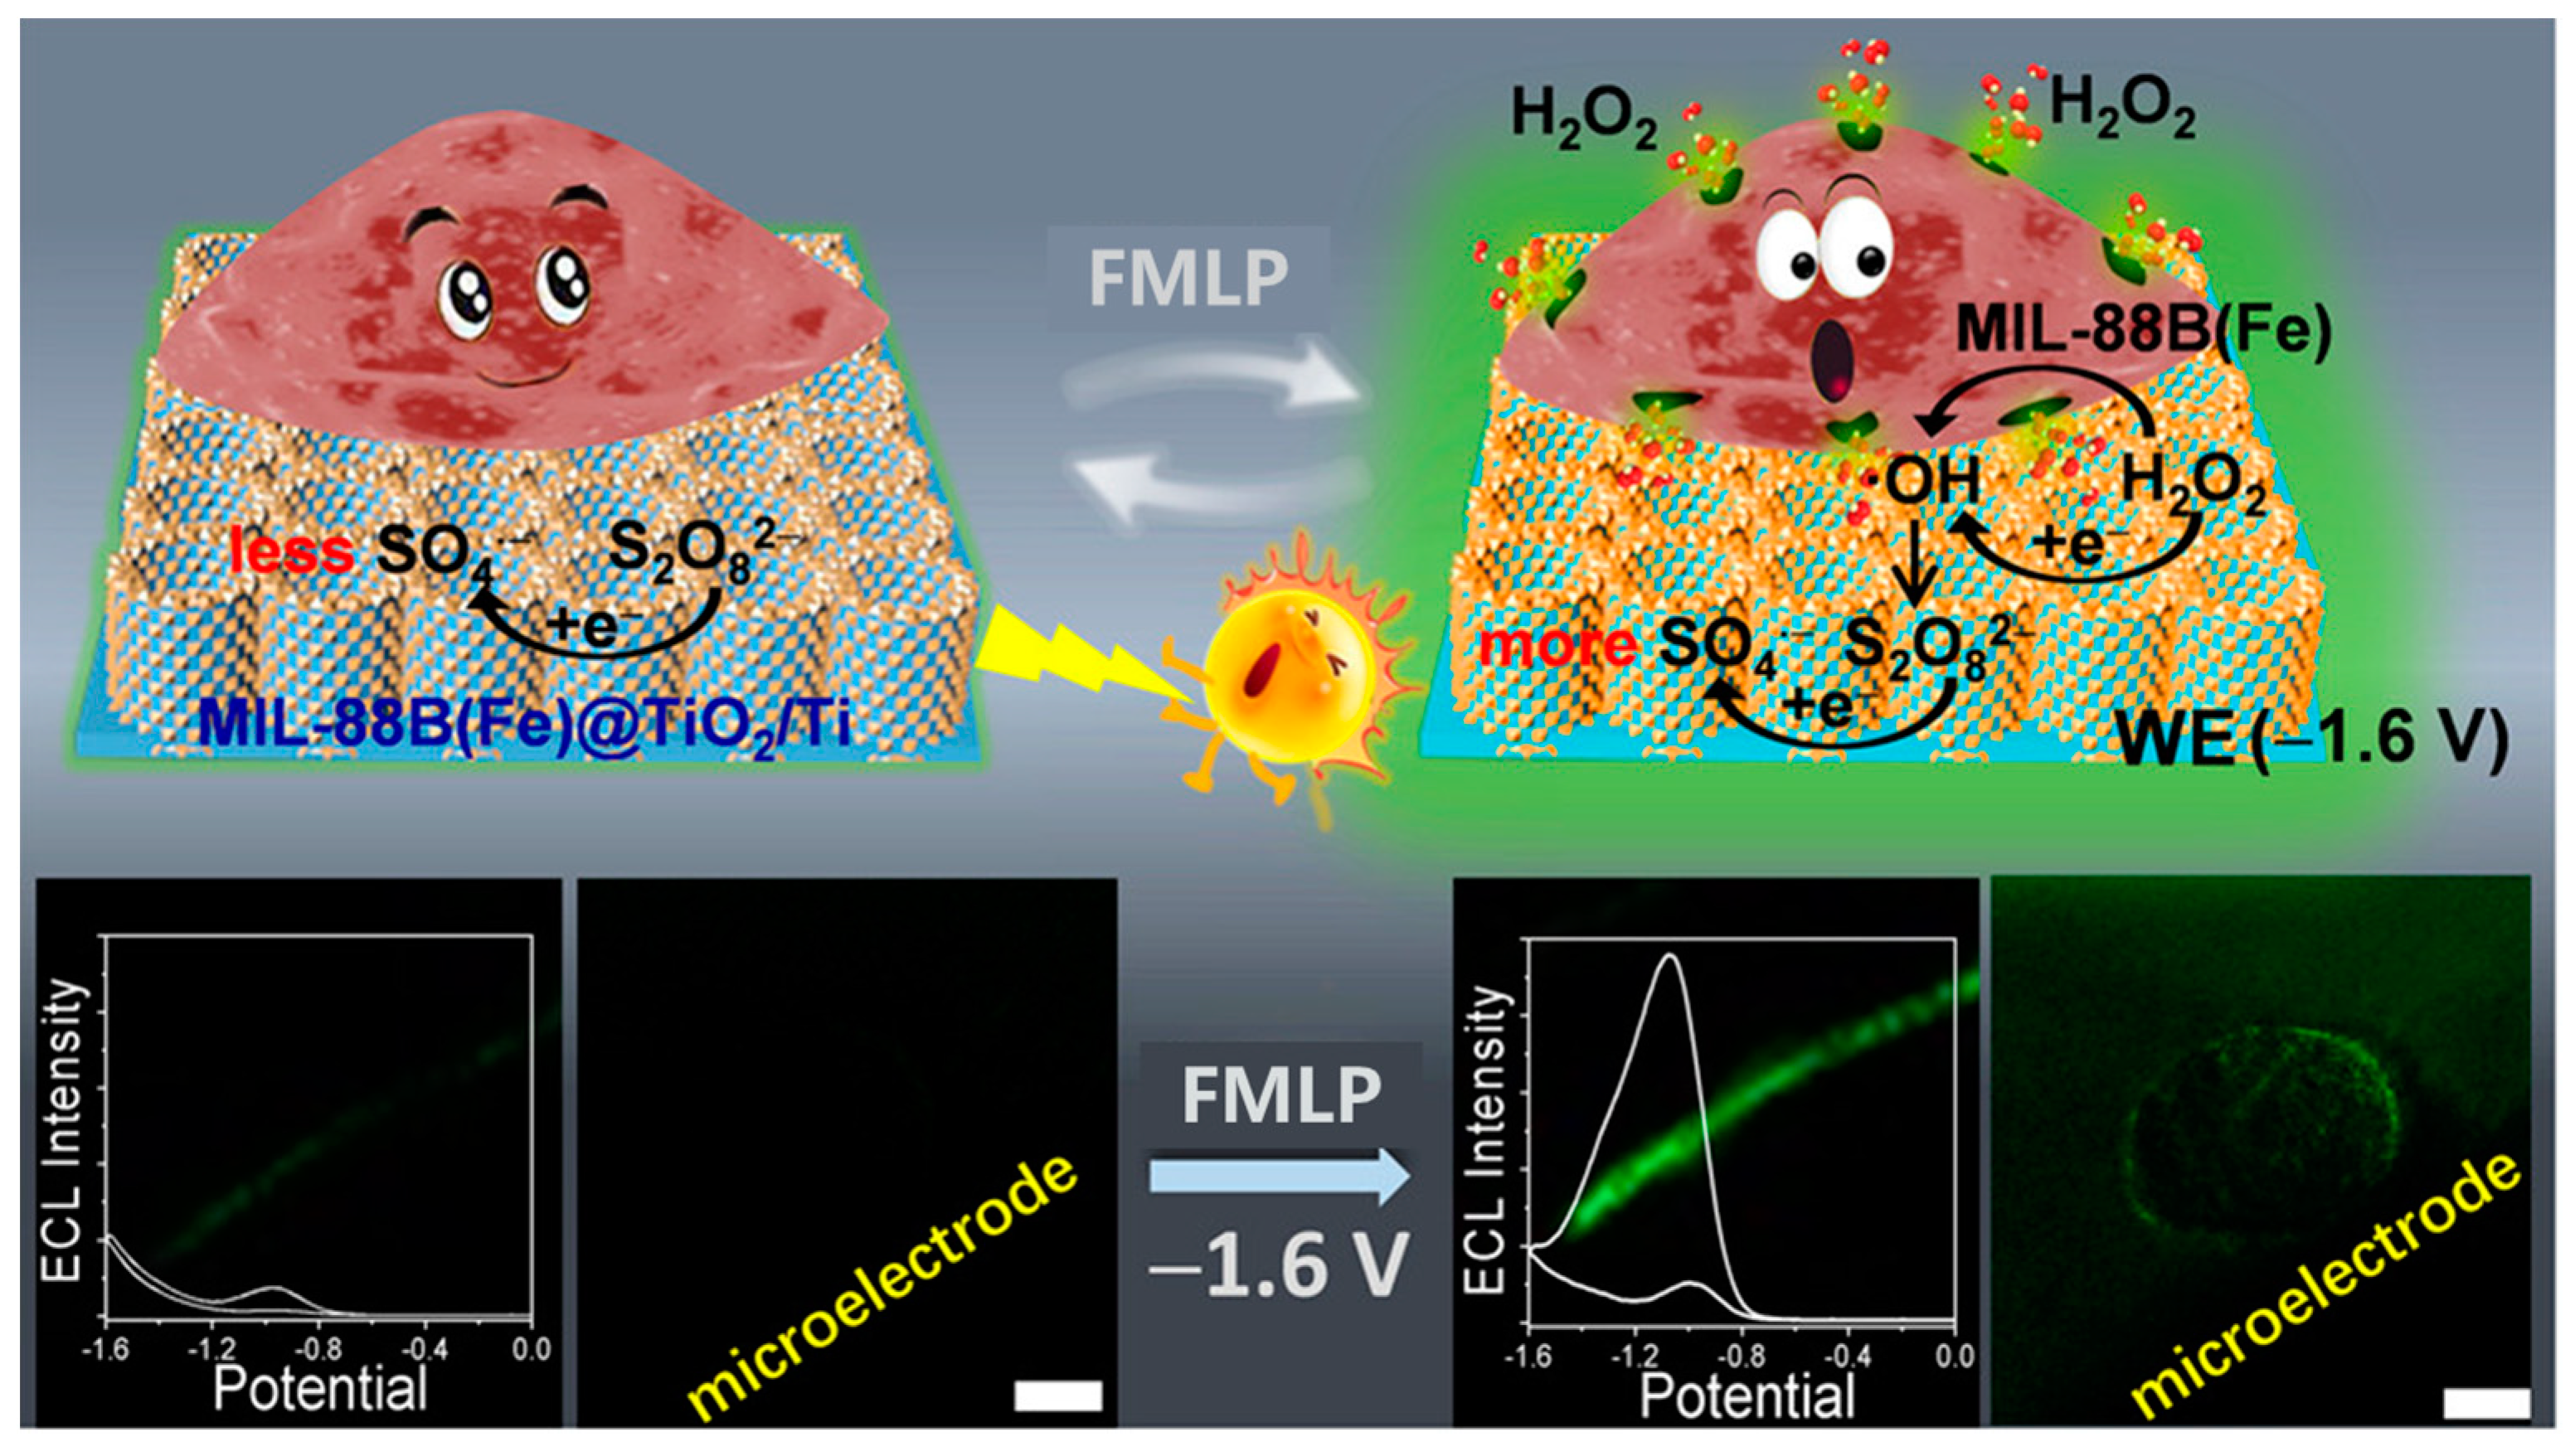
  51. Jian, X.; Xu, J.; Wang, Y.; Zhao, C.; Gao, Z.; Song, Y.Y. Deployment of MIL-88B (Fe)/TiO2 nanotube-supported Ti wires as reusable electrochemiluminescence microelectrodes for noninvasive sensing of H2O2 from single cancer cells. Anal. Chem. 2021, 93, 11312–11320. [Google Scholar] [CrossRef]
  52. Liu, G.; Ma, C.; Jin, B.K.; Chen, Z.; Zhu, J.J. Direct electrochemiluminescence imaging of a single cell on a chitosan film modified electrode. Anal. Chem. 2018, 90, 4801–4806. [Google Scholar] [CrossRef] [PubMed]
  53. Ma, G.; Zhou, J.; Tian, C.; Jiang, D.; Fang, D.; Chen, H. Luminol electrochemiluminescence for the analysis of active cholesterol at the plasma membrane in single mammalian cells. Anal. Chem. 2013, 85, 3912–3917. [Google Scholar] [CrossRef]
  54. Tian, C.; Zhou, J.; Wu, Z.Q.; Fang, D.; Jiang, D. Fast serial analysis of active cholesterol at the plasma membrane in single cells. Anal. Chem. 2014, 86, 678–684. [Google Scholar] [CrossRef] [PubMed]
  55. Xu, H.; Zhou, S.; Jiang, D.; Chen, H.Y. Cholesterol oxidase/triton X-100 parked microelectrodes for the detection of cholesterol in plasma membrane at single cells. Anal. Chem. 2018, 90, 1054–1058. [Google Scholar] [CrossRef]
  56. Huang, S.; Liu, K.; Jiang, D.; Fang, D. Codetermination of sphingomyelin and cholesterol in cellular plasma membrane in sphingomyelin-depletion-induced cholesterol efflux. Anal. Chem. 2018, 91, 1501–1506. [Google Scholar] [CrossRef] [PubMed]
  57. Li, L.; Liu, K.; Fang, D. Single cell electrochemiluminescence analysis of cholesterol in plasma membrane during testosterone treatment. Electroanalysis 2020, 32, 958–963. [Google Scholar] [CrossRef]
  58. Xu, J.; Huang, P.; Qin, Y.; Jiang, D.; Chen, H.Y. Analysis of intracellular glucose at single cells using electrochemiluminescence imaging. Anal. Chem. 2016, 88, 4609–4612. [Google Scholar] [CrossRef]
  59. He, R.; Tang, H.; Jiang, D.; Chen, H.Y. Electrochemical visualization of intracellular hydrogen peroxide at single cells. Anal. Chem. 2016, 88, 2006–2009. [Google Scholar] [CrossRef]
  60. Zhou, J.; Ma, G.; Chen, Y.; Fang, D.; Jiang, D.; Chen, H.Y. Electrochemiluminescence imaging for parallel single-cell analysis of active membrane cholesterol. Anal. Chem. 2015, 87, 8138–8143. [Google Scholar] [CrossRef]
  61. Zhang, J.; Ding, H.; Zhao, S.; Jiang, D.; Chen, H.Y. Confined electrochemiluminescence in vertically ordered silica mesochannels for the imaging of hydrogen peroxide released from single cells. Electrochem. Commun. 2019, 98, 38–42. [Google Scholar] [CrossRef]
  62. Xia, J.; Zhou, J.; Zhang, R.; Jiang, D.; Jiang, D. Gold-coated polydimethylsiloxane microwells for high-throughput electrochemiluminescence analysis of intracellular glucose at single cells. Anal. Bioanal. Chem. 2018, 410, 4787–4792. [Google Scholar] [CrossRef]
  63. Wang, Y.; Jin, R.; Sojic, N.; Jiang, D.; Chen, H.Y. Intracellular wireless analysis of single cells by bipolar electrochemiluminescence confined in a nanopipette. Angew. Chem. 2020, 132, 10502–10506. [Google Scholar] [CrossRef]
  64. Huang, R.; Jin, R.; Jiang, D.; Chen, H.Y. Single-cell-resolved measurement of enzyme activity at the tissue level using drop-on-demand microkits. Analyst 2021, 146, 1548–1551. [Google Scholar] [CrossRef] [PubMed]
  65. Wang, Y.; Jiang, D.; Chen, H.Y. Wireless Electrochemical Visualization of Intracellular Antigens in Single Cells. CCS Chem. 2022, 4, 2221–2227. [Google Scholar] [CrossRef]
  66. Wang, L.; Song, J.; Wang, X.; Qi, H.; Gao, Q.; Zhang, C. Monitoring casein kinase II at subcellular level via bio-bar-code-based electrochemiluminescence biosensing method. Chin. Chem. Lett. 2020, 31, 2520–2524. [Google Scholar] [CrossRef]
  67. Ma, Y.; Colin, C.; Descamps, J.; Arbault, S.; Sojic, N. Shadow electrochemiluminescence microscopy of single mitochondria. Angew. Chem. 2021, 133, 18890–18897. [Google Scholar] [CrossRef]
  68. Ma, C.; Wu, S.; Zhou, Y.; Wei, H.F.; Zhang, J.; Chen, Z.; Zhu, J.J.; Lin, Y.; Zhu, W. Bio-Coreactant-Enhanced Electrochemiluminescence Microscopy of Intracellular Structure and Transport. Angew. Chem. 2021, 133, 4957–4964. [Google Scholar] [CrossRef]
  69. Valenti, G.; Scarabino, S.; Goudeau, B.; Lesch, A.; Jovic, M.; Villani, E.; Sentic, M.; Rapino, S.; Arbault, S.; Paolucci, F.; et al. Single cell electrochemiluminescence imaging: From the proof-of-concept to disposable device-based analysis. J. Am. Chem. Soc. 2017, 139, 16830–16837. [Google Scholar] [CrossRef]
  70. Rebeccani, S.; Zanut, A.; Santo, C.I.; Valenti, G.; Paolucci, F. A guide inside electrochemiluminescent microscopy mechanisms for analytical performance improvement. Anal. Chem. 2022, 94, 336–348. [Google Scholar] [CrossRef]
  71. Han, D.; Goudeau, B.; Manojlovic, D.; Jiang, D.; Fang, D.; Sojic, N. Electrochemiluminescence loss in photobleaching. Angew. Chem. 2021, 133, 7764–7768. [Google Scholar] [CrossRef]
  72. Zhang, J.; Jin, R.; Jiang, D.; Chen, H.Y. Electrochemiluminescence-based capacitance microscopy for label-free imaging of antigens on the cellular plasma membrane. J. Am. Chem. Soc. 2019, 141, 10294–10299. [Google Scholar] [CrossRef] [PubMed]
  73. Chen, Y.; Gou, X.; Ma, C.; Jiang, D.; Zhu, J.J. A synergistic coreactant for single-cell electrochemiluminescence imaging: Guanine-rich ssDNA-loaded high-index faceted gold nanoflowers. Anal. Chem. 2021, 93, 7682–7689. [Google Scholar] [CrossRef] [PubMed]
  74. Liu, G.; Jin, B.K.; Ma, C.; Chen, Z.; Zhu, J.J. Potential-resolved electrochemiluminescence nanoprobes for visual apoptosis evaluation at single-cell level. Anal. Chem. 2019, 91, 6363–6370. [Google Scholar] [CrossRef]
  75. Wang, N.; Gao, H.; Li, Y.; Li, G.; Chen, W.; Jin, Z.; Lei, J.; Wei, Q.; Ju, H. Dual intramolecular electron transfer for in situ coreactant-embedded electrochemiluminescence microimaging of membrane protein. Angew. Chem. Int. Ed. 2021, 60, 197–201. [Google Scholar] [CrossRef]
  76. Jiang, X.; Wang, Z.; Wang, H.; Zhuo, Y.; Yuan, R.; Chai, Y. A novel metal–organic framework loaded with abundant N-(aminobutyl)-N-(ethylisoluminol) as a high-efficiency electrochemiluminescence indicator for sensitive detection of mucin1 on cancer cells. Chem. Commun. 2017, 53, 9705–9708. [Google Scholar] [CrossRef]
  77. Qiu, Y.; Zhou, B.; Yang, X.; Long, D.; Hao, Y.; Yang, P. Novel single-cell analysis platform based on a solid-state zinc-coadsorbed carbon quantum dots electrochemiluminescence probe for the evaluation of CD44 expression on breast cancer cells. ACS Appl. Mater. Interfaces 2017, 9, 16848–16856. [Google Scholar] [CrossRef]
  78. Long, D.; Chen, C.; Cui, C.; Yao, Z.; Yang, P. A high precision MUA-spaced single-cell sensor for cellular receptor assay based on bifunctional Au@ Cu-PbCQD nanoprobes. Nanoscale 2018, 10, 18597–18605. [Google Scholar] [CrossRef]
  79. Cao, J.T.; Wang, Y.L.; Zhang, J.J.; Dong, Y.X.; Liu, F.R.; Ren, S.W.; Liu, Y.M. Immuno-electrochemiluminescent imaging of a single cell based on functional nanoprobes of heterogeneous Ru (bpy)32+@ SiO2/Au nanoparticles. Anal. Chem. 2018, 90, 10334–10339. [Google Scholar] [CrossRef]
  80. Gao, H.; Han, W.; Qi, H.; Gao, Q.; Zhang, C. Electrochemiluminescence imaging for the morphological and quantitative analysis of living cells under external stimulation. Anal. Chem. 2020, 92, 8278–8284. [Google Scholar] [CrossRef]
  81. Ding, H.; Guo, W.; Su, B. Imaging cell-matrix adhesions and collective migration of living cells by electrochemiluminescence microscopy. Angew. Chem. Int. Ed. 2020, 59, 449–456. [Google Scholar] [CrossRef] [PubMed]
  82. Ma, C.; Xing, Z.; Gou, X.; Jiang, L.P.; Zhu, J.J. A temperature-tuned electrochemiluminescence layer for reversibly imaging cell topography. Chem. Sci. 2022, 13, 13938–13947. [Google Scholar] [CrossRef] [PubMed]
  83. Gao, W.; Liu, Y.; Zhang, H.; Wang, Z. Electrochemiluminescence biosensor for nucleolin imaging in a single tumor cell combined with synergetic therapy of tumor. ACS Sens. 2020, 5, 1216–1222. [Google Scholar] [CrossRef] [PubMed]
  84. Zhang, H.; Gao, W.; Liu, Y.; Sun, Y.; Jiang, Y.; Zhang, S. Electrochemiluminescence-microscopy for microRNA imaging in single cancer cell combined with chemotherapy-photothermal therapy. Anal. Chem. 2019, 91, 12581–12586. [Google Scholar] [CrossRef]
  85. Chen, M.M.; Xu, C.H.; Zhao, W.; Chen, H.Y.; Xu, J.J. Single Cell Imaging of Electrochemiluminescence-Driven Photodynamic Therapy. Angew. Chem. 2022, 134, e202117401. [Google Scholar]
  86. Dong, J.; Lu, Y.; Xu, Y.; Chen, F.; Yang, J.; Chen, Y.; Feng, J. Direct imaging of single-molecule electrochemical reactions in solution. Nature 2021, 596, 244–249. [Google Scholar] [CrossRef] [PubMed]
  87. Chen, M.M.; Xu, C.H.; Zhao, W.; Chen, H.Y.; Xu, J.J. Super-Resolution Electrogenerated Chemiluminescence Microscopy for Single-Nanocatalyst Imaging. J. Am. Chem. Soc. 2021, 143, 18511–18518. [Google Scholar] [CrossRef]
Figure 1. Schematic of a setup of the conventional intensity-based ECL detection system (a) and an ECLM system (b). (WE, Working Electrode; CE, Counter Electrode; RE, Reference Electrode).
Chemosensors 11 00281 g001
Figure 2. Schematic illustration of detecting H2O2 in living cells on the solid-state ECL electrode. Adapted with permission from Ref. [51]. Copyright 2021 Wiley−VCH.
Chemosensors 11 00281 g002
Figure 3. Illustration of the experimental setup of the confined ECL imaging microarray (CEIM) chip for detecting the released DA from a single PC12 cell under hypoxic stimulation. Adapted with permission from Ref. [42]. Copyright 2021, American Chemical Society.
Chemosensors 11 00281 g003
Figure 4. (a) Schematic system used for the electrochemical imaging of intracellular hydrogen peroxide. (b) SEM image of the capillary. (c) SEM image of luminol/chitosan capillary coated with PVC/NPOE. Reproduced with permission from Ref. [59]. Copyright 2016, American Chemical Society.
Chemosensors 11 00281 g004
Figure 5. (a) Representation of the bipolar ECL detection at the porous Pt deposit inside the nanopipette, which is inserted into the cytosol for intracellular wireless electroanalysis. (b) Brightfield, ECL, and overlapping images from the pipette tip to detect hydrogen peroxide outside the nanopipette; the concentration of hydrogen peroxide is 10 mM. Adapted with permission from Ref. [63]. Copyright 2020 American Chemical Society.
Chemosensors 11 00281 g005
Figure 6. Bright-field (BF) (a), Dark-field (DF) (b), and ECL (c) images of three adherent and fixed HeLa cells on an ITO electrode. The BF and DF images were captured by transmission and oblique incidence light sources, respectively. When a constant 1.3 V (vs. Ag/AgCl) was applied to the ITO electrode in 10 mM PBS (pH 7.4) containing 400 μM Ru(bpy)32+, frame-by-frame ECL sequence images (exposure time: 1 s) were recorded on the EMCCD and an integrated ECL image of 400 original ECL serial images is shown in (c). The scale bar (white) is 20 μm. (d) A zoom-in ECL image of a single cell marked with the black box in (c). The red, orange, cyan, and blue regions represent the nucleolus, nucleoplasm, endoplasmic reticulum, and cytoplasm. (e,f) Fluorescence image of nuclear staining with DAPI, and the corresponding ECL image. (g,h) Fluorescence image of endoplasmic reticulum staining, and corresponding ECL image. Scale bar (white) is 5 μm. Adapted with permission from Ref. [68]. Copyright 2019, Wiley−VCH.
Chemosensors 11 00281 g006
Figure 7. (a) Schematic principle for the ECL imaging of single cells. (a1) Biotinylated proteins in CHO cells were labeled with streptavidin-modified Ru(bpy)32+-moieties (SA@Ru). (a2) A monoclonal antibody labeled with Ru(bpy)32+ (Ab@Ru), was used for targeting of the epidermal growth factor receptor (EGFR) in MCF10A cells. (b) PL (green), ECL (red) and overlay of the PL (green) and ECL (red) images of CHO cells grown on a GC electrode. SA (streptavidin)@Ru labels were attached to the biotinylated proteins of the cellular membrane. ECL was recorded in phosphate buffer (pH ¼ 7.4) containing 100 mM TPrA by applying 1.35 V. Scale bar: 20 μm. Adapted with permission from Ref. [69]. Copyright 2017 American Chemical Society.
Chemosensors 11 00281 g007
Figure 8. (a)ECL images of two adjacent cells before (top panel) and after (middle panel) biding with antibodies. The bottom panel shows the different images. Each column was obtained with a certain frequency marked on the top. (b) Bright-field (A) and ECL field (B) images of a group of MCF-7 cells. Bright-field (C) and ECL field (D) images of a single MCF-7 cell. Bright-field (E) and ECL field (F) images of a group of HSMC cells. Bright-field (G) and ECL field (H) images of a single HSMC cell. Both MCF-7 and HSMC cells were incubated with Hi-AuNF@G-ssDNA-Apt and washed several times. The exposure time is 10 s. The working electrode is FTO. The electrolyte is 10 mM PBS (pH 7.4) containing 200 μM Ru(bpy)32+. The applied voltage is 1.1 V vs Ag/AgCl. (a) Adapted with permission from Ref. [72]. Copyright 2019, American Chemical Society. (b) Adapted with permission from Ref. [73]. Copyright 2021, American Chemical Society.
Chemosensors 11 00281 g008
Figure 9. Schematic illustration of imaging cell-matrix adhesions by ECL microscopy. (a) Bright-field images of living PC 12 cells captured in the light transmission mode. (b) ECL images of living PC 12 cells were recorded in 0.01M PBS (pH 7.4) containing 50 μM Ru(bpy)32+ and 20 mM HEPES. The scale bar is 20 μm. Adapted with permission from Ref. [81]. Copyright 2020, Wiley.
Chemosensors 11 00281 g009
Figure 10. ECL imaging of nucleolin in a single tumor cell and synergetic apoptosis of tumor based on the ECL biosensor. Adapted with permission from Ref. [82]. Copyright 2020, American Chemical Society.
Chemosensors 11 00281 g010
Figure 11. Schematic illustration of in-situ imaging of the process of ECL-PDT by ECLM at single living cell level. Ru2+ and Ru2+* represent Ru(bpy)32+ and its excited state, respectively. Scale bar: 25 μm. Adapted with permission from Ref. [85]. Copyright 2022, American Chemical Society.
Chemosensors 11 00281 g011
Disclaimer/Publisher’s Note: The statements, opinions and data contained in all publications are solely those of the individual author(s) and contributor(s) and not of MDPI and/or the editor(s). MDPI and/or the editor(s) disclaim responsibility for any injury to people or property resulting from any ideas, methods, instructions or products referred to in the content.

