Article

Detection of Lysosomal Hg2+ Using a pH-Independent Naphthalene Monoimide-Based Fluoroprobe

Bionanotechnology Lab, Department of Chemistry, Indian Institute of Science Education and Research Bhopal, Bhopal Bypass Road, Bhauri, Bhopal 462066, Madhya Pradesh, India
*
Author to whom correspondence should be addressed.
Chemosensors 2023, 11(3), 184; https://doi.org/10.3390/chemosensors11030184
Submission received: 1 February 2023 / Revised: 28 February 2023 / Accepted: 7 March 2023 / Published: 10 March 2023

Abstract

:
The development of fluorometric detection methods for toxic metal ions in real samples and inside cellular environments using fluorescent dyes has gained tremendous research interest. This work represents the design and synthesis of a 1,8-naphthalimide-based visible light absorbing fluorescence probe His-NMI-Bu showing an intramolecular charge transfer (ICT) feature. Photophysical properties of the fluoroprobe are investigated in-depth through a combination of steady-state, time-resolved spectroscopic techniques, and DFT calculation. The probe displays outstanding pH tolerance in the pH range of 5–10 as evident from UV–Vis. and fluorescence measurements. The fluoroprobe exhibits chelation with Hg2+-induced fluorescence attenuation via PET in the solution, thus acting as a suitable fluorescence sensor for mercury ions with LOD 0.52 µM. The high sensitivity and selectivity of the probe towards Hg2+ are validated from fluorescence titration with various metal ions. Banking on its intriguing solid-state emissive properties, dye-loaded filter paper-based sensing of Hg2+ is also developed demonstrating the sensitivity in the micromolar range. Finally, His-NMI-Bu fluorophore depicts its selective localization inside the lysosomal compartment of live cells which assists further to monitor the presence of mercury ions inside the lysosome showing similar Hg2+-induced fluorescence depletion.

Graphical Abstract

1. Introduction

In a large family of heavy metals, mercury (Hg) is well-regarded as one of the most toxic and poisonous heavy elements having an adverse effect on living organisms. Due to its harmful and reactive nature, it can be directly exposed to the skin, respiratory system, and gastrointestinal tissues of the living body [1,2]. Accumulation of an elevated amount of mercury ion in our body causes DNA damage, dysfunction of the cardiovascular and central nervous systems, metabolic disorder, and also affects mitosis [3]. Because of the multiple detrimental effects caused by mercury, there has been aroused significant attention to researchers on effective and real-time detection of a trace amount of this well-known toxic element in the surrounding environment as well as biological systems [4]. The researchers employed several techniques for the detection of mercury ions, for instance, electrochemical methods [5,6], atomic absorption spectrometry (AAS) and atomic fluorescence spectrometry (AFS) [7], inductively coupled plasma mass spectrometry [8], polarography and chromatography [9,10,11]. Unfortunately, these techniques are one step behind in terms of effectiveness due to high instrumental cost, intricated operation procedures, and the requirement of a long time. On the other hand, fluorescence-based assay embraced by high selectivity and sensitivity, low sample cost, convenient visualization, greater detection limit, and on-site detection offers plenty of opportunities to address the detection issue by the abovementioned techniques [12,13,14,15,16,17]. To date, fluorescent probes developed for mercury ions can be classified into different categories—nanomaterials-based probes, fluorophores made of organic small molecules, metal-organic materials, and aptamer-based probes. The fluorescent sensors made of small fluorescent molecules have been a preferable choice to detect mercury ions due to accessing desired photophysical properties of the fluorophores and its control function guided by molecular engineering [18,19,20,21,22,23,24]. Scientists have exploited various mechanisms responsible for mercury ion detection such as resonance energy transfer, photoinduced electron transfer, chelation-induced fluorescence alteration, and aggregation-induced emission [18]. Upon exposure to poisonous Hg2+ ion inside a living system, it can be widely found in cellular organelles specifically lysosomes.
The lysosome is a membrane-bound important organelle with an assemblage of more than 50 degradative enzymes in the eukaryotic cell [25,26,27]. In the lysosomal compartment, the enzymes promote the metabolic process of protein, and carbohydrates at an optimal pH range of 4.5–5.5 (acidic medium), thence it is often called an “enzyme warehouse” [28,29]. Hence, a slight alteration in the acidic environment spawned by pH change and deficiency of any enzyme promotes lysosomal malfunctions and eventually results in lysosomal storage diseases [30,31]. Apart from these, the lysosome is immensely involved in cell growth and signaling and several biological events such as energy metabolism, cell membrane repair, and cellular homeostasis [32,33]. The recent literature has disclosed that the presence of any reactive and harmful chemical species in the lysosomal environment disrupts its normal functions which can ultimately induce serious diseases such as cancer, lipid storage disorder, cardiovascular disease, and so on [34,35]. It is well-known fact that the accumulation of heavy metal ions such as Hg2+ can be found more in lysosomes among the subcellular organelles. In comparison to a vast number of fluorescent probes utilized for Hg2+ detection in the environment, organelle targeting Hg2+ detecting probes remain elusive in the past literature [36,37,38,39,40,41]. Hence, considering the aforementioned concerns, there has been provoked an urgent need to develop fluorescent probes to screen the lysosomal environment as well as the accumulation of mercury ions inside the lysosomal compartment. Influenced by this fact, in this work, we have designed and synthesized 1,8-naphthalene monoimide–histidine-conjugated a new fluorescent sensor His-NMI-Bu to detect mercury ions inside the lysosomal compartment (Scheme 1). During the last few decades, 1,8-naphthalimide (1,8-NI) embellished with an electron-deficient rigid aromatic core has been popularized as a promising fluorophore in the family of rylene dyes [42]. The small and special chemical structure of 1,8-NIs has endued them to hold some unique properties such as high absorption coefficient and fluorescence quantum yield, outstanding thermal, chemical, and photostability, tuneable redox activity, and greater electron affinity [43,44]. Enriched by these features, the 1,8-NI dye and its derivatives have displayed their real applications in the field of fluorescent sensing, bioimaging, anti-cancer activity, circularly polarized luminescence, organic solar cell, organic transistors, organic light-emitting diodes, and so forth [45,46,47,48,49,50,51]. Among these areas, this fascinating chromophore has cherished its extensive contribution for a long time as bioimaging probes mainly because of its high brightness, excellent photostability, notable biocompatibility, good water solubility, and membrane permeability [52,53,54,55]. His-NMI-Bu also possesses the aforesaid features which have made it an ideal fluorophore for lysosomal imaging in addition to Hg2+ sensing inside the cellular system. The design strategy of the histidine-appended NMI probe behind lysosomal imaging lies in the fact that the pKa value of histidine (~6.0) suits the fluoroprobe to target specifically lysosome having a pH range of 4.5–6.0. The probe is fully characterized by NMR spectroscopy, mass spectrometry, spectroscopic techniques, and theoretical calculations. In addition to that, the detection of Hg2+ is established thorough spectroscopic and microscopic investigations using live cell imaging experiments. The fluoroprobe featured excellent solid-state emissive characteristics and displays its potential in paper-based sensing of mercury ions.

2. Materials and Methods

2.1. Chemicals

All the solvents and reagents were purchased from commercial sources and were used as received. 4-Bromo-1,8-Naphthalic anhydride, L-histidine, and n-butylamine were purchased from TCI, Alfa Aesar, and Spectrochem, respectively. Metal salts such as mercury chloride (HgCl2) and copper sulfate (CuSO4·5H2O) were also purchased from Sigma-Aldrich. The other salts are purchased given as cobaltous nitrate hexahydrate [Co(NO3)2·6H2O], cadmium acetate dihydrate [Cd(OAc)2·2H2O), and manganese chloride tetrahydrate [MnCl2·4H2O] from otto, calcium chloride (CaCl2) from SDFCL, lead chloride (PbCl2) from Sigma-Aldrich, sodium chloride (NaCl), zinc chloride (ZnCl2), aluminium chloride (AlCl3) and ferric chloride (FeCl3) from SDFCL, Spectrochem, and Rankem, respectively, and used as received. All the spectroscopic grade solvents such as ACN, DMSO, EtOH, THF, 1,4-Dioxane, CHCl3, and DMF were purchased from SRL.

2.2. Steady-State Measurement

The stock solutions of 1.0 mM concentration of dye were made in spectroscopic grade DMSO. The concentration of dye was kept at 10 μM for all the measurements. All steady-state absorption measurements were carried out using Shimadzu UV-1800 spectrophotometer using 1 cm path-length quartz cuvettes. All solvent-dependent steady-state fluorescence measurements and kinetics were performed using the HORIBA Jobin Yvon Fluorolog 3 and Origin 8.0 software provided with the instrument. Fluorescence spectra were recorded using a 1 cm path-length quartz cuvette and both excitation and emission slits were kept at 1.5 nm. All the experiments were carried out at room temperature (295 K) as otherwise mentioned. Relative fluorescence QY of the probe in different solvents was determined using fluorescein as reference dye (ΦFl = 0.95 in aqueous 0.1 N NaOH) by following the equation mentioned below.
Φ s = Φ r   ×   ( 1 10 Ab s r ) ( 1 10 Ab s s )   ×   n s 2 n r 2   ×   A s A r
Φs and Φr are the fluorescence QY of the sample and reference, Abss and Absr are the absorbance of the sample and reference at the excitation wavelength, ns and nr are refractive indexes of the solvents for the sample and reference, As and Ar are considered as respective areas of emission for the sample and reference dye (Fluorescein ΦFl = 0.95 in 0.1 N NaOH).

2.3. Time-Resolved Single Photon Counting Studies (TCSPC)

Time-resolved fluorescence measurements were carried out using a Hamamatsu MCP photomultiplier (R-3809U-50) a time-correlated single photon counting (TCSPC) setup. The pulse diode laser for excitation was taken as λex = 470 nm having full width and half maxima 167 ps and the target count was set up to 10,000. The emission polarizer was fixed at a specific angle (magic angle = 54.7°) with respect to the vertically aligned excitation polarizer. The fitting of the decay was performed using mono, bi, and tri-exponential fitting parameters following the iterative deconvolution method using the software Eztime. All the measurements were performed at room temperature (295 K). The concentration of the fluoroprobe during measurements was kept at 10 μM.

2.4. Solid-State Photophysical Studies

For absorption and emission measurements, the solid sample of the probe was thoroughly mixed with BaSO4. The UV–Vis. absorption spectrum was recorded for the BaSO4-mixed powder sample in the Cary-5000 spectrophotometer following the diffusion reflectance spectroscopy method. The solid-state emission spectra were measured by putting the sample in a sample holder kept at magic angle (54.7°). The absolute quantum yield was measured by using a BaSO4-coated integrating sphere. For both measurements, the sample was excited at 430 nm and the emission range was fixed in the 440–750 nm region.

2.5. pH Titration and Fluorescence Titration with Metal Ions

The pH measurements were performed using an Oakton pH meter (pH 700). The measurements of absorption and fluorescence at different pH were carried out using 5 μM dye concentration at room temperature. For the pH-dependent absorption and fluorescence experiments, we used different buffer solutions such as acetate (pH = 5.0), MES (pH = 6.2), PBS (pH = 7.4), HEPES (pH = 8.0), and bicarbonate (pH = 10.0) buffers.
Fluorescence titration of the probe with different metals was performed using the Fluorolog instrument. The stock solution of probe and metal salts was prepared as 1 mM in DMSO and 10 mM in Milli-Q water, respectively. Emission spectra were recorded by exciting the probe at 450 nm wavelength with slit width 1.5/1.5 nm and the emission range was kept at 460–750 nm. The concentration of probe and metal ions were kept at 10 μM and 100 μM, respectively, in MES buffer. The metal salts were considered for this study as mentioned, HgCl2, NaCl, ZnCl2, PbCl2, CaCl2, Co(NO3)2·6H2O, MnCl2·4H2O, FeCl3, AlCl3, CuSO4·5H2O, and Cd(OAc)2·2H2O.

2.6. Job’s Plot

To get an idea about the binding stoichiometry between the probe and Hg2+, Job’s plot experiment was performed following the fluorescence titration method. Fluorescence titration was carried out at different ratios of the probe–mercury ion while maintaining the total concentration of 10 μM in MES buffer with pH 6.2. The binding ratio was obtained from ΔI·χHis-NMI-Bu vs. χHis-NMI-Bu plot where ΔI = change in intensity at 560 nm during the experiment and χHis-NMI-Bu = mole fraction of His-NMI-Bu.

2.7. NMR Spectroscopy and Mass Spectrometry

1H NMR spectra were recorded on Bruker spectrometer in DMSO-d6 solvent. The chemical shift was reported in ppm scale with respect to the residual solvent signal at δ = 2.54 ppm in DMSO-d6 at 500 MHz. For the 13C NMR, the frequency was considered 126 MHz. The high-resolution mass spectra (HRMS) were recorded on Bruker mass spectrometer using methanol as eluent.

2.8. Density Functional Theory (DFT) Calculation

Ground state optimized geometry and electronic distribution of frontiers molecular orbitals (FMOs) for His-NMI-Br, His-NMI-Bu, and His-NMI-Bu + Hg2+ complex was determined by performing density functional theory (DFT) calculation in the gaseous state using Gaussian 16 program at the CAM-B3LYP/LANL2DZ level of theory. The cartesian coordinates and detailed energy values of FMOs are given in supporting information (SI).

2.9. Cell Culture and Imaging

Dulbecco’s modified Eagle medium (DMEM), fetal bovine serum (FBS), and penicillin–streptomycin antibiotic cocktail were purchased from HiMedia (Mumbai, India). The glass-bottom imaging dishes were purchased from Ibidi (Gräfelfing, Germany). The confocal imaging experiments were performed with Olympus FV 3000 Confocal Laser Scanning Microscope (LSM) equipped with a live cell imaging setup. The acquired images were processed using cellSens v3.2 (Olympus).

2.10. Culture Method

The baby hamster kidney cells (BHK-21) and human cervical cancer cells (HeLa) were obtained from NCCS, Pune, India. The cells were cultured in DMEM supplemented with 10% (v/v) FBS and 1% (v/v) antibiotic cocktail in 5% CO2 at 37 °C temperature. After culturing the cells for 24–36 h, they were grown to 75–80% confluency in the glass-bottom imaging dishes for 24 h, and further imaging experiments were performed.

2.11. Confocal Microscopy

The confocal microscopy was performed using 488 nm and 561 nm excitation laser sources. The corresponding emission channels were 500–540 nm and 570–630 nm, respectively. The confocal aperture (pinhole size) and dwell time were 1.0 Airy Disk unit 8 μs/pixel, respectively.

3. Results

3.1. Synthesis

The synthesis of the fluoroprobe His-NMI-Bu followed two consequent steps (Scheme 2). In the first step, L-histidine moiety was introduced on anhydride position of 4-bromo-1,8-naphthalic anhydride. After that, n-butylamine was incorporated at the 4-position of His-NMI-Br via nucleophilic substitution reaction. The detailed synthetic procedures of both derivatives and their preliminary characterizations (Figures S1–S6) have been described below.
His-NMI-Br (B): L-histidine (279.27 mg, 1.80 mmol) was dissolved in 5 mL of water and allowed to stir for 30 min. Then, an ethanol solution (13.5 mL) of 4-bromo 1,8-naphthalic anhydride (A) (500 mg, 1.80 mmol) was added to the histidine solution in stirring condition. The mixed solution was refluxed at 100 °C for 8 h. After the completion of the reaction, the reaction mixture was cooled down to room temperature and the white precipitate was formed at the bottom of the solution. The precipitate was filtered with repeated washing with CHCl3 as a solvent and dried under air affording the desired compound (B) as a white powder (649 mg). Yield–86%. The chemical purity of the synthesized compound was confirmed by 1H NMR spectroscopy and mass spectrometry.
1H NMR (500 MHz, DMSO-d6) δ 8.60 (dd, J = 8.5, 1.0 Hz, 2H), 8.34 (d, J = 7.9 Hz, 1H), 8.25 (d, J = 7.9 Hz, 1H), 8.05–8.01 (m, 1H), 7.37 (s, 1H), 6.69 (s, 1H), 5.77 (dd, J = 9.9, 5.0 Hz, 1H), 3.44 (dd, J = 15.1, 5.1 Hz, 1H), 3.34 (dd, J = 15.0, 9.9 Hz, 1H).
13C NMR (126 MHz, DMSO-d6): δ 25.5, 53.2, 121.2, 122.0, 128.0, 128.7, 128.8, 129.3, 129.6, 131.2, 131.7, 131.9, 132.7, 132.9, 134.4, 134.5, 162.2, 170.3.
His-NMI-Bu (C): Compound (B) (100 mg, 0.241 mmol), n-butylamine (88.13 mg, 1.205 mmol) were taken in a Biotage microwave vial (2–5 mL capacity) and the tube was sealed with aluminum cap fitted with Teflon. Then, dry DMSO (4 mL) was added to the reaction mixture. A nitrogen atmosphere was maintained throughout the reaction. Then, the reaction mixture was stirred and heated at 110 °C for 15 h. After the completion of the reaction, the reaction mixture was cooled to room temperature. From the reaction mixture, the residue was extracted with distilled CHCl3 (slow addition, continuous stirring in the presence of ice), then it was collected through filtration. The desired product was purified by column chromatography using silica as stationary phase and DCM: methanol (9:1) + 0.5% TEA as the eluent which finally afforded the desired compound (C) as yellow solid (35 mg, 35% yield). The structure and chemical purity of the compound was confirmed by 1H NMR spectroscopy and mass spectrometry.
1H NMR (500 MHz, DMSO-d6): δ 8.76 (d, J = 8.3 Hz, 1H), 8.42 (d, J = 7.3 Hz, 1H), 8.24 (d, J = 8.6 Hz, 1H), 7.85 (t, J = 4.9 Hz, 1H), 7.71 (t, J = 7.9 Hz, 1H), 7.41 (s, 1H), 6.82 (d, J = 8.7 Hz, 1H), 6.61 (s, 1H), 5.83 (dd, J = 9.4, 5.2 Hz, 1H), 3.43 (d, J = 7.3 Hz, 2H), 3.41 (d, J = 5.6 Hz, 2H), 1.73 (p, J = 7.4 Hz, 2H), 1.47 (h, J = 7.2 Hz, 2H), 0.99 (t, J = 7.4 Hz, 3H).
13C NMR (126 MHz, DMSO-d6): δ 9.0, 13.8, 19.8, 29.9, 42.5, 45.5, 103.8, 107.1, 120.1, 121.6, 121.6, 121.6, 124.2, 129.5, 130.8, 134.5, 134.5, 134.6, 150.8, 162.5, 163.4, 171.2.

3.2. Photophysical Properties of the Probe

At the outset, to access the suitability and applicability of any fluorescent probe for bioimaging, it was requisite to deeply understand its intrinsic properties including solvent-dependent absorption, emission and the excited-state lifetime, optical purity, concentration-dependent absorption and emission, photostability, and pH sensitivity. Figure 1 conveys the ground state and excited state characteristics of the synthesized probe in different solvents. Concentration-dependent UV–Vis. absorption study unveiled a linear relationship between the absorbance of the probe vs. its concentration in DMSO (Figure S7).
Ruling out any possibility of aggregation in this concentration range. Hence, the working concentration of dye was chosen as 10 μM for the spectroscopic measurements. As seen in Figure 1a, in a good solvent like DMSO, UV–Vis. spectra of the probe showed the emergence of a broad absorption band in the visible region, mostly centered on λ m a x a b s = 448 nm. Usually, the unsubstituted 1,8-naphthalimide core absorbs in the UV region in solution, but here the absorption of the probe His-NMI-Bu was elongated up to 500 nm region, which is presumably due to extended conjugation between donor n-butylamine and NMI core through 4-position of NMI. Apart from this strong absorption in the 400–500 nm regime, a small peak also arose nearby 284 nm by the contribution of histidine moiety (Figure S7). Consequently, the emission spectrum was collected on exciting the probe at 448 nm, which demonstrated an intense fluorescence in DMSO. The maximum emission of the dye was perceived in the green region with   λ m a x e m = 538 nm (inset of Figure 1a), thus allowing the probe to attain a large Stokes shift characteristic in solution. The magnitude of the Stokes shift (Δλ = λ m a x e m λ m a x a b s ) determined in DMSO was calculated as 90 nm. The optical purity of the probe was validated from the superimposable nature of absorption and excitation spectra (monitoring wavelength 538 nm) in DMSO. Solvent polarity-dependent absorption spectra recorded in a range of non-polar to polar solvents manifested that the absorption maximum gradually shifts towards a longer wavelength region while increasing the solvent polarity (Table S1 and Figure 1b). For example, it can be mentioned, λ m a x a b s in CHCl3 and H2O were detected at 435 nm and 455 nm, respectively, denoting a 20 nm bathochromic shift occurred between these two extremely non-polar and polar solvents. This gradual bathochromic shift in the absorption spectrum with increasing polarity of the surrounding dielectric medium divulged the intramolecular charge transfer (ICT) property of the probe existing in the ground state. This notable UV–Vis. property encouraged us to measure the emission spectra of the probe in solution. Akin to UV–Vis. absorption spectra, the fluorescence intensity of the probe at 540 nm as a function of concentration showed no deviation from linearity (Figure S8). A careful analysis of the solvent polarity-dependent emission profile of the probe provides the information that the probe exhibited a broad emission in the 450–700 nm regime without generating any vibrational features. The emission profile of the probe in different solvents brought a similar outcome, i.e., the solvent polarity-influenced occurrence of red-shift (40 nm between CHCl3 and H2O), as shown in Figure 1c. The evolution of structureless absorption and emission spectra in different solvents in congruent with appreciable bathochromic shift while increasing solvent polarity endows strong evidence for the ICT nature of our synthesized probe. Time-resolved emission measurement unveiled that the average fluorescence lifetime ( τ a v g ) of the probe was evaluated in a range of 9.6–10.3 ns in the solvents except for H2O in which the value was obtained comparatively low as 4.0 ns, as given in Figure 1d and Table S1. The huge reduction of τ a v g in H2O can be anticipated as a result of a specific solvent effect, i.e., H-bonding interaction between the histidine moiety of the probe and surrounding H2O molecules. The probe is highly fluorescent in solution as unveiled by greater rel. ΦFl, the relative quantum yield value was obtained exceptionally higher in DMSO (rel. ΦFl. = 0.81) and 1,4-dioxane (rel. ΦFl. = 1.12) than remaining solvents. The near unity FLQY is attributed to prominent radiative decay from the S1 state to the ground state in those particular solvents as corroborated by kr and knr values in selective three solvents 1,4-dioxane, DMSO, and H2O. The values are represented as: kr (1,4-dioxane) = 1.1 × 10⁸ s−1 and knr (1,4-dioxane) = 0.1 × 10⁸ s−1, kr (DMSO) = 0.8 × 10⁸ s−1 and knr (DMSO) = 0.2 × 10⁸ s−1, kr (H2O) = 0.5 × 10⁸ s−1 and knr (H2O) = 2.0 × 10⁸ s−1 (Table S2). Next, to verify the photostability of our probe in solution, the fluorescence kinetics profile was monitored in an MES buffer for a long time (t = 150 min) by keeping the light source intensity 100 lx. The emission kinetics in Figure S9 depicted no change in intensity after 2.5 h, signifying the photostability of the fluoroprobe, which is a crucial factor for bioimaging study.

3.3. Computational Investigations

Followed by spectroscopic investigations, our next aspect was to understand the electronic property and theoretically validate the ICT property of the probe as previously discussed. In addition to that, we also investigated how chelation of the probe with Hg2+ can influence the electron density and FMOs energy. The DFT calculation was carried out using the Gaussian 16 program at the B3LYP/LANL2DZ level of theory [56]. DFT studies revealed, for His-NMI-Br and His-NMI-Bu, both HOMO and LUMO electron density localizes on NMI core along with the peri-substituted Br atom and -NH group. A careful analysis depicts that the extent of electron localization for HOMO is more on peri-substituted Br and -NH groups, whereas electron-poor imide moiety mostly acquires LUMO density. In addition, a comparative FMOs energy analysis manifests a significant upraise of HOMO energy by an amount of 1.176 eV for His-NMI-Bu than its precursor His-NMI-Br. Simultaneously, the LUMO level is also elevated by a factor of 0.637 eV as shown in Figure 2. It can be worthily mentioned that the extent of elevation for HOMO is so prominent than corresponding LUMO, it leads to reduce the overall electronic band gap energy (Eg = 6.283 eV and 5.744 eV for His-NMI-Br and His-NMI-Bu, respectively). These theoretical outcomes unequivocally establish the ICT characteristics of probe His-NMI-Bu, which is absent in the bromo derivative. Next, our focus was to screen the electronic distribution of FMOs for probe + Hg2+ complex and evaluate the binding energy for probe-Hg2+ chelation. As observed for two previous compounds, the electron cloud of HOMO is mainly concentrated on NMI and -NH moieties. On the other hand, the electron localization of LUMO is totally distinct in comparison to those aforementioned two derivatives, LUMO density is completely shifted from NMI core to Hg-histidine moiety. This profound shift in LUMO is attributed to the strong electron-withdrawing effect of charged species centered on the Hg2+-histidine region. Notable to mention, a huge change in electronic distribution reflected in deep stabilization of the LUMO level for probe + Hg2+ complex (ELUMO = −8.885 eV) than His-NMI-Bu only (ELUMO = −6.861 eV). Consequently, the HOMO-LUMO energy gap was obtained very low (Eg = 2.247 eV) for the complex than unreacted probe molecule.
This dramatic change in localization of LUMO as well as spatial separation of HOMO and LUMO, and very small energy gap indicates the possibility of through space electron/charge transfer from NMI core (HOMO) to metal-coordination site (LUMO). The high susceptibility of electron transfer might be highly responsible for showing a change in excited state electronic property leading to quenching of fluorescence in solution. The electrostatic potential map and energy values of FMOs for two compounds and complexes are provided in Figures S10–S12 and Tables S3–S5. The binding energy value for probe-Hg2+ complex is theoretically evaluated as Eb = −7.9 × 10⁴ kJ/mol.

3.4. pH-Dependent Absorption and Emission Studies

Figure 3a,b convey the absorption and emission spectra of the synthesized probe at different buffer solutions with varied pH. While measuring the absorption and emission spectra, the probe was dissolved in buffer solutions and consequently, spectra were measured. UV–Vis. and fluorescence titration ensued no significant change in the characteristic absorption or emission of the probe while changing the pH of the solution. The absorbance at 450 nm and intensity at 560 nm displayed no noticeable change in absorbance and emission (inset of Figure 3a,b). This outcome indicated that upon protonation of imidazole nitrogen at lower pH or deprotonation of -COOH group at higher pH, it did not register any change in the spectroscopic profile of His-NMI-Bu which has made it an ideal pH invariant probe suitable for organelle imaging. In addition to that, these results also ensured that no photoinduced electron transfer (PET) process occurred between the NMI core and histidine moiety. PET can be exclusively found in 1,8-substituted NIs reported in the previous literature, where electron transfer between donor on imide position and acceptor (NMI core) or vice versa effectively quenches the fluorescence intensity of those dyes in a solution that acts as a bottleneck in live cell imaging.

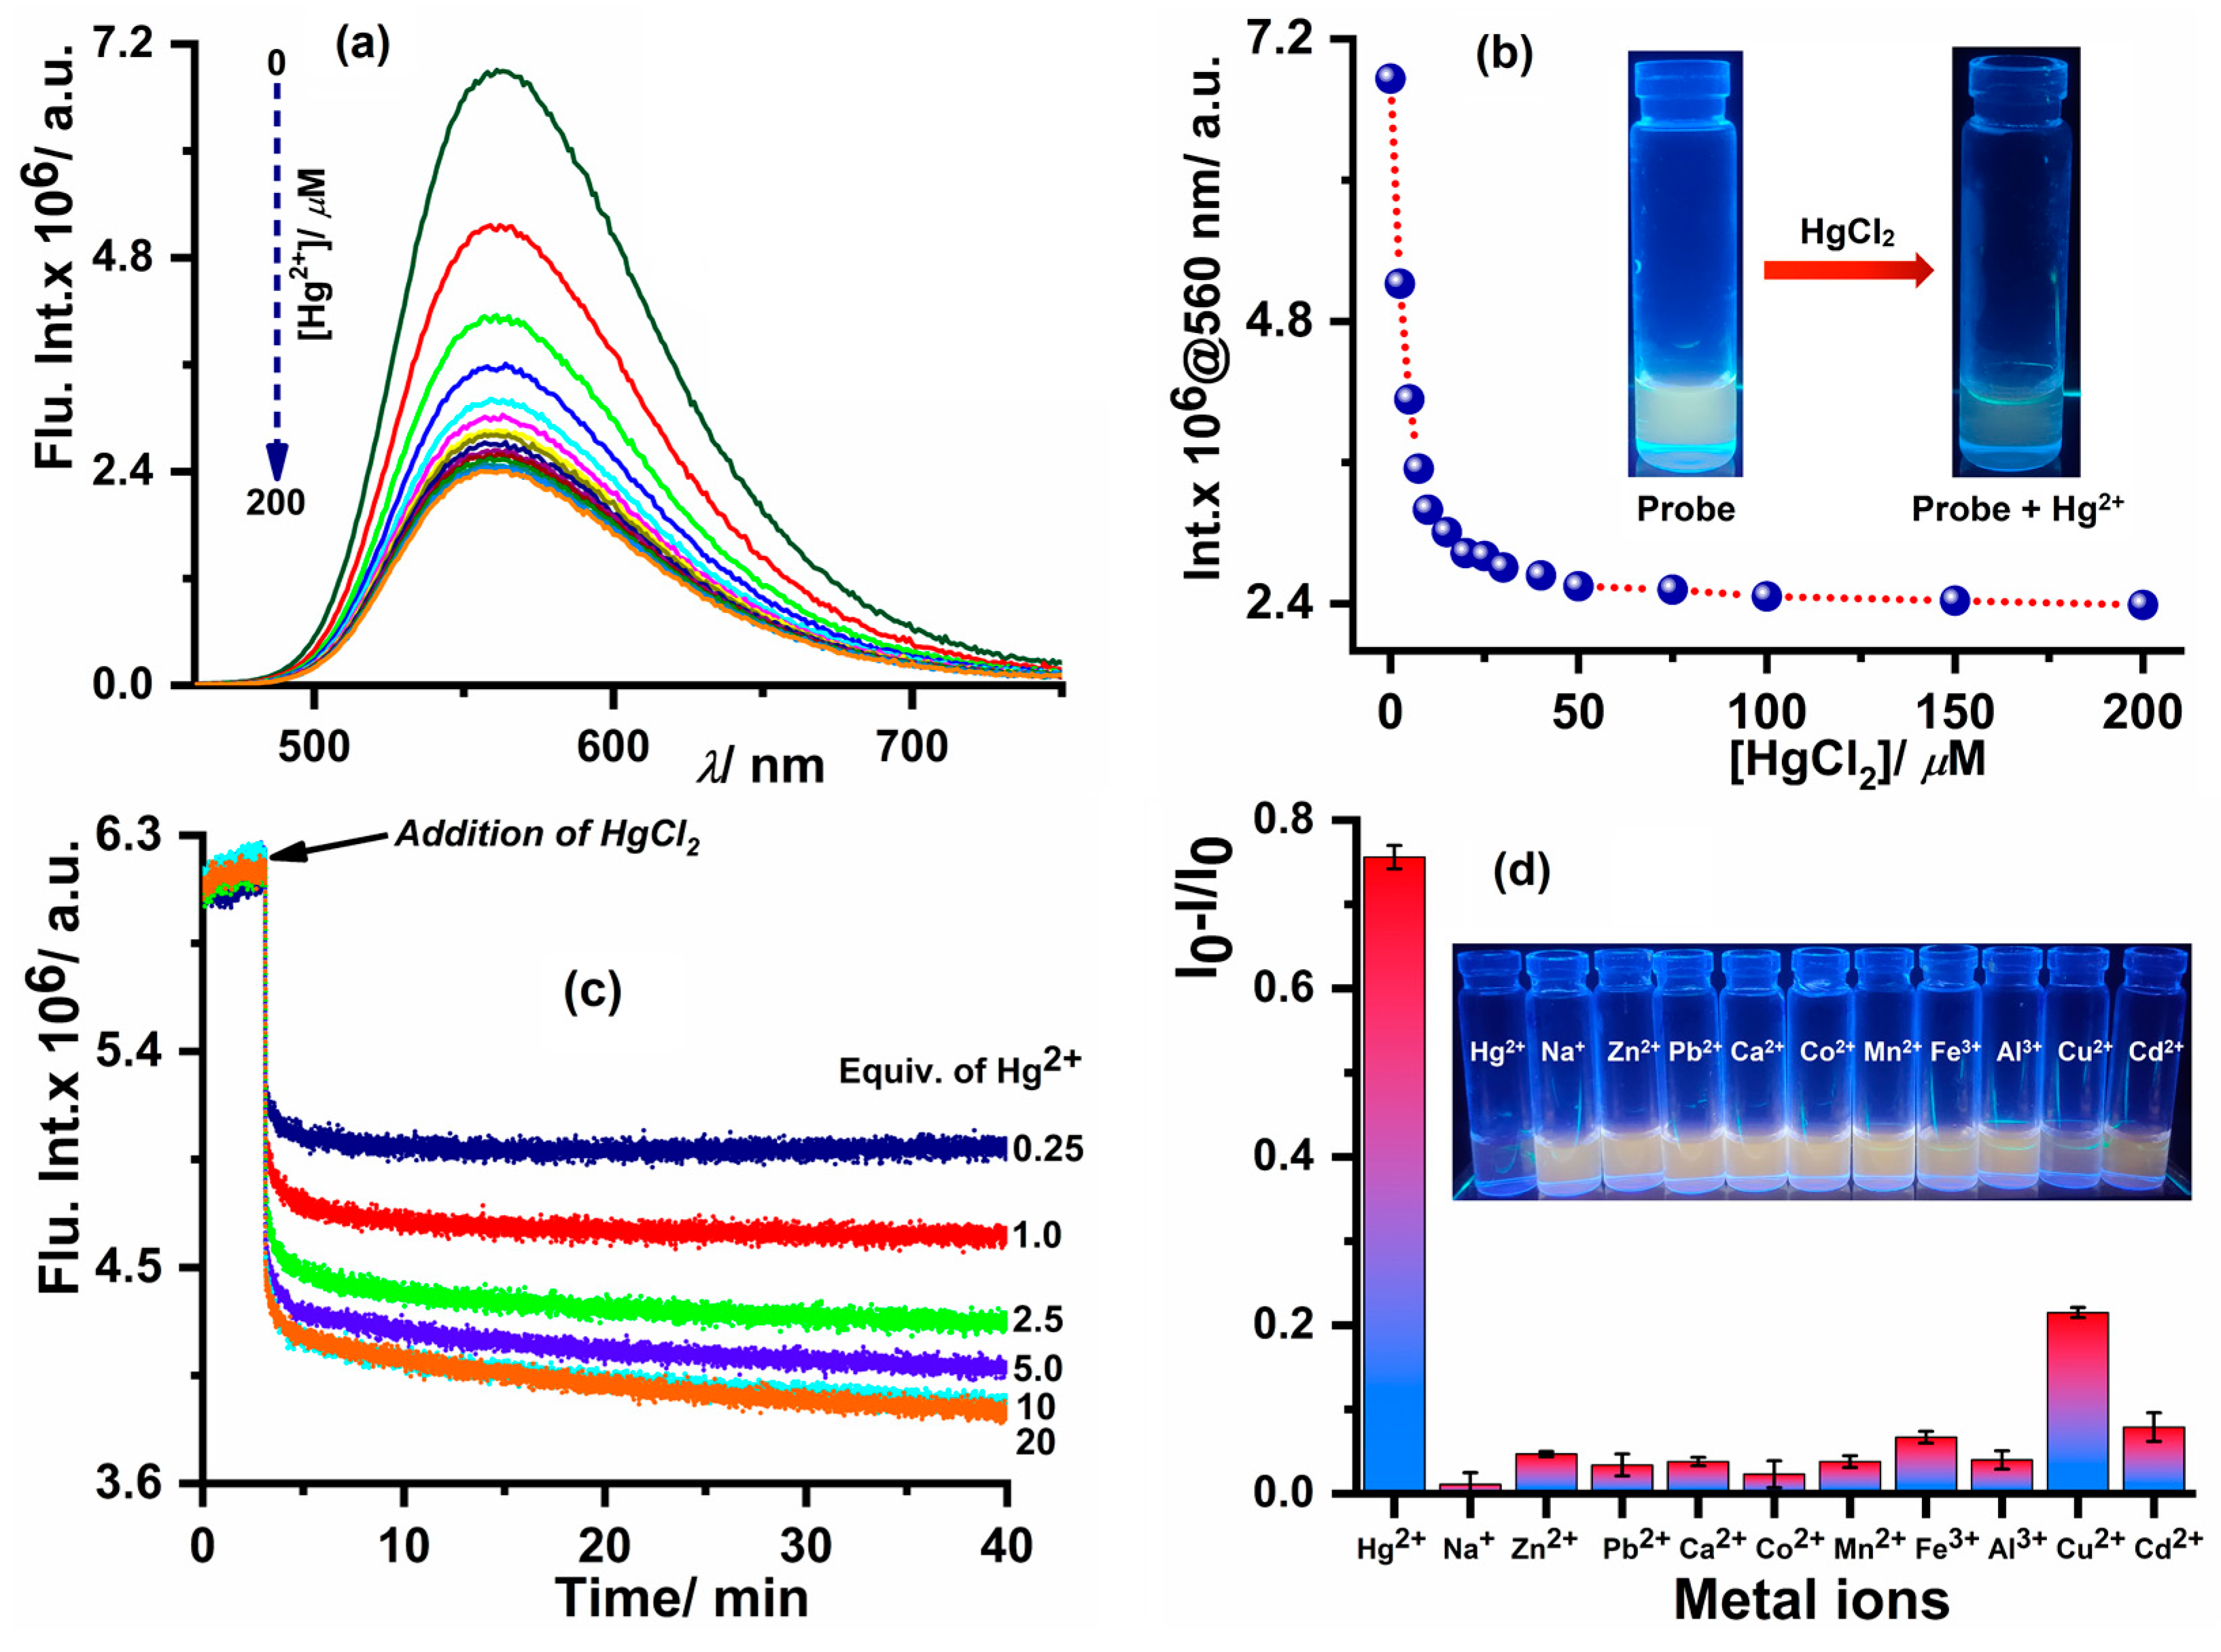
3.5. Spectroscopic Studies for Hg2+ Sensing

Next, our attention was to investigate the fluorometric detection of physiologically relevant various metal ions including harmful mercury ions in solution by our fluorescent probe His-NMI-Bu. To obtain the sensitivity of the probe towards Hg2+ ions, a fluorescence titration experiment was carried out between probe (10 μM) and HgCl2 analyte of different concentrations in MES (pH = 6.2) buffer solution. As depicted in Figure 4a, the probe initially possessed intense yellowish-green emission centered at 560 nm in MES buffer, but upon gradual addition of HgCl2 (0–200 μM), the probe exhibited significant fluorescence quenching (~3-fold), thus referring the probe as turn-off fluorescent sensor. It was interesting to observe that the fluorescence depletion was prominent at a lower concentration range (0–10 μM), after that it showed a little change in intensity to reach the saturation at a relatively higher concentration (Figure 4b). Upon treatment of the probe with Hg2+, the emission color of the solution was changed from greenish-yellow to colorless as evident from the inset image of Figure 4b. The limit of detection (LOD) value in the MES buffer was procured very low as 0.52 μM. The fluorescence response towards Hg2+ is attributed to chelation-induced fluorescence attenuation. The binding stoichiometry of the probe and Hg2+ ion was obtained 1:1 as revealed by the Job’s plot (Figure S13). Consequently, the binding constant value was evaluated as Kb = (6.9 ± 0.1) × 106 M−1 by fitting (1:1 binding) the graph of intensity at 560 nm vs. concentration of Hg2+ (Figure S14) which follows the equations mentioned below. 1H NMR study unveiled the disappearance of -NH proton in imidazole moiety due to gaining acidic and exchangeable nature caused by electron donation from N-atom to Hg2+ ion (Figure S15). This result denoted the occurrence of the probe–Hg2+ complexation through the chelation mechanism. The formation of probe-Hg2+ chelated complex via 1:1 binding was further confirmed from mass spectra depicting m/z = 608.1372 (Figure S16). Furthermore, to get an idea about the time-dependent response also with varied concentrations, fluorescence kinetics was performed in MES buffer at 295 K by keeping monitoring wavelength as 560 nm. The fluorescence kinetics of probe (10 μM) with 0.25 equiv. (2.5 μM) Hg2+ manifested a sharp diminish of intensity just after the addition of mercury chloride and it reached the plateau at t = 10 min. Interestingly, at a relatively higher concentration of Hg2+, the extent of quenching became more as evident from Figure 4c. The outcomes of the kinetics decipher that a lower concentration of Hg2+ was not enough to quench the emission of the probe significantly, the residual fluorescence comes from the unreacted fluoroprobe. On the other hand, the quenching became prominent at a relatively higher equivalent due to the effective reaction/chelation of the probe with Hg2+ and thus, a saturation of intensity was obtained at a longer time. In addition to that, it should be mentioned that a marginal change in intensity was observed between 10 equiv. (100 μM) and 20 equiv. (200 μM) Hg2+ in the kinetics profile indicating 10 equiv. of mercury ions (100 μM) are sufficient to show maximum quenching of the probe emission in the solution. Furthermore, in order to find the mechanism of quenching, i.e., static or dynamic, we followed the Stern–Volmer kinetics study. The plot of I0/I with quencher (Hg2+) concentration showed a linear relationship (Figure S17) that was well-matched with the Stern–Volmer equation, i.e., I 0 I = 1 + K a [ Q ] . The time-resolved fluorescence decay was also collected for probes with Hg2+ of different concentrations which revealed no change in the decay and lifetime values (Figure S18 and Table S6). Hence, these studies corroborated that Hg2+ chelation-induced fluorescence quenching is ascribed to static quenching that occurred via the complexation of His-NMI-Bu with Hg2+ in solution. The fluorescence depletion for the probe-Hg2+ complex is possibly due to through space photoinduced electron transfer (PET) from the donor NMI core to the acceptor Hg2+-ligand [14].
Δ   I = x H i s N M I B u   I H i s N M I B u + x H i s N M I B u H g 2 + I H i s N M I B u H g 2 + = [ H i s N M I B u ] [ H i s N M I B u ] 0   I H i s N M I B u + [ H i s N M I B u H g 2 + ] [ H g 2 + ] 0 I H i s N M I B u H g 2 +  
[ His-NMI-Bu ] + [ Hg 2 + ]     [ His-NMI-Bu Hg 2 + ]
Δ   I = I H i s N M I B u H g 2 +     + ( I H i s N M I B u   I H i s N M I B u H g 2 +   ) ( ( H i s N M I B u ] 0 [ H g 2 + ] 0 1 K a ) [ ( H i s N M I B u ] 0 + [ H g 2 + ] 0 + 1 K a ) 2 4 [ H i s N M I B u ] 0 [ H g 2 + ] 0 ] 2 [ H i s N M I B u ] 0

3.6. Selectivity Assay

To access the selectivity of the probe towards mercury ion (Hg2+) in solution, fluorescence titrations were performed for probe (10 μM) with various biologically active metal ions including Na+, Zn2+, Pb2+, Ca2+, Co2+, Mn2+, Fe3+, Al3+, Cu2+, and Cd2+ (10 equiv. or 100 μM) in MES buffer of pH 6.2. The fluorescence study showed no significant quenching in the emission intensity of the probe when treated with the metal ions except Hg2+ which expressed a 3.8-fold decrease in intensity at the 560 nm band. The probe His-NMI-Bu is highly selective towards Hg2+ which is also evident from the bar diagram revealing a considerable change in intensity represented by (I0−I)/I0 = 0.76, whereas, for other metal ions, the values were comparatively much less (<0.25), as seen in Figure 4d. It must be noted here that I0 and I denote the intensity at the 560 nm band before and after the addition of metal ions. The inset image of Figure 4d illustrates, upon treatment of the probe with Hg2+, the solution became faintly emissive, for other metal ions, the emission color of the solution remained unchanged.

3.7. Solid-State Properties of Probe and Paper-Based Sensing

Further, we explored the solid-state optical properties of the probe His-NMI-Bu. In the absorption spectrum, the probe showed a broad absorption band with λ m a x a b s = 430 nm associated with a peak at 480 nm as obtained by diffusion reflectance spectroscopy (Figure 5a). The probe was orange-colored emissive (as seen under UV illumination) in a solid state showing maximum emission centered at 588 nm (Figure 5b). The solid-state emission feature of the probe was verified from the considerable absolute fluorescence QY (ΦFl = 3.0 ± 0.3%) in powder form. The most possible reason for solid-state emission of the probe can be thought of as interruption of π–π interaction between NMI cores caused by flexible histidine moiety and n-butyl chain in the solid-state. Hence, to find out the potential of the fluorescent probe for onsite practical application, paper-strip-based detection was carried out at various concentrations of HgCl2. For that purpose, a set of clean Whatman filter papers was immersed in 1.0 mM probe solution in DMSO and dried properly at RT (295 K). The stock solutions of HgCl2 with various concentrations (0.01–10.0 mM) were prepared and equal volumes of HgCl2 were added separately to each filter paper and again, kept in the open air. The filter papers were placed under daylight and UV light (365 nm) before and after the treatment of the HgCl2 solution. Initially, the intense, yellow-colored filter papers were highly emissive (greenish-yellow) under UV illumination. However, after the addition of mercury ion, the filter papers became faded and showed noticeable and rapid fluorescence quenching leading to non-emissive features as detected by the naked eye (Figure 5c). Hence, it can be noteworthily mentioned that the dye-loaded filter paper can detect low concentrations of Hg2+ (10 μM) and the Hg2+-induced fluorescence quenching was prominent at a relatively higher concentration (10 mM) of HgCl2 in the above-mentioned concentration range. This result signifies that the probe can be very useful to construct a paper-based sensor for the effective detection of Hg2+ ions in real samples.

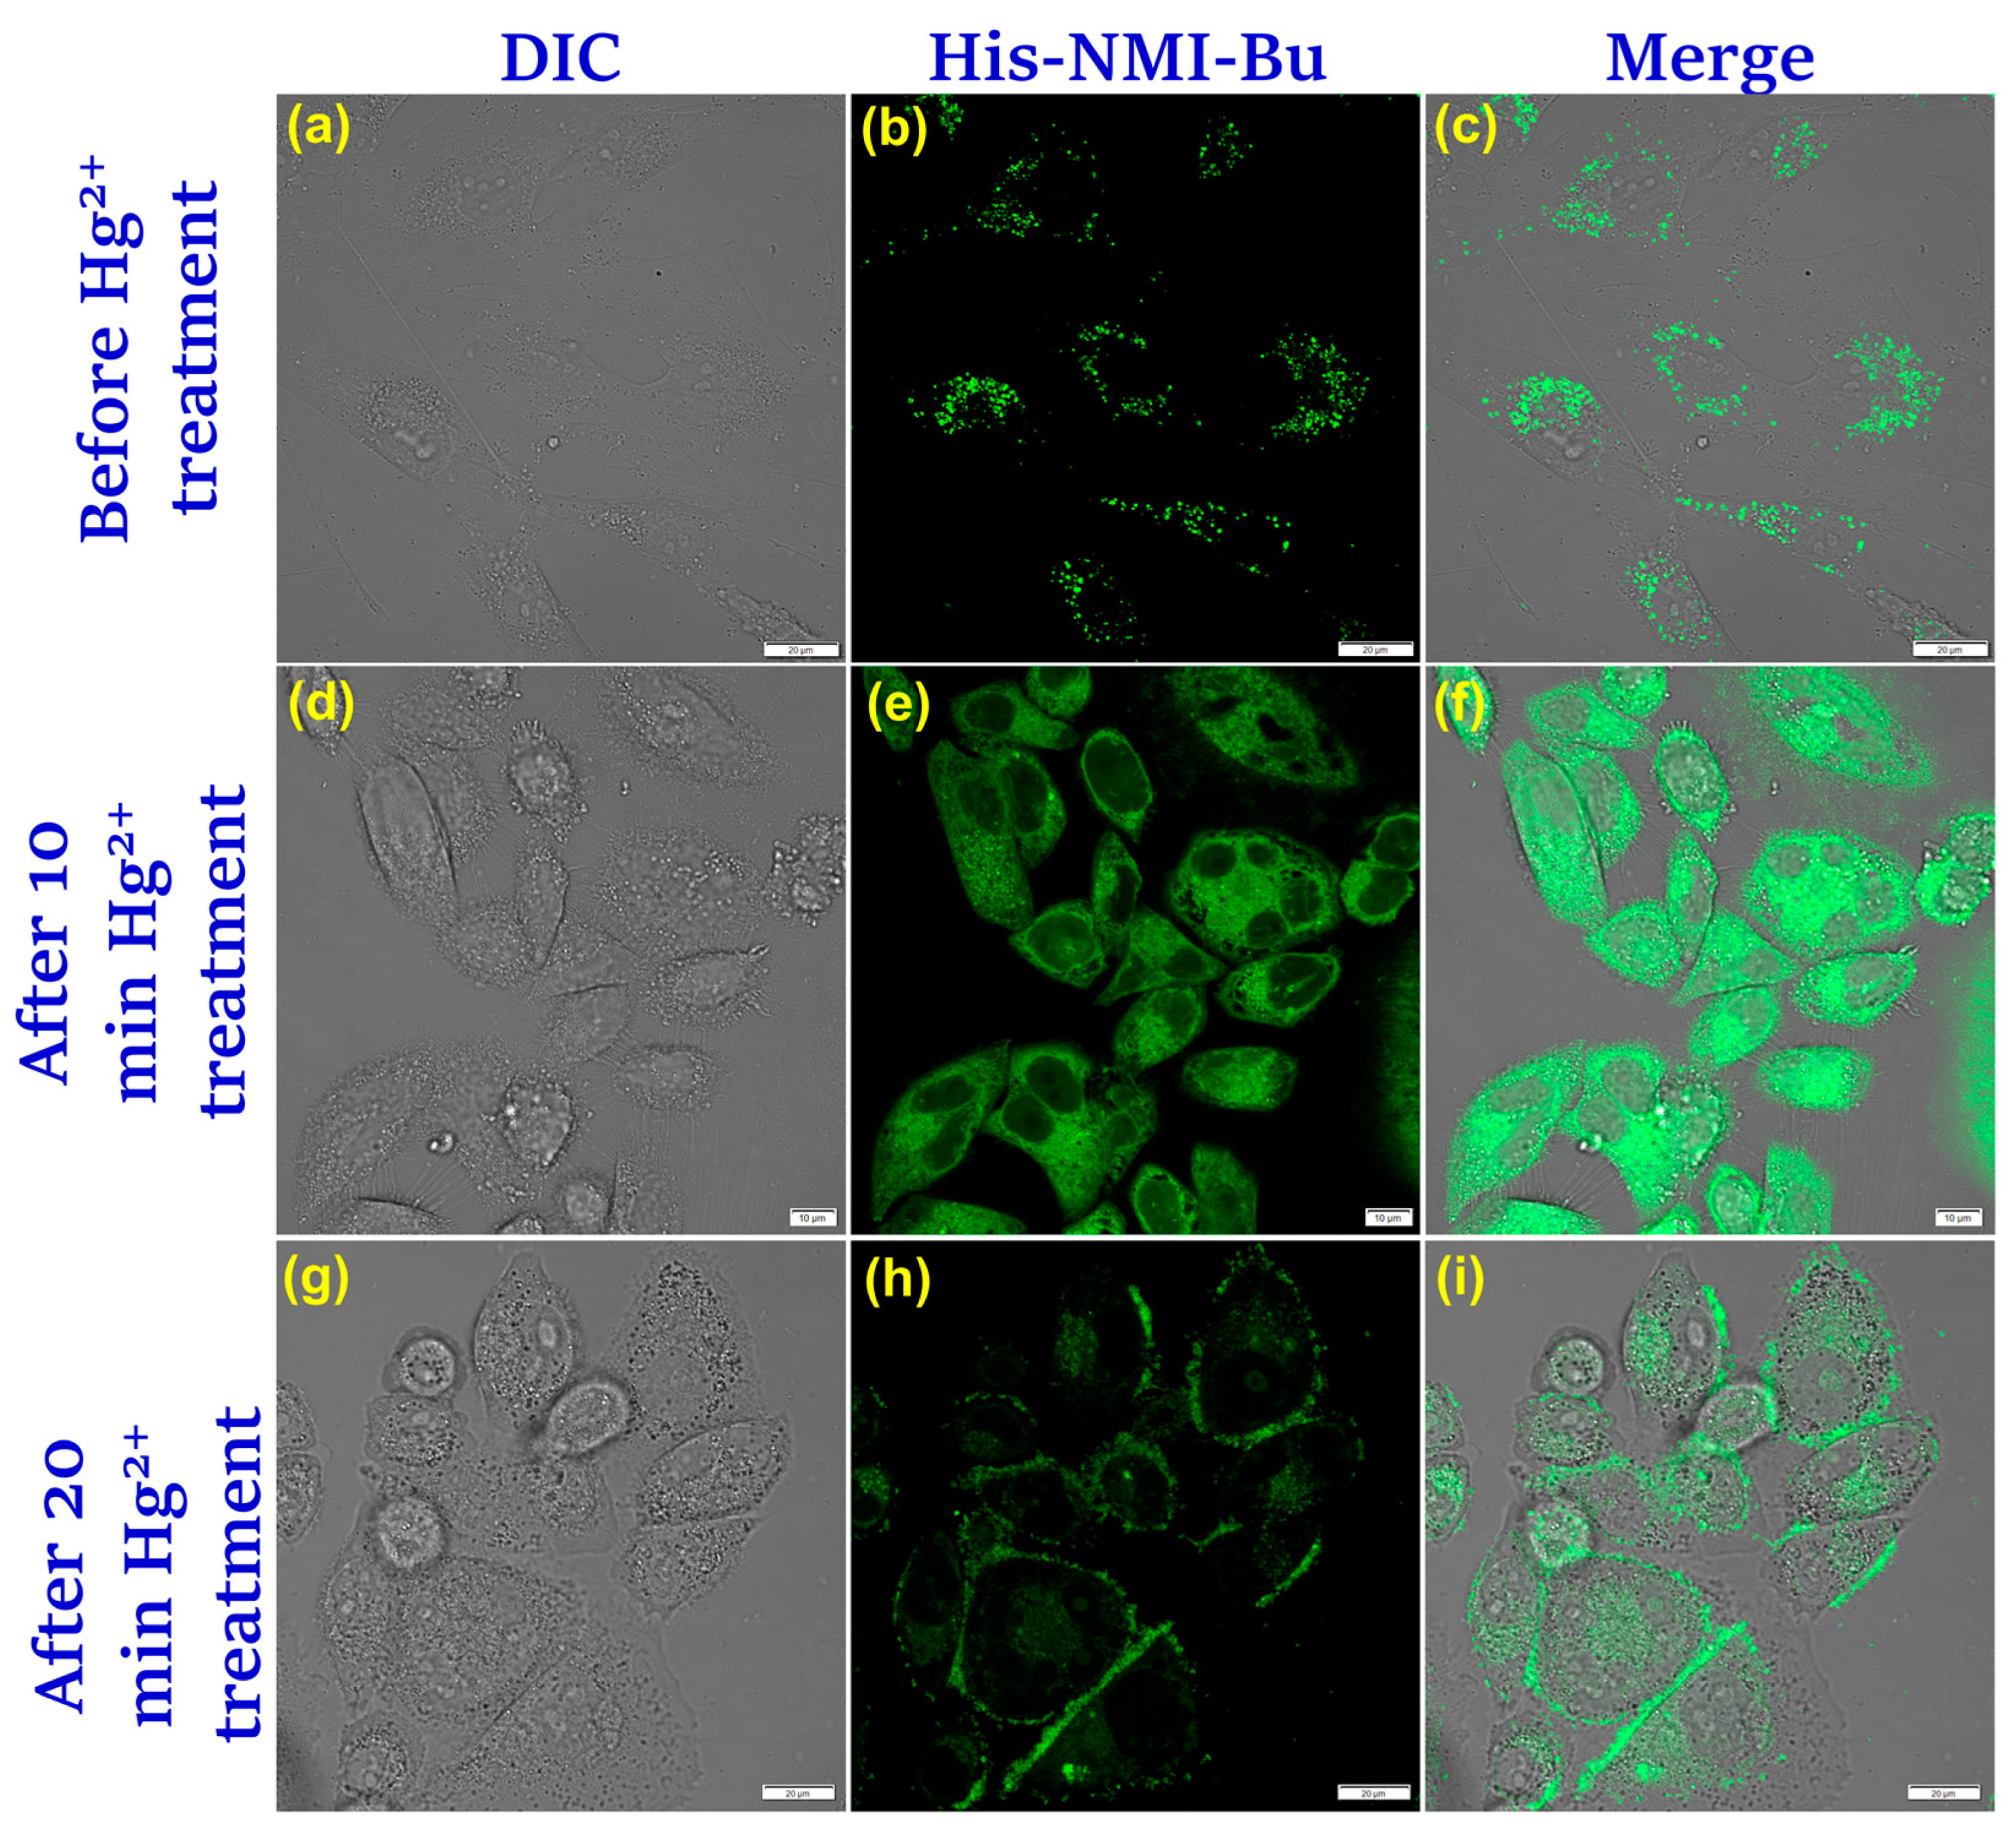
3.8. Bio-Imaging and Detection of Hg2+ Inside Lysosomes

Once the spectroscopic findings confirmed the probe’s ability to detect Hg2+ in vitro, we moved to the bioimaging applications. Initially, the biocompatibility of the probe was determined with the help of a standard MTT assay. For this purpose, live BHK-21 cells were exposed to different probe concentrations for 24 h and the half-maximal inhibitory concentration was found to be ~50 µM (Figure S19). Now, studying the specific localization of His-NMI-Bu, if any, in the live cells was an important aspect to find out. The live cells were treated with 5 µM for 15 min and imaged under a confocal microscope. In the green emission channel, several punctate structures could be visualized throughout the cellular cytoplasm and identified as lysosomes. To verify, fluorescence colocalization experiments were performed with commercially available organelle trackers, i.e., Lysotracker Red, MitoTracker Red, and ER Tracker Red. (Figure 6) Interestingly, it was found that His-NMI-Bu specifically localized inside the lysosomal compartments with the corresponding Pearson’s correlation coefficient value of 0.94. In the case of the organelles, the extent of colocalization was much lesser and hence it can be confirmed that the probe is specific to lysosomal localization. Moreover, the localization phenomena were further confirmed by performing the colocalization experiment in the live HeLa cells to rule out any possibility of specificity to any particular cell line (Figure S20). The selective localization of the probe inside the lysosome is attributed to pKa = 6.0 of histidine moiety which is suitable for targeting the acidic organelle lysosome with a pH value of 4.5–5.0.
Now, to further investigate the potential of His-NMI-Bu to sense the intracellular response in presence of Hg2+, live BHK-21 cells were stained with His-NMI-Bu and thereafter treated with 10 µM HgCl2 for different periods. The confocal images show that the lysosomal localization is gradually disrupted once the cells are exposed to Hg2+. The fluorescence signal is visible from all over the cellular structure after 10 min treatment while a longer treatment time of 20 min yielded images with very low signals from the cytoplasm but bright fluorescence from the plasma membrane (Figure 7a–i). This observation can be rationalized by the occurrence of lysosomal exocytosis that is caused due to the fusion of the lysosomal membrane with the plasma membrane. Hence, it can be concluded that the probe is an efficient candidate for sensing intracellular Hg2+ alongside being able to monitor the lysosomal exocytosis phenomena in live cells. To further support our experimental findings, we have also performed the reverse assay of the cellular HgCl2 treatment, i.e., the cells were pre-incubated with different concentrations of HgCl2 before staining with His-NMI-Bu. Precisely, 5 µM and 10 µM of HgCl2 concentration were maintained for the incubation period of 30 min. The cells were imaged and subsequently compared with the Hg2+-untreated one. Maintaining consistency with our spectroscopic findings, a significant drop in the fluorescence signal could be observed with increasing concentration of Hg2+ (Figure S21a–i). The corresponding DIC images confirm that cellular morphology was intact and hence the incubating concentration of Hg2+ was non-cytotoxic for the said period. Therefore, we can conclude that the probe can be regarded as an efficient tool to detect lysosomal mercury levels.

4. Conclusions

In summary, we have developed a new histidine and butylamine-conjugated NMI probe showing an intense greenish-yellow emission in solution. The probe holds ICT characteristics in solution as validated by solvent polarity-dependent spectroscopic studies and computational investigation. The probe selectively detects the toxic mercury ion by exhibiting fluorescence quenching in solution with LOD 0.52 μM and binding constant value in the order of 106 M−1. The high selectivity of the probe for the mercury ion is also accessed from the selectivity assay with other metal ions. The filter paper-based sensory system is developed for its practical application depicting the sensing of Hg2+ at micromolar concentration. The notable stability of the probe over a wide pH range (5–10) becomes useful for live cell imaging studies. The probe demonstrates exclusive lysosomal localization inside the cellular system which has added an advantage to studying the detection of mercury ions inside lysosomes. After treatment of the probe with HgCl2 inside the lysosome, weak emission was perceived from the lysosomes as a consequence of the accumulation of Hg2+. This outcome substantiates the potential of the probe to monitor the level of mercury ions by taking advantage of the fluorescence technique inside the subcellular organelle.

Supplementary Materials

The following supporting information can be downloaded at: https://www.mdpi.com/article/10.3390/chemosensors11030184/s1. Figure S1: 1H NMR spectrum of His-NMI-Br in DMSO-d6 recorded at 500 MHz; Figure S2: 13C NMR spectrum of His-NMI-Br in DMSO-d6 recorded at 126 MHz; Figure S3: 1H NMR spectrum of His-NMI-Bu in DMSO-d6 recorded at 500 MHz; Figure S4: 13C NMR spectrum of His-NMI-Bu in DMSO-d6 recorded at 126 MHz; Figure S5: ESI mass spectrum of His-NMI-Br; Figure S6: APCI mass spectrum of His-NMI-Bu; Figure S7: (a) UV–Vis. absorption spectra of probe His-NMI-Bu as a function of concentration in DMSO (b) Plot for absorbance at 446 nm vs. concentration of His-NMI-Bu in DMSO; Figure S8: (a) Fluorescence spectra of probe His-NMI-Bu as a function of concentration in DMSO (b) Plot for fluorescence intensity at 540 nm vs. concentration of His-NMI-Bu in DMSO. Table S1: Summarization of photophysical data of His-NMI-Bu measured in different solvents; Table S2: Radiative and non-radiative decay rates for probe in two solvents; Figure S9: Fluorescence kinetics of probe His-NMI-Bu (10 μM) in MES buffer; Figure S10: Molecular electrostatic potential map for compound His-NMI-Br; Table S3: Calculated energies of Kohn–Sham molecular orbitals (MO) of His-NMI-Br using DFT at the B3LYP/LANL2DZ level of theory; Figure S11: Molecular electrostatic potential map for compound His-NMI-Bu; Table S4: Calculated energies of Kohn–Sham molecular orbitals (MO) of His-NMI-Bu using DFT at the B3LYP/LANL2DZ level of theory; Figure S12: Molecular electrostatic potential map for compound His-NMI-Bu + Hg2+; Table S5: Calculated energies of Kohn–Sham molecular orbitals (MO) of His-NMI-Bu + Hg2+ using DFT at the CAM-B3LYP/LANL2DZ level of theory; Figure S13: Job’s plot for His-NMI-Bu with HgCl2 in MES buffer at pH 6.2; Figure S14: Fitted plot of fluorescence intensity as a function of Hg2+ concentration; Figure S15: Comparison of 1H NMR spectra between probe only and probe + Hg2+ complex in DMSO-d6 recorded at 500 MHz. Figure S16: ESI mass spectrum of His-NMI-Bu-Hg complex; Figure S17: Plot of I0/I vs. concentration of Hg2+ derived from concentration-dependent fluorescence study in MES buffer; Figure S18: (a) Time-resolved fluorescence decay of His-NMI-Bu with HgCl2 of different concentration in MES buffer (b) Plot for average lifetime vs. concentration of Hg2+ in MES buffer; Table S6: Detailed fluorescence lifetime values with contribution of components in MES buffer; Figure S19: MTT assay showing cell viability in the presence of probe His-NMI-Bu (0–50 μM); Figure S20: Confocal live cell colocalization experiments in Hela cells; Figure S21: CLSM images of live BHK-21 cells showing the intracellular response of Hg2+.

Author Contributions

Conceptualization, R.R. and A.L.K.; methodology, R.R., S.N. and T.D.; software, R.R. and T.D.; validation, R.R., S.N., T.D. and A.L.K.; formal analysis, R.R. and T.D.; investigation, R.R., S.N. and T.D.; resources, A.L.K.; data curation, R.R., T.D. and A.L.K.; writing—original draft preparation, R.R. and T.D.; writing—review and editing, R.R., T.D. and A.L.K.; visualization, R.R. and T.D.; supervision, A.L.K.; project administration, A.L.K.; funding acquisition, A.L.K. All authors have read and agreed to the published version of the manuscript.

Funding

IISER Bhopal for research funding and research fellowship for R.R. and T.D.

Institutional Review Board Statement

Not applicable.

Informed Consent Statement

Not applicable.

Data Availability Statement

Upon request, data will be available from the authors.

Acknowledgments

R.R. and T.D. acknowledge IISER Bhopal for their doctoral fellowships. The authors thank IISER Bhopal for financial and infrastructural support. We highly acknowledge Anup Pramanik for his insightful suggestions in computational studies.

Conflicts of Interest

The authors declare no conflict of interest.

References

  1. Bernhoft, R.A. Mercury toxicity and treatment: A review of the literature. J. Environ. Public Health 2012, 2012, 460508. [Google Scholar] [CrossRef] [PubMed]
  2. Rice, K.M.; Walker, E.M., Jr.; Wu, M.; Gillette, C.; Blough, E.R. Environmental mercury and its toxic effects. J. Prev. Med. Public Health 2014, 47, 74–83. [Google Scholar] [CrossRef] [PubMed]
  3. Fernandes Azevedo, B.; Barros Furieri, L.; Peçanha, F.M.; Wiggers, G.A.; Frizera Vassallo, P.; Ronacher Simões, M.; Fiorim, J.; Rossi de Batista, P.; Fioresi, M.; Rossoni, L.; et al. Toxic effects of mercury on the cardiovascular and central nervous systems. J. Biomed. Biotechnol. 2012, 2012, 949048. [Google Scholar] [CrossRef] [Green Version]
  4. Udhayakumari, D. Review on fluorescent sensors-based environmentally related toxic mercury ion detection. J. Incl. Phenom. Macrocycl. Chem. 2022, 102, 451–476. [Google Scholar] [CrossRef]
  5. Ratner, N.; Mandler, D. Electrochemical Detection of Low Concentrations of Mercury in Water Using Gold Nanoparticles. Anal. Chem. 2015, 87, 5148–5155. [Google Scholar] [CrossRef] [PubMed]
  6. Kalate Bojdi, M.; Behbahani, M.; Omidi, F.; Hesam, G. Application of a novel electrochemical sensor based on modified siliceous mesocellular foam for electrochemical detection of ultra-trace amounts of mercury ions. New J. Chem. 2016, 40, 4519–4527. [Google Scholar] [CrossRef]
  7. Hsu, I.H.; Hsu, T.-C.; Sun, Y.-C. Gold-nanoparticle-based graphite furnace atomic absorption spectrometry amplification and magnetic separation method for sensitive detection of mercuric ions. Biosens. Bioelectron. 2011, 26, 4605–4609. [Google Scholar] [CrossRef]
  8. Chen, H.; Chen, J.; Jin, X.; Wei, D. Determination of trace mercury species by high performance liquid chromatography–inductively coupled plasma mass spectrometry after cloud point extraction. J. Hazard. Mater. 2009, 172, 1282–1287. [Google Scholar] [CrossRef]
  9. Suvarapu, L.N.; Seo, Y.-K.; Baek, S.-O. Speciation and determination of mercury by various analytical techniques. J. Anal. Methods Chem. 2013, 32, 225–245. [Google Scholar] [CrossRef]
  10. Thirumalai, M.; Kumar, S.N.; Prabhakaran, D.; Sivaraman, N.; Maheswari, M.A. Dynamically modified C18 silica monolithic column for the rapid determinations of lead, cadmium and mercury ions by reversed-phase high-performance liquid chromatography. J. Chromatogr. A 2018, 1569, 62–69. [Google Scholar] [CrossRef]
  11. Yuan, Y.; Wu, Y.; Wang, H.; Tong, Y.; Sheng, X.; Sun, Y.; Zhou, X.; Zhou, Q. Simultaneous enrichment and determination of cadmium and mercury ions using magnetic PAMAM dendrimers as the adsorbents for magnetic solid phase extraction coupled with high performance liquid chromatography. J. Hazard. Mater. 2020, 386, 121658. [Google Scholar] [CrossRef] [PubMed]
  12. Carter, K.P.; Young, A.M.; Palmer, A.E. Fluorescent Sensors for Measuring Metal Ions in Living Systems. Chem. Rev. 2014, 114, 4564–4601. [Google Scholar] [CrossRef] [PubMed]
  13. Meher, N.; Barman, D.; Parui, R.; Iyer, P.K. Recent development of the fluorescence-based detection of volatile organic compounds: A mechanistic overview. J. Mater. Chem. C 2022, 10, 10224–10254. [Google Scholar] [CrossRef]
  14. Biswas, S.; Sharma, V.; Kumar, P.; Koner, A.L. Selective sensing of lysosomal iron(III) via three-component fluorescence-based strategy in living cells. Sens. Actuators B Chem. 2018, 260, 460–464. [Google Scholar] [CrossRef]
  15. Parambil, A.R.U.; Kavyashree, P.; Silswal, A.; Koner, A.L. Water-soluble optical sensors: Keys to detect aluminium in biological environment. RSC Adv. 2022, 12, 13950–13970. [Google Scholar] [CrossRef]
  16. Dey, N. An anthraimidazoledione-based charge transfer probe for dual mode sensing of calcium ions: Role of the counter ion in signal improvement. J. Mater. Chem. B 2023, 11, 1222–1231. [Google Scholar] [CrossRef]
  17. Sudheesh, K.V.; Joseph, M.M.; Philips, D.S.; Samanta, A.; Kumar Maiti, K.; Ajayaghosh, A. pH-Controlled Nanoparticles Formation and Tracking of Lysosomal Zinc Ions in Cancer Cells by Fluorescent Carbazole–Bipyridine Conjugates. ChemistrySelect 2018, 3, 2416–2422. [Google Scholar] [CrossRef]
  18. Shuai, H.; Xiang, C.; Qian, L.; Bin, F.; Xiaohui, L.; Jipeng, D.; Chang, Z.; Jiahui, L.; Wenbin, Z. Fluorescent sensors for detection of mercury: From small molecules to nanoprobes. Dyes Pigm. 2021, 187, 109125. [Google Scholar] [CrossRef]
  19. Chen, S.-Y.; Li, Z.; Li, K.; Yu, X.-Q. Small molecular fluorescent probes for the detection of lead, cadmium and mercury ions. Coord. Chem. Rev. 2021, 429, 213691. [Google Scholar] [CrossRef]
  20. Singha, S.; Jun, Y.W.; Sarkar, S.; Ahn, K.H. An Endeavor in the Reaction-Based Approach to Fluorescent Probes for Biorelevant Analytes: Challenges and Achievements. Acc. Chem. Res. 2019, 52, 2571–2581. [Google Scholar] [CrossRef] [PubMed]
  21. Deng, M.; Gong, D.; Han, S.-C.; Zhu, X.; Iqbal, A.; Liu, W.; Qin, W.; Guo, H. BODIPY based phenylthiourea derivatives as highly selective MeHg+ and Hg2+ ions fluorescent chemodosimeter and its application to bioimaging. Sens. Actuators B Chem. 2017, 243, 195–202. [Google Scholar] [CrossRef]
  22. Yang, H.; Han, C.; Zhu, X.; Liu, Y.; Zhang, K.Y.; Liu, S.; Zhao, Q.; Li, F.; Huang, W. Upconversion Luminescent Chemodosimeter Based on NIR Organic Dye for Monitoring Methylmercury In Vivo. Adv. Funct. Mater. 2016, 26, 1945–1953. [Google Scholar] [CrossRef]
  23. Nolan, E.M.; Lippard, S.J. Tools and Tactics for the Optical Detection of Mercuric Ion. Chem. Rev. 2008, 108, 3443–3480. [Google Scholar] [CrossRef] [PubMed]
  24. Pal, K.; Dutta, T.; Koner, A.L. An Enumerated Outlook of Intracellular Micropolarity Using Solvatochromic Organic Fluorescent Probes. ACS Omega 2021, 6, 28–37. [Google Scholar] [CrossRef] [PubMed]
  25. Trivedi, P.C.; Bartlett, J.J.; Pulinilkunnil, T. Lysosomal Biology and Function: Modern View of Cellular Debris Bin. Cells 2020, 9, 1131. [Google Scholar] [CrossRef] [PubMed]
  26. Saftig, P.; Klumperman, J. Lysosome biogenesis and lysosomal membrane proteins: Trafficking meets function. Nat. Rev. Mol. Cell Biol. 2009, 10, 623–635. [Google Scholar] [CrossRef]
  27. Bonam, S.R.; Wang, F.; Muller, S. Lysosomes as a therapeutic target. Nat. Rev. Drug Discov. 2019, 18, 923–948. [Google Scholar] [CrossRef] [Green Version]
  28. Silswal, A.; Kanojiya, A.; Koner, A.L. A Fluorogenic Far Red-Emitting Molecular Viscometer for Ascertaining Lysosomal Stress in Live Cells and Caenorhabditis elegans. Front. Chem. 2022, 10, 72. [Google Scholar] [CrossRef]
  29. Sun, A. Lysosomal storage disease overview. Ann. Transl. Med. 2018, 6, 476. [Google Scholar] [CrossRef]
  30. Ballabio, A.; Gieselmann, V. Lysosomal disorders: From storage to cellular damage. Biochim. Biophys. Acta—Mol. Cell Res. 2009, 1793, 684–696. [Google Scholar] [CrossRef] [Green Version]
  31. Zhang, Z.; Yue, P.; Lu, T.; Wang, Y.; Wei, Y.; Wei, X. Role of lysosomes in physiological activities, diseases, and therapy. J. Hematol. Oncol. 2021, 14, 79. [Google Scholar] [CrossRef] [PubMed]
  32. Lim, C.-Y.; Zoncu, R. The lysosome as a command-and-control center for cellular metabolism. J. Cell Biol. 2016, 214, 653–664. [Google Scholar] [CrossRef] [Green Version]
  33. Platt, F.M.; Boland, B.; van der Spoel, A.C. Lysosomal storage disorders: The cellular impact of lysosomal dysfunction. J. Cell Biol. 2012, 199, 723–734. [Google Scholar] [CrossRef] [Green Version]
  34. Saffi, G.T.; Tang, E.; Mamand, S.; Inpanathan, S.; Fountain, A.; Salmena, L.; Botelho, R.J. Reactive oxygen species prevent lysosome coalescence during PIKfyve inhibition. PLoS ONE 2021, 16, e0259313. [Google Scholar] [CrossRef]
  35. Sulak, M.; Kursunlu, A.N.; Girgin, B.; Karakuş, Ö.Ö.; Güler, E. A highly selective fluorescent sensor for mercury (II) ion based on Bodipy and Calix[4]arene bearing triazolenaphthylene groups; synthesis and photophysical investigations. J. Photochem. Photobiol. A Chem. 2017, 349, 129–137. [Google Scholar] [CrossRef]
  36. Zhang, Y.; Chen, H.; Chen, D.; Wu, D.; Chen, Z.; Zhang, J.; Chen, X.; Liu, S.; Yin, J. A colorimetric and ratiometric fluorescent probe for mercury (II) in lysosome. Sens. Actuators B Chem. 2016, 224, 907–914. [Google Scholar] [CrossRef]
  37. Ding, J.; Li, H.; Wang, C.; Yang, J.; Xie, Y.; Peng, Q.; Li, Q.; Li, Z. “Turn-On” Fluorescent Probe for Mercury(II): High Selectivity and Sensitivity and New Design Approach by the Adjustment of the π-Bridge. ACS Appl. Mater. Interfaces 2015, 7, 11369–11376. [Google Scholar] [CrossRef] [PubMed]
  38. Lei, S.; Meng, X.; Wang, L.; Zhou, J.; Qin, D.; Duan, H. A Naphthalimide-Based Fluorescent Probe for the Detection and Imaging of Mercury Ions in Living Cells. ChemistryOpen 2021, 10, 1116–1122. [Google Scholar] [CrossRef]
  39. Li, X.-H.; Han, X.-F.; Wu, W.-N.; Wang, Y.; Fan, Y.-C.; Zhao, X.-L.; Xu, Z.-H. Simple thiosemicarbazone “switch” sensing of Hg2+ and biothiols in pure aqueous solutions and application to imaging in lysosomes. J. Mol. Struct. 2022, 1250, 131811. [Google Scholar] [CrossRef]
  40. Yuan, B.; Wang, D.-X.; Zhu, L.-N.; Lan, Y.-L.; Cheng, M.; Zhang, L.-M.; Chu, J.-Q.; Li, X.-Z.; Kong, D.-M. Dinuclear HgII tetracarbene complex-triggered aggregation-induced emission for rapid and selective sensing of Hg2+ and organomercury species. Chem. Sci. 2019, 10, 4220–4226. [Google Scholar] [CrossRef] [Green Version]
  41. Weil, T.; Vosch, T.; Hofkens, J.; Peneva, K.; Müllen, K. The Rylene Colorant Family—Tailored Nanoemitters for Photonics Research and Applications. Angew. Chem. Int. Ed. 2010, 49, 9068–9093. [Google Scholar] [CrossRef] [PubMed]
  42. Gopikrishna, P.; Meher, N.; Iyer, P.K. Functional 1,8-Naphthalimide AIE/AIEEgens: Recent Advances and Prospects. ACS Appl. Mater. Interfaces 2018, 10, 12081–12111. [Google Scholar] [CrossRef] [PubMed]
  43. Mukherjee, S.; Thilagar, P. Insights into the AIEE of 1,8-Naphthalimides (NPIs): Inverse Effects of Intermolecular Interactions in Solution and Aggregates. Chem. Eur. J. 2014, 20, 8012–8023. [Google Scholar] [CrossRef]
  44. Biswas, S.; Dutta, T.; Silswal, A.; Bhowal, R.; Chopra, D.; Koner, A.L. Strategic engineering of alkyl spacer length for a pH-tolerant lysosome marker and dual organelle localization. Chem. Sci. 2021, 12, 9630–9644. [Google Scholar] [CrossRef]
  45. Banerjee, S.; Veale, E.B.; Phelan, C.M.; Murphy, S.A.; Tocci, G.M.; Gillespie, L.J.; Frimannsson, D.O.; Kelly, J.M.; Gunnlaugsson, T. Recent advances in the development of 1,8-naphthalimide based DNA targeting binders, anticancer and fluorescent cellular imaging agents. Chem. Soc. Rev. 2013, 42, 1601–1618. [Google Scholar] [CrossRef] [Green Version]
  46. Sheng, Y.; Ma, J.; Liu, S.; Wang, Y.; Zhu, C.; Cheng, Y. Strong and Reversible Circularly Polarized Luminescence Emission of a Chiral 1,8-Naphthalimide Fluorophore Induced by Excimer Emission and Orderly Aggregation. Chem. Eur. J. 2016, 22, 9519–9522. [Google Scholar] [CrossRef]
  47. Do, T.T.; Pham, H.D.; Manzhos, S.; Bell, J.M.; Sonar, P. Molecular Engineering Strategy for High Efficiency Fullerene-Free Organic Solar Cells Using Conjugated 1,8-Naphthalimide and Fluorenone Building Blocks. ACS Appl. Mater. Interfaces 2017, 9, 16967–16976. [Google Scholar] [CrossRef] [Green Version]
  48. Masimukku, N.; Gudeika, D.; Volyniuk, D.; Bezvikonnyi, O.; Simokaitiene, J.; Matulis, V.; Lyakhov, D.; Azovskyi, V.; Gražulevičius, J.V. Bipolar 1,8-naphthalimides showing high electron mobility and red AIE-active TADF for OLED applications. Phys. Chem. Chem. Phys. 2022, 24, 5070–5082. [Google Scholar] [CrossRef] [PubMed]
  49. Mahato, S.K.; Bhattacherjee, D.; Bhabak, K.P. The biothiol-triggered organotrisulfide-based self-immolative fluorogenic donors of hydrogen sulfide enable lysosomal trafficking. Chem. Commun. 2020, 56, 7769–7772. [Google Scholar] [CrossRef]
  50. Verma, M.; Kaur, N.; Singh, N. Naphthalimide-Based DNA-Coupled Hybrid Assembly for Sensing Dipicolinic Acid: A Biomarker for Bacillus anthracis Spores. Langmuir 2018, 34, 6591–6600. [Google Scholar] [CrossRef]
  51. Dong, H.-Q.; Wei, T.-B.; Ma, X.-Q.; Yang, Q.-Y.; Zhang, Y.-F.; Sun, Y.-J.; Shi, B.-B.; Yao, H.; Zhang, Y.-M.; Lin, Q. 1,8-Naphthalimide-based fluorescent chemosensors: Recent advances and perspectives. J. Mater. Chem. C 2020, 8, 13501–13529. [Google Scholar] [CrossRef]
  52. Yu, H.; Guo, Y.; Zhu, W.; Havener, K.; Zheng, X. Recent advances in 1,8-naphthalimide-based small-molecule fluorescent probes for organelles imaging and tracking in living cells. Coord. Chem. Rev. 2021, 444, 214019. [Google Scholar] [CrossRef]
  53. Dai, Z.-R.; Ge, G.-B.; Feng, L.; Ning, J.; Hu, L.-H.; Jin, Q.; Wang, D.-D.; Lv, X.; Dou, T.-Y.; Cui, J.-N.; et al. A Highly Selective Ratiometric Two-Photon Fluorescent Probe for Human Cytochrome P450 1A. J. Am. Chem. Soc. 2015, 137, 14488–14495. [Google Scholar] [CrossRef] [PubMed]
  54. Kumar, P.; Biswas, S.; Koner, A.L. Fast tyrosinase detection in early stage melanoma with nanomolar sensitivity using a naphthalimide-based fluorescent read-out probe. New J. Chem. 2020, 44, 10771–10775. [Google Scholar] [CrossRef]
  55. Silswal, A.; Weslie, P.; Koner, A.L. Bioimaging of labile lysosomal iron through naphthalimide-based fluorescent probe. Talanta 2023, 254, 124147. [Google Scholar] [CrossRef]
  56. Frisch, M.J.; Trucks, G.W.; Schlegel, H.B.; Scuseria, G.E.; Robb, M.A.; Cheeseman, J.R.; Scalmani, G.; Barone, V.; Petersson, G.A.; Nakatsuji, H.; et al. Gaussian 16 Rev. C.01; Gaussian Inc.: Wallingford, CT, USA, 2016. [Google Scholar]
Scheme 1. Schematic illustration of detection of mercury and lysosomal imaging using His-NMI-Bu fluoroprobe.
Chemosensors 11 00184 sch001
Scheme 2. Synthesis of the fluoroprobe His-NMI-Bu.
Chemosensors 11 00184 sch002
Figure 1. (a) Absorption, emission, and excitation spectra of the probe in DMSO, superimposition of absorption and excitation spectra representing the optical purity, inset shows cuvette images under daylight and UV light illumination; solvent-dependent (b) absorption and (c) emission spectra of the probe (10 μM) (d) time-resolved fluorescence decay of the probe measured in different solvents.
Chemosensors 11 00184 g001
Figure 2. Schematic diagram illustrating the FMOs distribution and band gap energy for His-NMI-Br, His-NMI-Bu, and His-NMI-Bu + Hg2+ complex.
Chemosensors 11 00184 g002
Figure 3. (a) Absorption and (b) emission spectra of the probe His-NMI-Bu in buffer solutions with different pH; inset graph representing the change in absorbance at 450 nm and intensity at 560 nm while changing the pH of the solutions.
Chemosensors 11 00184 g003
Figure 4. (a) Concentration-dependent fluorescence spectra of probe His-NMI-Bu (10 μM) with HgCl2 in 10 mM MES buffer of pH = 6.2 (b) graph representing the change in intensity vs. concentration of Hg2+ in MES buffer; inset image illustrating the change in emission color of the solution after addition of HgCl2 (c) fluorescence kinetics of probe (10 μM) with HgCl2 (0.25–20 equiv.) in MES buffer (pH 6.2) (d) bar diagram representing relative fluorescence quenching upon addition of different biologically important metal ions (100 μM) in MES buffer. The black bars denote the standard deviation. Inset vials image showing fluorescence change in the solution upon addition of different metal ions in MES buffer captured under UV illumination (365 nm).
Chemosensors 11 00184 g004
Figure 5. Solid-state (a) UV–Vis. absorption and (b) emission spectra of His-NMI-Bu; insets show the images of the solid sample (powder) under daylight and UV light illumination (c) representation of emission color change in the filter papers before and after the addition of HgCl2 dissolved in Milli-Q H2O with different concentrations. Left: probe only and right: probe + HgCl2.
Chemosensors 11 00184 g005
Figure 6. Confocal live cell colocalization experiments in BHK-21 cells. (a,e,i) show the FITC channel images (λex = 488 nm, λem = 500–540 nm) stained with 5 µM His-NMI-Bu; (b,f,j) show TRITC channel images (λex = 561 nm, λem = 570–630 nm) stained with 0.3 µM LysoTracker Red, ER Tracker Red, and MitoTracker Red, respectively; (c,g,k) show the corresponding merge images; (d,h,l) shows the scatter plot to obtain the respective Pearson’s correlation coefficients.
Chemosensors 11 00184 g006
Figure 7. CLSM images of live BHK-21 cells showing the intracellular sensing response of Hg2+. Left panel (a,d,g) shows the DIC images; middle panel (b,e,h) shows FITC channel images (λex = 488 nm, λem = 500–540 nm) of cells stained with 5 µM His-NMI-Bu; right panel (c,f,i) shows the corresponding merge images. After dye staining, the cells were treated with 10 µM HgCl2 and imaged after 10 min and 20 min (di). The gradual decrease in fluorescence intensity confirms the detection of Hg2+ inside the lysosomal compartment.
Chemosensors 11 00184 g007
Disclaimer/Publisher’s Note: The statements, opinions and data contained in all publications are solely those of the individual author(s) and contributor(s) and not of MDPI and/or the editor(s). MDPI and/or the editor(s) disclaim responsibility for any injury to people or property resulting from any ideas, methods, instructions or products referred to in the content.

