Abstract
In recent years, pollution incidents caused by red tide occur frequently, and the red tide biotoxins brought by it make the food safety problem of seafood become a difficult problem to be solved urgently, which has caused great damage to the mariculture industry. Red tide toxin is also known as “shellfish toxin”. Saxitoxin (STX), is one of the strongest paralytic shellfish toxins and is also one of the most toxic marine toxins, which is extremely harmful. Aiming at the problems existing in the current research on the detection of red tide biotoxin in complex water bodies, this research developed an aptamer sensor based on hybrid chain reaction and a CRISPR-Cas9 gene editing system to detect the toxins of the clam and analyzed the feasibility of this method for the detection of the toxins of the clam. The results showed that the linear range of this method is 5.0 fM to 50 pM, and the detection limit is 1.2 fM. Meanwhile, the recovery rate of this sensor for the detection of toxins is 102.4–104.1% when applied in shellfish extract, which shows significant specificity and the reliability of this detection method.
1. Introduction
Since the 20th century, red tides have erupted frequently around the world. Biotoxins produced by red tide organisms have not only seriously damaged marine fishery resources and aquaculture, and worsened the marine environment, but also could be transmitted to the upper layer through the food chain, directly affecting the food safety of marine products [1]. The formation of red tide biotoxin is closely related to the red tide of toxic algae in the sea and belongs to marine natural organic matter [2]. Therefore, the early screening of marine products, water sources, etc., and the efficient and accurate detection of various marine biotoxins have become the key link in the prevention of marine biotoxin poisoning [3]. The eutrophication of water leads to the excessive reproduction of algae in the water. Shellfish filter the toxic microalgae, and after bioaccumulation and amplification, they are transformed into shellfish toxins. Therefore, red tide toxins, are also known as “shellfish toxins” [4]. According to the symptoms caused by the toxins they produce, marine biotoxins can be divided into the following categories: diarrheal shellfish poisoning (DSP), paralytic shellfish poisoning (PSP), neurotoxic shellfish poisoning (NSP), and amnesic shellfish poisoning (ASP), azaspiracid shellfish poisoning (AZP), ciguatera fish poisoning (CFP) and other toxins [5]. Paralytic shellfish poisoning (PSP) is a kind of marine toxin with the widest distribution, the highest frequency, and the greatest harm in the world that is formed by the metabolism of marine poisonous flagellates. Its toxicology is mainly to inhibit nerve conduction through the influence of the sodium channel [6]. When people ingest food containing the paralytic shellfish toxin, the toxin will be released rapidly and present toxic effects. The incubation period is only a few minutes or hours. Symptoms include limb muscle paralysis, headaches, and nausea. In severe cases, muscle paralysis, dyspnea, and even asphyxia lead to death [7].
Saxitoxin (STX) is one of the most powerful paralytic shellfish poisonings and also one of the most toxic marine toxins [8]. It can accumulate in bivalves and fiber fish through fiber filtration, thus entering the food chain. When the toxin content exceeds the safety standard, human consumption of such shellfish products often produces the risk of poisoning [9]. The oral lethal dose for humans is 5.7 mg kg−1, therefore approximately 0.57 mg of saxitoxin is lethal if ingested, and the lethal dose by injection is about 0.6 mg kg−1. The human inhalation toxicity of aerosolized saxitoxin is estimated to be 5 mg min m−3. It is suggested that saxitoxin can enter the body via open wounds, and a lethal dose is 50 mg per person by this route [10].
At present, the conventional methods used for the detection of marine red tide toxins mainly include biological and chemical methods [11]. Biological detection can detect various algal toxins through the biological monitoring of mice. This method has obvious disadvantages, for example, it can only measure the toxicity of the toxin, but cannot determine its composition and content. Chemical detection is to know the type and toxicity of toxins through the qualitative and quantitative analysis of the toxin components in the samples [12]. Among them, enzyme-linked immunoassay is a widely used immunoassay, which is widely used in the monitoring of red tide toxins, such as PSP, DSP, NSP, and other biotoxins. However, due to the cross-reaction of antibodies, lack of standard toxins, interference of analogs, and other factors, using these methods may occur false positive results [13]. In recent years, instrumental analysis has been widely used because of its sensitivity, accuracy, and rapidity, such as HPLC chromatography, is one of the most widely used analysis methods of red tide biotoxin, with high accuracy, low detection limit, and fewer samples used [14]. UV or fluorescence detectors are usually required for HPLC detection. Due to the lack of UV chromogenic groups in many toxins and the lack of standard samples of red tide biotoxins, the development of HPLC is greatly limited [15]. Liquid chromatography–tandem mass spectrometry (LC-MS/MS) is a relatively new detection technology that combines the advantages of chromatography and mass spectrometry. This method first uses chromatography to separate compounds and then uses mass spectrometry to detect them [16]. Compared with HPLC analysis, LC-MS/MS has no complex derivation and sample purification process and can detect a wider range with a lower detection limit. However, there are some challenges in this method, such as complex pre-treatments, and so on. Capillary electrophoresis (CE) technology is actually a new type of detection technology that combines electrophoresis and chromatography [17]. The above detection methods have many shortcomings, and a new detection method needs to be developed urgently.
Biosensor is a new biological analysis and detection method that combines biotechnology and electronic technology [18]. In comparison to the commonly used chemical and biological analysis methods, this method can accurately quantify, has low sample purity requirements, saves sample pretreatment time, reduces detection cost, and effectively improves the laboratory’s detection ability [19]. In addition, it also has good sensitivity and specificity, is easy to operate, achieves miniaturization, and has other advantages. Therefore, the application of biosensors to the detection of marine toxins has attracted more and more attention [20,21]. In recent years, with the rapid development of biotechnology, material science, and nanotechnology, and the emergence of technologies such as the systematic evolution of ligands by exponential enrichment (SELEX), biosensors have made great progress in both their theoretical basis and their design and processing [22]. By using this technology, one can select a specific nucleic acid aptamer (aptamer) with a high affinity for the target substance from the random single-stranded nucleic acid sequence library [23]. The nucleic acid aptamer can bind with a variety of target substances with high specificity and selectivity after being screened and enriched by SELEX and can have the same sensitivity as an antigen–antibody reaction, so it is widely used in the field of biosensors [24]. At the same time, aptamers also have some very obvious advantages, as follows: (1) low cost, short cycle, and easy access, (2) easy to modify, (3) it has good stability and good thermal and chemical properties, (4) strong specificity compounds with very similar chemical structures can be identified, (5) it has a small molecular weight, strong tissue penetration, and good biocompatibility, which are conducive to its fixation on the surface of the sensor [25,26]. Because of these advantages, more and more studies on aptamers have been carried out in recent years, including in disease diagnosis, drug research and development, biochips, and food detection [27,28]. Therefore, a nucleic acid aptamer biosensor has been rapidly developed in recent years as a new method for detecting shellfish toxins [29,30].
The hybridization chain reaction (HCR) has attracted increasing attention because it can occur under mild conditions without the use of enzymes. In a typical HCR, the initiator triggers a cascade of hybridization events between two species of DNA hairpins, leading to the formation of a nicked double helix with tens to hundreds of repeated units until the hairpins are exhausted [31]. As a powerful signal amplification tool, HCR has been used to construct a variety of simple, sensitive, and economical biosensors for detecting nucleic acids, small molecules, cells, and proteins [32]. The characteristics of HCR, such as no enzyme and constant temperature, enable the whole reaction process to be completed through simple instruments, thus reducing the experimental cost [33]. In addition, HCR has high sensitivity and specificity and specificity and has high compatibility with a variety of detection technologies. These advantages make it play an increasingly important role in the construction of biosensors [34,35].
Clustered regularly interspaced short palindromic repeats (CRISPR) regular clusters of spaced short palindromic repeats and CRISPR associated (Cas) form a system, which is a natural defense system used by bacteria to prevent bacteriophage DNA injection and plasmid transfer [36]. In 2012, the group of Doudna J A and Charpentier E demonstrated for the first time that CRISPR-Cas9 can recognize and cleave target DNA in vitro [37]. The natural CRISPR-Cas9 system is composed of three parts: SpCas9 (hereinafter referred to as Cas9), crRNA, and CRISPR RNA (tracrRNA) [38]. The crRNA is homologous with the target duplex DNA sequence and is partially complementary to the tracrRNA to form a complex protein, guiding the Cas9 protein to recognize and cut the target duplex at specific sites. The key to achieve this is the existence of a protospacer adjacent motif (PAM) sequence on the DNA chain for the binding process to proceed smoothly [36,39,40]. To simplify the process of gene editing, crRNA and tracrRNA are usually integrated into a single guide RNA (sgRNA) to identify the target duplexes [39]. The PAM sequence is located upstream of the DNA binding region and immediately adjacent to the binding region. The sequence is composed of NGG3 bases, of which the type of the first base can be freely changed, but the last two bases must be guanine. The modified CRISPR-Cas9 system has become an important tool for researchers in gene editing [41,42]. The target sites for CRISPR-Cas9 system cutting are predetermined by sgRNA sequences to achieve more precise cutting, and the cutting sequence is more flexible due to different sgRNA designs. The CRISPR-Cas9 system has been gradually developed as a new biosensor tool with its advantages of low cost, convenient operation, high efficiency, strong specificity, and other advantages. Incorporating CRISPR-Cas systems with various nucleic acid amplification strategies enables the generation of amplified detection signals, enrichment of low-abundance molecular targets, and improvements in analytical specificity and sensitivity [43]. This detection system will have great application prospects in disease diagnosis, environmental assessment, rapid food quality assessment, environmental monitoring, and other fields [44].
Biosensors for detection based on nucleic acid isothermal amplification technology and CRISPR-Cas system have been reported, such as strand displacement amplification (SDA), rolling circle amplification (RCA), and loop-mediated isothermal amplification (LAMP) [45,46,47,48]. However, a number of biosensors have been reported for the detection of nucleic acid targets. The establishment of efficient methods for non-nucleic acid target detection would further broaden the scope of this technique, but up to now, the concerning research is limited. Based on the above research, this research will aim at the problems existing in the current research on the detection of red tide biotoxins in complex water bodies, and use the isothermal amplification technology and gene editing system to prepare an aptamer sensor based on the hybridization chain reaction and CRISPR-Cas9 system to detect the toxins in the clam, so as to realize the highly sensitive detection of micro or trace red tide toxins in complex biological systems and marine environments, which is a research system of great research value.
2. Materials and Methods
2.1. Materials
All oligonucleotides were commercially synthesized by Sangon Biotech Co., Ltd. (Shanghai, China). Other sequences were listed in Table 1. Magnetic beads (MBs) were purchased from So-Fe Biomedicine (Shanghai, Beijing). Saxitoxin (STX), okadaic acid (OA), yessotoxin (YTX), and pectenotoxin (PTX) standards were purchased from National Research Council of Canada (Ottawa, Canada). Cas9 nuclease was purchased from New England Biolabs (Beijing, China) Ltd. N-(3-Dimethylaminopropyl)-N′-ethylcarbodiimide hydrochloride (EDC), and N-Hydroxysulfosuccinimide sodium salt (NHS) were purchased from Shanghai Yuanye Bio-Technology Co., Ltd. (Shanghai, China).

Table 1.
DNAs in this paper.
2.2. Instrumentation
F-4600 fluorescence spectrophotometer (Hitachi, Japan); PB-10 acidity (sartorius, Beijing, China); KQ218 Ultrasonic cleaner (Kunshan, China); LX-200 Mini centrifuge (Haimen Qer); VM-10 vortex oscillator (Beijing Plichi); WD-9413B gel imaging analyzer (Beijing Liuyi Biotechnology Co., Ltd.); High-speed frozen centrifuge (Zhuhai dark horse); PCR gene amplifier (Shandong Biologix Biotech Co., Ltd.); electrophoresis instrument, electrophoresis tank (Beijing Liuyi Biotechnology Co., Ltd.); nanoparticle potentiometer (Malvern, UK).
2.3. Preparation of MBs Aptasensor
Firstly, 2 μM S1 (aptamer sequence) and 2 μM S2 (aptamer complementary sequence) were mixed in PBS annealing buffer (0.1 M, pH = 7.4), placed in a PCR gene amplifier, set to 90 °C for 5 min and 65 °C for 10 min, then gradually cooled to room temperature and stored at 4 °C in a refrigerator for storage.
Next, carboxy-modified magnetic beads were sonicated for 3–5 min, taken to 80 microliters in centrifuge tubes, washed three times with 300 μL imidazole–HCl buffer solution (0.1 mM, pH = 6.8), then added 100 μL NHS (0.2 M) and EDC (0.5 M), respectively, and incubated in a 37 °C incubator for shaking slowly for 40 min to activate the MBs.
Lastly, the activated MBs were washed with PBS (0.1 M, pH = 7.4), at 11,000 rpm for 5 min, repeated 3 times to remove NHS and EDC, added 200 μL of synthesized double-stranded probes, incubated for 15 h with 37 °C oscillation, then removed the redundant double-stranded probes by magnetic separation. The MB-aptamer probe was washed 3 times with 300 μL of PBS (0.01 M, pH = 7.4), resuspended in 200 μL, and stored at 4 °C in a refrigerator for storage.
2.4. STX Detection
Firstly, 25 μL MBs solution and 25 μL of STX standard (4 nM) were taken in a centrifuge tube, gently reversed and mixed, and incubated for 1 h at 37 °C. Then, the supernatant solution containing S2 was separated from the MBs aptasensor by using magnetic separation, then a certain amount of S2 and the diluted H1 and H2 were annealed in PCR. The procedure was set to 95 °C for 5 min and gradually cooled to room temperature for at least 1 h [47]. Then, the three components were mixed in a centrifuge tube with a total volume of 20 μL, and the HCR reaction system was constructed for 1 h at room temperature. A tube added a certain volume of Cas9 and sgRNA with a final ratio of 2:1, 1 × NEBufferTM 3.1, added DEPC water to the total volume of 20 μL. After incubation at 37 °C for 10 min, the HCR system products were added into it and then incubated for 1 h at 37 °C and 65 °C for 10 min to stop the reaction incubation. Lastly, the complex was diluted to 200 μL and the fluorescence spectrum was measured by using an F-4700 fluorescence spectrophotometer [48,49]. (Hitachi Co., Ltd., Tokyo, Japan).
3. Results
3.1. Scheme of the Developed MBs Aptasensor
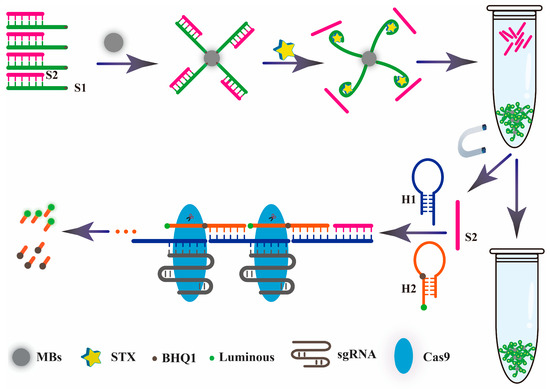
As shown in Scheme 1, after the 5′ terminal amino modified aptamer chain (S1) and complementary chain (S2) synthesized a double chain probe based on the principle of base pairing, the MBs aptamer biosensor probe was constructed by reacting with the carboxyl modified magnetic bead and fixed it on the surface of the MBs. When STX existed, the aptamer S1 could be specifically recognized, and combined with it, the aptamer complementary chain S2 was released into the solution. The supernatant was taken out through magnetic separation technology, then mixed with hairpin DNA1 (H1) and hairpin DNA2 (H2) (modified fluorescent agent and quenching agent). The aptamer complementary chain S2 acted as a promoter to trigger the HCR reaction. Firstly, the H1 hairpin structure was opened, thus promoting the self-assembly between H1 and H2, and formed a long, discontinuous double-chain complex. After that, the Cas9-sgRNA complex was added. Under the guidance of sgRNA, the discontinuous double chain complex was specifically recognized, and the Cas9 protein played an active role to achieve accurate cutting, and the quenching agent was separated from the fluorescent agent to achieve the effect of fluorescence recovery. According to the mechanism of the proposed HCR, the sensitivity is predominately determined by the HCR amplification efficiency. Therefore, the rate-limiting step is the H1/H2 complementary reaction with S2, and the more thorough this reaction, the higher the response signal.
Scheme 1.
Schematic illustration of the aptasensor based on hybrid chain reaction and a CRISPR-Cas9 gene editing system.
3.2. Characterization of MBs Aptasensor
In Figure 1A, the voltages of MBs and MBs + DNA were 22.4 mV and 25.1 mV, respectively. The increase in charge was mainly due to the addition of a negatively charged DNA probe to the surface of the MBs. The formed complex was loaded with the double-stranded probe. The potential values of MBs + DNA were significantly lower than that of MBs, demonstrating the successful synthesis.
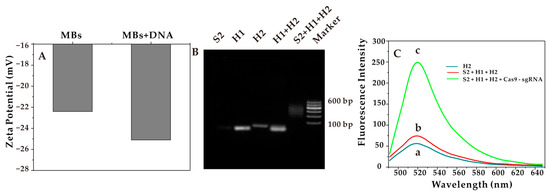
Figure 1.
(A) Zeta potential of MBs and MBs + DNA. (B) Agarose gel characterization of the HCR products. (C) Fluorescence intensity after the introduction of CRISPR-Cas9.
3.3. Feasibility Analysis
3.3.1. Gel Electrophoresis Confirmation of the Assembly of dsDNAs by HCR
The dsDNAs formed by HCR were verified by 3% agarose gel electrophoresis with TAE buffer as the running buffer at a constant voltage of 110 v. The agarose gels were then counterstained and imaged with Redsafe. As shown in Figure 1B, from left to the right, the lanes were S2, H1, H2, H1 + H2, S2 + H1 + H2, and marker. The mixed band in lane 5 and the only band in the other lanes indicated the successful assembly of the interrupted dsDNA after the HCR reaction. Notably, the bands H1 and H2 could be clearly seen in lane 4, indicating that only the mixture of H1 and H2 would not self-hybridize without promoters.
3.3.2. The Construction of the HCR and CRISPR-Cas9 System
As mentioned above, after the successful characterization of the HCR system, the influence of fluorescence recovery after the addition of the Cas9-sgRNA complex was studied. When the STX did not exist, the aptamer (S1) on the sensor did not specifically bind to it, so the promoter (S2) could not be released into the supernatant. Because there was no promoter (S2), the HCR reaction system cannot be triggered, and the fluorescence intensity was low, as shown in Figure 1C (a). When the STX existed, the aptamer was quickly recognized and specifically combined with it, and the promoter (S2) was released into the supernatant and triggered the HCR reaction system, with a slight increase in fluorescence intensity, as shown in Figure 1C (b). The continued addition of the preprepared Cas9-sgRNA complex to the system is shown in Figure 1C (c). The fluorescence intensity increased significantly, indicating that under the guidance of the sgRNA, the activity of the Cas9 nuclease was triggered to achieve accurately cutting the dsDNAs, which had been formed after the HCR reaction. Thus, the effect of fluorescence recovery was achieved.
3.4. Optimization of Reaction Conditions
Several conditions, such as the concentration ratio of Cas9 and sgRNA, the incubation temperature, and the incubation time of the Cas9:sgRNA complex, were further optimized to improve the detection sensitivity.
Firstly, the influence of the ratios of Cas9:sgRNA from 1:4 to 4:1 on the formation of the Cas9-sgRNA complex was investigated. Studies have shown that the higher or lower proportion of the Cas9:sgRNA complex cannot achieve efficient assembly, which affected the catalytic cleavage process of double chains and thus affected the magnitude of fluorescence intensity. As shown in Figure 2A, the fluorescence intensity reaches its maximum value at 2:1. Therefore, the ratio of 2:1 was selected as the optimal condition for Cas9:sgRNA.
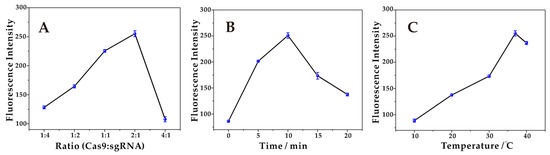
Figure 2.
(A) Optimization of the concentration ratio of Cas9:sgRNA. The fluorescence intensity reaches a maximum at a ratio of 2:1. (B) Optimization of the incubation time for the formation of Cas9-sgRNA. The fluorescence intensity reaches a maximum at 10 min. (C) Optimization of the incubation temperature for the formation of Cas9-sgRNA. The fluorescence intensity reaches a maximum at 37 °C.
Next, the influence of the incubation time for the formation of the Cas9-sgRNA complex was investigated. The incubation of the Cas9-sgRNA complex at different times (0 min, 5 min, 10 min, 15 min, and 20 min) yielded different fluorescence intensities as shown in Figure 2B. Without a prior incubation of both Cas9 and sgRNA for a certain time, the Cas9-sgRNA complex did not achieve effective assembly, with a poor shear effect and low fluorescence intensities. Continuing to increase the incubation time, the fluorescence intensity increased significantly, reaching a maximum at 10 min, indicating that both achieved efficient assembly after 10 min of incubation and the complex formed was sufficiently stable for precise cutting. The decrease in the fluorescence intensity with increasing time is due to the decreased specificity of the formed complex for recognizing the duplex. Therefore, 10 min was chosen as the optimal incubation time.
Finally, the influence of the incubation temperature on the formation of the Cas9-sgRNA complex was investigated. At low temperatures, the Cas9 protein fails to exert full activity, and even loses activity, resulting in low fluorescence intensities. With the increase in temperature, the fluorescence intensities increased gradually and reached the peak at 37 °C, as shown in Figure 2C. Continuing to raise the temperature, the fluorescence intensity was significantly reduced, and it was considered that the high temperature will change the spatial structure of the Cas9 protein, thus affecting the activity. Therefore, 37 °C was chosen as the optimal incubation temperature.
3.5. Analysis of STX Using the Developed Aptasensor
Under optimal conditions, the sensitivity of the method for STX detection at different concentrations was evaluated. With the increasing of STX concentration, the fluorescence intensity increased, and this aptasensor demonstrated great linear responses to STX in the range of 5.0 fM to 50 pM, with the correlation coefficient (R2 = 0.995), and the limit of detection (LOD) of 1.2 fM (Figure 3). In addition, as shown in Table 2, the LOD of the developed aptasensor in this study was lower than that of most reported detection methods for STX, and the linear detection range was relatively wider than that of the reported methods [50,51,52,53].
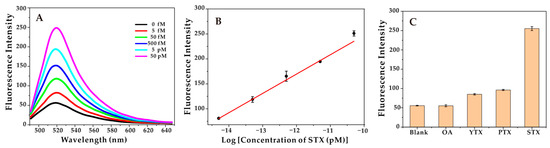
Figure 3.
(A) Fluorescence intensity over a range of STX concentrations (5 fM, 50 fM, 500 fM, 5 pM, 50 pM). (B) The linear relationship between the intensity of fluorescence and the logarithm of STX concentration. (C) Fluorescence intensity of the aptasensor in the presence of different marine toxins, the concentration of STX is 50 pM, and others (OA, YTX, PTX) are 500 pM.
Table 2.
Comparison of different aptasensor performances for STX detection.
3.6. Selectivity and Stability of the Aptasensor
In addition, in order to evaluate the selectivity of the aptasensor, other marine toxins, including OA, YTX, and PTX were applied to the aptasensor to obtain the fluorescence spectrum. As shown in Figure 3C, the fluorescence intensity of STX was significantly higher than other marine toxins, indicating that the developed aptasensor had high specificity and good selectivity. It should be noted that its specificity comes from (1) the recognition function of the Cas9-sgRNA complex, and (2) the S2 being separated from the aptamer to successfully initiate the HCR reaction.
To further assess the utility, accuracy, and repeatability of this aptasensor, three different concentrations of STX standard samples were added to the mussel tissue extraction to analyze the developed aptasensor. As shown in Table 3, good mussel tissue extraction recovery (102.4–104.1%) and low relative standard deviation (RSD) demonstrated the sensor’s accuracy and reproducibility for actual STX samples. These results indicate that the proposed biosensor could be successfully applied to real sample tests.
Table 3.
The detection of recovery rate of three different concentrations of STX in mussel tissue.
4. Conclusions
In this study, signal amplification is achieved by introducing HCR and a CRISPR-Cas9 gene editing system for the detection of STX. Different from the previous reports that directly cut a piece of double-stranded DNA using the characteristics of the CRISPR-Cas9 system, this study developed an efficient, specific, low detection limit and high selectivity detection method by precisely cutting the long discontinuous DNA after HCR construction. With these strategies, the LOD is as low as 1.2 fM, which is lower than most reported STX detection methods. The high recovery of STX detection in mussel tissue extract indicates that the sensor can be used for actual sample detection. Therefore, this sensor has brought innovative applications to marine biotoxin detection in various fields, such as water and food quality control.
Author Contributions
Investigation, data curation, Q.Z.; writing—original draft preparation, Q.Z.; writing—review and editing, X.L. and G.L.; supervision, writing, funding acquisition and resources, X.L. All authors have read and agreed to the published version of the manuscript.
Funding
This research was funded by the National Natural Science Foundation of China (No. 2187060746) and the Taishan Scholars Program of Shandong Province (No. tsqn201812101).
Institutional Review Board Statement
Not applicable.
Informed Consent Statement
Not applicable.
Data Availability Statement
The authors confirm that the data supporting the findings of this study are available within the article.
Conflicts of Interest
The authors declare no conflict of interest.
References
- Martin, D.F.; Martin, B.B. Red tide, red terror. Effects of red tide and related toxins. J. Chem. Educ. 1976, 53, 614. [Google Scholar] [CrossRef] [PubMed]
- Schrope, M. Red tide rising: Algal blooms can make life miserable for coastal dwellers and wreak havoc on marine ecosystems. Mark Schrope reports on Florida’s efforts to predict these red tides. Nature 2008, 452, 24–27. [Google Scholar] [CrossRef] [PubMed]
- Patel, S.S.; Lovko, V.J.; Lockey, R.F. Red Tide: Overview and Clinical Manifestations. J. Allergy Clin. Immunol. Pract. 2020, 8, 1219–1223. [Google Scholar] [CrossRef] [PubMed]
- Farabegoli, F.; Blanco, L.; Rodriguez, L.P.; Vieites, J.; Cabado, A. Phycotoxins in Marine Shellfish: Origin, Occurrence and Effects on Humans. Mar. Drugs 2018, 16, 188. [Google Scholar] [CrossRef] [PubMed]
- Hinder, S.L.; Hays, G.C.; BroOKS, C.J.; Davies, A.P.; Edwards, M.; Walne, A.W.; Gravenor, M.B. Toxic marine microalgae and shellfish poisoning in the British isles: History, review of epidemiology, and future implications. Environ. Health 2011, 10, 54. [Google Scholar] [CrossRef]
- Kellmann, R.; Mihali, T.K.; Jeon, Y.J.; Pickford, R.; Pomati, F.; Neilan, B.A. Biosynthetic intermediate analysis and functional homology reveal a saxitoxin gene cluster in cyanobacteria. Appl. Environ. Microbiol. 2008, 74, 4044–4053. [Google Scholar] [CrossRef]
- Adams, N.G.; Robertson, A.; Grattan, L.M.; Pendleton, S.; Roberts, S.; Tracy, J.K.; Trainer, V.L. Assessment of sodium channel mutations in Makah tribal members of the U.S. Pacific Northwest as a potential mechanism of resistance to paralytic shellfish poisoning. Harmful Algae 2016, 57, 26–34. [Google Scholar] [CrossRef]
- Thottumkara, A.P.; Parsons, W.H.; Du bois, J. Saxitoxin. Angew. Chem. Int. Ed. Engl. 2014, 53, 5760–5784. [Google Scholar] [CrossRef]
- Walsh, J.J.; Tomas, C.R.; Steidinger, K.A.; Lenes, J.M.; Chen, F.R.; Weisberg, R.H.; Zheng, L.; Landsberg, J.H.; Vargo, G.A.; Heil, C.A. Imprudent fishing harvests and consequent trophic cascades on the West Florida shelf over the last half century: A harbinger of increased human deaths from paralytic shellfish poisoning along the southeastern United States, in response to oligotrophication? Cont. Shelf Res. 2011, 31, 891–911. [Google Scholar]
- Zheng, W.; Liu, X.; Li, Q.; Shu, Z.; Li, Z.; Zhang, L. A simple electrochemical aptasensor for saxitoxin detection. RSC Adv. 2022, 12, 23801–23807. [Google Scholar] [CrossRef]
- Gerssen, A.; Pol-Hofstad, I.E.; Poelman, M.; Mulder, P.P.; Van Den Top, H.J.; De Boer, J. Marine toxins: Chemistry, toxicity, occurrence and detection, with special reference to the Dutch situation. Toxins 2010, 2, 878–904. [Google Scholar] [CrossRef]
- Humpage, A.R.; Magalhaes, V.F.; Froscio, S.M. Comparison of analytical tools and biological assays for detection of paralytic shellfish poisoning toxins. Anal. Bioanal. Chem. 2010, 397, 1655–1671. [Google Scholar] [CrossRef] [PubMed]
- Mcnamee, S.E.; Medlin, L.K.; Kegel, J.; Mccoy, G.R.; Raine, R.; Barra, L.; Ruggiero, M.V.; Kooistra, W.H.; Montresor, M.; Hagstrom, J.; et al. Distribution, occurrence and biotoxin composition of the main shellfish toxin producing microalgae within European waters: A comparison of methods of analysis. Harmful Algae 2016, 55, 112–120. [Google Scholar] [CrossRef] [PubMed]
- Marrouchi, R.; Dziri, F.; Belayouni, N.; Hamza, A.; Benoit, E.; Molgo, J.; Kharrat, R. Quantitative determination of gymnodimine-A by high performance liquid chromatography in contaminated clams from Tunisia coastline. Mar. Biotechnol. 2010, 12, 579–585. [Google Scholar] [CrossRef]
- Lee, J.S.; Yanagi, T.; Kenma, R.; Yasumoto, T. Fluorometric determination of diarrhetic shellfish toxins by high-performance liquid chromatography. Agric. Biol. Chem. 1987, 51, 877–881. [Google Scholar]
- Ciminiello, P.; Dell’aversano, C.; Iacovo, E.D.; Fattorusso, E.; Forino, M.; Tartaglione, L. LC-MS of palytoxin and its analogues: State of the art and future perspectives. Toxicon 2011, 57, 376–389. [Google Scholar] [CrossRef] [PubMed]
- Keyon, A.S.; Guijt, R.M.; Gaspar, A.; Kazarian, A.A.; Nesterenko, P.N.; Bolch, C.J.; Breadmore, M.C. Capillary electrophoresis for the analysis of paralytic shellfish poisoning toxins in shellfish: Comparison of detection methods. Electrophoresis 2014, 35, 1496–1503. [Google Scholar] [CrossRef]
- Naresh, V.; Lee, N. A Review on Biosensors and Recent Development of Nanostructured Materials-Enabled Biosensors. Sensors 2021, 21, 1109. [Google Scholar] [CrossRef]
- De Oliveira, W.F.; Dos Santos Silva, P.M.; Coelho, L.C.B.B.; Dos Santos Correia, M.T. Biomarkers, biosensors and biomedicine. Curr. Med. Chem. 2020, 27, 3519–3533. [Google Scholar] [CrossRef]
- Campas, M.; Prieto-Simon, B.; Marty, J.L. Biosensors to detect marine toxins: Assessing seafood safety. Talanta 2007, 72, 884–895. [Google Scholar] [CrossRef]
- Reverte, L.; Solino, L.; Carnicer, O.; Diogene, J. Campas M. Alternative methods for the detection of emerging marine toxins: Biosensors, biochemical assays and cell-based assays. Mar. Drugs 2014, 12, 5719–5763. [Google Scholar] [CrossRef] [PubMed]
- Zhuo, Z.; Yu, Y.; Wang, M.; Li, J.; Zhang, Z.; Liu, J.; Wu, X.; Lu, A.; Zhang, G.; Zhang, B. Recent Advances in SELEX Technology and Aptamer Applications in Biomedicine. Int. J. Mol. Sci. 2017, 18, 2142. [Google Scholar] [CrossRef] [PubMed]
- Sun, H.; Zhu, X.; Lu, P.Y.; Rosato, R.R.; Tan, W.; Zu, Y. Oligonucleotide aptamers: New tools for targeted cancer therapy. Mol. Ther. Nucleic Acids 2014, 3, e182. [Google Scholar] [CrossRef]
- Eissa, S.; Ng, A.; Siaj, M.; Tavares, A.C.; Zourob, M. Selection and identification of DNA aptamers against okadaic acid for biosensing application. Anal. Chem. 2013, 85, 11794–11801. [Google Scholar] [CrossRef]
- Fomo, G.; Waryo, T.T.; Sunday, C.E.; Baleg, A.A.; Baker, P.G.; Iwuoha, E.I. Aptameric Recognition-Modulated Electroactivity of Poly(4-Styrenesolfonic Acid)-Doped Polyaniline Films for Single-Shot Detection of Tetrodotoxin. Sensors 2015, 15, 22547–22560. [Google Scholar] [CrossRef] [PubMed]
- Sun, H.; Zu, Y. A highlight of recent advances in aptamer technology and its application. Molecules 2015, 20, 11959–11980. [Google Scholar] [CrossRef]
- Barthelmebs, L.; Jonca, J.; Hayat, A.; Prieto-Simon, B.; Marty, J.L. Enzyme-Linked Aptamer Assays (ELAAs), based on a competition format for a rapid and sensitive detection of Ochratoxin A in wine. Food Control 2011, 22, 737–743. [Google Scholar] [CrossRef]
- Sefah, K.; Phillips, J.A.; Xiong, X.; Meng, L.; Van Simaeys, D.; Chen, H.; Martin, J.; Tan, W. Nucleic acid aptamers for biosensors and bio-analytical applications. Analyst 2009, 134, 1765–1775. [Google Scholar] [CrossRef]
- Tian, Y.; Du, L.; Zhu, P.; Chen, Y.; Chen, W.; Wu, C.; Wang, P. Recent progress in micro/nano biosensors for shellfish toxin detection. Biosens. Bioelectron. 2021, 176, 112899. [Google Scholar] [CrossRef] [PubMed]
- Zhao, Y.; Li, L.; Yan, X.; Wang, L.; Ma, R.; Qi, X.; Wang, S.; Mao, X. Emerging roles of the aptasensors as superior bioaffinity sensors for monitoring shellfish toxins in marine food chain. J. Hazard. Mater. 2022, 421, 126690. [Google Scholar] [CrossRef]
- Bi, S.; Yue, S.; Zhang, S. Hybridization chain reaction: A versatile molecular tool for biosensing, bioimaging, and biomedicine. Chem. Soc. Rev. 2017, 46, 4281–4298. [Google Scholar] [CrossRef]
- Li, X.; Wang, Y.; Wang, L.; Wei, Q. A surface plasmon resonance assay coupled with a hybridization chain reaction for amplified detection of DNA and small molecules. Chem. Commun. 2014, 50, 5049–5052. [Google Scholar] [CrossRef] [PubMed]
- Li, H.; Wang, X.; Wei, S.; Zhao, C.; Song, X.; Xu, K.; Li, J.; Pang, B.; Wang, J. Applications of hybridization chain reaction optical detection incorporating nanomaterials: A review. Anal. Chim. Acta 2022, 1190, 338930. [Google Scholar] [CrossRef]
- Wu, J.; Lv, J.; Zheng, X.; Wu, Z.S. Hybridization chain reaction and its applications in biosensing. Talanta 2021, 234, 122637. [Google Scholar] [CrossRef]
- Augspurger, E.E.; Rana, M.; Yigit, M.V. Chemical and Biological Sensing Using Hybridization Chain Reaction. ACS Sens. 2018, 3, 878–902. [Google Scholar] [CrossRef]
- Gratz, S.J.; Wildonger, J.; Harrison, M.M.; O’connor-Giles, K.M. CRISPR/Cas9-mediated genome engineering and the promise of designer flies on demand. Fly 2013, 7, 249–255. [Google Scholar] [CrossRef]
- Jinek, M.; Chylinski, K.; Fonfara, I.; Hauer, M.; Doudna, J.A.; Charpentier, E. A programmable dual-RNA–guided DNA endonuclease in adaptive bacterial immunity. Science 2012, 337, 816–821. [Google Scholar] [CrossRef]
- Zhu, Y. Advances in CRISPR/Cas9. Biomed. Res. Int. 2022, 2022, 9978571. [Google Scholar] [CrossRef] [PubMed]
- Hisano, Y.; Ota, S.; Kawahara, A. Genome editing using artificial site-specific nucleases in zebrafish. Dev. Growth Differ. 2014, 56, 26–33. [Google Scholar] [CrossRef] [PubMed]
- Shademan, B.; Nourazarian, A.; Hajazimian, S.; Isazadeh, A.; Biray Avci, C.; Oskouee, M.A. CRISPR Technology in Gene-Editing-Based Detection and Treatment of SARS-CoV-2. Front. Mol. Biosci. 2021, 8, 772788. [Google Scholar] [CrossRef]
- Hu, J.; Jiang, M.; Liu, R.; Lv, Y. Label-free CRISPR/Cas9 assay for site-specific nucleic acid detection. Anal. Chem. 2019, 91, 10870–10878. [Google Scholar] [CrossRef]
- Liu, Y.; Li, S.; Zhang, L.; Zhao, Q.; Li, N.; Wu, Y. A sensitive and specific method for microRNA detection and in situ imaging based on a CRISPR–Cas9 modified catalytic hairpin assembly. RSC Adv. 2020, 10, 28037–28040. [Google Scholar] [CrossRef]
- Feng, W.; Newbigging, A.M.; Tao, J.; Cao, Y.; Peng, H.; Le, C.; Wu, J.; Pang, B.; Li, J.; Tyrrell, D.L.; et al. CRISPR technology incorporating amplification strategies: Molecular assays for nucleic acids, proteins, and small molecules. Chem. Sci. 2021, 12, 4683–4698. [Google Scholar] [CrossRef]
- Huang, Z.; Liu, S.; Pei, X.; Li, S.; He, Y.; Tong, Y.; Liu, G. Fluorescence Signal-Readout of CRISPR/Cas Biosensors for Nucleic Acid Detection. Biosensors 2022, 12, 779. [Google Scholar] [CrossRef] [PubMed]
- Pardee, K.; Green, A.A.; Takahashi, M.K.; Braff, D.; Lambert, G.; Lee, J.W.; Ferrante, T.; Ma, D.; Donghia, N.; Fan, M. Rapid, Low-Cost Detection of Zika Virus Using Programmable Biomolecular Components. Cell 2016, 165, 1255–1266. [Google Scholar] [CrossRef] [PubMed]
- Li, L.; Li, S.; Wu, N.; Wu, J.; Wang, G.; Zhao, G.; Wang, J. HOLMESv2: A CRISPR-Cas12b-Assisted Platform for Nucleic Acid Detection and DNA Methylation Quantitation. ACS Synth. Biol. 2019, 8, 2228–2237. [Google Scholar] [CrossRef]
- Yin, K.; Ding, X.; Li, Z.; Zhao, H.; Cooper, K.; Liu, C. Dynamic Aqueous Multiphase Reaction System for One-Pot CRISPR-Cas12a-Based Ultrasensitive and Quantitative Molecular Diagnosis. Anal. Chem. 2020, 92, 8561–8568. [Google Scholar] [CrossRef] [PubMed]
- Wang, R.; Zhao, X.; Chen, X.; Qiu, X.; Qing, G.; Zhang, H.; Zhang, L.; Hu, X.; He, Z.; Zhong, D.; et al. Rolling Circular Amplification (RCA)-Assisted CRISPR/Cas9 Cleavage (RACE) for Highly Specific Detection of Multiple Extracellular Vesicle MicroRNAs. Anal. Chem. 2020, 92, 2176–2185. [Google Scholar] [CrossRef]
- Kang, Y.; Su, G.; Yu, Y.; Cao, J.; Wang, J.; Yan, B. CRISPR-Cas12a-Based Aptasensor for On-Site and Highly Sensitive Detection of Microcystin-LR in Freshwater. Environ. Sci. Technol. 2022, 56, 4101–4110. [Google Scholar] [CrossRef]
- Zhao, Y.; Li, L.; Ma, R.; Wang, L.; Yan, X.; Qi, X.; Wang, S.; Mao, X. A competitive colorimetric aptasensor transduced by hybridization chain reaction-facilitated catalysis of AuNPs nanozyme for highly sensitive detection of saxitoxin. Anal. Chim. Acta 2021, 1173, 338710. [Google Scholar] [CrossRef] [PubMed]
- Cheng, S.; Zheng, B.; Yao, D.; Wang, Y.; Tian, J.; Liu, L.; Liang, H.; Ding, Y. Determination of Saxitoxin by Aptamer-Based Surface-Enhanced Raman Scattering. Anal. Lett. 2019, 52, 902–918. [Google Scholar] [CrossRef]
- Li, L.; Zhao, Y.; Yan, X.; Qi, X.; Wang, L.; Ma, R.; Wang, S.; Mao, X. Development of a terminal-fixed aptamer and a label-free colorimetric aptasensor for highly sensitive detection of saxitoxin. Sens. Actuators B Chem. 2021, 344, 130320. [Google Scholar] [CrossRef]
- Ullah, N.; Chen, W.; Noureen, B.; Tian, Y.; Du, L.; Wu, C.; Ma, J. An Electrochemical Ti(3)C(2)T(x) Aptasensor for Sensitive and Label-Free Detection of Marine Biological Toxins. Sensors 2021, 21, 4938. [Google Scholar] [CrossRef] [PubMed]


Disclaimer/Publisher’s Note: The statements, opinions and data contained in all publications are solely those of the individual author(s) and contributor(s) and not of MDPI and/or the editor(s). MDPI and/or the editor(s) disclaim responsibility for any injury to people or property resulting from any ideas, methods, instructions or products referred to in the content. |
© 2023 by the authors. Licensee MDPI, Basel, Switzerland. This article is an open access article distributed under the terms and conditions of the Creative Commons Attribution (CC BY) license (https://creativecommons.org/licenses/by/4.0/).