Article

Highly Selective and Sensitive Sensor Based IL and CMC-MWCNTs Nanocomposite for Rutin Determination

1
School of Life Sciences, Henan University, Kaifeng 475000, China
2
School of Art, Henan University, Kaifeng 475000, China
3
Institute of Biochemistry and Biophysics, University of Tehran, Tehran 1417614418, Iran
*
Authors to whom correspondence should be addressed.
These authors contributed equally to this work.
Chemosensors 2023, 11(3), 171; https://doi.org/10.3390/chemosensors11030171
Submission received: 18 January 2023 / Revised: 24 February 2023 / Accepted: 28 February 2023 / Published: 2 March 2023
(This article belongs to the Collection Advances of Chemical and Biosensors in China)

Abstract

:
Rutin is a natural antioxidant flavonoid compound with anti-inflammatory, antioxidant, and antiviral effects that is used to prepare drugs with wide application in clinical treatment. Therefore, the quantitative detection of rutin has important practical significance. In this work, a novel electrochemical sensor based on glassy carbon electrodes (GCEs) modified with sodium carboxymethylcellulose (CMC), multi-walled carbon nanotubes (MWCNTs), and 1-butyl-3-methylimid (ionic liquid, IL) was developed for the super-sensitive detection of the flavonoid rutin. The properties of these modified materials were analyzed by transmission electron microscope (TEM), cyclic voltammograms (CVs), and electrochemical-impedance spectroscopy (EIS). CMC was used to disperse MWCNTs to further enhance their hydrophilicity and biocompatibility. The modified MWCNTs improved the sensitivity of rutin detection. The square-wave voltammetry (SWV) technique showed that the linear range of rutin concentration determination was 0.01 μM to 1 µM and 1 µM to 10 µM. The minimum concentration detection of rutin was 0.83 nM and 6.6 nM, respectively. The proposed sensor presented good selectivity for rutin and successfully analyzed rutin content in the pharmaceutical rutin tablets. These results are consistent with those measured by ultra-high-performance liquid chromatography (UHPLC). Therefore, this sensor has latent application value in the analysis of rutin in food and drug tablets and nutraceutical samples.

1. Introduction

Rutin (rutoside, quercetin-3-rutoside) is a flavonoid glycoside compound composed of flavonoic aglucone quercetin, along with disaccharide rutinose [1,2], that has widespread distribution in plenty of plants, such as buckwheat, sophorae rice, tea, flavedo, and tomato [3,4]. Rutin has many beneficial biological activities, including antiphlogistic, antivirotic, antiallergic, antioxidative, antihypertensive, and antitumor effects, and plenty of other characteristics. It is mainly used to treat capillary hemorrhage with increased fragility, and can also maintain the elasticity of blood vessels, enhance capillary resistance, reduce capillary fragility and permeability, and promote cell proliferation and prevent blood-cell agglutination. In addition, rutin is also applied for treating hypertensive encephalopathy, cerebral hemorrhage, retinal hemorrhage, hemorrhagic purpura, acute hemorrhagic nephritis, recurrent epistaxis, traumatic pulmonary hemorrhage, and postpartum hemorrhage. These many biomedical protective actions are principally put down to its oxidation resistance by scavenging an amount of various oxidizing species such as peroxyl radicals, hydroxyl radicals, or superoxide anions. Because of its dominant biological and pharmacological activities, it has aroused widespread attention and has been widely applied in the medical and health-care system. At present, rutin is not only served in the anthropic diet as an antioxygen and nutritional enhancer but is also used as a retardant in the therapy of certain diseases, such as an oxidation-resistant, anti-inflammatory, antihemorrhagic, antiviral, and neuroprotective agent. In particular, it can effectively regulate the perviousness of blood capillaries and improve the stability of thrombocytes. This compound has been extensively used in pharmacy and medicine as an anti-inflammatory, anti-bacterial, anti-oxidant, and anti-aging therapeutic agent [5,6,7,8,9,10,11,12,13]. Hence, it is vital to build a sensitive, convenient, fast, and economical analytical technique for the detection and quantification of rutin in pharmaceutical, food, and clinical samples [14,15].
Nowadays, plenty of analytical techniques have been used for the quantitative measurement of rutin, incorporating thin-layer chromatogram scanning, high-performance liquid chromatography (HPLC), spectrophotometry, and capillary electrophoresis [16,17,18,19,20,21,22,23,24]. However, flaws in these methods include wasted time, high cost, the need for skilled operators, and expensive equipment. Compared with the above methods, the electrochemical method is a preferred technology with high sensitivity, simplicity, and stability [25]. However, it is crucial to find suitable electrode-modified materials to improve the electrode’s selectivity, sensitivity, and stability [26,27,28]. At present, multi-walled carbon nanotubes (MWCNTs) have been put into use in many fields due to their excellent specific surface area and electrochemical, thermodynamic, and mechanical properties [29,30,31]. Considering that MWCNTs have strong hydrophobicity and tend to form a number of irreversible aggregates, we introduced sodium carboxymethylcellulose (CMC) to improve the hydrophilicity and electrical conductivity of MWCNTs [30,32].
In this study, we developed a novel and highly sensitive electrochemical sensor based on an ionic liquid (IL) and a CMC-MWCNT nanomaterial modified electrode for rutin determination. Here, IL is used because of its good conductivity, outstanding thermodynamic stability, and wider potential window so as to improve the electrochemical signal of the modified electrode [33,34,35,36,37]. The basic electrochemical performance of the sensor, as well as its sensitivity, stability, anti-interference, repeatability, and reproducibility, were evaluated through a variety of electrochemical experimental techniques. In addition, we use the constructed electrochemical sensor to detect rutin content in drug samples to evaluate its practical feasibility. The accuracy and sensitivity of the electrochemical sensor we built for rutin measurement were also evaluated by comparing with the results measured by ultra-high-performance liquid chromatography (UHPLC). In addition, the CMC we used is non-toxic, nafion solution, ionic liquid, and multiwalled carbon nanotube are slightly toxic. In view of safety concerns, we are currently thinking more about using it for vitro measurements and in the future considering safer nontoxic materials for in vivo measurements.

2. Materials and Methods

2.1. Reagents and Materials

Rutin (98.0%), amoxicillin (98%), and clotrimazole (98%) were offered by Shanghai Yuanye Co., Ltd., Shanghai, China. MWCNTs (>98%) were obtained from Shenzhen Nanotech Port Co., Ltd., Shenzhen, China. CMC (>98%) was purchased from Shanghai Sinopharm Chemical Reagent Co., Ltd., Shanghai, China. 1-Butyl-3-methylimid (IL, >99.0%) was obtained from Sichuan West Asia Chemical Co., Ltd., Suining, China. Nafion (NF, 5% a mixture of lower aliphatic alcohols and water), glucose (Glu, ≥99%), sodium dihydrogen phosphate (NaH2PO4·2H2O, ≥99%), and disodium hydrogen phosphate (Na2HPO4·12H2O, ≥99.0%) were obtained from Sigma-Aldrich (St. Louis, MO, USA). Ethanol (99.7%) was offered by Tianjin Benchmark Chemical Reagent Co., Ltd., Tianjin, China. Vitamin B1 (Vit B1, >99%) and inositol (≥97%) were offered by Beijing Dingguo Biotechnology Co., Ltd., Beijing, China. Vitamin C (Vit C, >99.7%) was purchased from Beijing Aoboxing Biotechnology Co., Ltd., Beijing, China. Uric acid (UA, ≥99.0%) was obtained from Sinopharm Chemical Reagent Co., Ltd., Shanghai, China. Sodium sulfite (≥98%), sodium nitrite (≥99%), and levodopa (≥98%) were obtained from Sigma-Aldrich. Pyrogallic acid (>99.0%) was offered by Shanghai Aladdin Biochemical Technology Co., Ltd., Shanghai, China. Urea was obtained from Tianjin Deen Chemical Reagent Co., Ltd., Tianjin, China. Rutin solution was prepared with ethanol as the solvent, and 50 mM phosphate-buffer solution (PBS) was employed as sustaining electrolyte. All of these reagents are analytical level and do not need additional purification. All water employed in this study was prepared in an 18 MΩ ultra-pure water machine.

2.2. Apparatus and Measurements

All electrochemical experiments were conducted on a CHI660E electrochemical workstation (Shanghai Chenhua Instrument Co., Ltd., Shanghai, China). The system of the triple electrode was applied in the experiment with a 3 mm diameter GCE, a saturated Ag/AgCl electrode, and a platinum wire, which represented the working electrode, the reference electrode, and the counter electrode, respectively [38,39,40,41]. Methods of cyclic voltammetry (CV), linear-sweep voltammetry (LSV), differential-pulse voltammetry (DPV), and square-wave voltammetry (SWV) were carried out in 50 mM pH 5 phosphate-buffer solution (PBS) with a scan rate of 100 mVs−1, respectively. The parameters of LSV were the system-default settings (scan rate: 0.1 V/s, sample interval: 0.001 V). The parameters of DPV were the system-default settings (amplitude: 0.05 V, pulse width: 0.05 s, sampling width: 0.0167 s). The parameter settings of SWV were amplitude: 0.05 V, frequency: 20 Hz. The electrochemical-impedance spectroscopy (EIS) was performed in 5 mM [Fe(CN)6]3−/4− solution containing 0.1 M KCl in the frequency range from 102 to 106 Hz [42,43]. All electrochemical experiments were performed at a temperature of 25 °C.
The transmission electron microscope (TEM) images were obtained from a JEM-2100 transmission electrode microscope (JEM-2100, JEOL, Tokyo, Japan) at 200 kV [44,45,46]. The morphology of the nanocomposite film was investigated by scanning electron microscope (SEM) using Carl Zeiss at 20 kV. The Raman spectra of the prepared nanocomposite film samples were recorded on a Renishaw inVia spectrometer at room temperature using the excitation wavelength 532 nm of an Ar+ laser.
Ultra-high-pressure liquid chromatography (UHPLC) was used to detect the content of rutin in drugs as a standard method (1290 Infinity II, Agilent, Santa Clara, CA, USA) [47]. Elution was executed on an Eclipse Plus C18 column (2.7 μm, 4.6 × 100 mm). The mobile phase was comprised of water and methanol with a volume ratio of 40:60 and worked at a flow rate of 0.2 mLmin−1. The wavelength of detection and the sample’s injection volume were 365 nm and 10 μL, respectively.

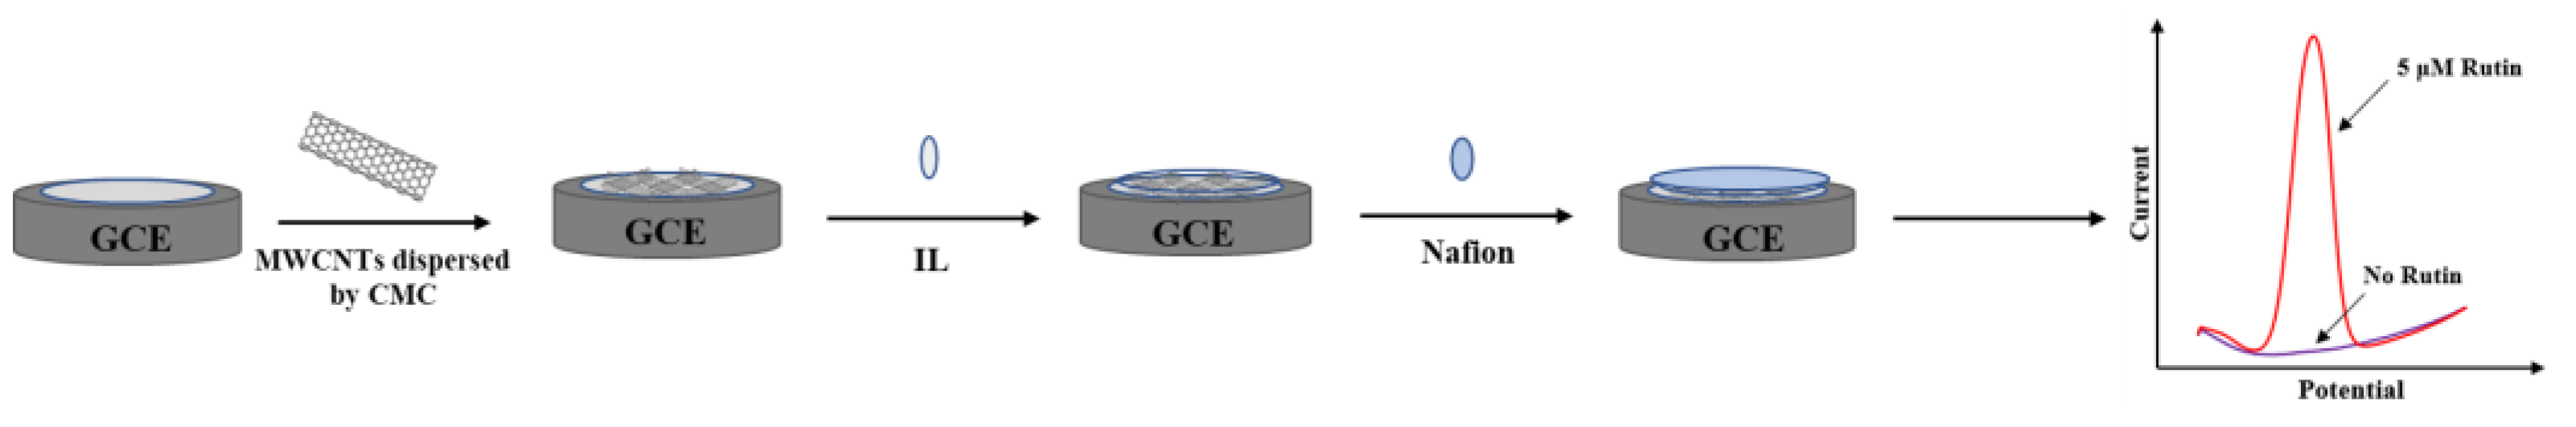
2.3. Electrode Preparation and Modification

Before the electrode modification, the surface of a glassy carbon electrode (GCE) was burnished on the chamois leather with aluminum-oxide suspension with particle sizes of 1.0, 0.3, and 0.05 µm [48]. Therewith, the GCE conducted supersonic inspection in 75% ethanol first for 15 min and then supersonic inspection in hyperpure water for approximately 15 min. After that, the electrode was placed and dried in a drying tower.
The GCE modification process is as follows: Firstly, 5 mg of CMC were added into 1 mL of ultra-pure water. Then, 2 mg of MWCNTs were dispersed into 1 mL of ultra-pure water containing 5 mgmL−1 CMC solution (v:v = 9:1). After that, 2 µL of the mixture of the CMC-MWCNTs dispersive liquid were dropped on the prepared GCE surface and dried for 25 min at room temperature. Afterwards, 0.8 µL of IL were dropped on the electrode and incubated for 4 h at 4 °C. At last, 2 µL of NF solution were cast on the electrode surface and dried at 25 °C, which was used to prevent the modified materials from falling off the GCE surface. In addition, other modified electrodes were also prepared with similar steps. Figure 1 shows the manufacturing operation of the modified electrode.

2.4. Real-Sample Preparation

Rutin tablets (20 mg/tablet) were purchased from two different local pharmacies, and the two kinds of tablets were dissolved in the methanol. After ultrasonic, off-center, and filter treatment for purification, the sample solutions (sample 1 and sample 2) were prepared for the final content determination by using electrochemical and UHPLC analysis.

3. Results and Discussion

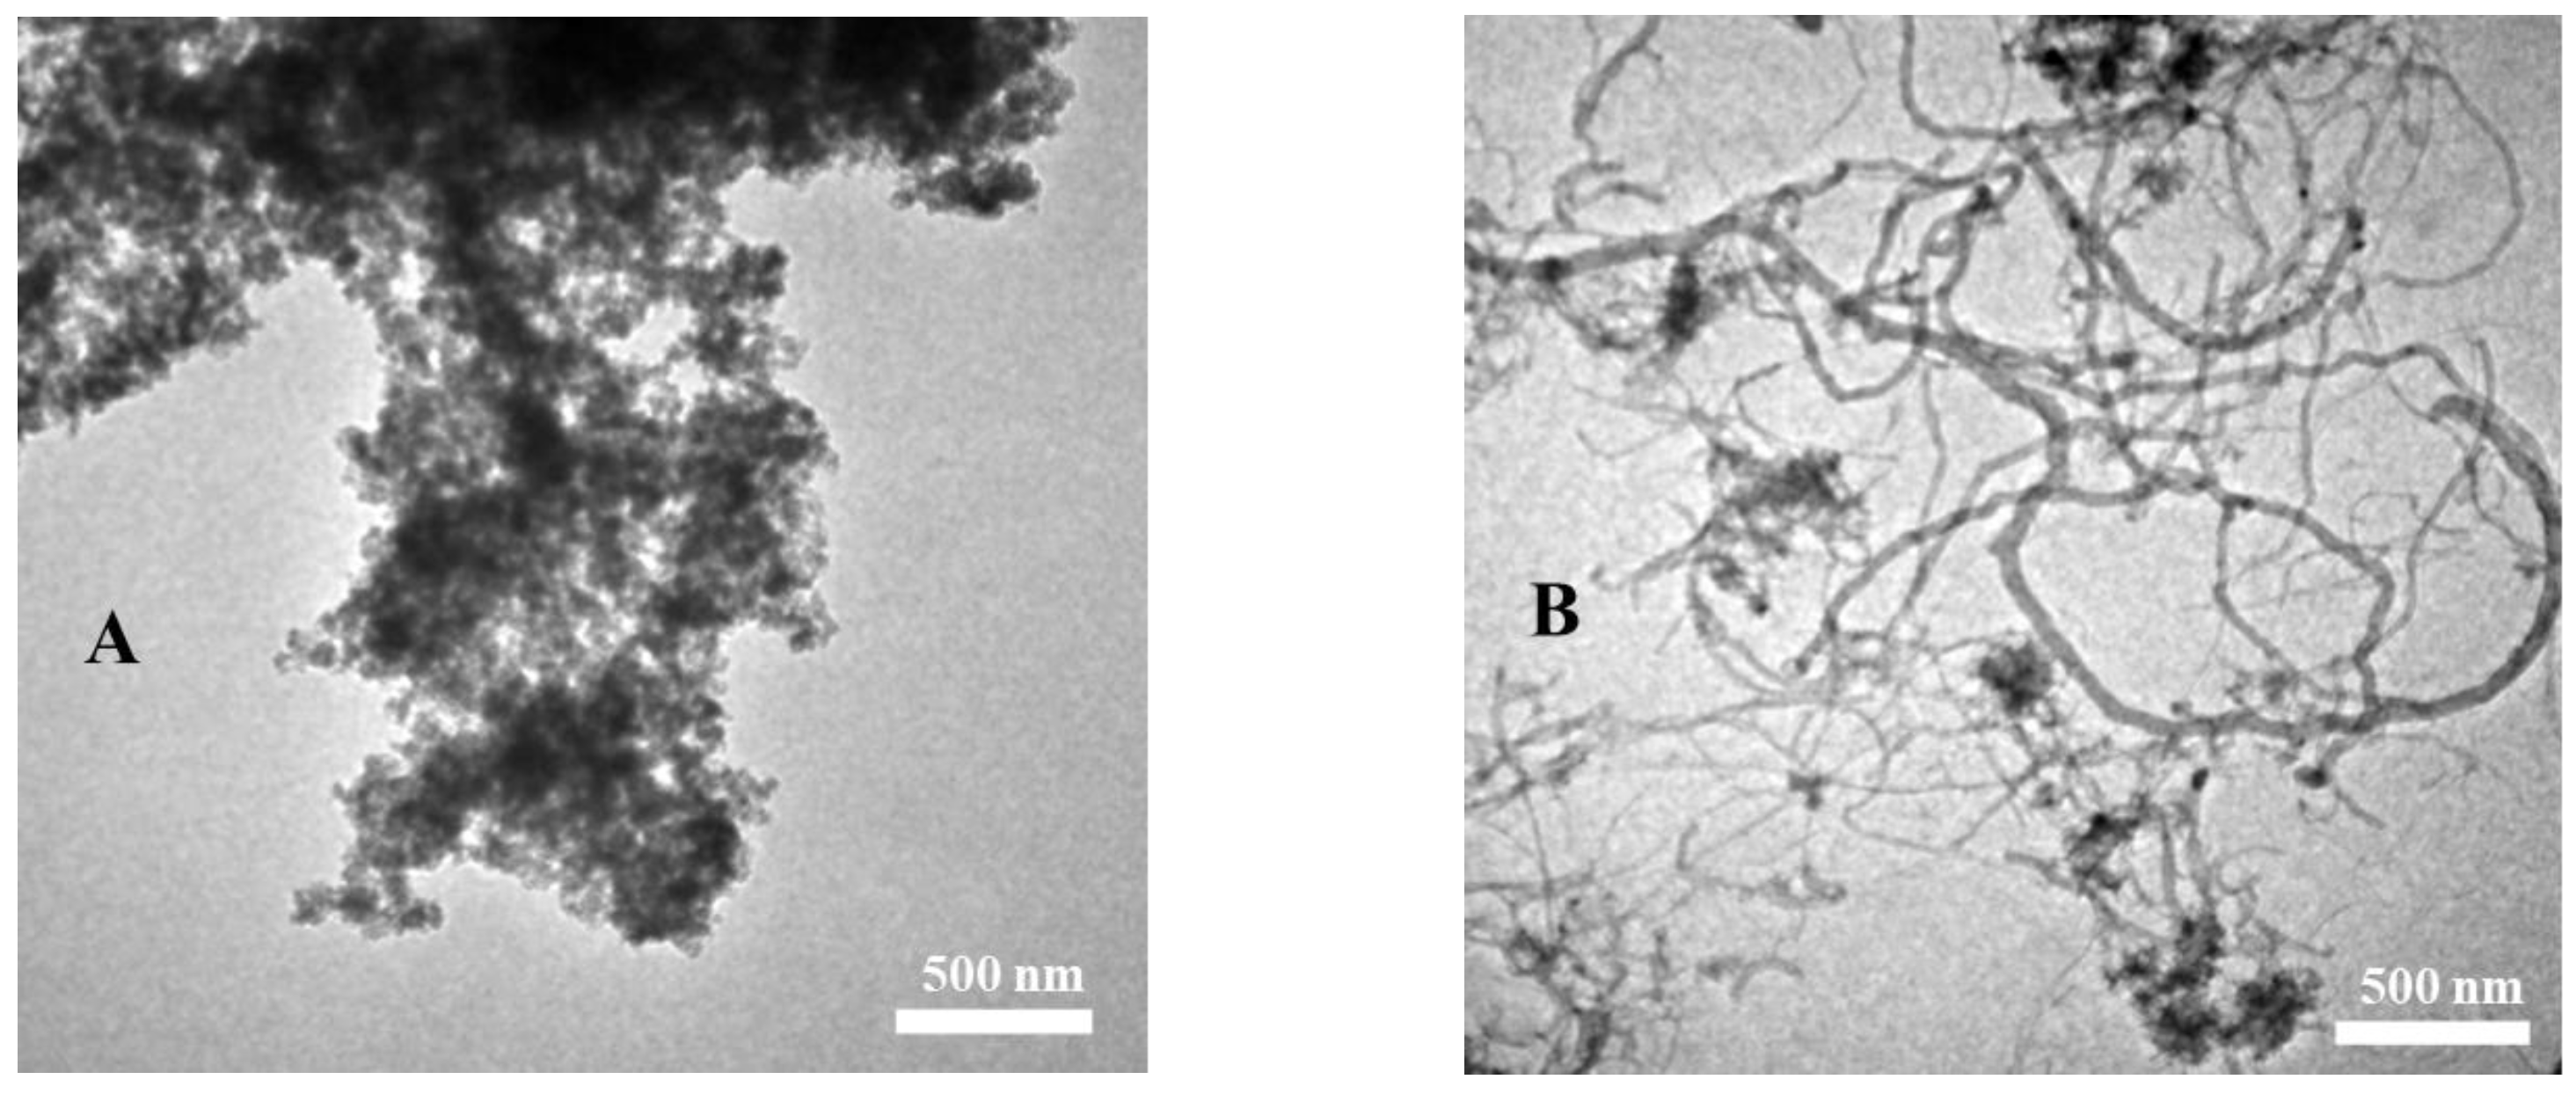
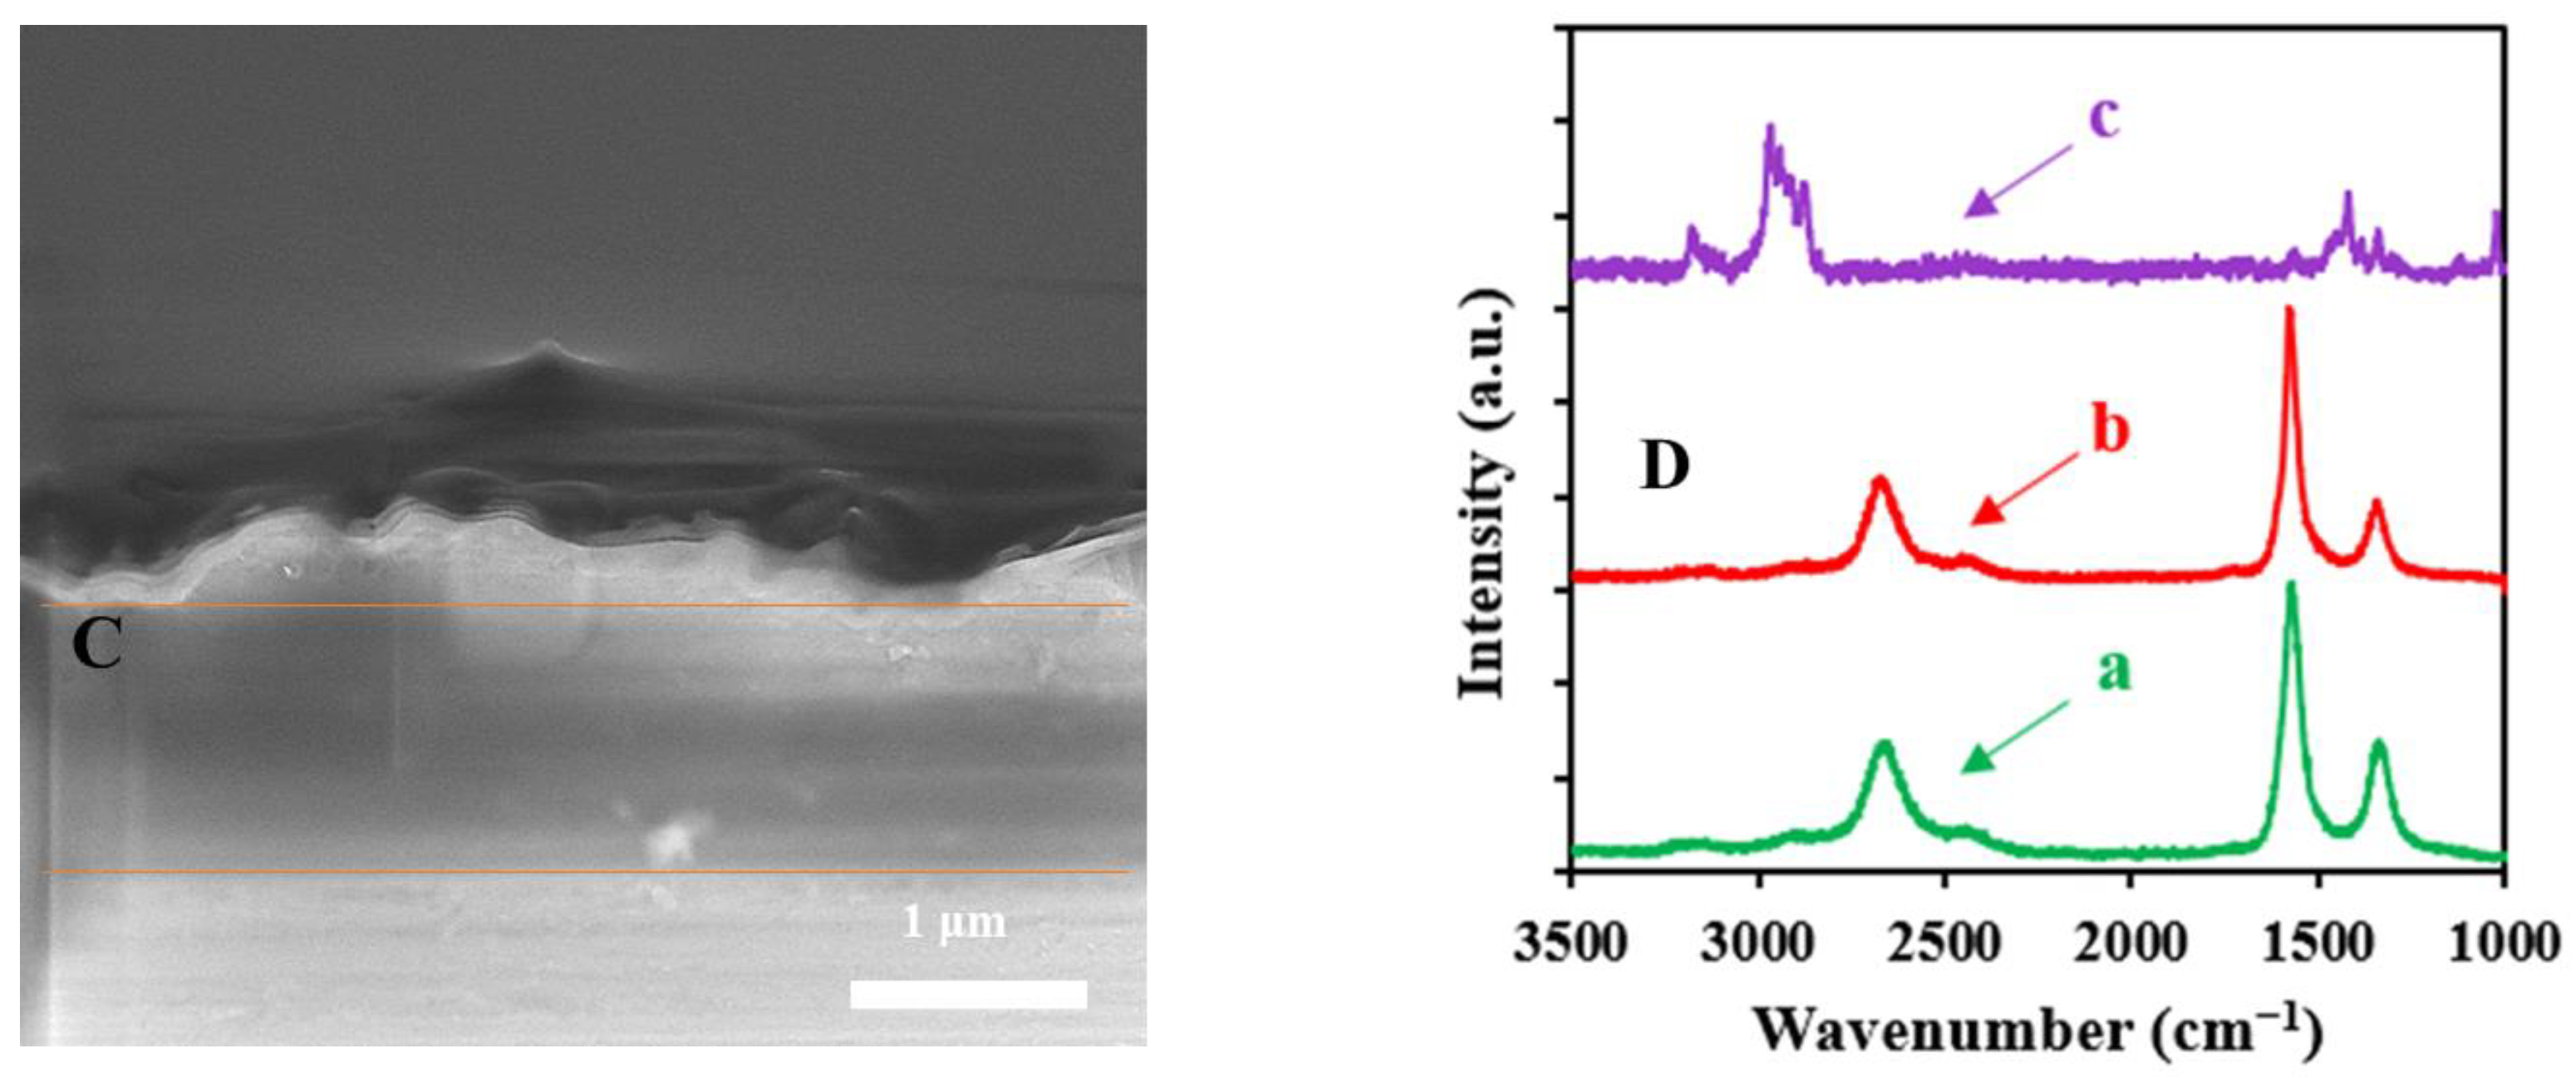
3.1. Characteristics of Nanomaterials

TEM was used to realize the morphology features of MWCNTs and CMC-MWCNTs. The TEM image of the MWCNTs is displayed in Figure 2A. It could be seen that a great deal of multi-walled carbon nanotubes were piled up and twisted together. Figure 2B shows the TEM image of composite CMC-MWCNTs. It can be observed that the multi-walled carbon nanotubes were obviously dispersed, which illustrates that CMC had the better dispersion ability. Moreover, it can be seen that the MWCNTs had a long arm, and a curved and tubular structure. This may have provided more active sites and loading areas to elevate the electrical conductivity. In addition, we did a cross-sectional study of the CMC-MWCNT-IL layer via SEM and the image is shown in Figure 2C. The thickness of the CMC-MWCNT-IL layer was about 1 μm.
Raman spectroscopy is essential for the study of the molecular vibration of carbon materials. The Raman spectra of the MWCNT (a), CMC-MWCNT (b), and CMC-MWCNT-IL (c) nanocomposite films are shown in Figure 2D. Raman spectra for the carbon nanotubes consisted of the main G band at around 1570–1580 cm−1 and the disorder band D at around 1320–1350 cm−1. The D band represents the disordered graphite structure (sp3) and the G band is associated with an ordered carbon (sp2) in a two-dimensional hexagonal lattice, which is related to the graphite structure of the nanotubes. The band-intensity ratio (ID/IG) is a measure of the defect and disorder density of the MWCNT side wall. The intensity ratio ID/IG for the MWCNT was 0.31, whereas it was 0.45 for the CMC-MWCNT and 0.7 for the CMC-MWCNT-IL nanocomposite film. This confirms the successful functionalization of MWCNT.

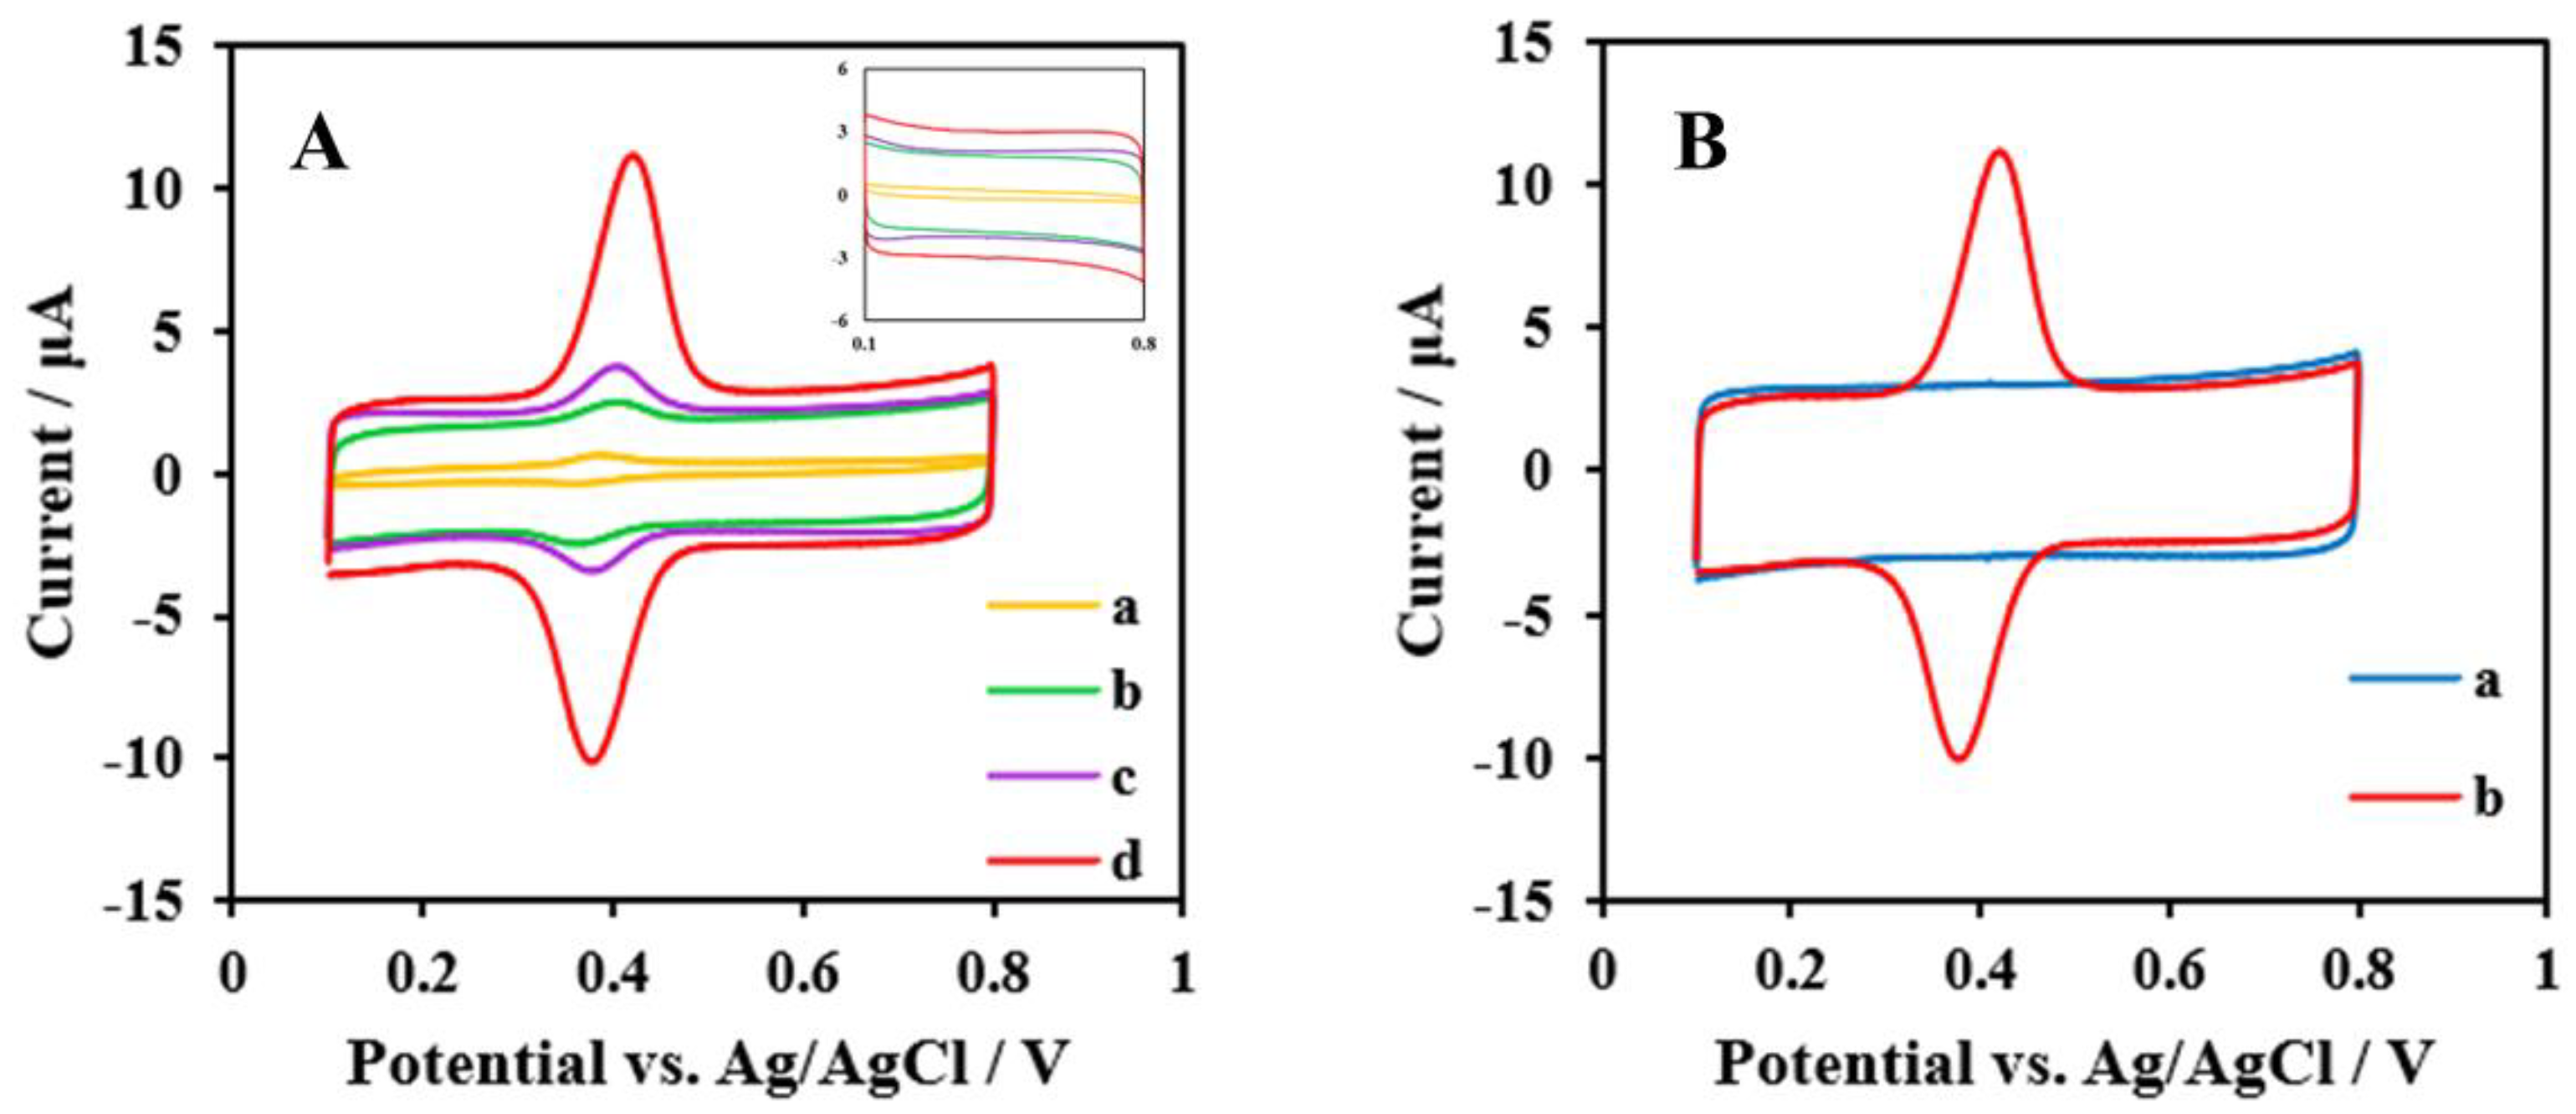
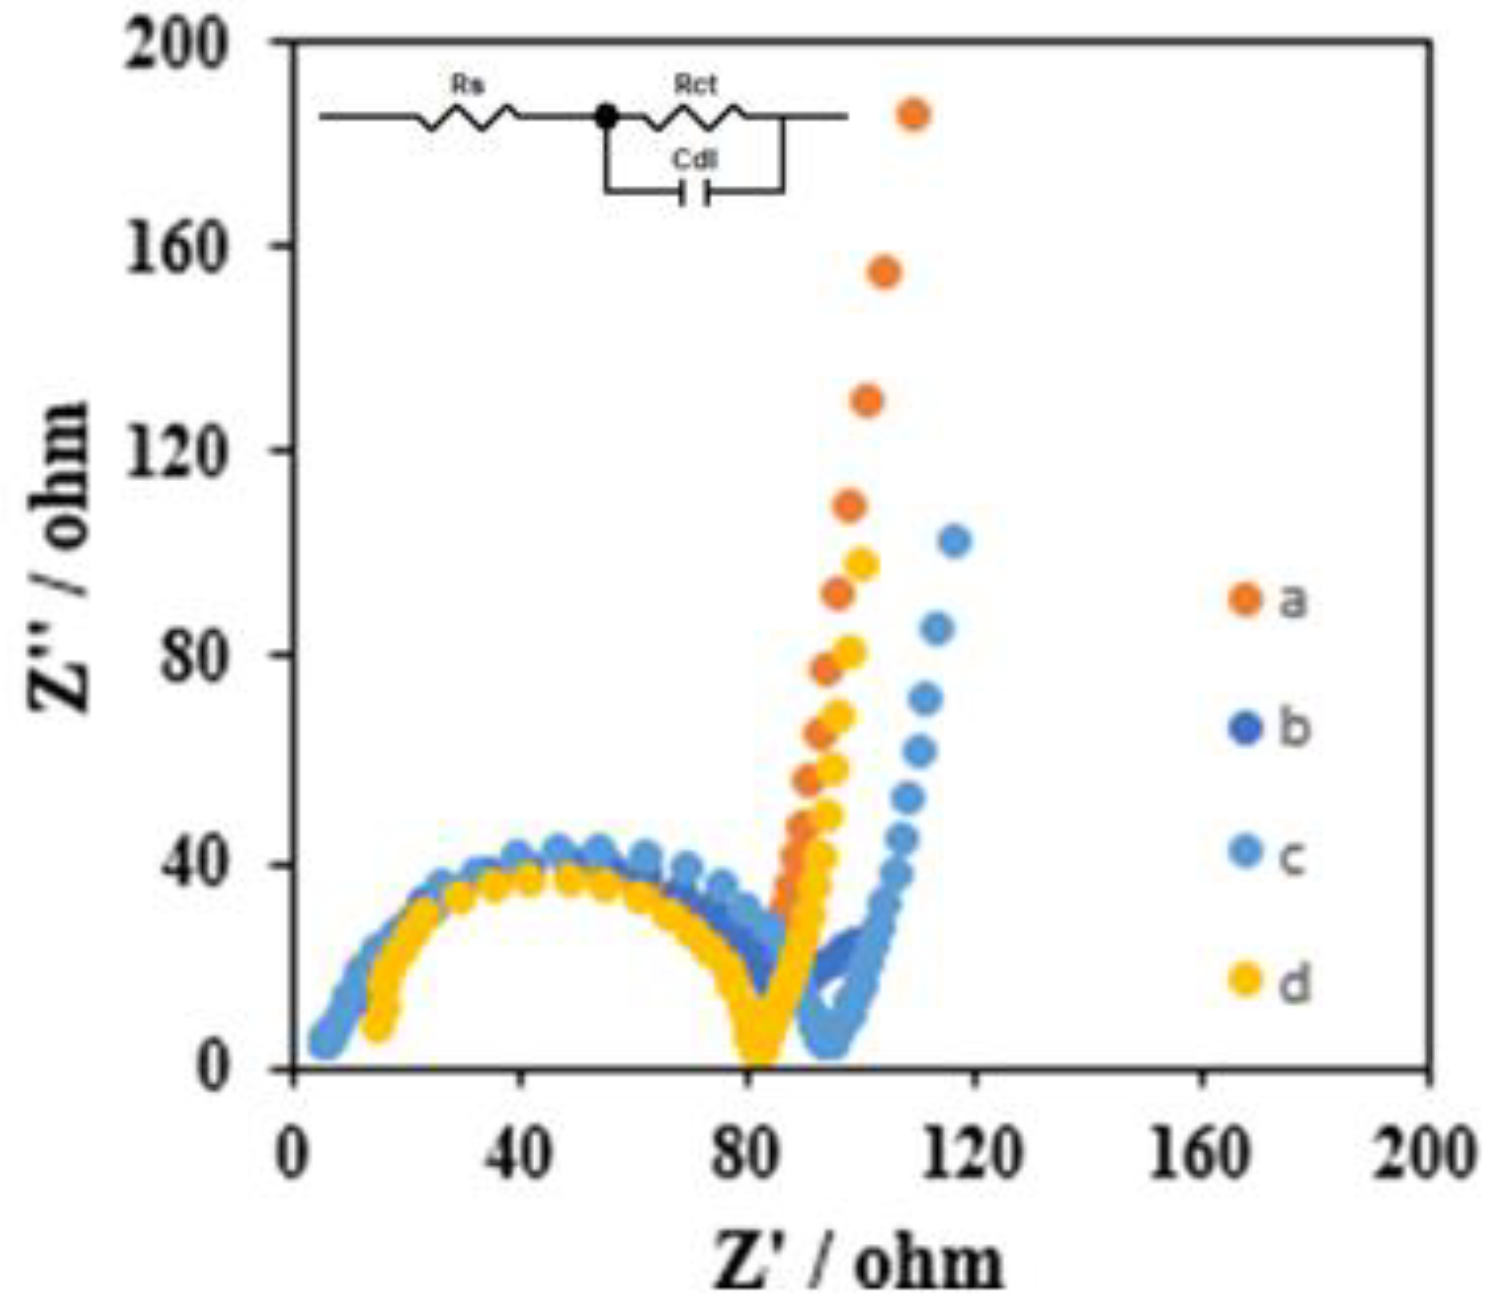
3.2. Electrochemical Characterization of Nanomaterial-Modified GCEs

CV and EIS can provide information about the electrochemical properties of these different modified GCEs. The electrochemical evaluation of every modification step on the electrode was carried out using the CV method in 50 mM phosphate-buffer solution containing 5 μM rutin and EIS in 5 mM [Fe(CN)6]3−/4− solution of 0.1 M KCl. The CV measurements of the bare GCE, NF/MWCNTs/GCE, NF/CMC-MWCNTs/GCE, and NF/IL/CMC-MWCNTs/GCE are shown in Figure 3A. On the basis of the CV measurements, it can be seen from Figure 3A that the bare GCE (curve a) had an extremely weak redox peak, whereas the NF/MWCNTs/GCE (curve b) had an obvious redox peak compared to the bare GCE, which is attributed to the electroconductibility of MWCNTs. The NF/CMC-MWCNTs/GCE (curve c) had a better redox signal than curve b, which might have been due to the improved dispersion of multi-walled carbon nanotubes by CMC, which further improved its conductivity. After the modification of the NF/CMC-MWCNTs/GCE with IL (curve d), the strongest redox peaks occurred at 0.421 V and 0.377 V. The difference potential (ΔE) was 44 mV [49]. The anodic peak current (Ipa) and cathodic peak current (Ipc) were 11.13 μA and 10.07 μA, respectively, with a peak-current ratio (Ipc/Ipa) of about 1, which indicates that the direct electrochemistry of rutin on the modified GCE was quasi reversible. Moreover, the embedded graph of Figure 3A shows that there was no redox response at these different modified GCEs in the absence of rutin. Meanwhile, Figure 3B shows the CVs of NF/IL/CMC-MWCNTs/GCE in the absence (curve a) and presence (curve b) of 5 μM rutin in 50 mM phosphate-buffer solution. It can be observed from Figure 3B that in the absence of rutin there were no redox signals generated, but when rutin existed obvious strong, sensitive, and reversible redox peaks were produced, which were acquired from the cyclic voltammograms. These results manifest that rutin is an electro-active substance that can produce a redox reaction on the electrode and shows a strong redox-current signal. In addition, the reaction process of rutin on the electrode is as follows: rutin is oxidized to quinone on the electrode and it then reacts with the active hydroxyl group on the glassy carbon electrode. In fact, the two pathways by which electrochemical oxidation occurs are closely related to the two catechol hydroxyl groups and the other two hydroxyl groups. At low potential for rutin, the two hydroxyl groups on the C ring first contribute two electrons and participate in a reversible oxidation reaction that eventually forms rutin orthoquinone. The second oxidation occurs at a more positive potential and may correspond to the interconversion of the 7-hydroxyl and -oxygen radicals in the A-ring, which in turn promotes the subsequent oxygen-precipitation reaction, and the former substance is regenerated. The final oxidation reaction occurs at a more positive potential and the product does not have the structural features of a flavonoid [15,33]. The oxidation-reaction process of rutin on the electrode only involves rutin losing two electrons on the electrode, producing quinone and two protons at the same time. Furthermore, the proposed reaction mechanism of rutin on the electrochemical sensor is shown in Scheme 1.
EIS measures the impedance at the electrode/solution interface and take into account both types of currents: capacitive (C) and resistance (R) [50]. The change in the impedance components (charge-transfer resistance, Rct; and double-layer capacitance, Cdl) directly expresses the solution composition or the binding occurring at the electrode/solution interface [43]. EIS can offer some information with regard to the different modified electrodes on the impedance variations of the electrode surface during the different modified process. In the Nyquist diagrams, the Rct corresponds to the semicircular part, whereas the linear part represents the diffusion processes [51]. Explicitly, the Rct value can change with the variations in the charge distribution on the sensor surface and other factors, such as the change in the surface’s hydrophobicity [52]. The smaller the charge-transfer resistance (Rct), the better represented the electron-transfer kinetics at the sensor interface [53]. Usually, we can compute the diameter of the semicircle to get the value of Rct, which illustrates that the electron’s transport on the electrode’s surface is faster. The impedance data from the Nyquist plots were fitted on the basis of the Randle equivalent-circuit model in Figure 4 (inset). Then, the Rct values of the bare GCE (curve a), NF/MWCNTs/GCE (curve b), NF/CMC-MWCNTs/GCE (curve c), and NF/IL/CMC-MWCNTs/GCE (curve d) were determined to be 91.08, 84.28, 83.39, and 71.46 Ω, respectively (Figure 4). It was shown that the Rct value of NF/CMC-MWCNTs/GCE (84.28 Ω) was below the Rct value of NF/MWCNTs/GCE (84.28 Ω) and bare GCE (91.08 Ω), which demonstrates that MWCNTs possess the predominant conductivity and the dispersion of MWCNTs by CMC perhaps are capable of increasing the effective transfer area of the electron and electron-transfer rate on the electrode surface. The Rct of NF/IL/CMC-MWCNTs/GCE (71.46 Ω) was further decreased, which can be interpreted as IL having good electrical conductivity, which can further enhance the electron-transport rate on the electrode surface. The Rct value decreased with the increase in electron-transfer rate, which also corresponds with the results of the CVs on different modified electrodes.

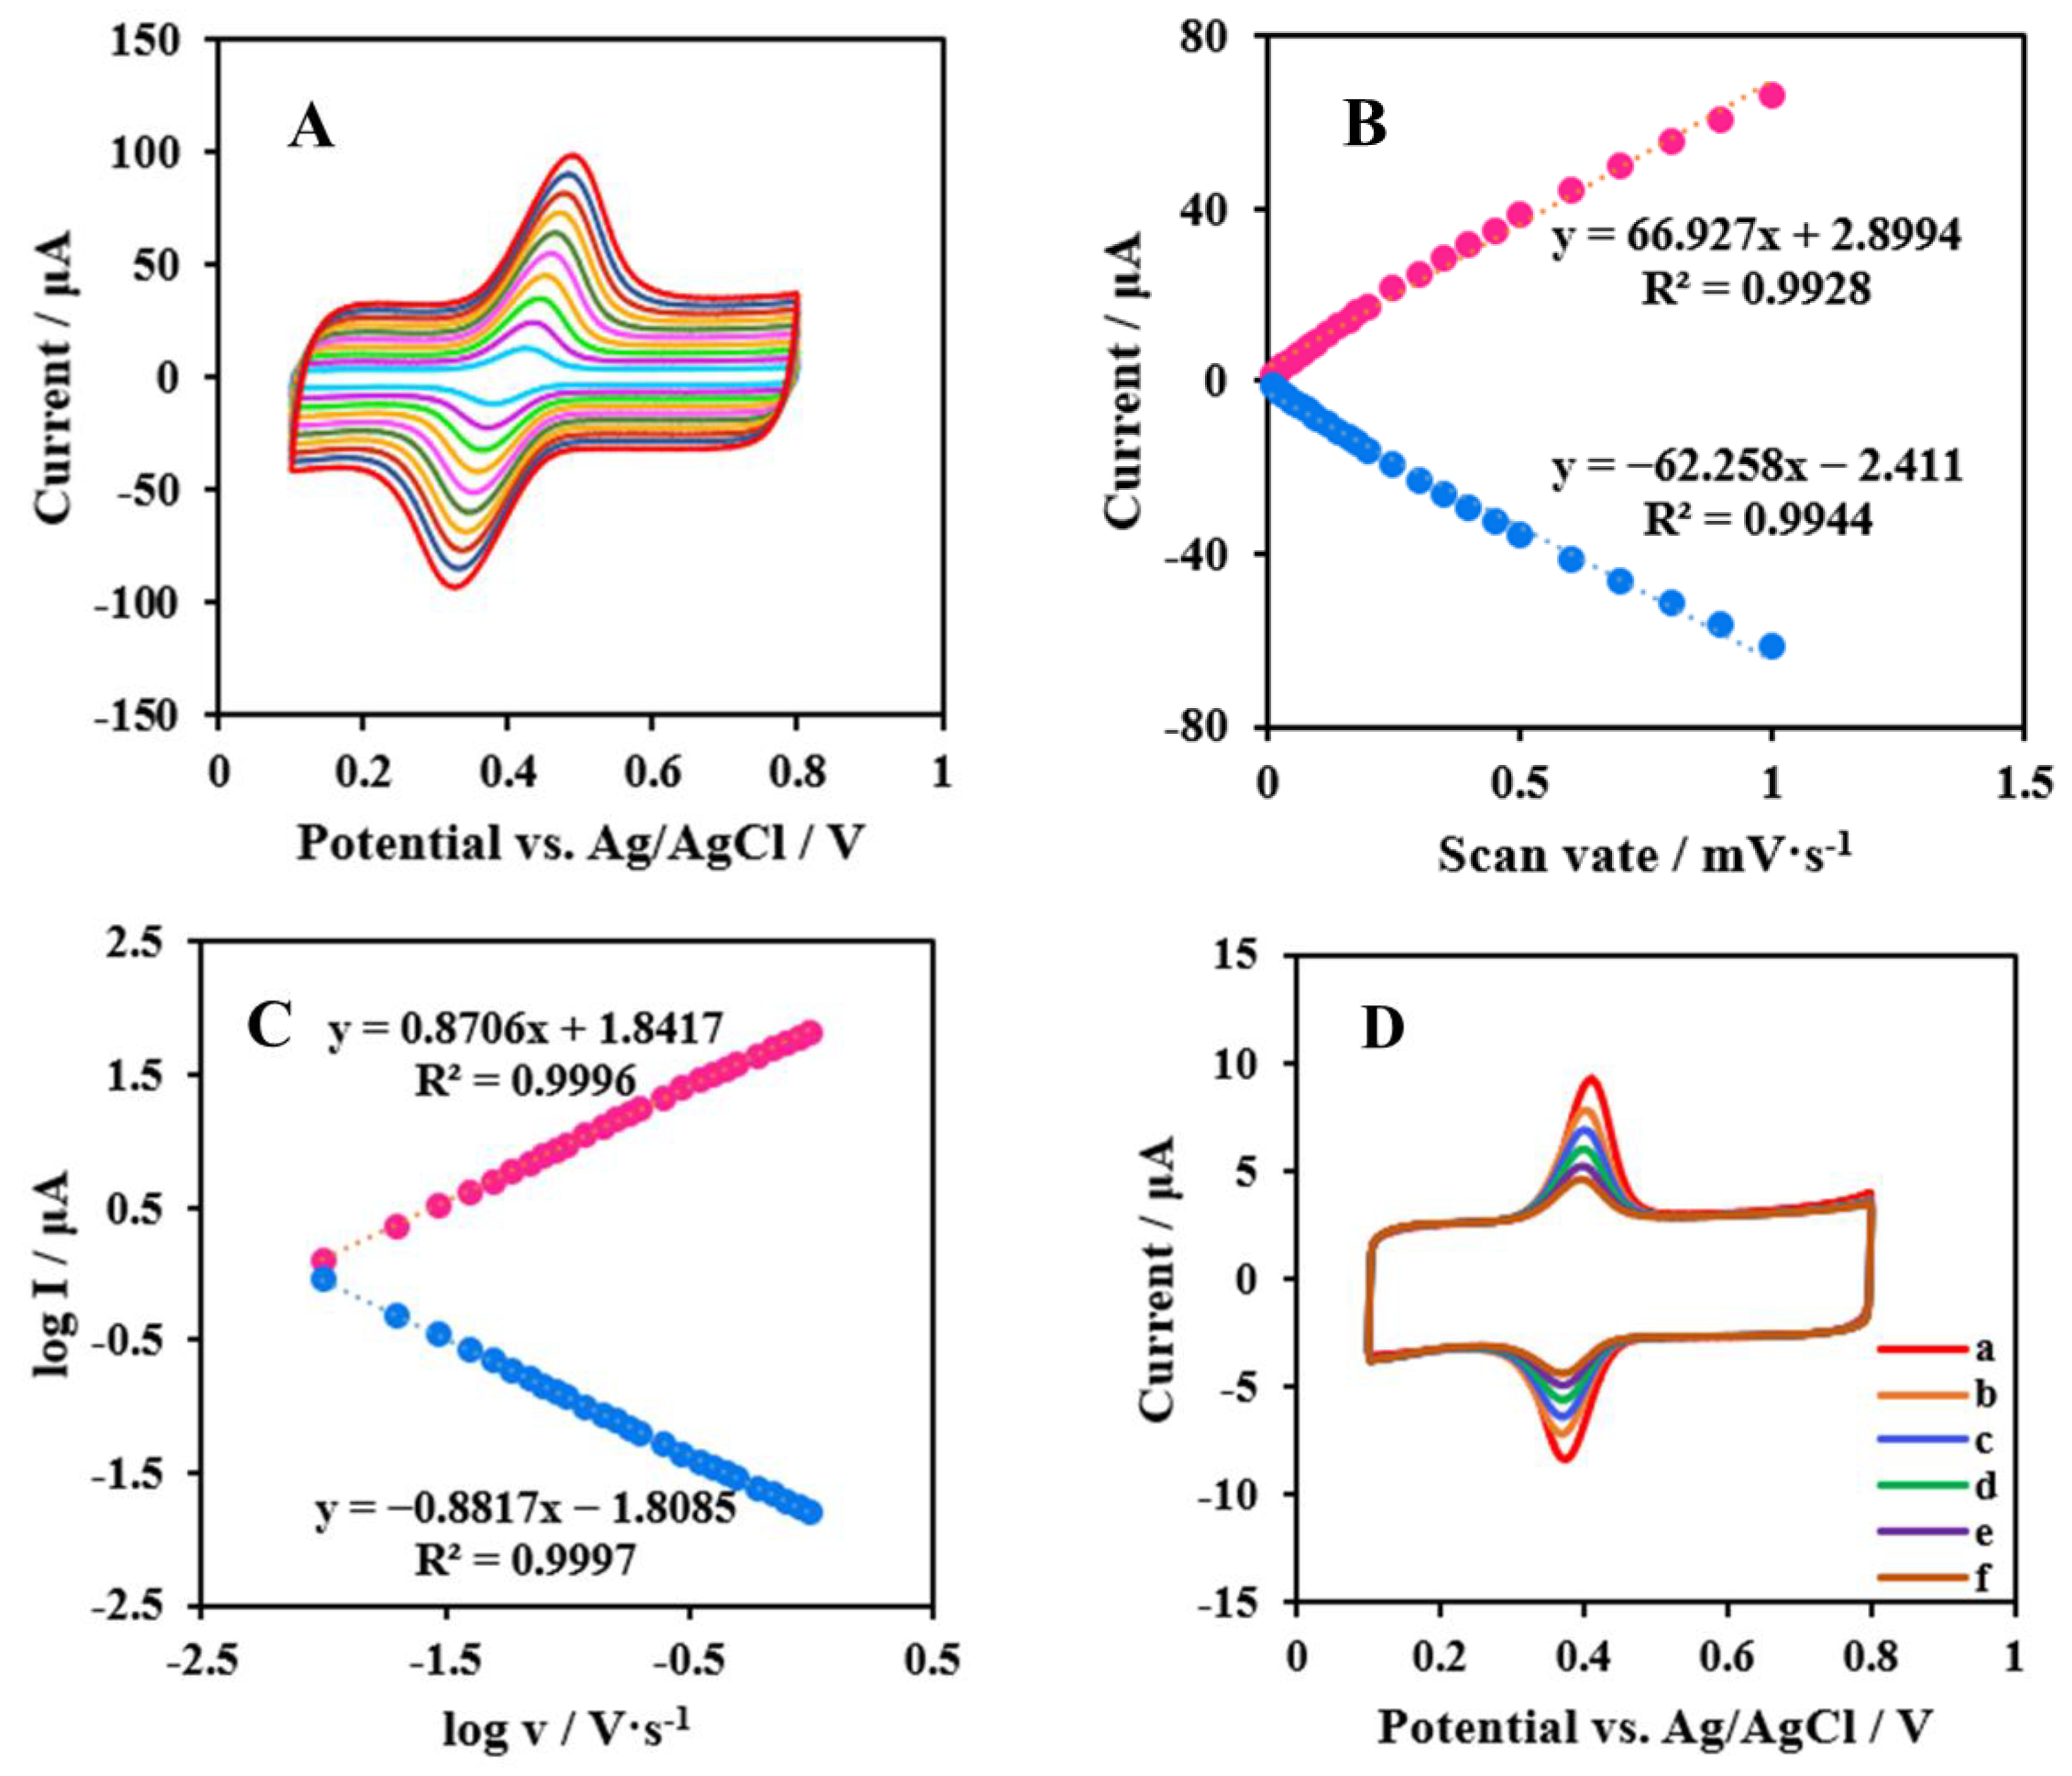
3.3. Effects of Scan Rates

CVs of NF/IL/CMC-MWCNTs/GCE at different scan rates were carried out in the presence of 5 μM rutin and the results are shown in Figure 5A; thus, it can be seen that the redox peak currents increased with the increase in scanning speed. Figure 5B shows the relationship between different scan rates and peak currents, which maintained a great linear relationship. The regression equations were Ipa = 66.927v + 2.8994 (R2 = 0.9928) and Ipc = −62.258v − 2.411 (R2 = 0.9944). It can be seen from Figure 5C that the absolute slope values of log I vs. log v were close to 1, which indicates that the electrochemical redox reaction of rutin on the modified electrode surface was an adsorption-controlled process. With that, we used the modified NF/IL/CMC-MWCNTs electrode after measuring with the different scan rates in the blank phosphate-buffer solution with different scanning cycles (Figure 5D). In Figure 5D, the effect of different scanning segments on the CV process of the modified NF/IL/CMC-MWCNTs electrode after measuring with the different scan rates in the absence of rutin is shown, which suggests that the diffusion-controlled performance was slow. Moreover, it can be seen from Figure 5D that the redox-peak currents of the modified electrode decreased with the increase in scanning cycles. This proves that rutin could be released from the electrode surface into phosphate-buffered solution gradually, and this result that further validates the above conclusion.

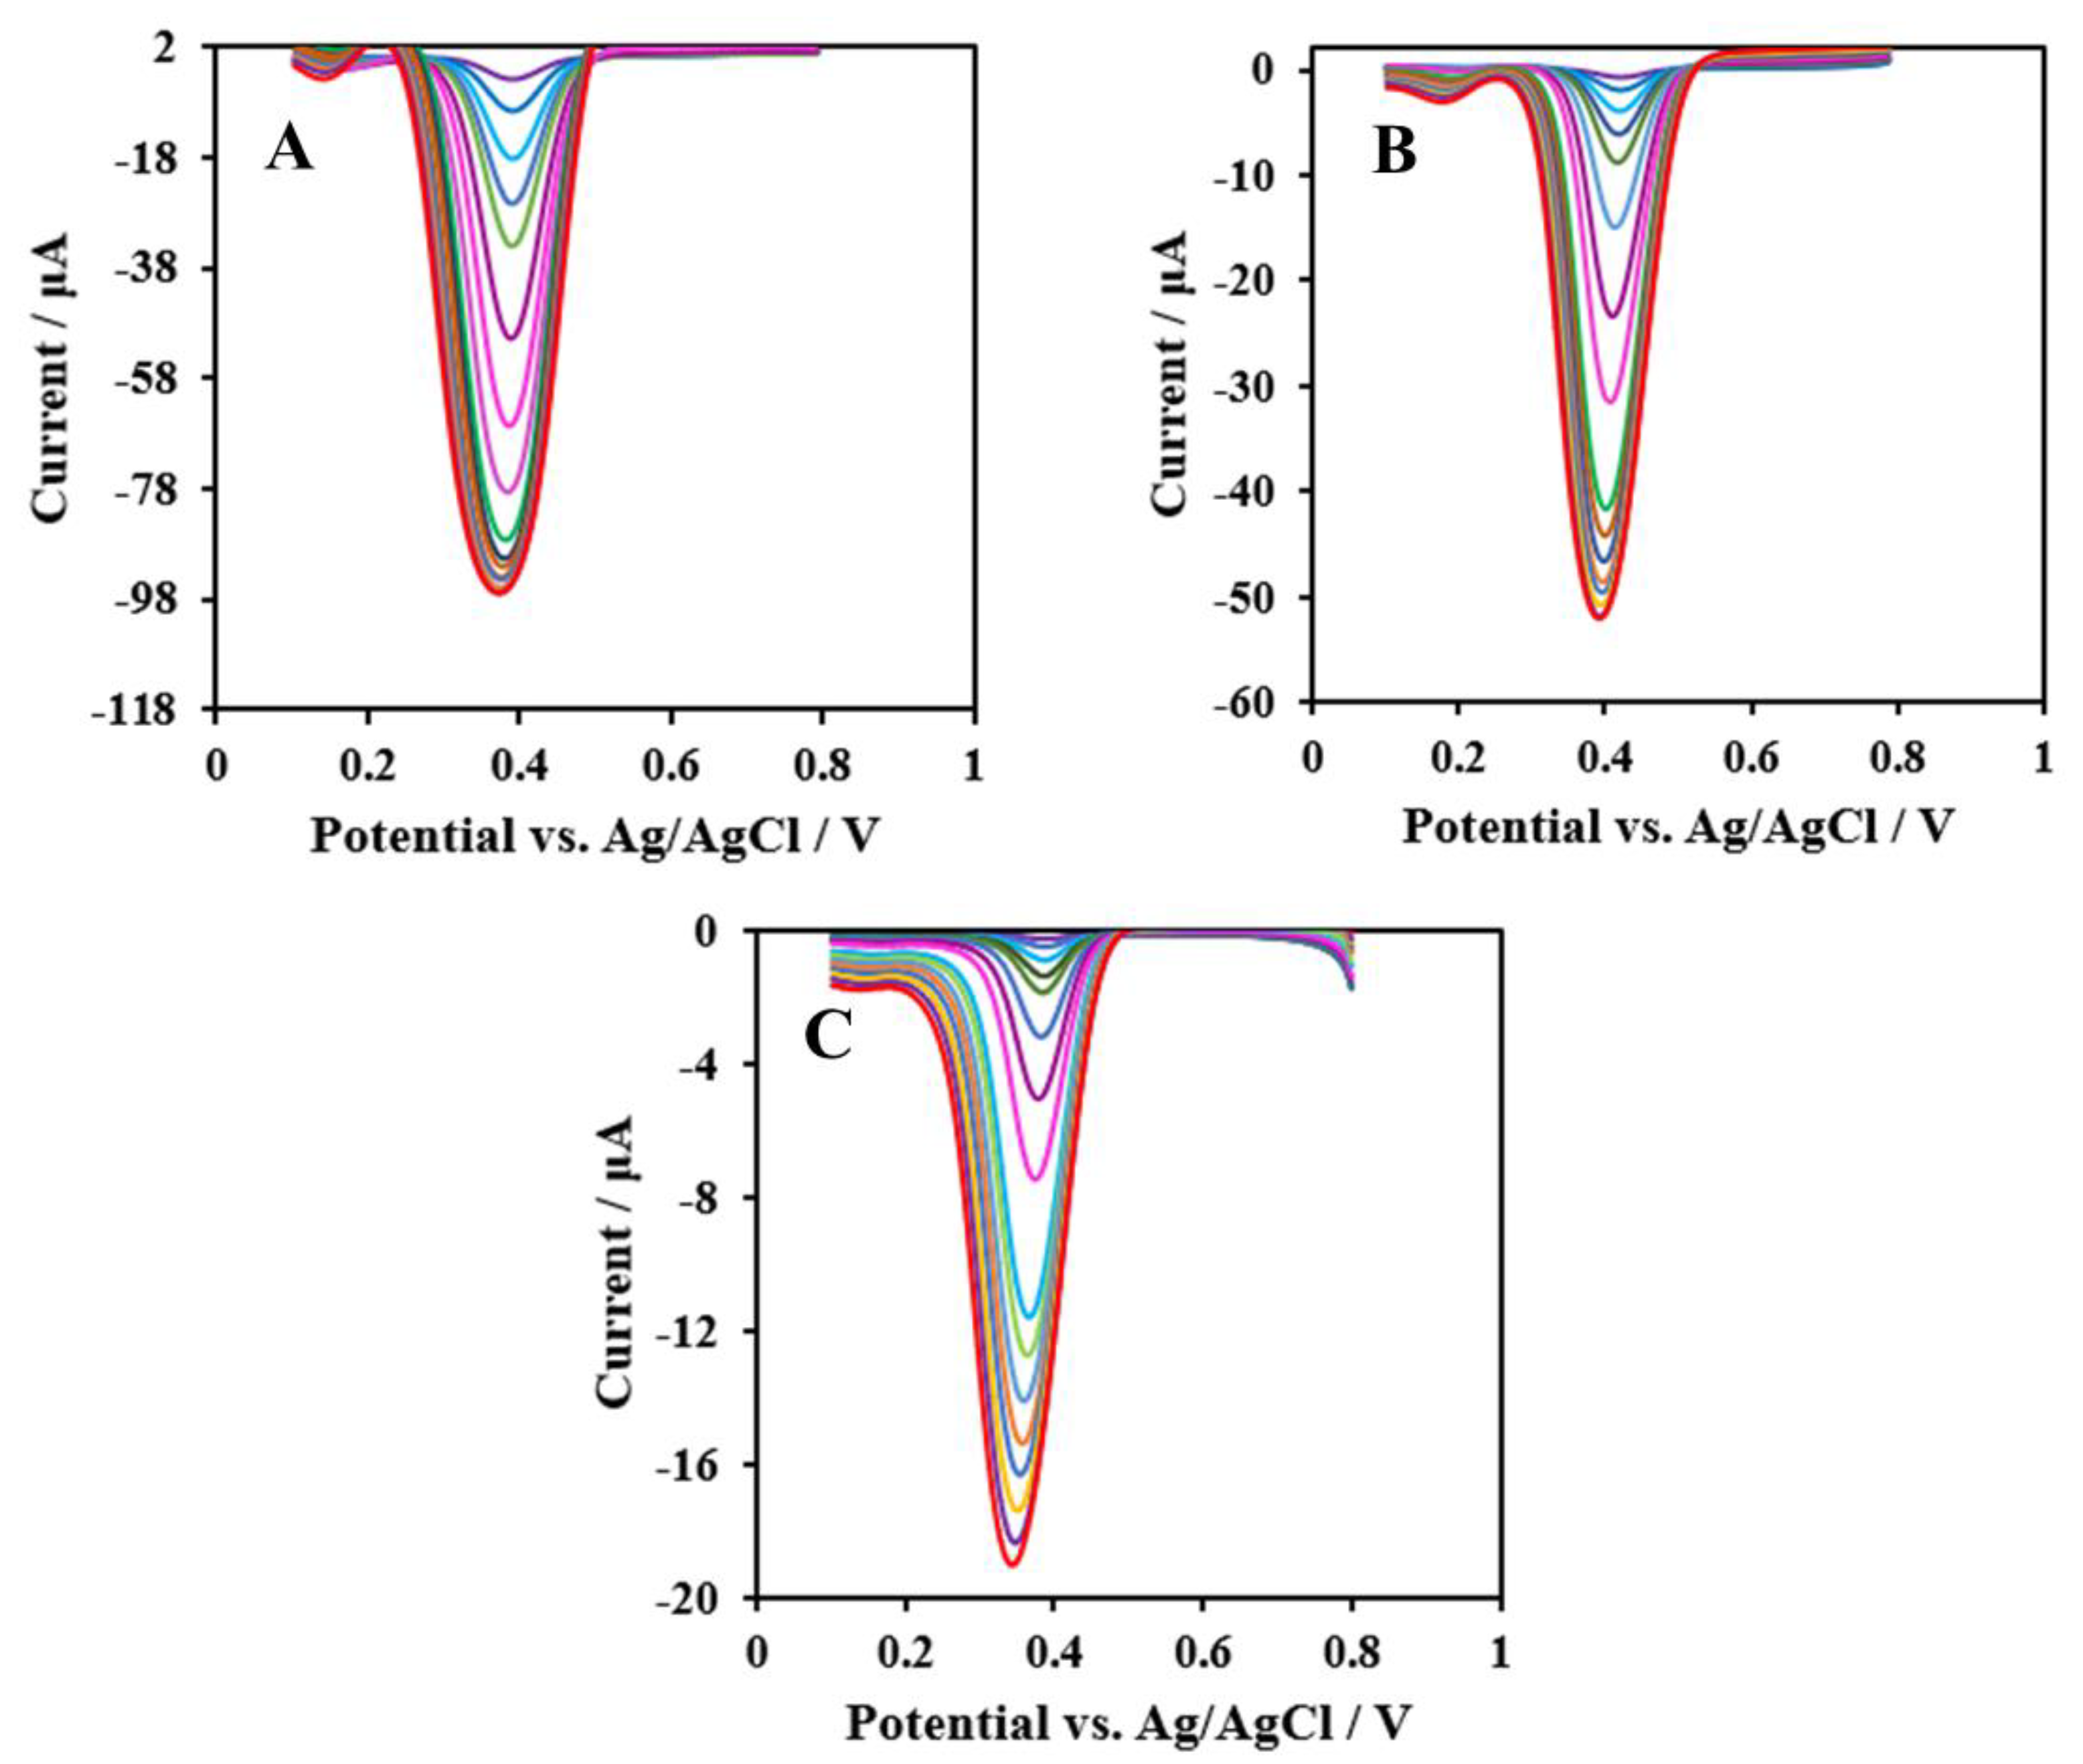
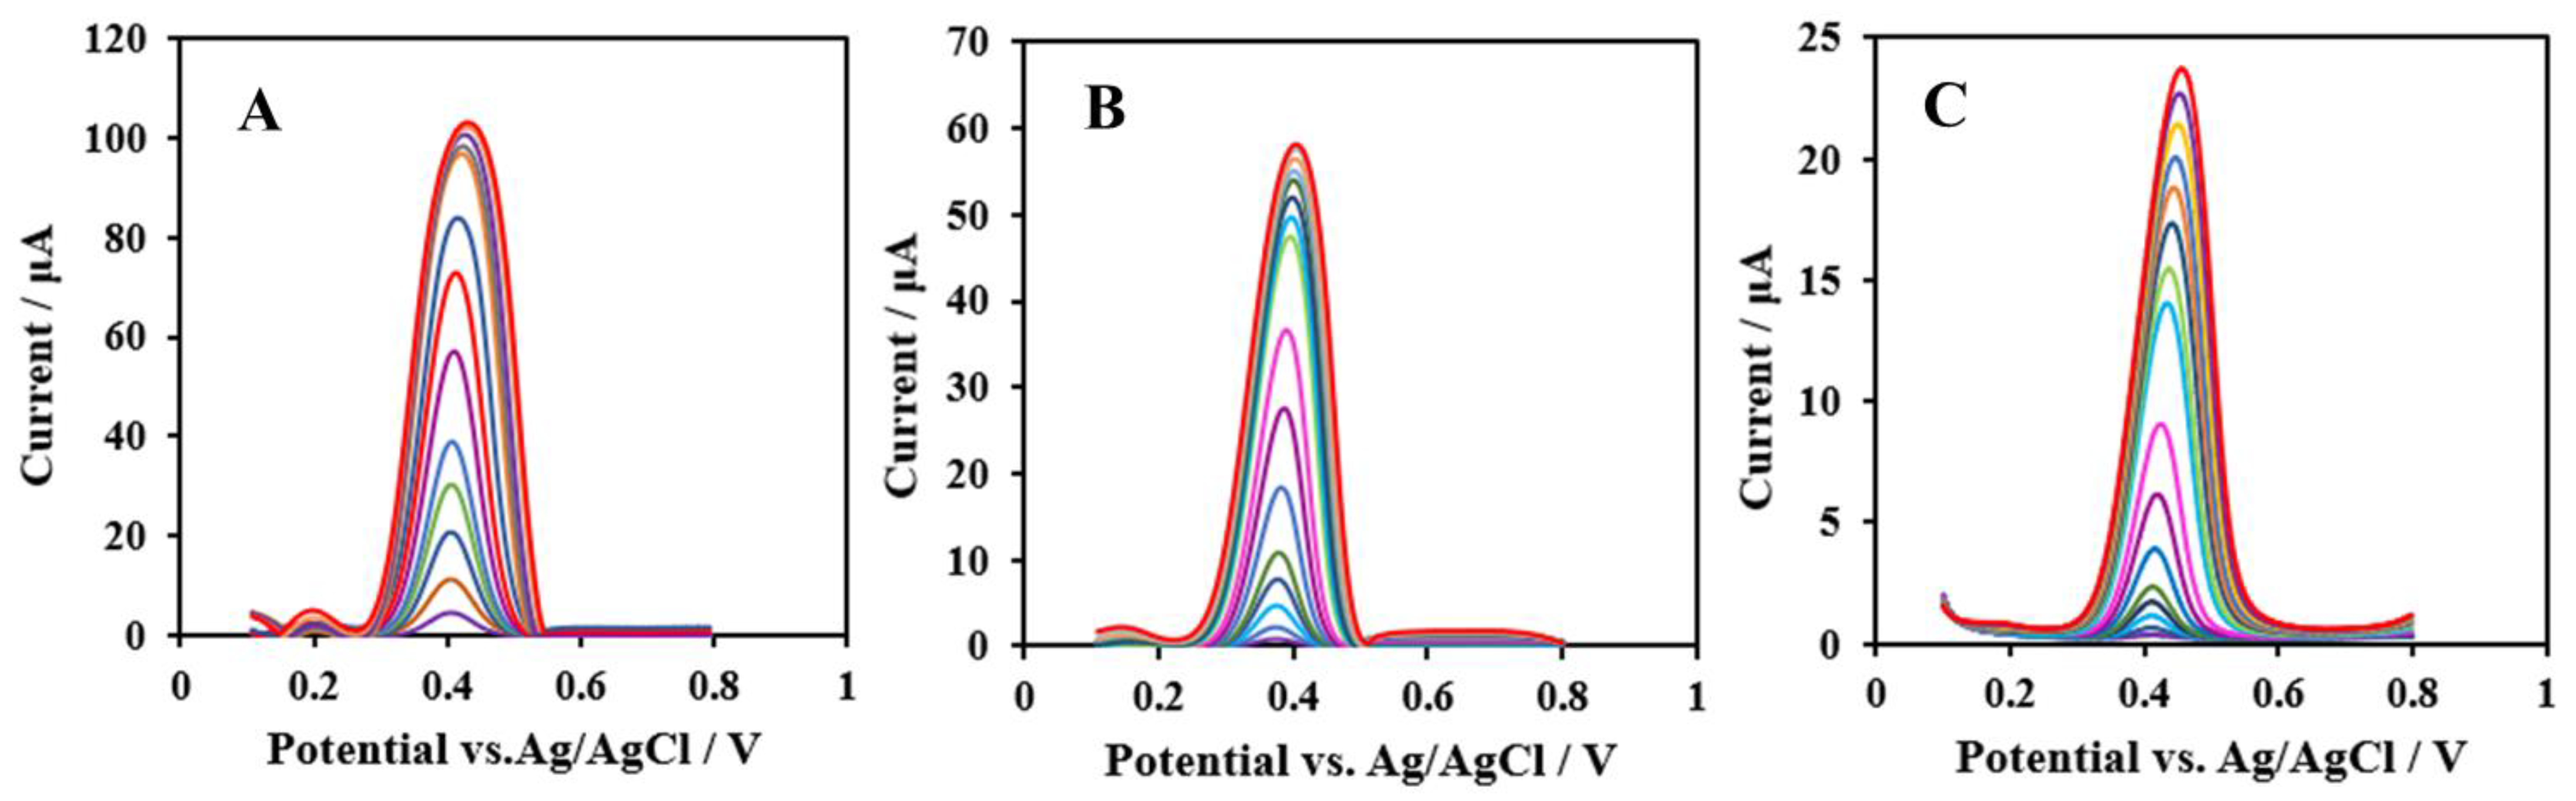
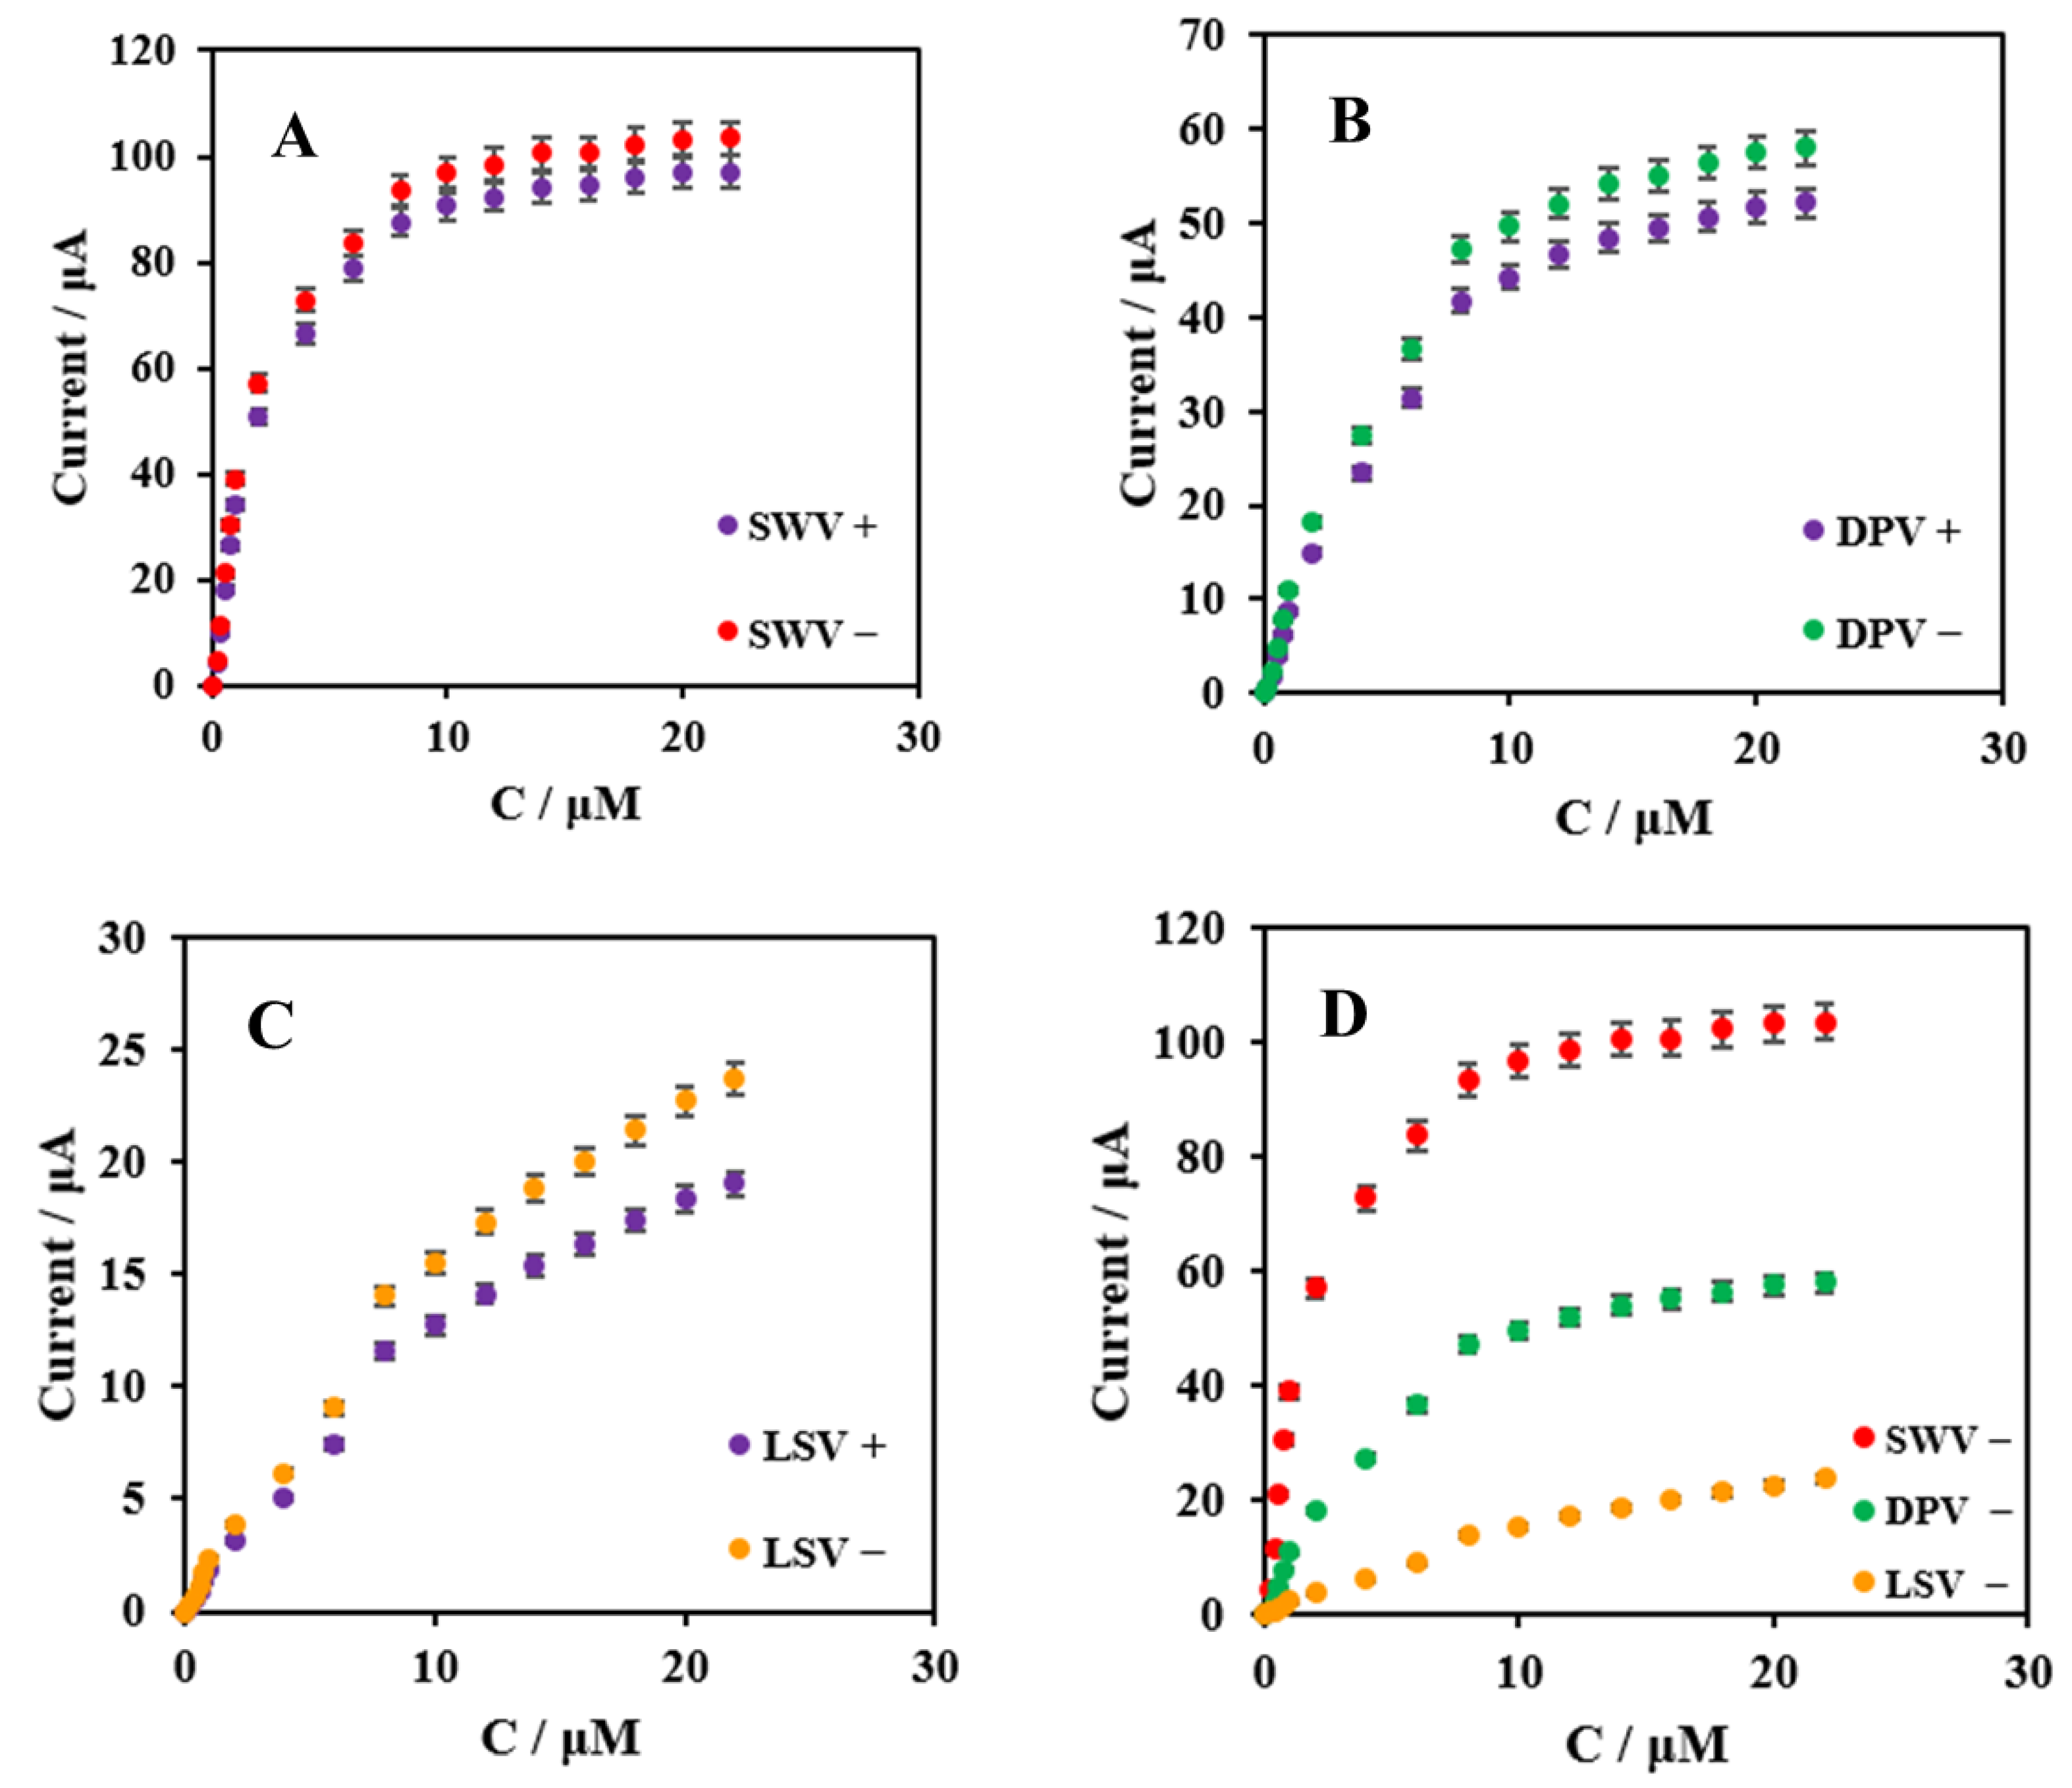
3.4. Different Methods of Rutin Measurement

To verify the optimal catalytic performance of the proposed electrochemical sensor, three different approaches were used to perform the measurements in this work. The electrochemical performance of the modified NF/IL/CMC-MWCNTs/GCE electrochemical sensor was measured using different concentrations (0.1 μM–20 μM) of rutin in 50 mM pH 5 phosphate-buffer solution by employing various testing methods, including square-wave voltammetry (SWV), differential-pulse voltammetry (DPV), and linear-sweep voltammetry (LSV). Figure 6A–C represents the reduction-peak current-response signals of the three different methods of SWV, DPV, and LSV, respectively. Figure 7A–C represents the oxidation-peak current-response signals of the three different methods of SWV, DPV, and LSV, respectively. It is clear that Figure 6A–C shows that with an increased in concentration of rutin from 0.1 μM to 20 μM the reduction-peak current response also increased markedly. At the same time, we further investigated the oxidation-peak current. It can be observed from Figure 7A–C that the oxidation-peak current increased distinctly with increasing rutin concentration (0.1 μM–20 μM) as well, which demonstrates that the oxidation-peak current was higher than the reduction-peak current.
In order to compare the sensitivity of different methods to detect rutin from Figure 6 and Figure 7 more intuitively, we plotted Figure 8. We can directly observe from Figure 8A–C that the oxidation-peak current-response signals of the three techniques were higher than that reduction-peak current-response signals. In addition, it is evident that the oxidation-peak response signal of the SWV method was the strongest, as seen in Figure 8D. Therefore, the SWV technique was pitched for the subsequent study. In addition, the redox-peak current-response signals increased significantly between the concentration of rutin in the range of 0.1 μM to 10 μM and increased slowly beyond the concentration of rutin at 10 μM, so we selected the rutin-concentration range of 0.1 μM to 10 μM as the subsequent accurate measurement in this paper.

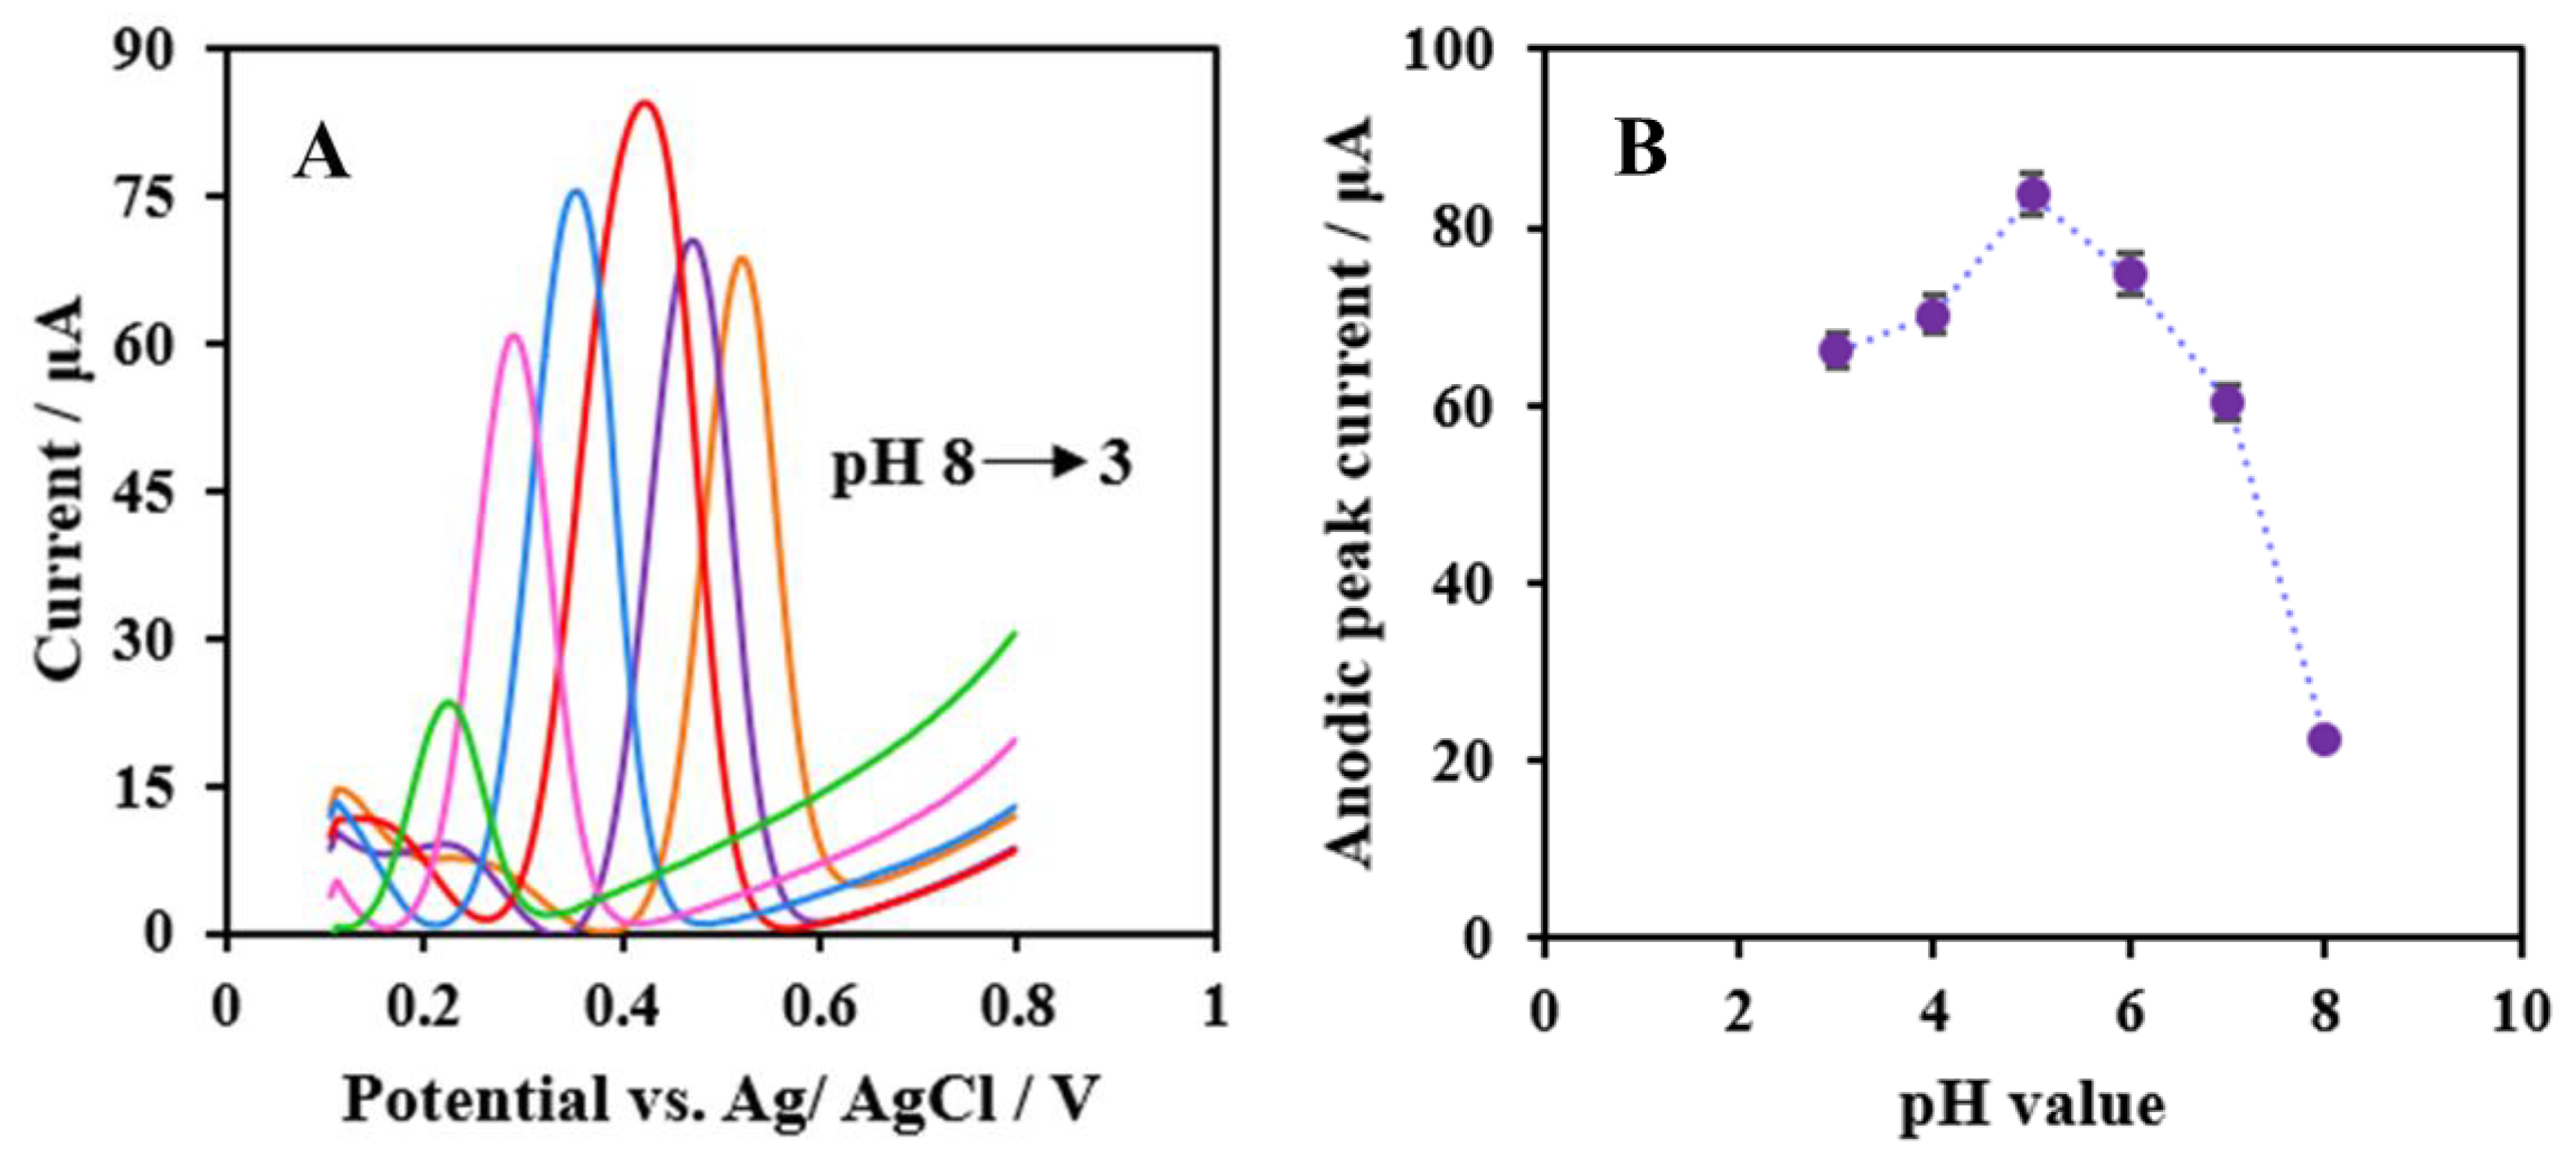
3.5. Effects of pH Values

The effects of the pH values of the phosphate-buffer-solution research on NF/IL/CMC-MWCNTs/GCE by the SWV method was carried out in the presence of 5 μM rutin, and the results are shown in Figure 9A. It can be observed that the oxidation-peak current was accompanied by an increase in the phosphate-buffer-solution pH value from 3 to 5, whereafter the current depreciated with a phosphate-buffer-solution pH value higher than 5. At the same time, it can be seen from Figure 9B that the oxidation-peak current reached a maximum value at the phosphate-buffer-solution pH value of 5. Therefore, pH 5 was selected as the optimal phosphate-buffer-solution pH value for the next test.

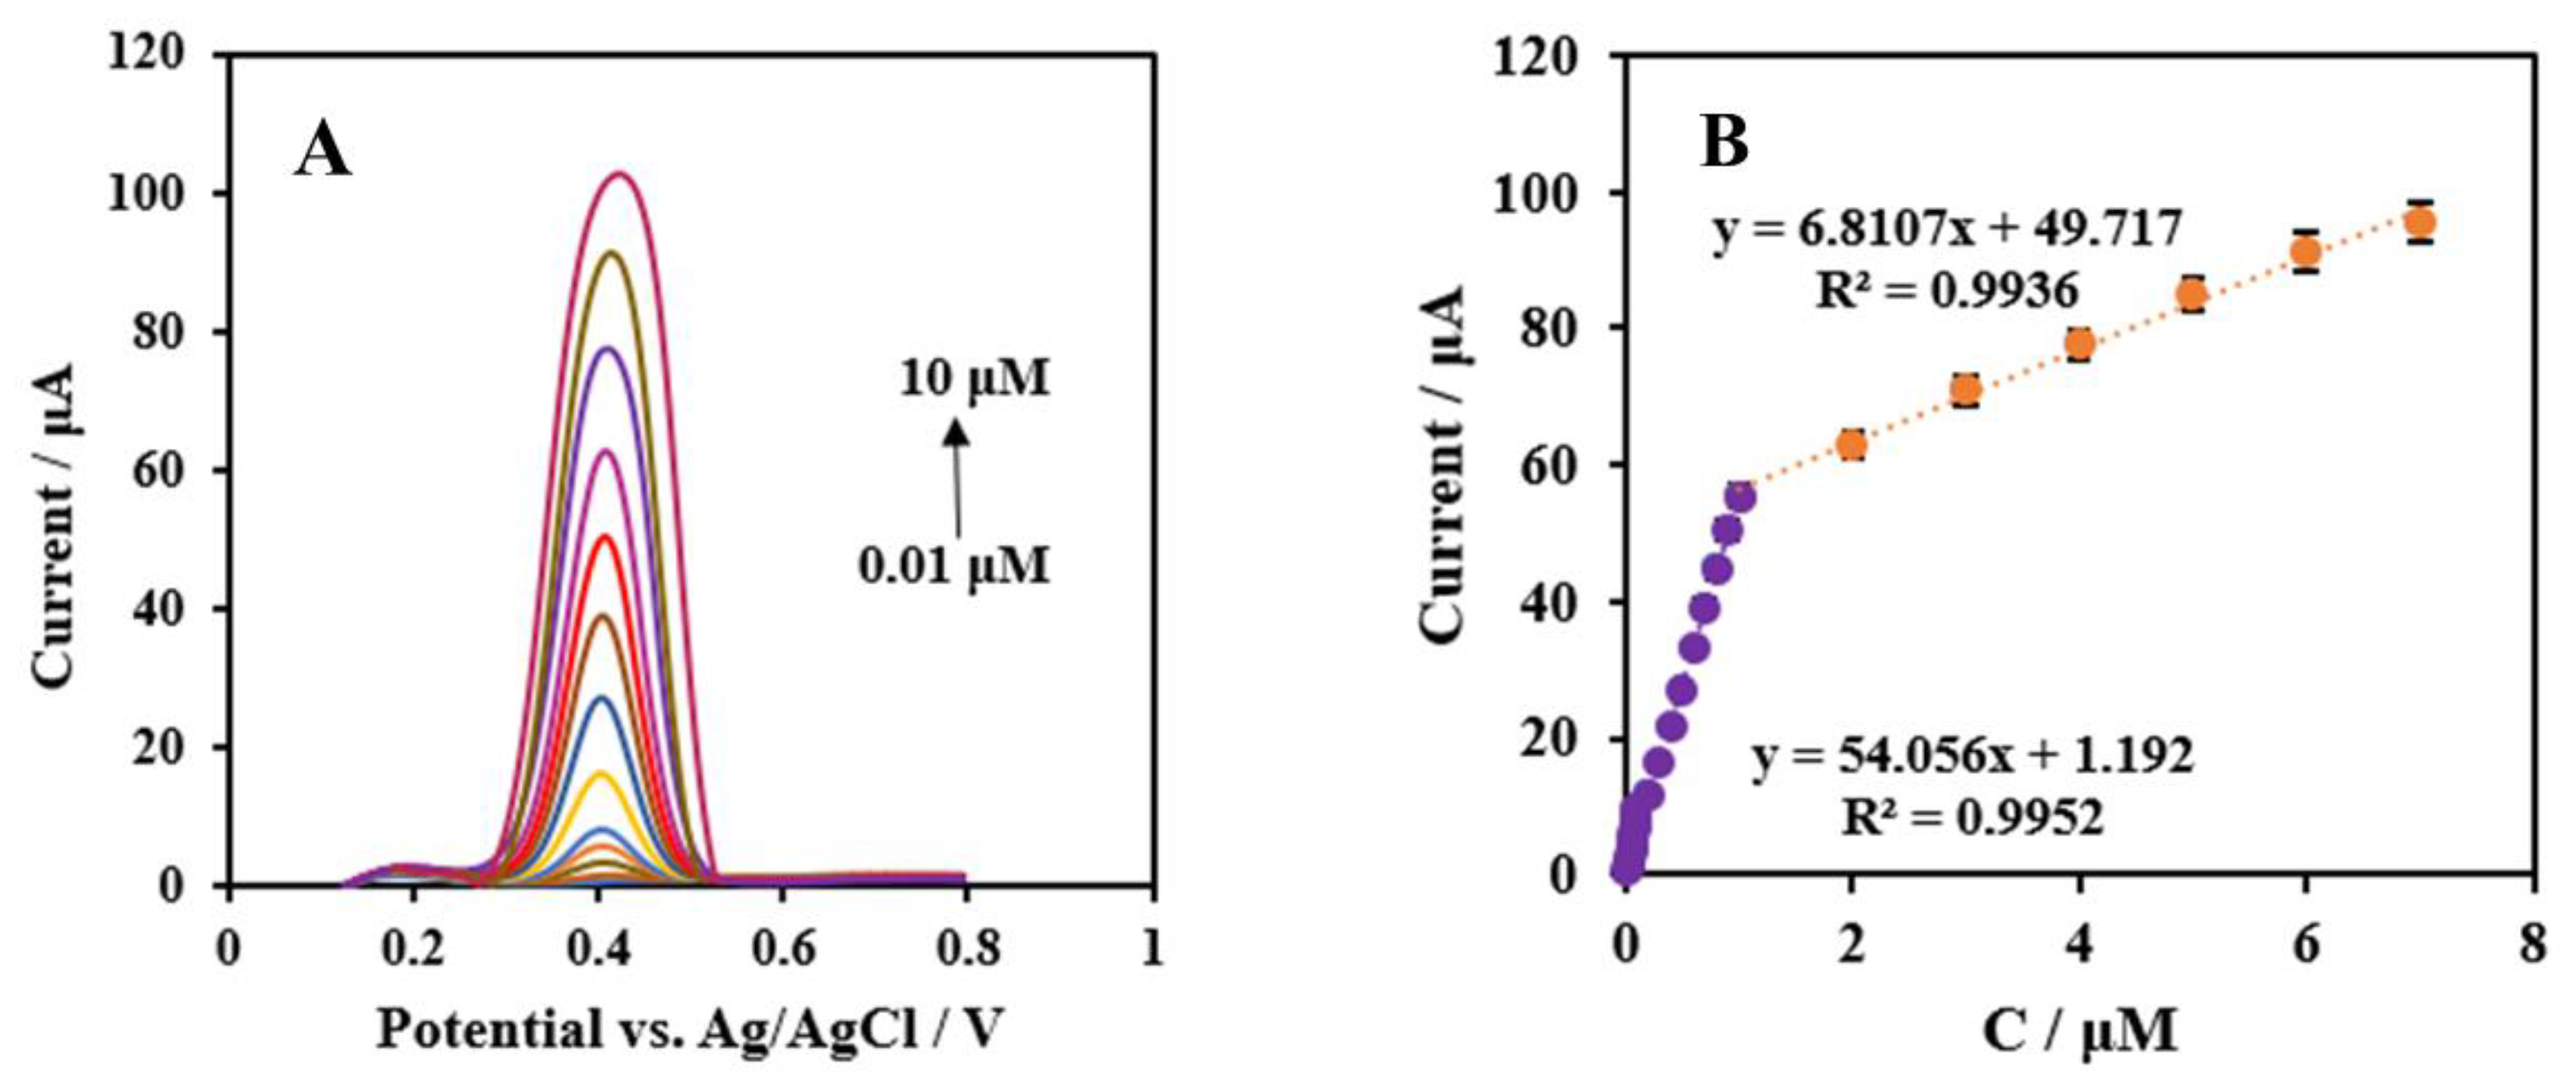
3.6. Precision Detection of Rutin

In order to study the precision and high-sensitivity measurement of the proposed electrochemical sensor for different concentrations of rutin, according to the study of different measurement methods described above, the SWV method was used to determine rutin on NF/IL/CMC-MWCNTs/GCE, and the results are shown in Figure 10A. And the results indicate that the oxidation-peak current increased distinctly with increasing concentrations of rutin. At the same time, Figure 10B shows the plot of the oxidation-peak current versus rutin in the concentration range of 0.01 μM to 10 μM. As can be seen from Figure 10B, the linear range of the NF/IL/CMC-MWCNTs/GCE response to rutin was divided into two linear segments: 0.01 μM–1 μM and 1 μM–10 μM, with regression equations of I (μA) = −54.056Crutin (μM) − 1.192 (R2 = 0.9952) and I (μA) = −6.8107Crutin (μM) − 49.717 (R2 = 0.9936), respectively. The sensitivities of the proposed electrochemical sensor were 54.05 μAμM−1 and 6.81 μAμM−1, respectively, which were better than the different modified sensors that had been reported previously [54,55,56]. The values of the detection limit of this proposed electrochemical sensor was 0.83 nM and 6.6 nM, respectively (3S0/S, S0 and S represent the standard deviation measured under the blank solution and the slope of the linear-range curve, respectively) [48]. Table 1 shows the comparison between this work and other modified sensors in the earlier reported analytical performance of rutin sensors. It can be seen that the modified sensor proposed in this work had better sensitivity.

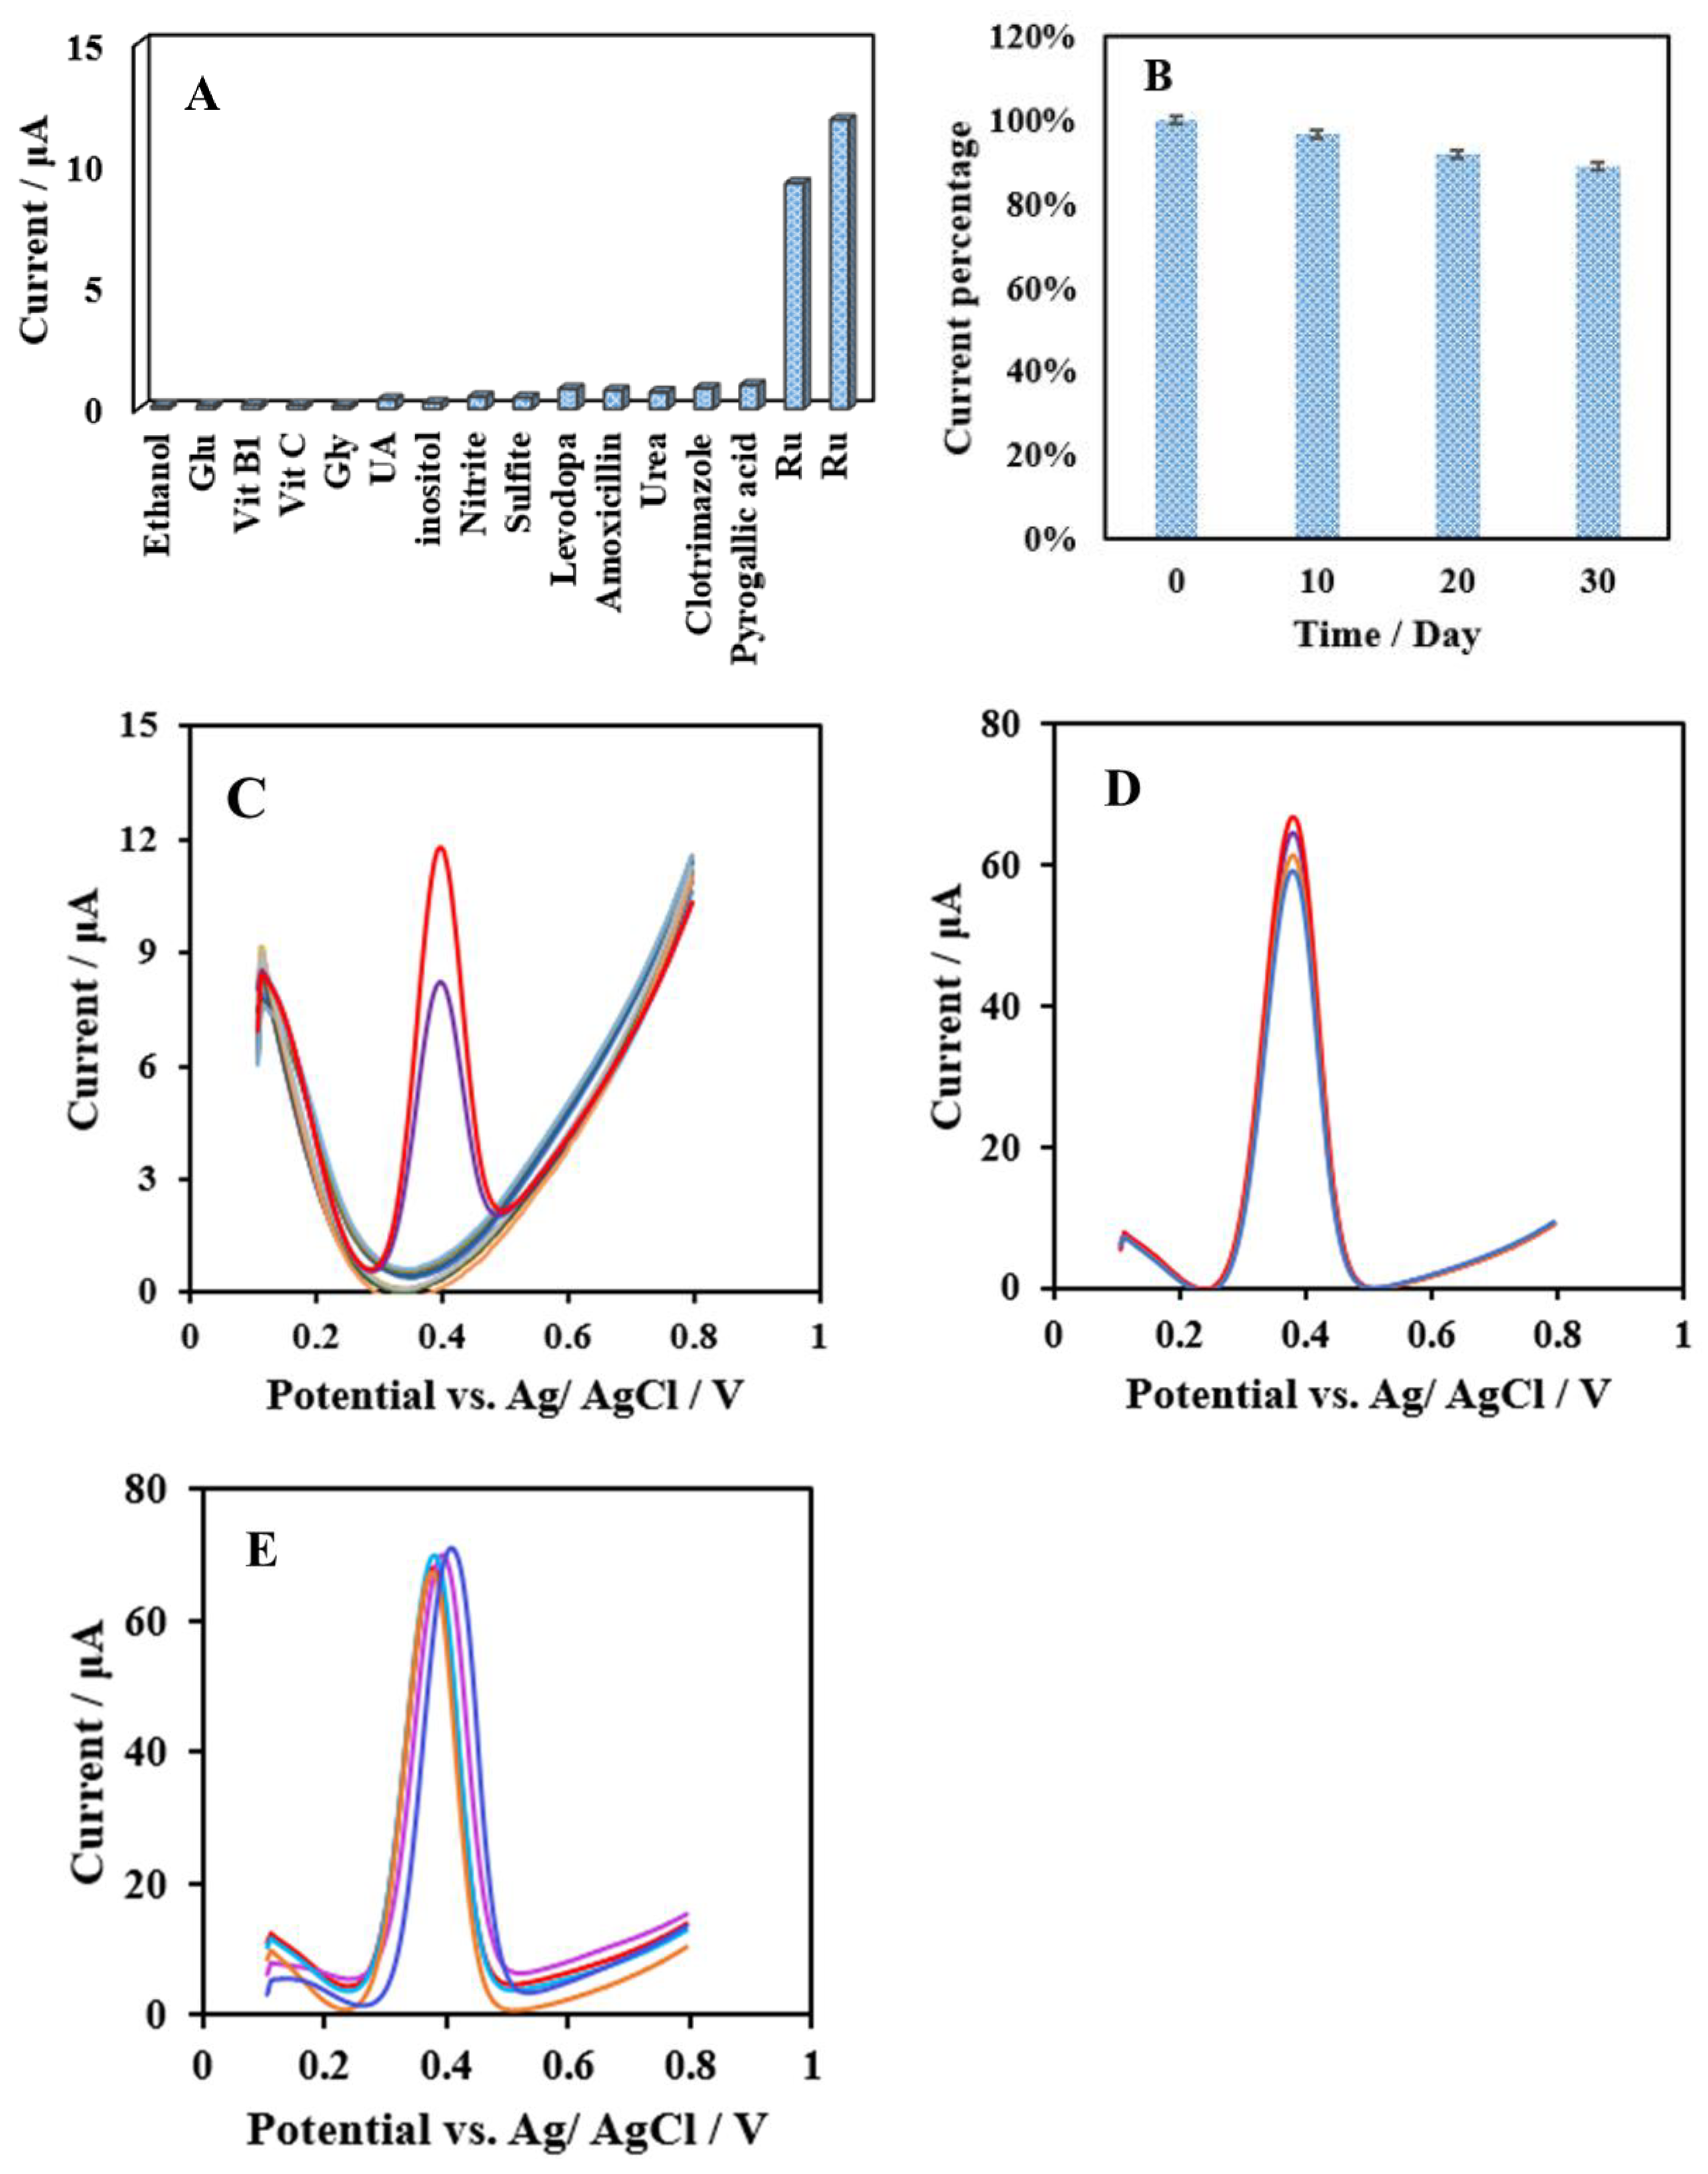
3.7. Anti-Interference Ability and Stability of the Modified Electrode

Anti-interference properties of the modified electrode electrochemical sensor were investigated by adding different interference substances using the SWV method. In Figure 11A, it can be seen that there was no obvious response when the interference substances—which were 500-fold concentrations (250 μM) of rutin (Ru), such as ethanol, glucose (Glu), vitamin B1 (Vit B1), ascorbic acid (Vit C), glycine (Gly) and uric acid (UA); 100-fold concentrations (50 μM), such as nitrite, sulfite, inositol, and urea; and 10-fold concentrations (5 μM), such as pyrogallic acid, levodopa, amoxicillin, and clotrimazole—were added to the detection solution. However, a strong current signal was produced when 0.5 μM rutin was added, indicating that this proposed electrochemical sensor had great selectivity and anti-interference performance.
To assess the stability of this electrochemical sensor, the modified GCE were checked in the presence of 5 μM rutin via the SWV method. After the modified electrode was stored at 4 °C for 10, 20, and 30 days, the oxidation-peak current decreased by 3.2%, 8.3%, and 11%, respectively (Figure 11B). The results show that the modified electrode had great storage stability. In addition, we prepared five parallel modified sensors in pH 5 phosphate-buffer solution containing 5 μM rutin to evaluate the reproducibility of these sensors. This study provided an RSD of 1.7% between the electrochemical measurements of the five sensors, indicating that the proposed sensors had good reproducibility. Moreover, the voltammograms of the interferent, stability, and reproducibility study are shown in Figure 11C–E, respectively.

3.8. Real-Sample Determination of Rutin in Tablets

Two types of rutin tablets were detected using this proposed electrochemical sensor. In this work, the UHPLC method was used to evaluate the accuracy of the NF/IL/CMC-MWCNTs/GCE electrochemical sensor. The results of the electrochemistry and UHPLC methods used to create rutin tablets (sample 1 and sample 2) with different concentrations are shown in Table 2. Meanwhile, the results show that the proposed electrochemical sensor had better accuracy, which indicates that the presented electrochemical sensor could be applied to the rapid quantitative determination of rutin concentration in the future.

4. Conclusions

In the present work, a novel and highly sensitive electrochemical sensor for the detection of low concentration of the flavonoid rutin was successfully proposed based on a modified glassy carbon electrode with sodium carboxymethylcellulose, multi-walled carbon nanotubes, and 1-butyl-3-methylimid. The results of TEM and EIS show that CMC could disperse the multi-walled carbon nanotubes well and synergistically interact with IL to improve the conductivity of the nanocomposites. Effects of scan rates indicate that the electrochemical redox reaction of rutin on the modified electrode surface was an adsorption-controlled process. Different methods of rutin measurement show that SWV was the most suitable technique for rutin determination in this work. In precision detection of rutin, the prepared NF/IL/CMC-MWCNTs/GCE exhibited good electrical conductivity and a low limit for rutin detection, with detection limits of 0.83 nM and 6.6 nM (S/N = 3), respectively. In addition, through interference experiments by adding different interfering substances, this proposed electrochemical sensor demonstrated good selectivity for rutin. After storage at 4 °C for 30 days, the results show that the modified electrode had great storage stability. The reliability of this electrochemical sensor was demonstrated by analyzing two different rutin tablets, which were produced by different manufacturers. The results were tested by ultra-high-performance liquid chromatography as a comparison, and the results show that this electrochemical sensor had good accuracy. Thus, the NF/IL/CMC-MWCNTs/GCE electrochemical sensor for the rutin-testing results demonstrated a low detection limit, great anti-interference capacity and stability, and good accuracy. The proposed electrochemical sensor has latent utility value in actual content detection of drugs.

Author Contributions

Conceptualization, X.M. and J.H.; methodology, J.H.; software, X.M.; validation, X.M., J.H., B.-L.X. and X.-Y.S.; formal analysis, X.M.; investigation, X.M.; resources, J.H.; data curation, X.M. and J.H.; writing—original draft preparation, X.M.; writing—review and editing, X.M., J.H., B.-L.X., X.-Y.S., X.-X.M., Y.-Y.L. (Yang-Yang Li), L.-L.M., Y.-J.C., Y.-Y.L. (Yu-Ying Li), K.-X.X., T.H., J.-S.W. and A.A.M.-M.; visualization, X.M.; supervision, T.H., J.H. and B.-L.X.; project administration, X.M. and J.H.; funding acquisition, J.H. All authors have read and agreed to the published version of the manuscript.

Funding

This research was funded by the National Natural Science Foundation of China (NSFC, grant number 32161143021) and the Iran National Science Foundation (INSF, grant number 4001873).

Institutional Review Board Statement

Not applicable.

Informed Consent Statement

Not applicable.

Data Availability Statement

Not applicable.

Acknowledgments

The National Natural Science Foundation of China (NSFC, grant number 32161143021), the Research Council of the University of Tehran and the Iran National Science Foundation (INSF, grant number 4001873) are gratefully acknowledged.

Conflicts of Interest

The authors declare no conflict of interest.

References

  1. Enogieru, A.B.; Haylett, W.; Hiss, D.C.; Bardien, S.; Ekpo, O.E. Rutin as a Potent Antioxidant: Implications for Neurodegenerative Disorders. Oxidative Med. Cell. Longev. 2018, 2018, 6241017. [Google Scholar] [CrossRef] [PubMed] [Green Version]
  2. Fabjan, N.; Rode, J.; Košir, I.J.; Wang, Z.; Zhang, Z.; Kreft, I. Tartary Buckwheat (Fagopyrum tataricum Gaertn.) as a Source of Dietary Rutin and Quercitrin. J. Agric. Food Chem. 2003, 5122, 6452–6455. [Google Scholar] [CrossRef] [PubMed]
  3. Ganeshpurkar, A.; Saluja, A.K. The Pharmacological Potential of Rutin. Saudi Pharm. J. 2017, 252, 149–164. [Google Scholar] [CrossRef] [PubMed] [Green Version]
  4. Wang, C.; Wang, Q.; Zhong, M.; Kan, X. Boronic acid based imprinted electrochemical sensor for rutin recognition and detection. Analyst 2016, 14120, 5792–5798. [Google Scholar] [CrossRef]
  5. Sharma, S.; Ali, A.; Ali, J.; Sahni, J.K.; Baboota, S. Rutin: Therapeutic potential and recent advances in drug delivery. Expert Opin. Investig. Drugs 2013, 228, 1063–1079. [Google Scholar] [CrossRef] [PubMed]
  6. Chua, L.S. A review on plant-based rutin extraction methods and its pharmacological activities. J. Ethnopharmacol. 2013, 1503, 805–817. [Google Scholar] [CrossRef]
  7. Ghorbani, A. Mechanisms of antidiabetic effects of flavonoid rutin. Biomed. Pharmacother. 2017, 96, 305–312. [Google Scholar] [CrossRef]
  8. Gullón, B.; Lú-Chau, T.A.; Moreira, M.T.; Lema, J.M.; Eibes, G. Rutin: A review on extraction, identification and purification methods, biological activities and approaches to enhance its bioavailability. Trends Food Sci. Technol. 2017, 67, 220–235. [Google Scholar] [CrossRef]
  9. Imani, A.; Maleki, N.; Bohlouli, S.; Kouhsoltani, M.; Sharifi, S.; Dizaj, S.M. Molecular mechanisms of anticancer effect of rutin. Phytother. Res. 2021, 355, 2500–2513. [Google Scholar] [CrossRef]
  10. Hosseinzadeh, H.; Nassiri-Asl, M. Review of the protective effects of rutin on the metabolic function as an important dietary flavonoid. J. Endocrinol. Investig. 2014, 379, 783–788. [Google Scholar] [CrossRef] [PubMed]
  11. Choi, S.-S.; Park, H.-R.; Lee, K.-A. A comparative study of rutin and rutin glycoside: Antioxidant activity, anti-inflammatory effect, effect on platelet aggregation and blood coagulation. Antioxidants 2021, 10, 1696. [Google Scholar] [CrossRef] [PubMed]
  12. Choi, S.J.; Lee, S.-N.; Kim, K.; Joo, D.H.; Shin, S.; Lee, J.; Lee, H.K.; Kim, J.; Kwon, S.B.; Kim, M.J.; et al. Biological effects of rutin on skin aging. Int. J. Mol. Med. 2016, 381, 357–363. [Google Scholar] [CrossRef] [PubMed] [Green Version]
  13. Li, T.; Chen, S.; Feng, T.; Dong, J.; Li, Y.; Li, H. Rutin protects against aging-related metabolic dysfunction. Food Funct. 2016, 72, 1147–1154. [Google Scholar] [CrossRef] [PubMed]
  14. Chen, G.; Zhang, H.; Ye, J. Determination of rutin and quercetin in plants by capillary electrophoresis with electrochemical detection. Anal. Chim. Acta 2000, 4231, 69–76. [Google Scholar] [CrossRef]
  15. D’Souza, O.J.; Mascarenhas, R.J.; Satpati, A.K.; Basavaraja, B.M. A novel ZnO/reduced graphene oxide and Prussian blue modified carbon paste electrode for the sensitive determination of Rutin. Sci. China Chem. 2019, 622, 262–270. [Google Scholar] [CrossRef]
  16. Jiang, H.; Engelhardt, U.H.; Thräne, C.; Maiwald, B.; Stark, J. Determination of flavonol glycosides in green tea, oolong tea and black tea by UHPLC compared to HPLC. Food Chem. 2015, 183, 30–35. [Google Scholar] [CrossRef]
  17. Peng, L.; Wang, Y.; Zeng, H.; Yuan, Y. Molecularly imprinted polymer for solid-phase extraction of rutin in complicated traditional Chinese medicines. Analyst 2011, 1364, 756–763. [Google Scholar] [CrossRef]
  18. Yang, N.; Ren, G. Application of Near-Infrared Reflectance Spectroscopy to the Evaluation of Rutin and D-chiro-Inositol Contents in Tartary Buckwheat. J. Agric. Food Chem. 2008, 563, 761–764. [Google Scholar] [CrossRef]
  19. Sakamoto, M.; Takamura, K. Consecutive determination of rutin and quercetin by spectrophotometric measurements. Microchem. J. 1978, 233, 374–383. [Google Scholar] [CrossRef]
  20. Kang, J.; Yeom, G.; Jang, H.; Park, C.J.; Kim, M.G. Highly sensitive and universal detection strategy based on a colorimetric assay using target-specific heterogeneous sandwich DNA aptamer. Anal. Chim. Acta 2020, 1123, 73–80. [Google Scholar] [CrossRef]
  21. Kreft, S.; Knapp, M.; Kreft, I. Extraction of Rutin from Buckwheat (Fagopyrum esculentum Moench) Seeds and Determination by Capillary Electrophoresis. J. Agric. Food Chem. 1999, 4711, 4649–4652. [Google Scholar] [CrossRef] [PubMed]
  22. Tan, H.; Zhao, Y.; Xu, X.; Sun, Y.; Li, Y.; Du, J. A covalent triazine framework as an oxidase mimetic in the luminol chemiluminescence system: Application to the determination of the antioxidant rutin. Microchim. Acta 2019, 1871, 42. [Google Scholar] [CrossRef] [PubMed]
  23. Liaudanskas, M.; Noreikienė, I.; Zymonė, K.; Juodytė, R.; Žvikas, V.; Janulis, V. Composition and Antioxidant Activity of Phenolic Compounds in Fruit of the Genus Rosa L. Antioxidants 2021, 10, 545. [Google Scholar] [CrossRef] [PubMed]
  24. Sinduja, B.; Abraham John, S. Sensitive determination of rutin by spectrofluorimetry using carbon dots synthesized from a non-essential amino acid. Spectrochim. Acta Part A Mol. Biomol. Spectrosc. 2018, 193, 486–491. [Google Scholar] [CrossRef] [PubMed]
  25. Sun, H.; Wang, N.; Zhang, L.; Meng, H.; Li, Z. Aptamer-Based Sensors for Thrombin Detection Application. Chemosensors 2022, 10, 255. [Google Scholar] [CrossRef]
  26. Schober, S.A.; Bahri, Y.; Carbonelli, C.; Wille, R. Neural Network Robustness Analysis Using Sensor Simulations for a Graphene-Based Semiconductor Gas Sensor. Chemosensors 2022, 10, 152. [Google Scholar] [CrossRef]
  27. Şenocak, A.; Khataee, A.; Demirbas, E.; Doustkhah, E. Ultrasensitive detection of rutin antioxidant through a magnetic micro-mesoporous graphitized carbon wrapped Co nanoarchitecture. Sens. Actuators B Chem. 2020, 312, 127939. [Google Scholar] [CrossRef]
  28. Baranwal, J.; Barse, B.; Gatto, G.; Broncova, G.; Kumar, A. Electrochemical Sensors and Their Applications: A Review. Chemosensors 2022, 10, 363. [Google Scholar] [CrossRef]
  29. Bourdiol, F.; Mouchet, F.; Perrault, A.; Fourquaux, I.; Datas, L.; Gancet, C.; Boutonnet, J.-C.; Pinelli, E.; Gauthier, L.; Flahaut, E. Biocompatible polymer-assisted dispersion of multi walled carbon nanotubes in water, application to the investigation of their ecotoxicity using Xenopus laevis amphibian larvae. Carbon 2013, 54, 175–191. [Google Scholar] [CrossRef] [Green Version]
  30. Hassanzadeh-Aghdam, M.K.; Mahmoodi, M.J.; Ansari, R. Creep performance of CNT polymer nanocomposites -An emphasis on viscoelastic interphase and CNT agglomeration. Compos. Part B Eng. 2019, 168, 274–281. [Google Scholar] [CrossRef]
  31. Zhou, L.; Liu, K.; Yuan, T.; Liu, Z.; Wang, Q.; Xiao, B.; Ma, Z. Investigation into the influence of CNTs configuration on the thermal expansion coefficient of CNT/Al composites. J. Mater. Res. Technol. 2022, 18, 3478–3491. [Google Scholar] [CrossRef]
  32. Zhao, T.; Liu, L.; Li, G.; Du, L.; Zhao, X.; Yan, J.; Cheng, Y.; Dang, A.; Li, T. Preparation and electrochemical property of CMC/MWCNT composite using ionic liquid as solvent. Chin. Sci. Bull. 2012, 5714, 1620–1625. [Google Scholar] [CrossRef] [Green Version]
  33. Liu, X.; Li, L.; Zhao, X.; Lu, X. Electrochemical behavior of rutin on a multi-walled carbon nanotube and ionic liquid composite film modified electrode. Colloids Surf. B Biointerfaces 2010, 811, 344–349. [Google Scholar] [CrossRef] [PubMed]
  34. Kim, J.S.; Lee, S.C.; Hwang, J.; Lee, E.; Cho, K.; Kim, S.-J.; Kim, D.H.; Lee, W.H. Enhanced Sensitivity of Iontronic Graphene Tactile Sensors Facilitated by Spreading of Ionic Liquid Pinned on Graphene Grid. Adv. Funct. Mater. 2020, 3014, 1908993. [Google Scholar] [CrossRef]
  35. Buettner, C.S.; Cognigni, A.; Schröder, C.; Bica-Schröder, K. Surface-active ionic liquids: A review. J. Mol. Liq. 2022, 347, 118160. [Google Scholar] [CrossRef]
  36. Franzoi, A.C.; Migowski, P.; Dupont, J.; Vieira, I.C. Development of biosensors containing laccase and imidazolium bis(trifluoromethylsulfonyl)imide ionic liquid for the determination of rutin. Anal. Chim. Acta 2009, 6391, 90–95. [Google Scholar] [CrossRef] [PubMed]
  37. Bai, L.; Wen, D.; Yin, J.; Deng, L.; Zhu, C.; Dong, S. Carbon nanotubes-ionic liquid nanocomposites sensing platform for NADH oxidation and oxygen, glucose detection in blood. Talanta 2012, 91, 110–115. [Google Scholar] [CrossRef]
  38. Suzuki, H.; Hirakawa, T.; Sasaki, S.; Karube, I. An integrated three-electrode system with a micromachined liquid-junction Ag/AgCl reference electrode. Anal. Chim. Acta 1999, 3871, 103–112. [Google Scholar] [CrossRef]
  39. Wang, W.; Fu, Y.; Lv, Q.; Bai, H.; Li, H.; Wang, Z.; Zhang, Q. Miniaturized device with a detachable three-electrode system and vibration motor for electrochemical analysis based on disposable electrodes. Sens. Actuators B Chem. 2019, 297, 126719. [Google Scholar] [CrossRef]
  40. Yadav, S.; Yadav, J.; Kumar, M.; Saini, K. Synthesis and characterization of nickel oxide/cobalt oxide nanocomposite for effective degradation of methylene blue and their comparative electrochemical study as electrode material for supercapacitor application. Int. J. Hydrogen Energy 2022, 4799, 41684–41697. [Google Scholar] [CrossRef]
  41. Hong, J.; Zhao, Y.-X.; Xiao, B.-L.; Moosavi-Movahedi, A.A.; Ghourchian, H.; Sheibani, N. Direct Electrochemistry of Hemoglobin Immobilized on a Functionalized Multi-Walled Carbon Nanotubes and Gold Nanoparticles Nanocomplex-Modified Glassy Carbon Electrode. Sensors 2013, 13, 8595–8611. [Google Scholar] [CrossRef]
  42. Wan, Y.; Lin, Z.; Zhang, D.; Wang, Y.; Hou, B. Impedimetric immunosensor doped with reduced graphene sheets fabricated by controllable electrodeposition for the non-labelled detection of bacteria. Biosens. Bioelectron. 2011, 265, 1959–1964. [Google Scholar] [CrossRef] [PubMed]
  43. D’Aurelio, R.; Tothill, I.E.; Salbini, M.; Calò, F.; Mazzotta, E.; Malitesta, C.; Chianella, I. A Comparison of EIS and QCM NanoMIP-Based Sensors for Morphine. Nanomaterials 2021, 11, 3360. [Google Scholar] [CrossRef] [PubMed]
  44. Gong, X.; Zhang, H.; Sun, Z.; Zhang, X.; Xu, J.; Chu, F.; Sun, L.; Ramakrishna, S. A viable method to enhance the electrical conductivity of CNT bundles: Direct in situ TEM evaluation. Nanoscale 2020, 1224, 13095–13102. [Google Scholar] [CrossRef] [PubMed]
  45. Ding, M.; Sahebgharani, N.; Musharavati, F.; Jaber, F.; Zalnezhad, E.; Yoon, G.H. Synthesis and properties of HA/ZnO/CNT nanocomposite. Ceram. Int. 2018, 447, 7746–7753. [Google Scholar] [CrossRef]
  46. Tao, F.; Yu, C.; Huang, J.; Li, F.; Cai, Z.; Fan, C.; Pei, L. Synthesis and properties of BiDy composite electrode materials in electrochemical sensors. Mater. Chem. Front. 2022, 619, 2880–2893. [Google Scholar] [CrossRef]
  47. Gültekin-Özgüven, M.; Davarcı, F.; Paslı, A.A.; Demir, N.; Özçelik, B. Determination of phenolic compounds by ultra high liquid chromatography-tandem mass spectrometry: Applications in nuts. LWT-Food Sci. Technol. 2015, 641, 42–49. [Google Scholar] [CrossRef]
  48. Sun, W.; Wang, Y.; Gong, S.; Cheng, Y.; Shi, F.; Sun, Z. Application of poly(acridine orange) and graphene modified carbon/ionic liquid paste electrode for the sensitive electrochemical detection of rutin. Electrochim. Acta 2013, 109, 298–304. [Google Scholar] [CrossRef]
  49. Wang, Y.; Hu, Y.; Wu, T.; Zhou, X.; Shao, Y. Triggered Excited-State Intramolecular Proton Transfer Fluorescence for Selective Triplex DNA Recognition. Anal. Chem. 2015, 8723, 11620–11624. [Google Scholar] [CrossRef] [Green Version]
  50. Chai, C.; Oh, S.-W. Electrochemical impedimetric biosensors for food safety. Food Sci. Biotechnol. 2020, 297, 879–887. [Google Scholar] [CrossRef]
  51. Leng, X.; Luo, D.; Xu, Z.; Wang, F. Modified graphene oxide/Nafion composite humidity sensor and its linear response to the relative humidity. Sens. Actuators B Chem. 2018, 257, 372–381. [Google Scholar] [CrossRef]
  52. Xu, X.; Makaraviciute, A.; Kumar, S.; Wen, C.; Sjödin, M.; Abdurakhmanov, E.; Danielson, U.H.; Nyholm, L.; Zhang, Z. Structural Changes of Mercaptohexanol Self-Assembled Monolayers on Gold and Their Influence on Impedimetric Aptamer Sensors. Anal. Chem. 2019, 9122, 14697–14704. [Google Scholar] [CrossRef] [PubMed]
  53. Zhao, G.; Wang, X.; Liu, G.; Cao, Y.; Liu, N.; Thuy, N.T.D.; Zhang, L.; Yu, M. A flexible and disposable electrochemical sensor for the evaluation of arsenic levels: A new and efficient method for the batch fabrication of chemically modified electrodes. Anal. Chim. Acta 2022, 1194, 339413. [Google Scholar] [CrossRef] [PubMed]
  54. Song, X.-Y.; Meng, X.; Xiao, B.-L.; Li, Y.-Y.; Ma, X.-X.; Moosavi-Movahedi, A.A.; Hong, J. MWCNTs-CTAB and HFs-Lac Nanocomposite-Modified Glassy Carbon Electrode for Rutin Determination. Biosensors 2022, 12, 632. [Google Scholar] [CrossRef] [PubMed]
  55. He, J.-L.; Yang, Y.; Yang, X.; Liu, Y.-L.; Liu, Z.-H.; Shen, G.-L.; Yu, R.-Q. β-Cyclodextrin incorporated carbon nanotube-modified electrode as an electrochemical sensor for rutin. Sens. Actuators B Chem. 2006, 1141, 94–100. [Google Scholar] [CrossRef]
  56. Zhao, W.-J.; Xiao, B.-L.; Song, X.-Y.; Meng, X.; Ma, X.-X.; Li, Y.-Y.; Hong, J.; Moosavi-Movahedi, A.A. A Highly Sensitive Electrochemical Sensor Based on β-cyclodextrin Functionalized Multi-Wall Carbon Nanotubes and Fe3O4 Nanoparticles for Rutin Detection. J. Electrochem. Soc. 2022, 1694, 047509. [Google Scholar] [CrossRef]
  57. Li, S.; Yang, B.; Wang, J.; Bin, D.; Wang, C.; Zhang, K.; Du, Y. Nonenzymatic electrochemical detection of rutin on Pt nanoparticles/graphene nanocomposite modified glassy carbon electrode. Anal. Methods 2016, 827, 5435–5440. [Google Scholar] [CrossRef]
  58. Tursynbolat, S.; Bakytkarim, Y.; Huang, J.; Wang, L. Highly sensitive simultaneous electrochemical determination of myricetin and rutin via solid phase extraction on a ternary Pt@r-GO@MWCNTs nanocomposite. J. Pharm. Anal. 2019, 95, 358–366. [Google Scholar] [CrossRef] [PubMed]
  59. Brugnerotto, P.; Silva, T.R.; Brondani, D.; Zapp, E.; Vieira, I.C. Gold Nanoparticles Stabilized in β-Cyclodextrin and Decorated with Laccase Applied in the Construction of a Biosensor for Rutin. Electroanalysis 2017, 294, 1031–1037. [Google Scholar] [CrossRef]
  60. Karabiberoğlu, Ş.U.; Dursun, Z. Fabrication of nickel coated graphene oxide composite electrode for sensitive determination of Rutin. J. Electroanal. Chem. 2018, 815, 76–85. [Google Scholar] [CrossRef]
  61. Arvand, M.; Shabani, A.; Ardaki, M.S. A New Electrochemical Sensing Platform Based on Binary Composite of Graphene Oxide-Chitosan for Sensitive Rutin Determination. Food Anal. Methods 2017, 107, 2332–2345. [Google Scholar] [CrossRef]
  62. Franzoi, A.C.; Spinelli, A.; Vieira, I.C. Rutin determination in pharmaceutical formulations using a carbon paste electrode modified with poly(vinylpyrrolidone). J. Pharm. Biomed. Anal. 2008, 474, 973–977. [Google Scholar] [CrossRef] [PubMed]
Figure 1. Fabrication procedure of the nanocomposite-modified sensor.
Chemosensors 11 00171 g001
Figure 2. TEM images of MWCNTs (A) and CMC-MWCNTs (B), SEM images of CMC-MWCNTs-IL (C), and Raman spectra (D) for MWCNTs (a), CMC-MWCNTs (b), and CMC-MWCNTs-IL (c).
Chemosensors 11 00171 g002aChemosensors 11 00171 g002b
Figure 3. (A) CVs of different modified GCEs in 50 mM pH 5 PBS containing 5 μM rutin at a scan rate of 100 mVs−1. Inset: CVs of different modified electrodes in the absence of rutin. (a) Bare GCE; (b) NF/MWCNTs/GCE; (c) NF/CMC-MWCNTs/GCE; (d) NF/IL/CMC-MWCNTs/GCE. (B) CVs of NF/IL/CMC-MWCNTs/GCE in 50 mM pH 5 PBS in the absence (a) and presence (b) of 5 μM rutin.
Chemosensors 11 00171 g003
Scheme 1. The proposed mechanism of rutin reaction on an electrochemical sensor.
Chemosensors 11 00171 sch001
Figure 4. EIS of different modified GCEs: GCE (a), NF/MWCNTs/GCE (b), NF/CMC-MWCNTs/GCE (c), and NF/IL/CMC-MWCNTs/GCE (d), with a frequency range from 102 to 106 Hz.
Chemosensors 11 00171 g004
Figure 5. (A) CVs of NF/IL/CMC-MWCNTs/GCE in 50 mM pH 5 PBS containing 5 μM rutin at different scan rates (from inner to outer: 0.1, 0.2, 0.3, 0.4, 0.5, 0.6, 0.7, 0.8, 0.9, and 1 Vs−1, respectively). (B) Plot of peak current vs. scan rate. (C) The relationship between log v and log I. (D) CVs of NF/IL/CMC-MWCNTs/GCE in the presence of 5 μM rutin (a) and in the absence of rutin after different scanning cycles: 20 cycles (b), 40 cycles (c), 60 cycles (d), 80 cycles (e), and 100 cycles (f).
Chemosensors 11 00171 g005
Figure 6. (A) SWV, (B) DPV, and (C) LSV of NF/IL/CMC-MWCNTs/GCE for the reduction response of rutin at different concentrations (0.1 μM–20 μM).
Chemosensors 11 00171 g006
Figure 7. (A) SWV, (B) DPV, and (C) LSV of NF/IL/CMC-MWCNTs/GCE for the oxidation response of rutin at different concentrations (0.1 μM–20 μM).
Chemosensors 11 00171 g007
Figure 8. (A) SWV, (B) DPV, and (C) LSV of NF/IL/CMC-MWCNTs/GCE response to different concentrations of rutin (0.1 μM–20 μM). (D) Different methods of NF/IL/CMC-MWCNTs/GCE response to rutin. Here, SWV+, DPV+, and LSV+ represent the oxidation-peak current; SWV−, DPV−, LSV− represent the reduction-peak current. All reduction-peak currents are plotted in absolute values.
Chemosensors 11 00171 g008
Figure 9. (A) Effects of different pH values on the CVs of NF/IL/CMC-MWCNTs/GCE in 50 mM PBS containing 5 μM rutin at a scan rate of 100 mV s−1. (B) Plot of anodic-peak current vs. pH value.
Chemosensors 11 00171 g009
Figure 10. (A) SWV of NF/IL/CMC-MWCNTs/GCE responding to different concentrations of rutin. (B) Plot of anodic-peak current vs. rutin concentrations.
Chemosensors 11 00171 g010
Figure 11. (A) Anti-interference ability of NF/IL/CMC-MWCNTs/GCE in 50 mM pH 5 PBS containing 250 μM different interfering substances (ethanol, Glu, Vit B1, Vit C, Gly, UA, inositol, nitrite, sulfite, levodopa, amoxicillin, urea, clotrimazole, pyrogallic acid) and 0.5 μM rutin. (B) Stability of NF/IL/CMC-MWCNTs/GCE. (C) The voltammograms of the interference study. (D) The voltammograms of the stability study. (E) The voltammograms of the reproducibility study.
Chemosensors 11 00171 g011
Table 1. Comparison of different modified electrodes for rutin determination.
ElectrodeMethodLinear Range (μM)LOD (μM)Reference
MIP/MWCNTs/GCEDPV0.4–100.11[4]
ZnO-rGO-PB/MCPEDPV0.07–7, 7–1000.02[15]
MWCNTs-IL-Gel/GCEDPV0.072–60.02[33]
DMI·Tf2N-LAC/CPESWV5.84–53.60.69[36]
PtNPs/rGO/GCEDPV0.057–102.590.02[57]
Pt@r-GO@MWCNTs/GCEDPV0.05–500.005[58]
AuNPs-CD-LAC/CPESWV0.3–2.970.17[59]
Ni-GO/GCESWV0.011–1, 2.2–150.0032[60]
MWCNTs-CD-Fe3O4/GCEDPV0.02–100.0164[56]
GO-CS/GCEDPV0.9–900.56[61]
PVP/CPELSV0.39–130.15[62]
NF/IL/CMC-MWCNTs/GCESWV0.01–1, 1–100.0066This work
MIP, molecularly imprinted polymer; PB, Prussian blue; CPE, carbon-paste electrode; IL, ionic liquid; DMI·Tf2N, 1-decyl-3-methylimidazolium; PtNPs, Pt nanoparticles; rGO, reduced graphene oxide; AuNPs, gold nanoparticles; CD, β-cyclodextrin; Ni-GO, nickel nanoparticles incorporated with graphene-oxide composite; Fe3O4 NPs, Fe3O4 nanoparticles; CS, chitosan; PVP, poly (vinylpyrrolidone).
Table 2. Rutin-tablet sample determination by UHPLC and electrochemical-sensor methods (n = 3).
SamplesConcentration (μM)UHPLC (μM)Sensor (μM)RSD (%)
110.940.922.25 ± 0.02
54.704.681.93 ± 0.05
109.609.721.23 ± 0.04
210.780.811.41 ± 0.06
54.504.732.22 ± 0.04
109.409.652.51 ± 0.03
Disclaimer/Publisher’s Note: The statements, opinions and data contained in all publications are solely those of the individual author(s) and contributor(s) and not of MDPI and/or the editor(s). MDPI and/or the editor(s) disclaim responsibility for any injury to people or property resulting from any ideas, methods, instructions or products referred to in the content.

