

A Paper-Chip-Based Phage Biosensor Combined with a Smartphone Platform for the Quick and On-Site Analysis of E. coli O157:H7 in Foods


Abstract
1. Introduction
2. Materials and Methods
2.1. Chemicals
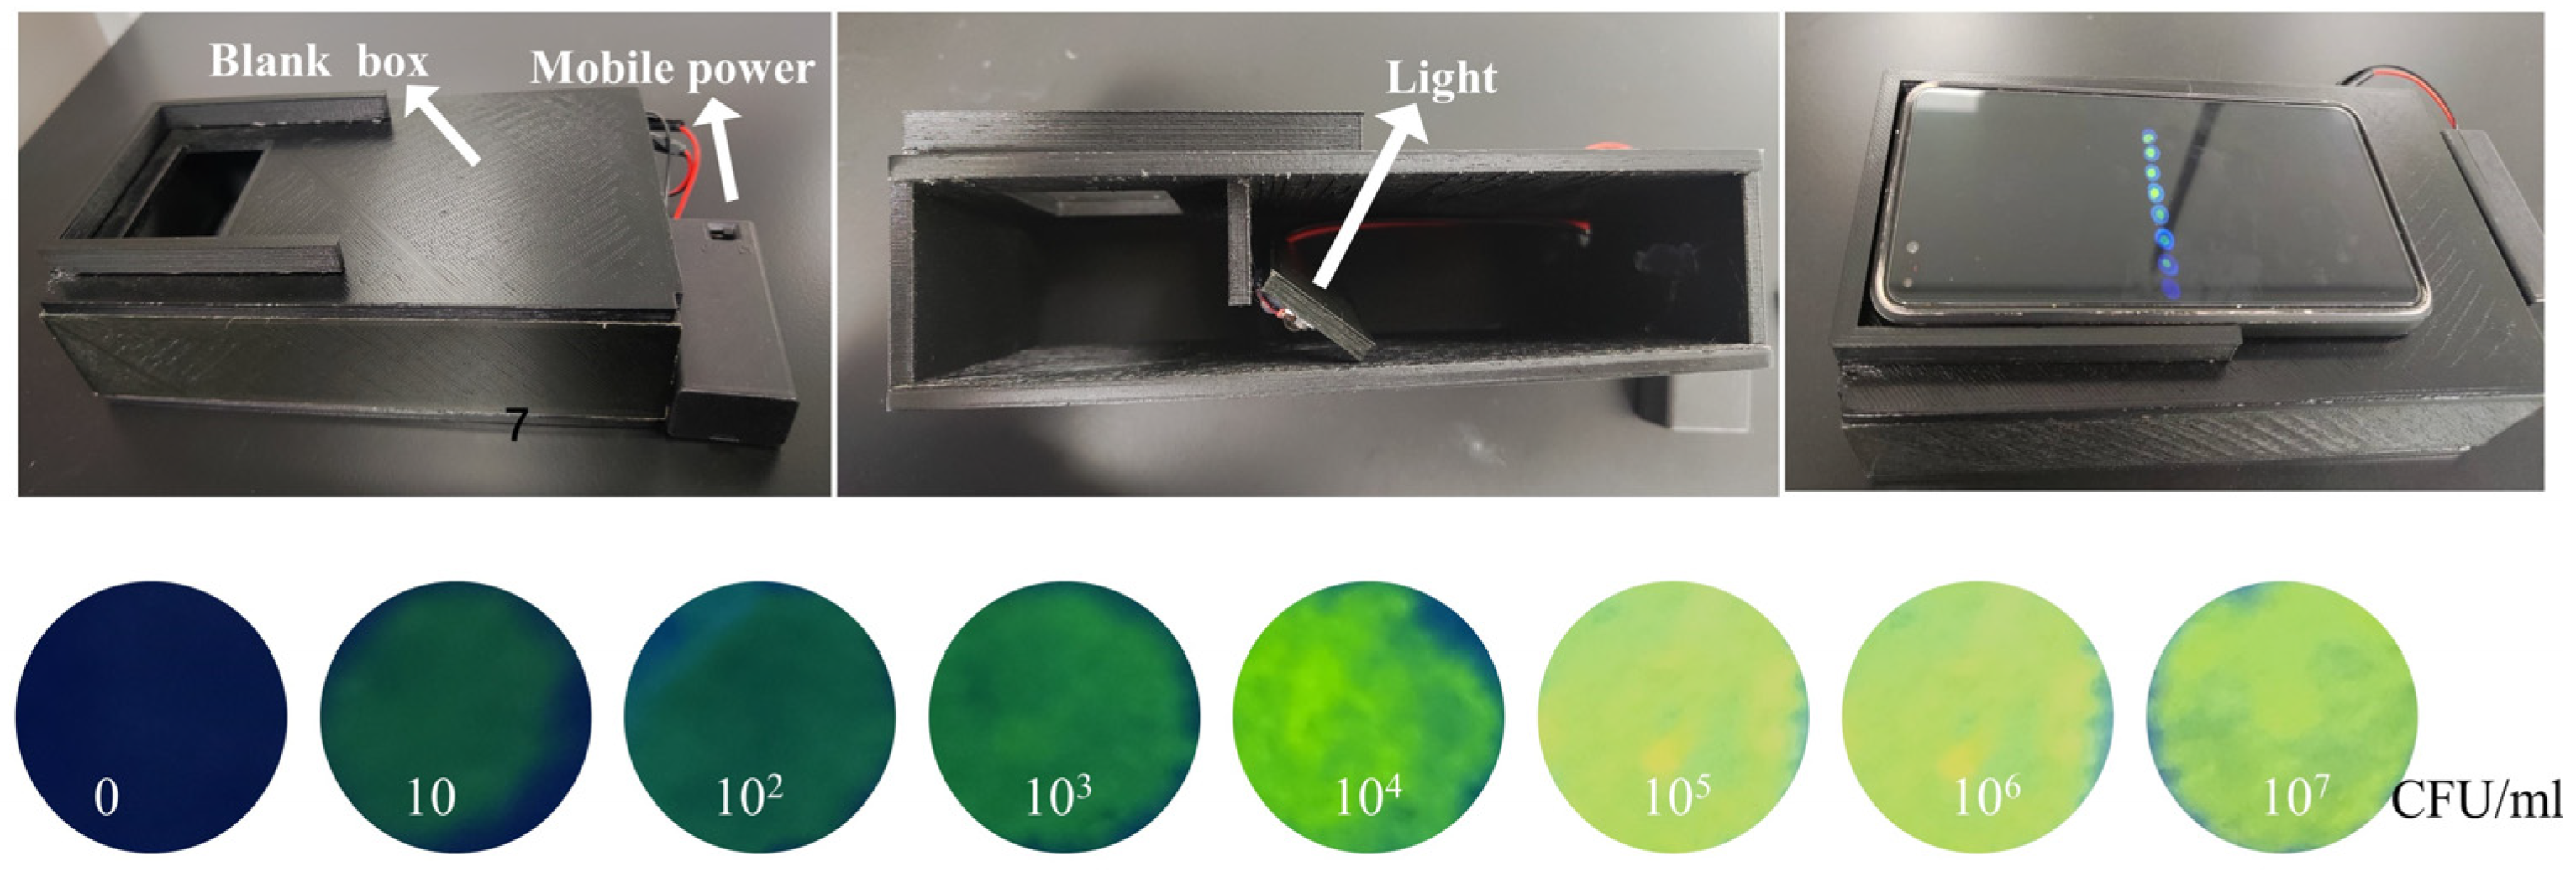
2.2. Apparatus
2.3. Culture and Preparation of Phages
2.4. Culture and Preparation of Bacteria
2.5. Phage Specificity and Probe Activity
2.6. Synthesis of Phage @ DNA Probes
2.7. Detection of Escherichia coli O157:H7 (E. coli) in Fishes
3. Results and Discussion
3.1. Characterization of the Phage@SYTO Probes
3.2. The Phage Specificity and Probe Activity
3.3. Principle of the Assay
3.4. The Optimization of the Assay
3.5. Determination of E. coli in the Real Samples
3.6. Specificity, Stability, and Precision of the Sensor
4. Conclusions
Author Contributions
Funding
Institutional Review Board Statement
Informed Consent Statement
Data Availability Statement
Acknowledgments
Conflicts of Interest
References
- Shi, C.; Qing, X.; Yue, G.; Ling, J.; He, H. Luciferase-Zinc-Finger System for the Rapid Detection of Pathogenic Bacteria. J. Agric. Food Chem. 2017, 65, 6674–6681. [Google Scholar] [CrossRef] [PubMed]
- Oyedeji, A.B.; Ezekiel, G.; Janet, A.A.; Opeolu, M.O.; Sefater, G.; Martins, A.A.; Samson, A.O.; Oluwafemi, A.A. Metabolomic Approaches for the Determination of Metabolites from Pathogenic Microorganisms: A Review. Food Res. Int. 2020, 140, 110042. [Google Scholar] [CrossRef] [PubMed]
- Martinović, T.; Uroš, A.; Martina, Š.G.; Dina, R.; Djuro, J. Foodborne Pathogens and Their Toxins. J. Proteom. 2016, 147, 226–235. [Google Scholar] [CrossRef] [PubMed]
- Rajapaksha, P.; Elbourne, A.; Gangadoo, S.; Brown, R.; Cozzolino, D.; Chapman, J. A Review of Methods for the Detection of Pathogenic Microorganisms. Analyst 2018, 144, 396–411. [Google Scholar] [CrossRef] [PubMed]
- Carrillo, J.D.; Mayorquin, J.S.; Stajich, J.E.; Eskalen, A. Probe-Based Multiplex Real-Time PCR as a Diagnostic Tool to Distinguish Distinct Fungal Symbionts Associated with Euwallacea kuroshio and Euwallacea whitfordiodendrus in California. Plant Dis. 2019, 104, 227–238. [Google Scholar] [CrossRef] [PubMed]
- Lv, X.; Huang, Y.; Liu, D.; Liu, C.; Shan, S.; Li, G.; Duan, M.; Lai, W. Multicolor and Ultrasensitive Enzyme-Linked Immunosorbent Assay Based on the Fluorescence Hybrid Chain Reaction for Simultaneous Detection of Pathogens. J. Agric. Food Chem. 2019, 67, 9390–9398. [Google Scholar] [CrossRef]
- Richter, M.F.; Drown, B.S.; Riley, A.P.; Garcia, A.; Shirai, T.; Svec, R.L.; Hergenrother, P.J. Predictive compound accumulation rules yield a broad-spectrum antibiotic. Nature 2017, 545, 299–304. [Google Scholar] [CrossRef]
- Zhang, Y.; Wu, Y.; Wu, Y.; Chang, Y.; Liu, M. CRISPR-Cas systems: From gene scissors to programmable biosensors. Trends Anal. Chem. 2021, 137, 116210. [Google Scholar] [CrossRef]
- Shi, R.; Zou, W.; Zhao, Z.; Wang, G.; Guo, M.; Ai, S.; Zhou, Q.; Zhao, F.; Yang, Z. Development of a sensitive phage-mimotope and horseradish peroxidase based electrochemical immunosensor for detection of O,O-dimethyl organophosphorus pesticides. Biosens. Bioelectron. 2022, 218, 114748. [Google Scholar] [CrossRef]
- Jiang, H.; Yang, J.; Wan, K.; Jiang, D.; Jin, C. Miniaturized Paper-Supported 3D Cell-Based Electrochemical Sensor for Bacterial Lipopolysaccharide Detection. ACS Sens. 2020, 5, 1325–1335. [Google Scholar] [CrossRef]
- Baoqing, Z.; Qinghua, Y.; Fan, L.; Xinran, X.; Yuting, S.; Chufang, W.; Yanna, S.; Liang, X.; Jumei, Z.; Juan, W.; et al. CRISPR/Cas12a based fluorescence-enhanced lateral flow biosensor for detection of Staphylococcus aureus. Sens. Actuators B Chem. 2021, 351, 130906. [Google Scholar]
- Bu, S.; Wang, K.; Wang, C.; Li, Z.; Hao, Z.; Liu, W.; Wan, J. Immunoassay for foodborne pathogenic bacteria using magnetic composites Ab@Fe3O4, signal composites Ap@PtNp, and thermometer readings. Microchim. Acta 2020, 187, 679. [Google Scholar] [CrossRef]
- Dieckhaus, L.; Park, T.S.; Yoon, J.-Y. Smartphone-Based Paper Microfluidic Immunoassay of Salmonella and E. coli. Methods Mol. Biol. 2020, 2182, 83–101. [Google Scholar]
- Liu, S.; Lu, S.; Sun, S.; Hai, J.; Meng, G.; Wang, B. NIR II Light-Response Au Nanoframes: Amplification of a Pressure- and Temperature-Sensing Strategy for Portable Detection and Photothermal Therapy of Cancer Cells. Anal. Chem. 2021, 93, 14307–14316. [Google Scholar] [CrossRef]
- Lee, W.-I.; Park, Y.; Shrivastava, S.; Jung, T.; Meeseepong, M.; Lee, J.; Jeon, B.; Yang, S.; Lee, N.-E. A fully integrated bacterial pathogen detection system based on count-on-a-cartridge platform for rapid, ultrasensitive, highly accurate and culture-free assay. Biosens. Bioelectron. 2020, 152, 112007. [Google Scholar] [CrossRef] [PubMed]
- Laliwala, A.; Svechkarev, D.; Sadykov, M.R.; Endres, J.; Bayles, K.W.; Mohs, A.M. Simpler Procedure and Improved Performance for Pathogenic Bacteria Analysis with a Paper-Based Ratiometric Fluorescent Sensor Array. Anal. Chem. 2022, 94, 2615–2624. [Google Scholar] [CrossRef] [PubMed]
- Shin, J.H.; Hong, J.; Go, H.; Park, J.; Kong, M.; Ryu, S.; Kim, K.-P.; Roh, E.; Park, J.-K. Multiplexed Detection of Foodborne Pathogens from Contaminated Lettuces Using a Handheld Multistep Lateral Flow Assay Device. J. Agric. Food Chem. 2017, 66, 290–297. [Google Scholar] [CrossRef] [PubMed]
- Luo, K.; Kim, H.-Y.; Oh, M.-H.; Kim, Y.-R. Paper-based lateral flow strip assay for the detection of foodborne pathogens: Principles, applications, technological challenges and opportunities. Crit. Rev. Food Sci. Nutr. 2018, 60, 157–170. [Google Scholar] [CrossRef] [PubMed]
- Li, W.; Coulon, F.; Singer, A.; Zhu, Y.-G.; Yang, Z. Paper-Based Devices as a New Tool for Rapid and on-Site Monitoring of “Superbugs”. Environ. Sci. Technol. 2021, 55, 12133–12135. [Google Scholar] [CrossRef]
- Yizhong, S.; Yunlong, W.; Chunlei, Z.; Jinxuan, C.; De-Man, H. Ratiometric fluorescent signals-driven smartphone-based portable sensors for onsite visual detection of food contaminants. Coord. Chem. Rev. 2022, 458, 214442. [Google Scholar]
- Lin, B.; Guan, Z.; Song, Y.; Song, E.; Lu, Z.; Liu, D.; An, Y.; Zhu, Z.; Zhou, L.; Yang, C. Lateral flow assay with pressure meter readout for rapid point-of-care detection of disease-associated protein. Lab A Chip 2018, 18, 965–970. [Google Scholar] [CrossRef] [PubMed]
- Ji, T.; Liu, D.; Liu, F.; Li, J.; Ruan, Q.; Song, Y.; Tian, T.; Zhu, Z.; Zhou, L.; Lin, H.; et al. A pressure-based bioassay for the rapid, portable and quantitative detection of C-reactive protein. Chem. Commun. 2016, 52, 8452–8454. [Google Scholar] [CrossRef]
- Wei, X.; Tian, T.; Jia, S.; Zhu, Z.; Ma, Y.; Sun, J.; Lin, Z.; Yang, C.J. Microfluidic Distance Readout Sweet Hydrogel Integrated Paper-Based Analytical Device (μDiSH-PAD) for Visual Quantitative Point-of-Care Testing. Anal. Chem. 2016, 88, 2345–2352. [Google Scholar] [CrossRef] [PubMed]
- Torres-Barceló, C. The disparate effects of bacteriophages on antibiotic-resistant bacteria. Emerg. Microbes Infect. 2018, 7, 168. [Google Scholar] [CrossRef]
- Sha, L.; Xuliang, H.; Tao, Z.; Kaixuan, Z.; Changhu, X.; Zengrui, T.; Lian, J.; Nongyue, H.; Yan, D.; Song, L.; et al. Highly sensitive smartphone-based detection of Listeria monocytogenes using SYTO9. Chin. Chem. Lett. 2021, 33, 1933–1935. [Google Scholar]
- You, S.-M.; Jeong, K.-B.; Luo, K.; Park, J.-S.; Park, J.-W.; Kim, Y.-R. Paper-based colorimetric detection of pathogenic bacteria in food through magnetic separation and enzyme-mediated signal amplification on paper disc. Anal. Chim. Acta 2021, 1151, 338252. [Google Scholar] [CrossRef] [PubMed]
- Yuwei, R.; Lulu, C.; Xiyan, Z.; Rui, J.; Dexin, O.; Yang, W.; Danfeng, Z.; Yizhong, S.; Na, L.; Yingwang, Y. A novel fluorescence resonance energy transfer (FRET)-based paper sensor with smartphone for quantitative detection of Vibrio parahaemolyticus. Food Control 2022, 145, 109412. [Google Scholar]
- Lei, J.; Shi, L.; Li, B.; Yang, C.J.; Jin, Y. Ultrasensitive and portable assay of mercury (II) ions via gas pressure as readout. Biosens. Bioelectron. 2018, 122, 32–36. [Google Scholar] [CrossRef]
- Niazi, M.; Alizadeh, E.; Zarebkohan, A.; Seidi, K.; Ayoubi-Joshaghani, M.H.; Azizi, M.; Dadashi, H.; Mahmudi, H.; Javaheri, T.; Jaymand, M.; et al. Advanced Bioresponsive Multitasking Hydrogels in the New Era of Biomedicine. Adv. Funct. Mater. 2021, 31, 2104123. [Google Scholar] [CrossRef]
- Jung, I.Y.; Kim, J.S.; Choi, B.R.; Lee, K.; Lee, H. Hydrogel Based Biosensors for In Vitro Diagnostics of Biochemicals, Proteins, and Genes. Adv. Healthc. Mater. 2017, 6, 1601475. [Google Scholar] [CrossRef]
- Pinelli, F.; Magagnin, L.; Rossi, F. Progress in hydrogels for sensing applications: A review. Mater. Today Chem. 2020, 17, 100317. [Google Scholar] [CrossRef]
- Liang, Y.; He, J.; Guo, B. Functional Hydrogels as Wound Dressing to Enhance Wound Healing. ACS Nano 2021, 15, 12687–12722. [Google Scholar] [CrossRef] [PubMed]
- He, X.; Yang, Y.; Guo, Y.; Lu, S.; Du, Y.; Li, J.-J.; Zhang, X.; Leung, N.L.C.; Zhao, Z.; Niu, G.; et al. Phage-Guided Targeting, Discriminated Imaging and Synergistic Killing of Bacteria by AIE Bioconjugates. J. Am. Chem. Soc. 2020, 142, 3959–3969. [Google Scholar] [CrossRef] [PubMed]


| Method | Linear Range (CFU/mL) | LOD (CFU/mL) | Time | Ref. |
|---|---|---|---|---|
| Nanogap network electrochemical method | 103–108 | 102 | >3 h | [28] |
| SERS | 1.0 × 10³–5.0 × 10⁷ | 102 | ~30 min | [29] |
| The fiberoptic surface plasmon resonance method | 1.5 × 10³–1.5 × 10⁵ | 5.0 × 10² | 45 min | [30] |
| Field environment monitoring | 103–108 | 200 | 40 min | [31] |
| Fluorescence method | 10–106 | 14 | 2 h | [32] |
| This work (fluorimeter) | 103–106 | 300 | 45 min | [33] |
| This work | 102–106 | 50 | 10 min |
| Samples | Spiked (CFU/mL) | Measured (CFU/mL) | Recovery (%) | RSD (%) | ELISA (CFU/mL) |
|---|---|---|---|---|---|
| Fish 1 | 0 | ND | ND | ||
| 103 | (0.95 ± 0.06) × 103 | 95.2 | 6.5 | ND | |
| 105 | (0.98 ± 0.05) × 105 | 98.1 | 5.4 | (1.18 ± 0.10) × 105 | |
| Fish 2 | 0 | ND | ND | ||
| 103 | (0.96 ± 0.05) × 103 | 96.3 | 5.9 | ND | |
| 105 | (1.02 ± 0.07) × 105 | 102 | 6.8 | (0.94 ± 0.19) × 105 | |
| Shrimp 1 | 0 | ND | ND | ||
| 103 | (1.01 ± 0.05) × 103 | 101 | 4.7 | ND | |
| 105 | (0.99 ± 0.06) × 105 | 99.4 | 6.1 | (1.10 ± 0.14) × 105 |
Disclaimer/Publisher’s Note: The statements, opinions and data contained in all publications are solely those of the individual author(s) and contributor(s) and not of MDPI and/or the editor(s). MDPI and/or the editor(s) disclaim responsibility for any injury to people or property resulting from any ideas, methods, instructions or products referred to in the content. |
© 2023 by the authors. Licensee MDPI, Basel, Switzerland. This article is an open access article distributed under the terms and conditions of the Creative Commons Attribution (CC BY) license (https://creativecommons.org/licenses/by/4.0/).
Share and Cite
Wu, C.; Li, D.; Jiang, Q.; Gan, N. A Paper-Chip-Based Phage Biosensor Combined with a Smartphone Platform for the Quick and On-Site Analysis of E. coli O157:H7 in Foods. Chemosensors 2023, 11, 151. https://doi.org/10.3390/chemosensors11020151
Wu C, Li D, Jiang Q, Gan N. A Paper-Chip-Based Phage Biosensor Combined with a Smartphone Platform for the Quick and On-Site Analysis of E. coli O157:H7 in Foods. Chemosensors. 2023; 11(2):151. https://doi.org/10.3390/chemosensors11020151
Chicago/Turabian StyleWu, Chaiyong, Dengfeng Li, Qianli Jiang, and Ning Gan. 2023. "A Paper-Chip-Based Phage Biosensor Combined with a Smartphone Platform for the Quick and On-Site Analysis of E. coli O157:H7 in Foods" Chemosensors 11, no. 2: 151. https://doi.org/10.3390/chemosensors11020151
APA StyleWu, C., Li, D., Jiang, Q., & Gan, N. (2023). A Paper-Chip-Based Phage Biosensor Combined with a Smartphone Platform for the Quick and On-Site Analysis of E. coli O157:H7 in Foods. Chemosensors, 11(2), 151. https://doi.org/10.3390/chemosensors11020151