
New Terbium Complex as a Luminescent Sensor for the Highly Selective Detection of Malathion in Water Samples

 , and
, and
Abstract
:1. Introduction
2. Materials and Methods
2.1. Materials
2.2. Instruments
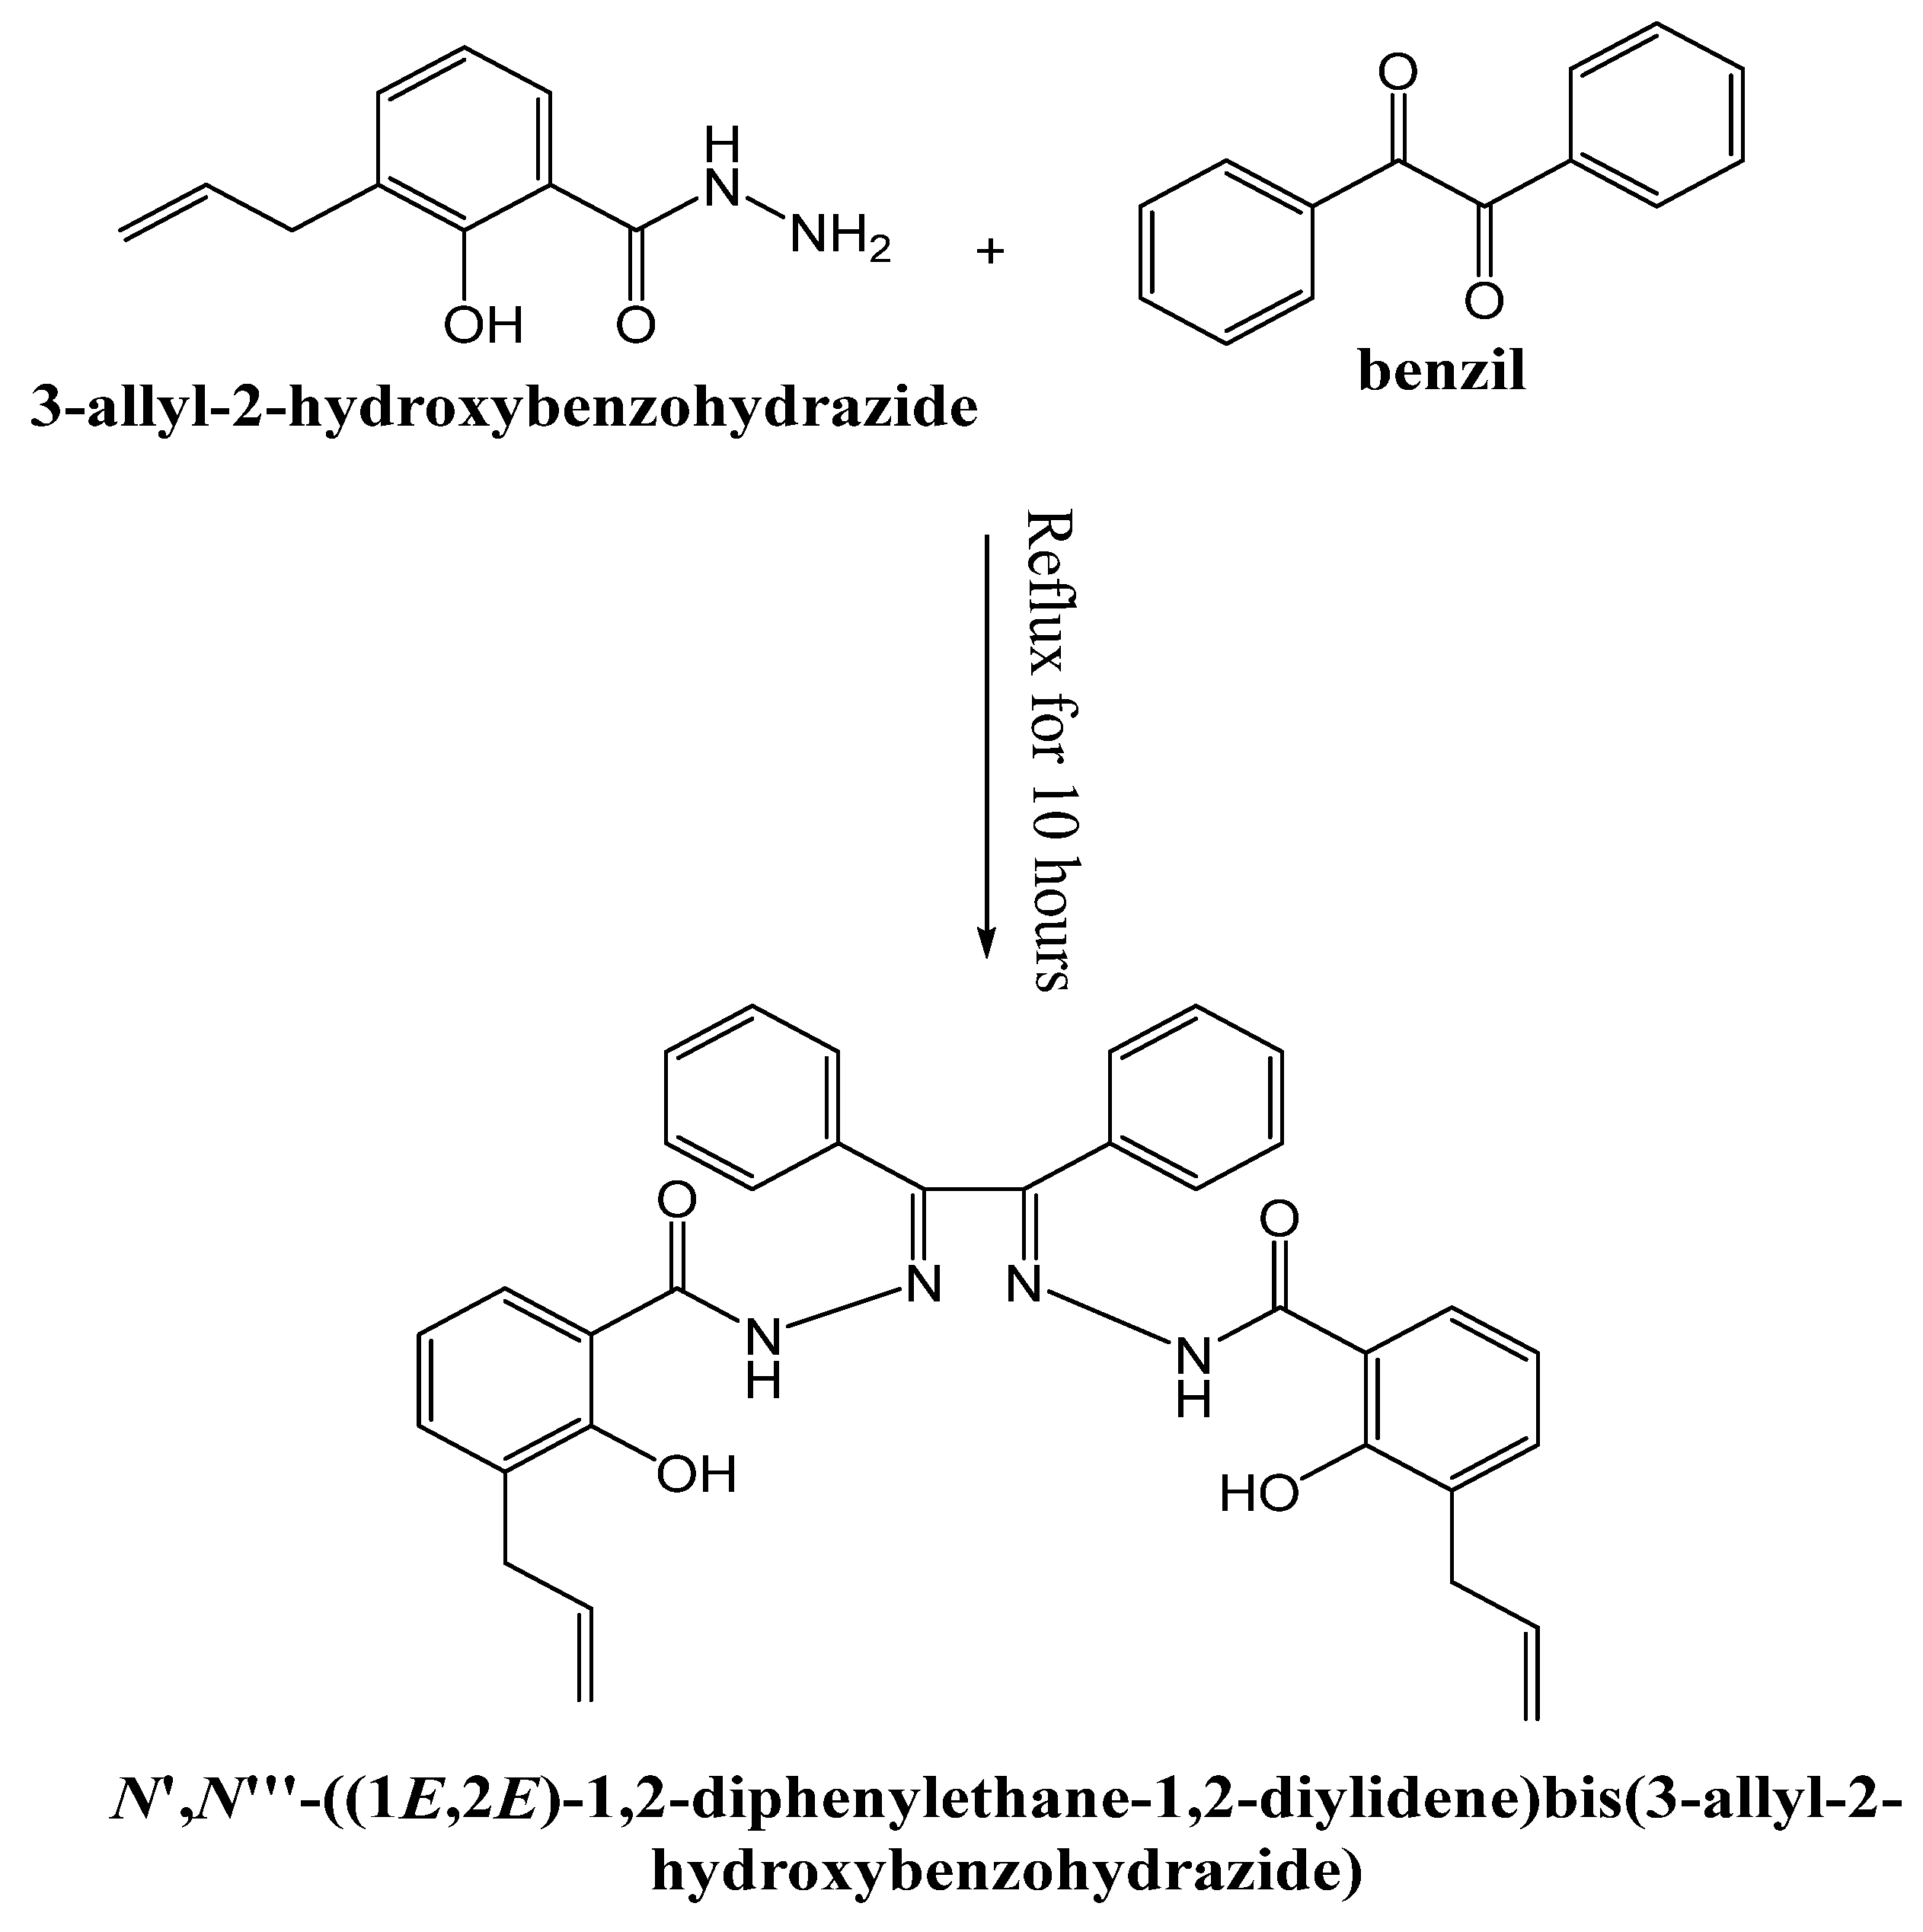
2.3. Ligand Preparation (H2DBAZ)
2.4. Solution Preparation
2.5. The Experimental Procedure
2.6. Sample Preparation
3. Results and Discussion
3.1. Spectral Properties of the Chemosensor and Its Interaction with Malathion
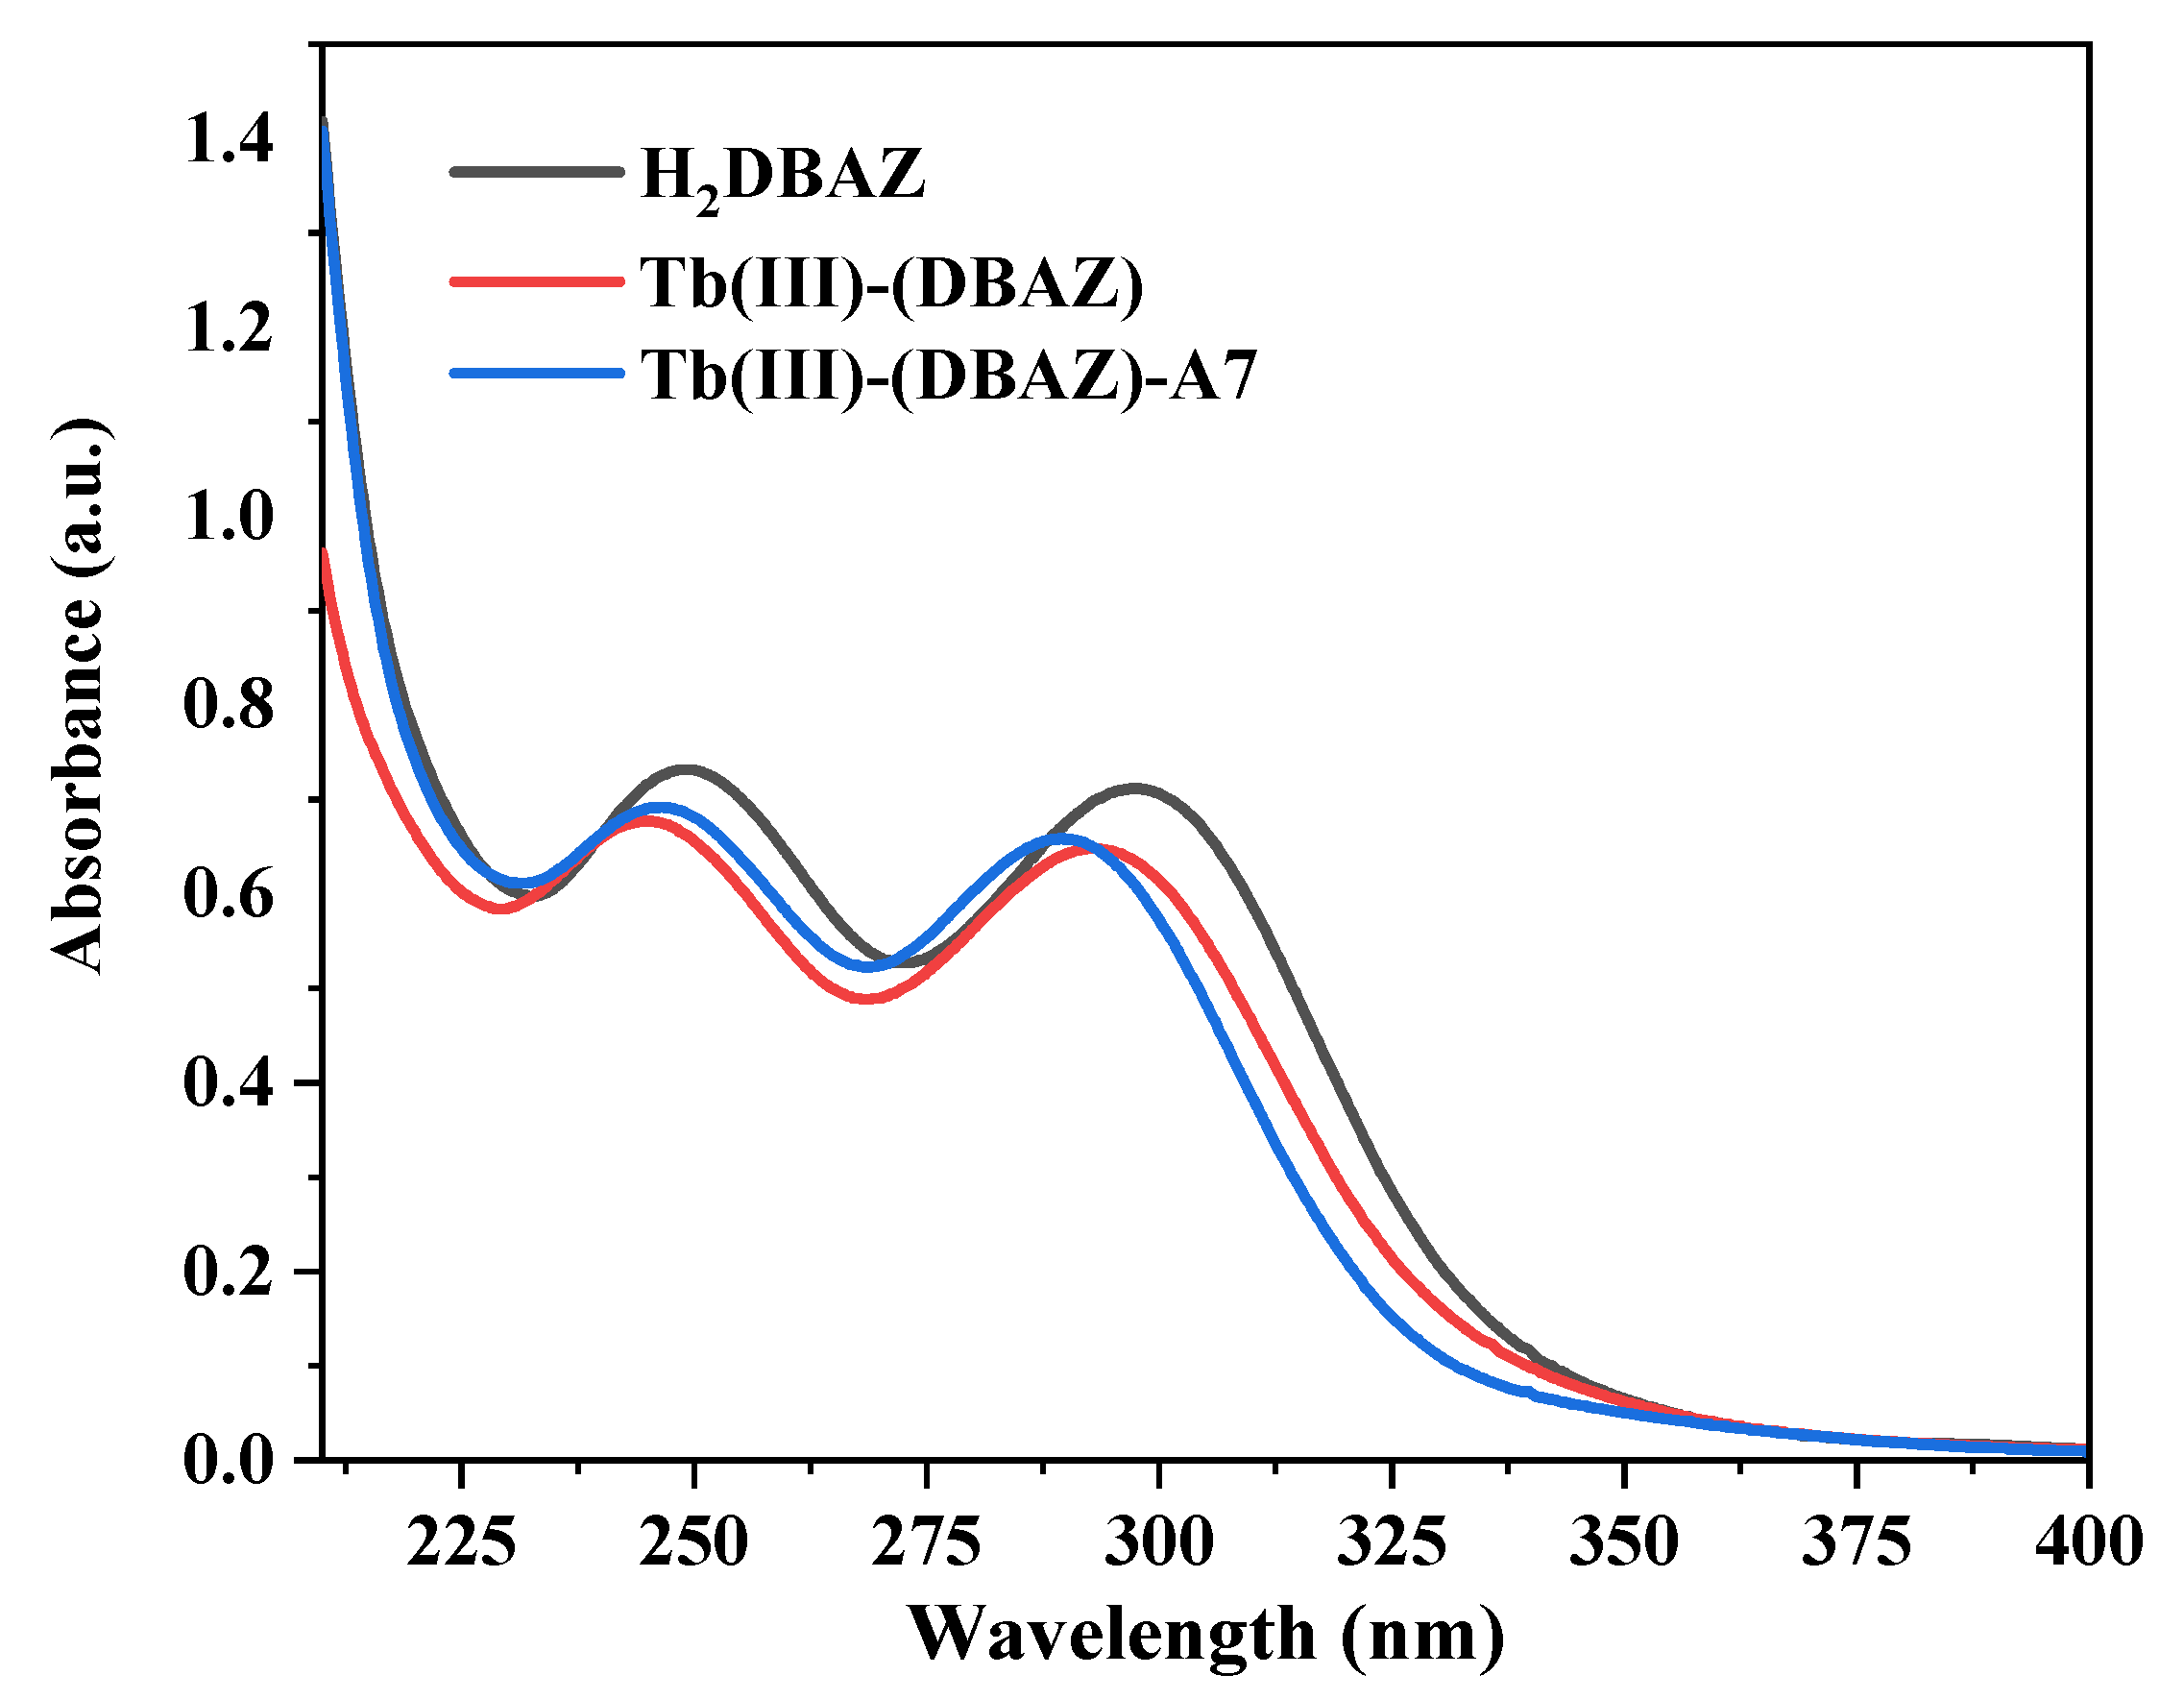
3.1.1. UV–Vis Absorption Spectroscopy
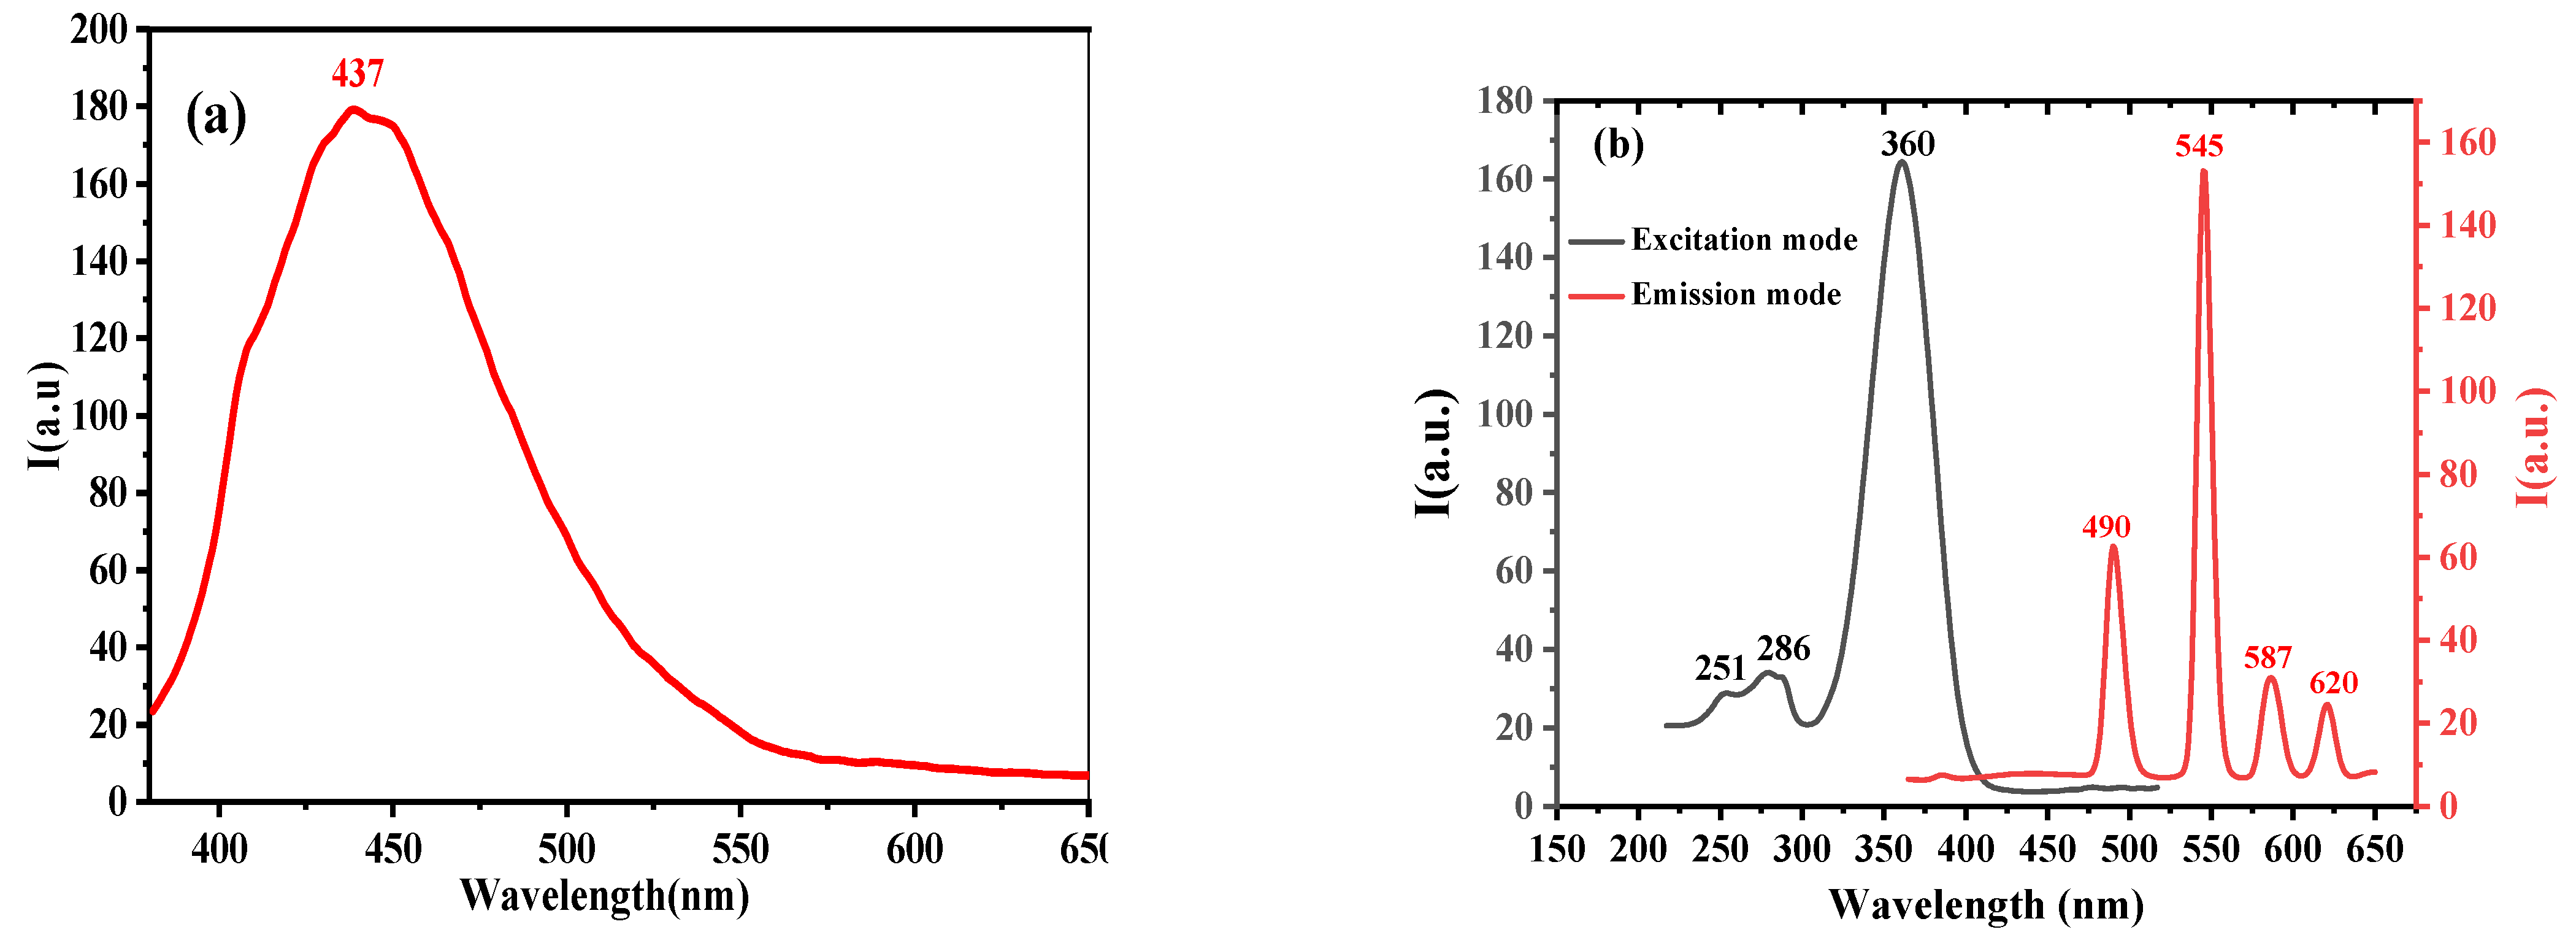
3.1.2. Luminescence Emission Spectroscopy
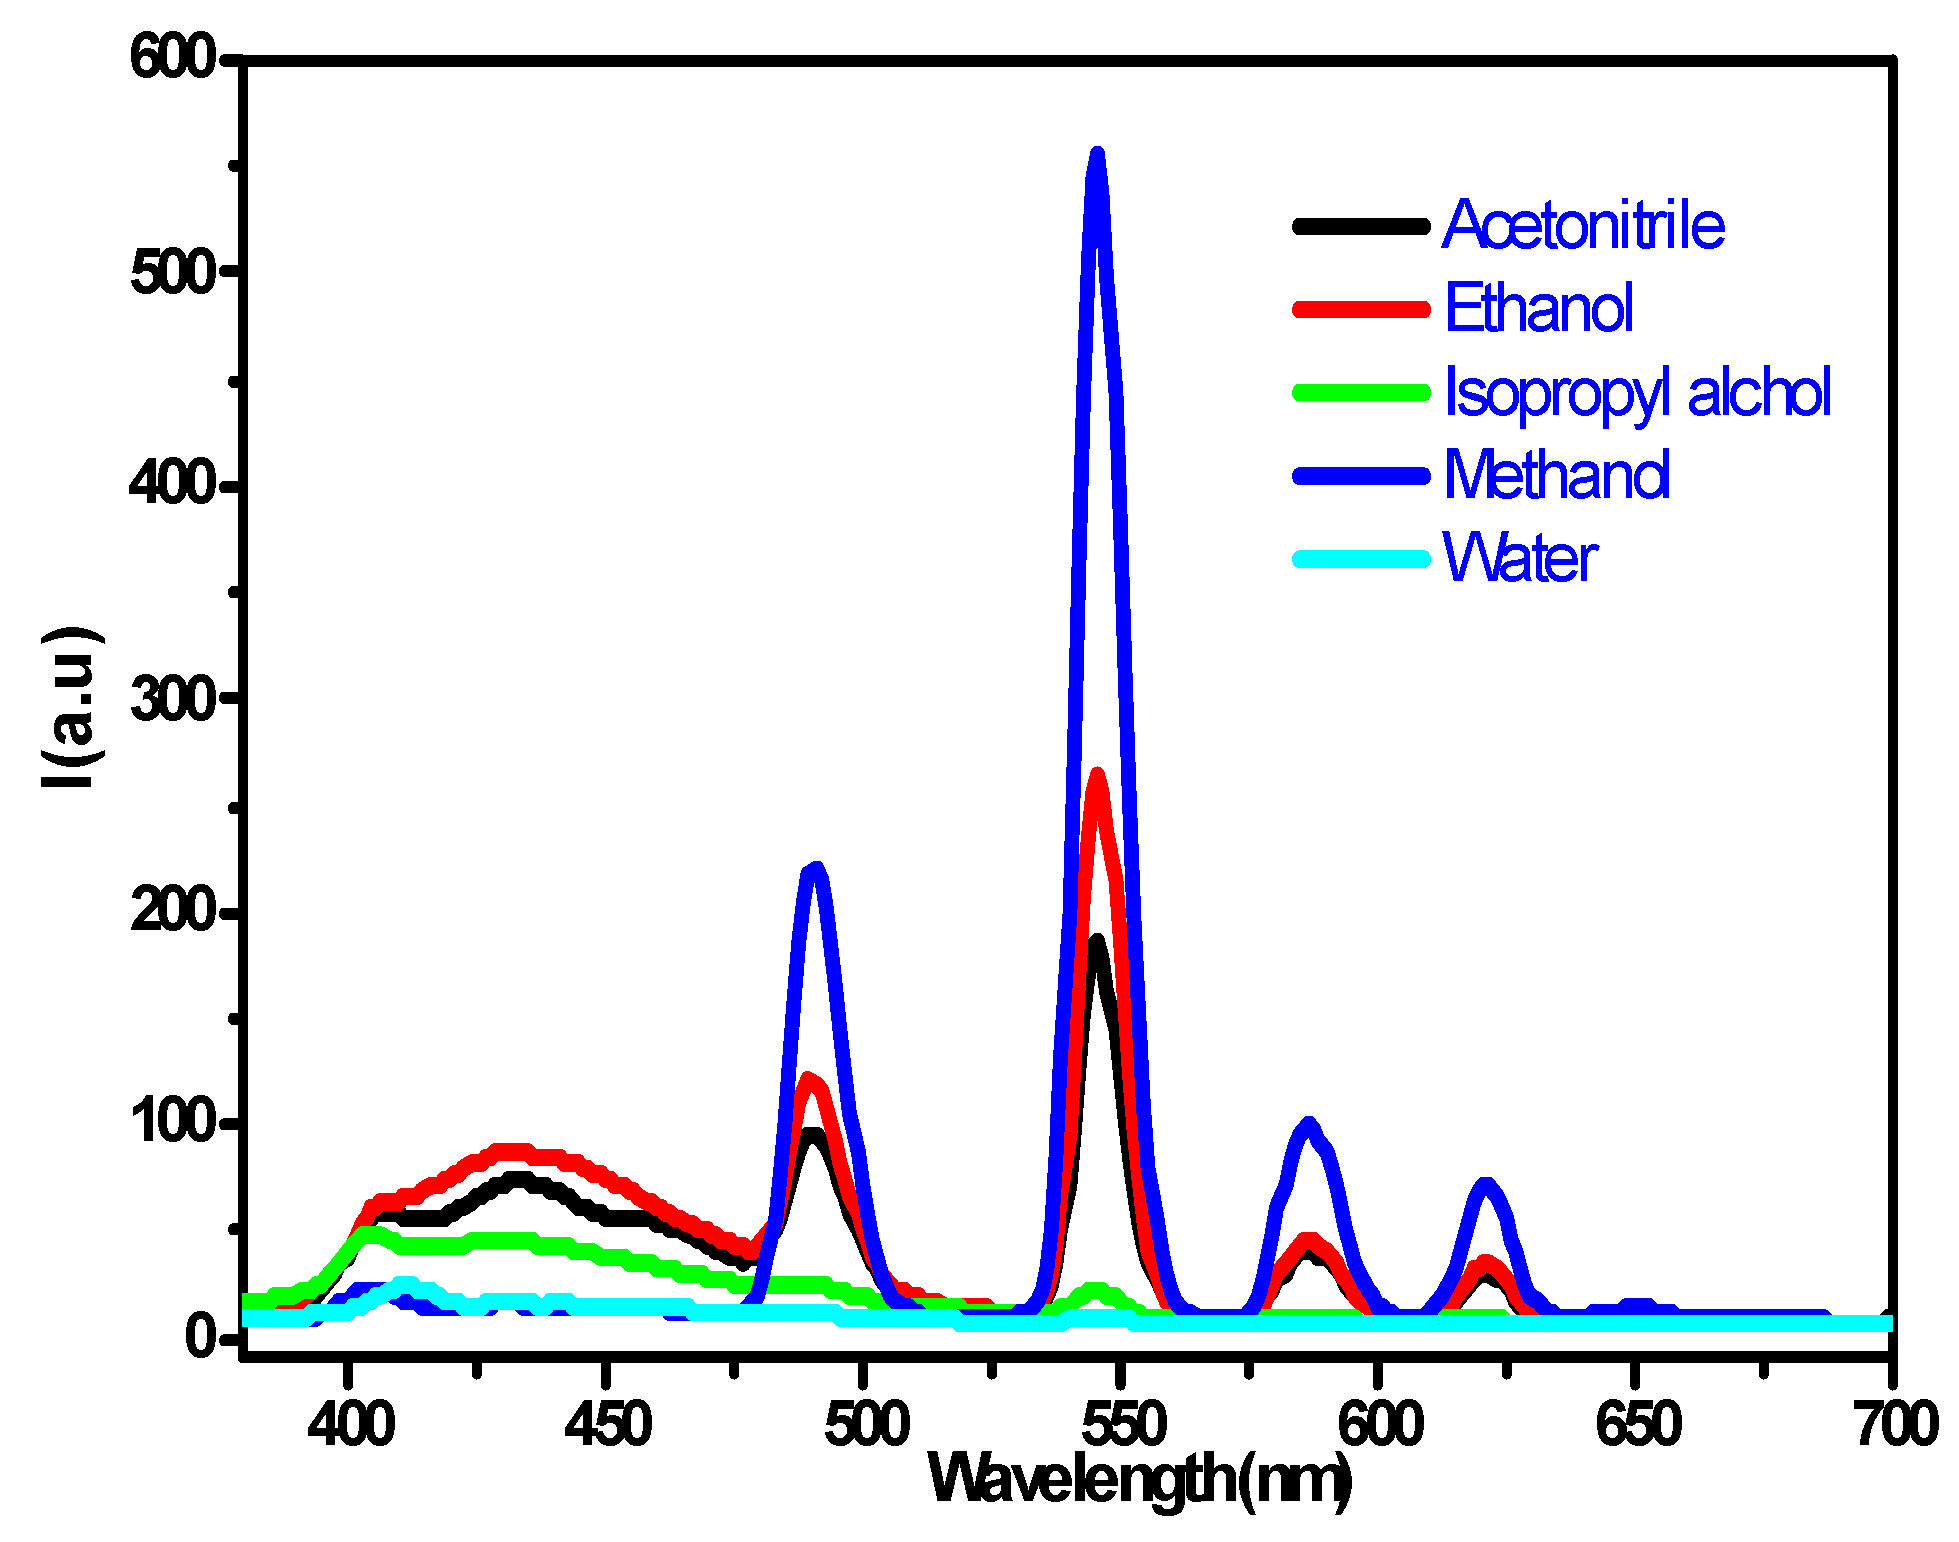
3.2. Solvent Effect
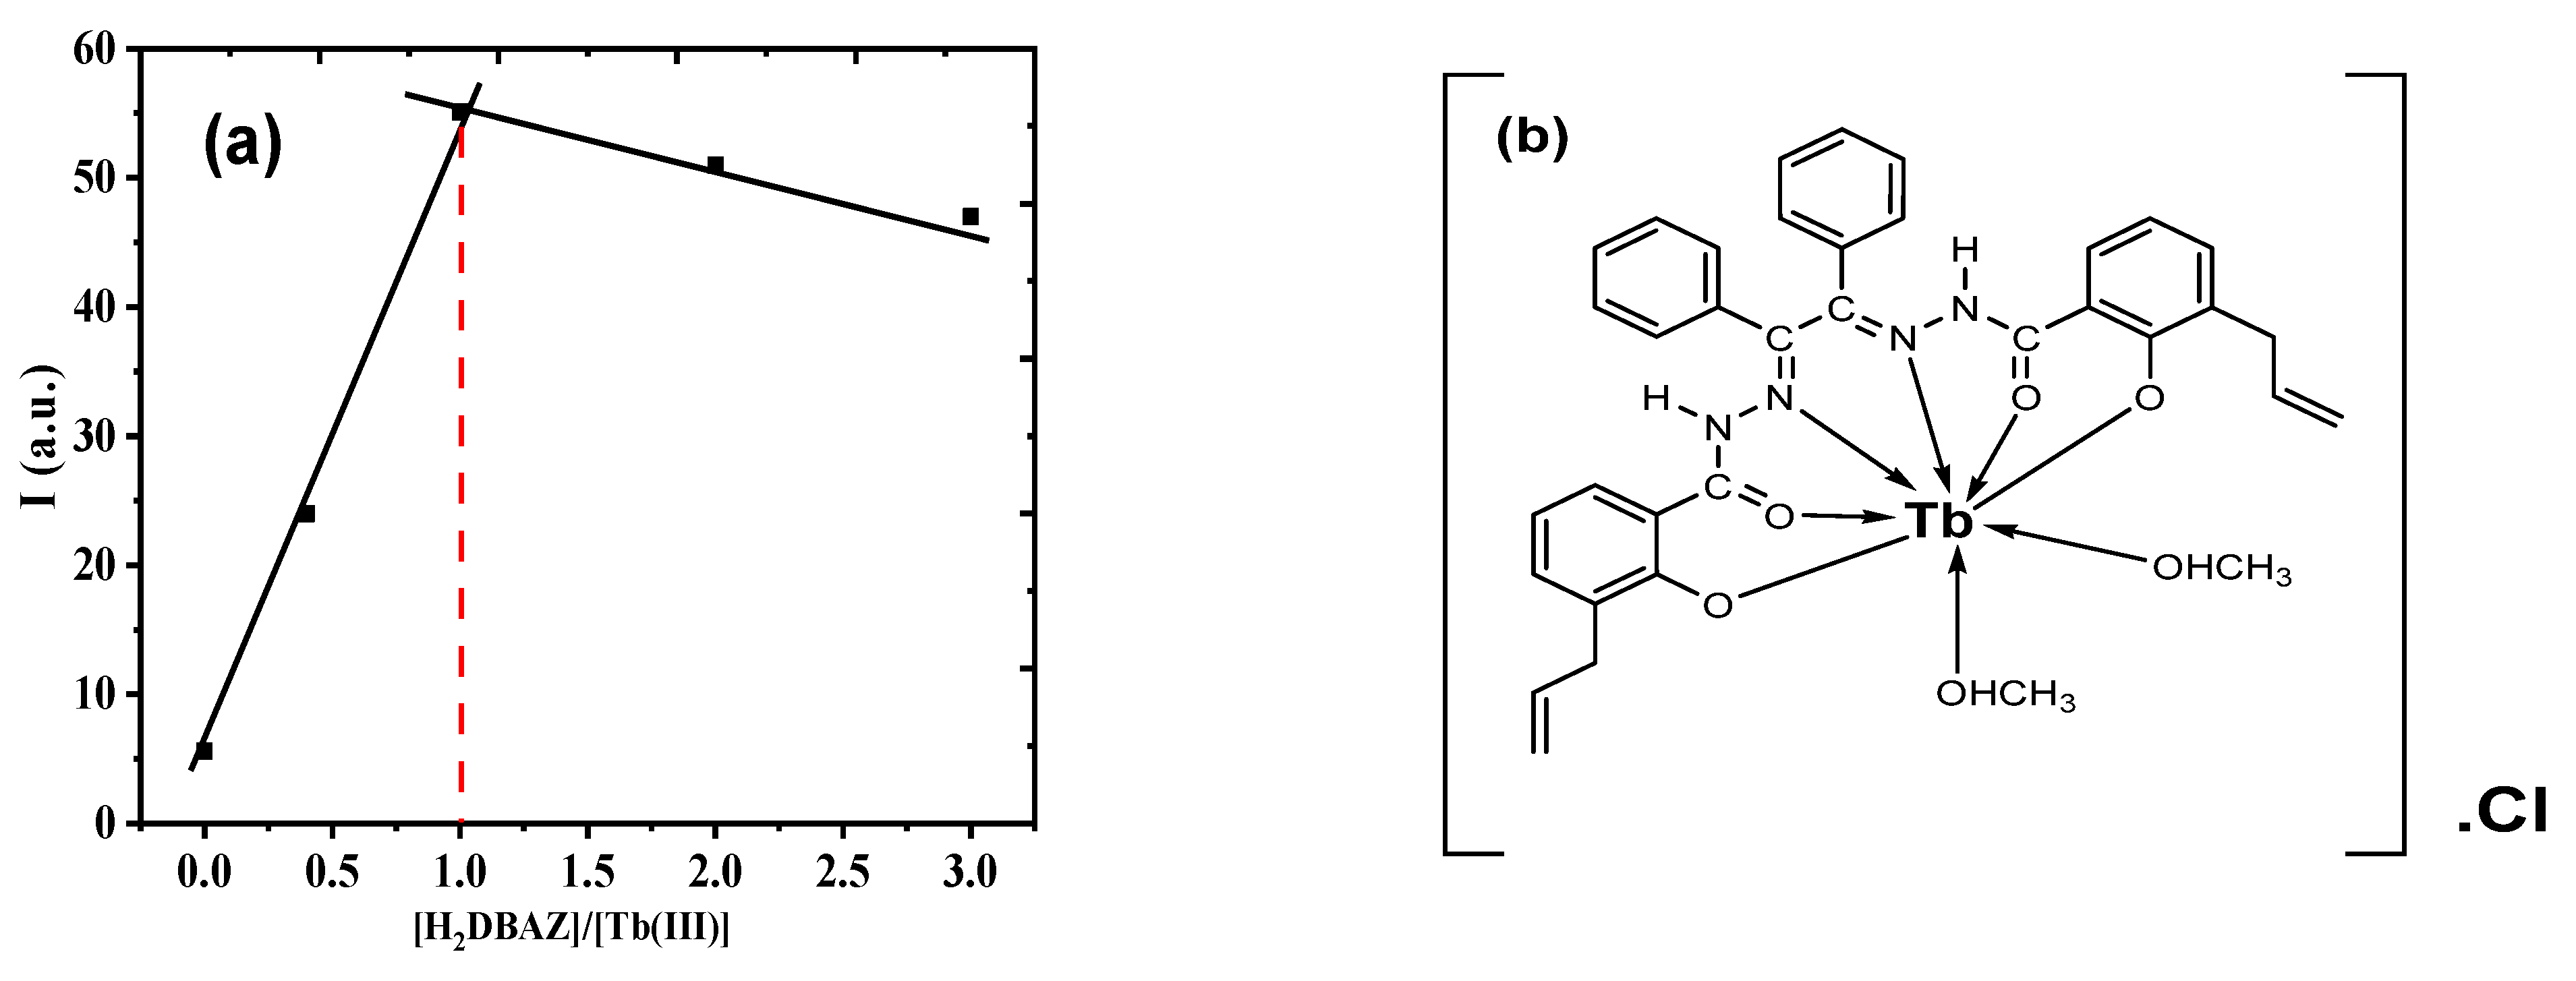
3.3. Complex Stoichiometry
3.4. Response Time
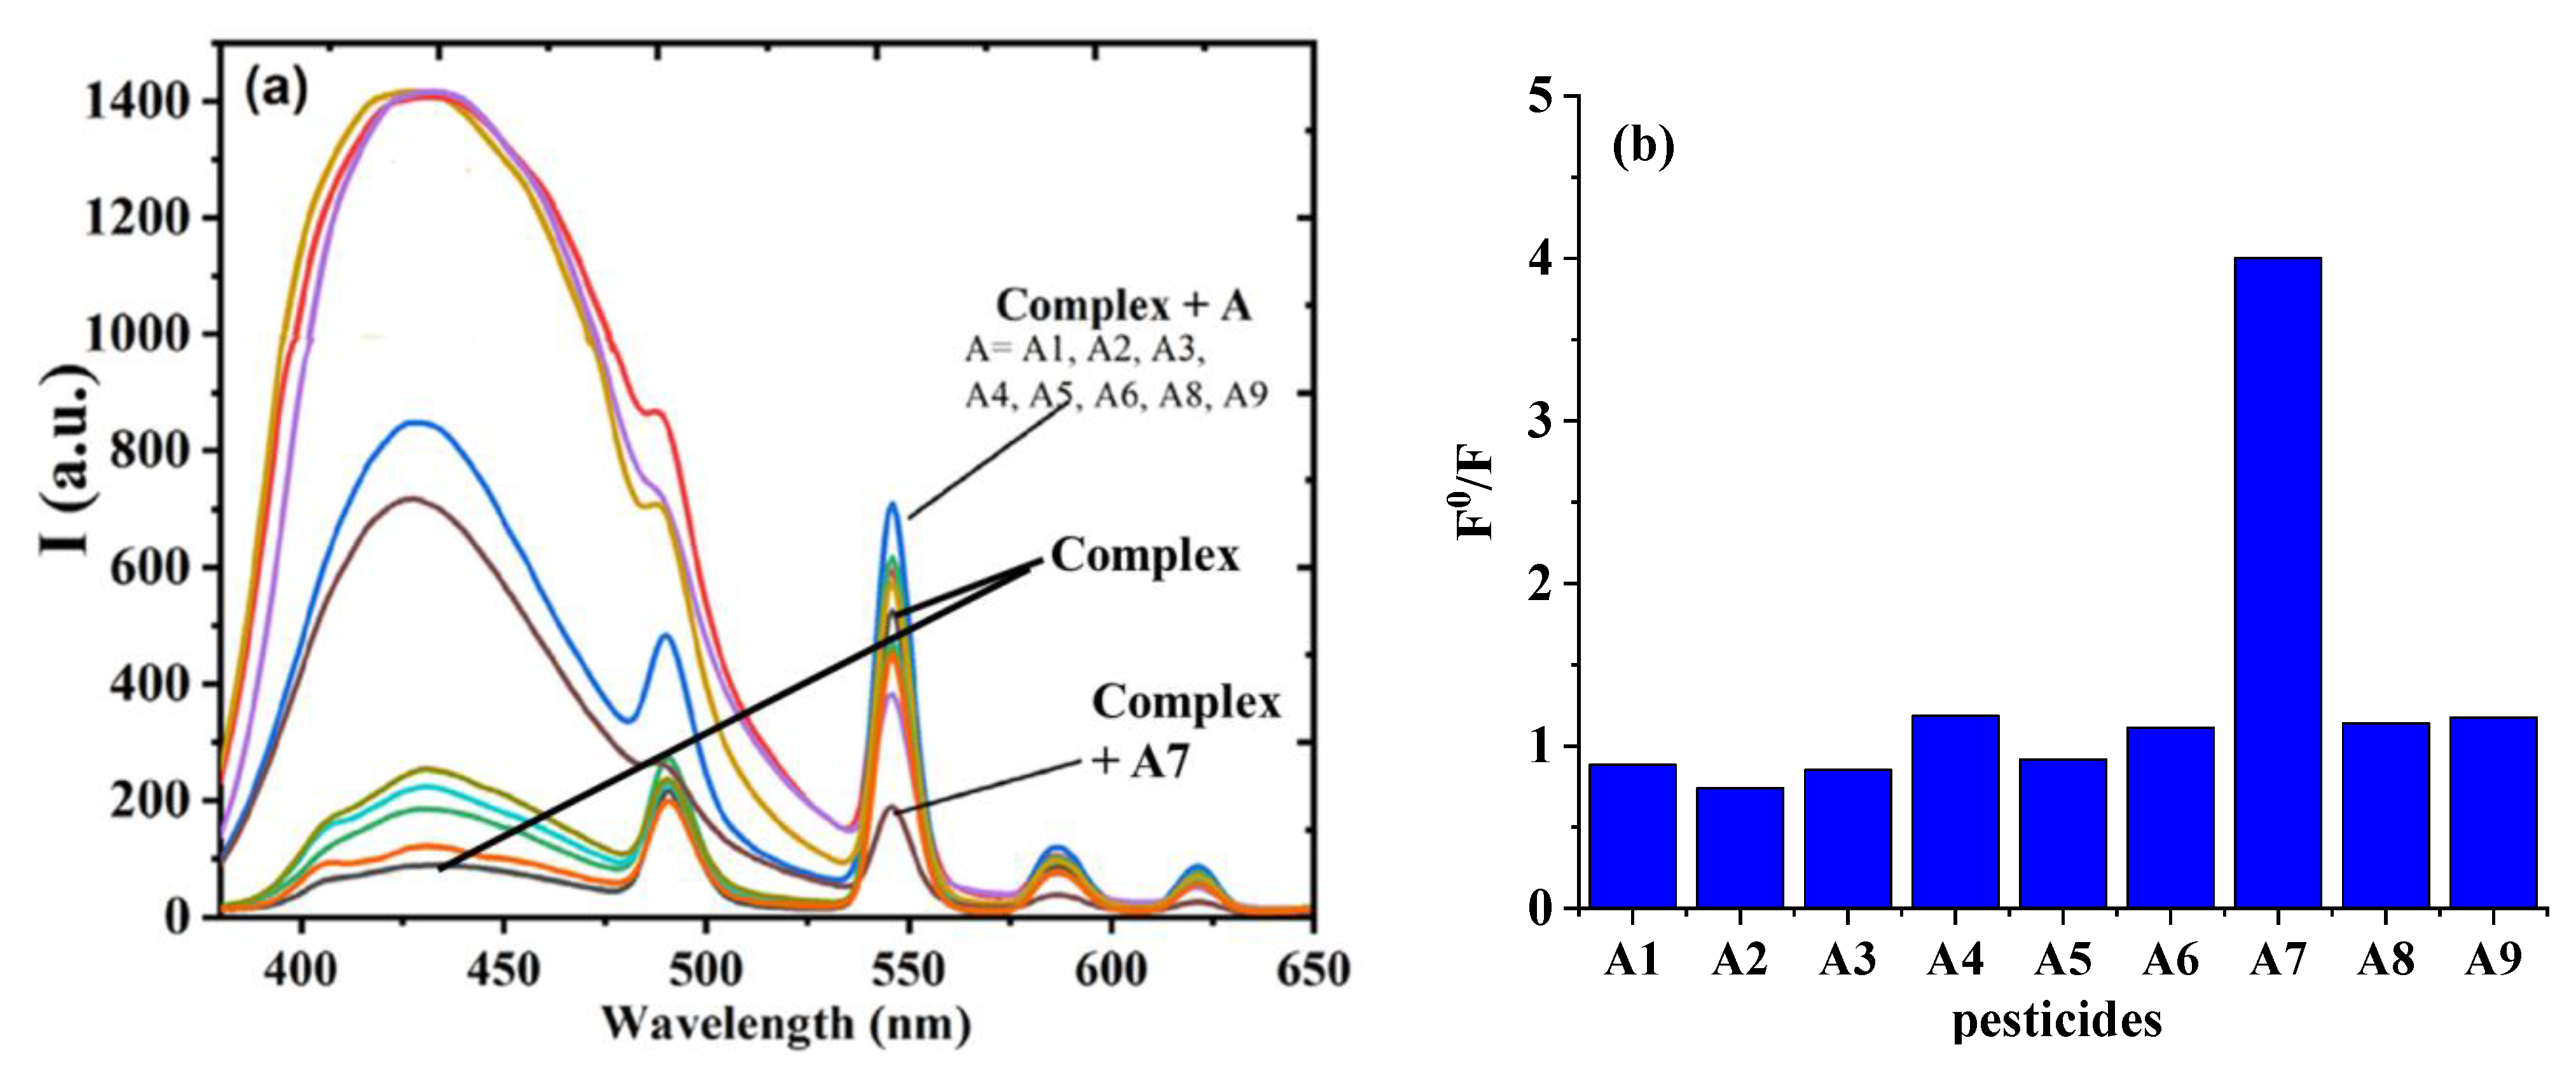
3.5. Selectivity
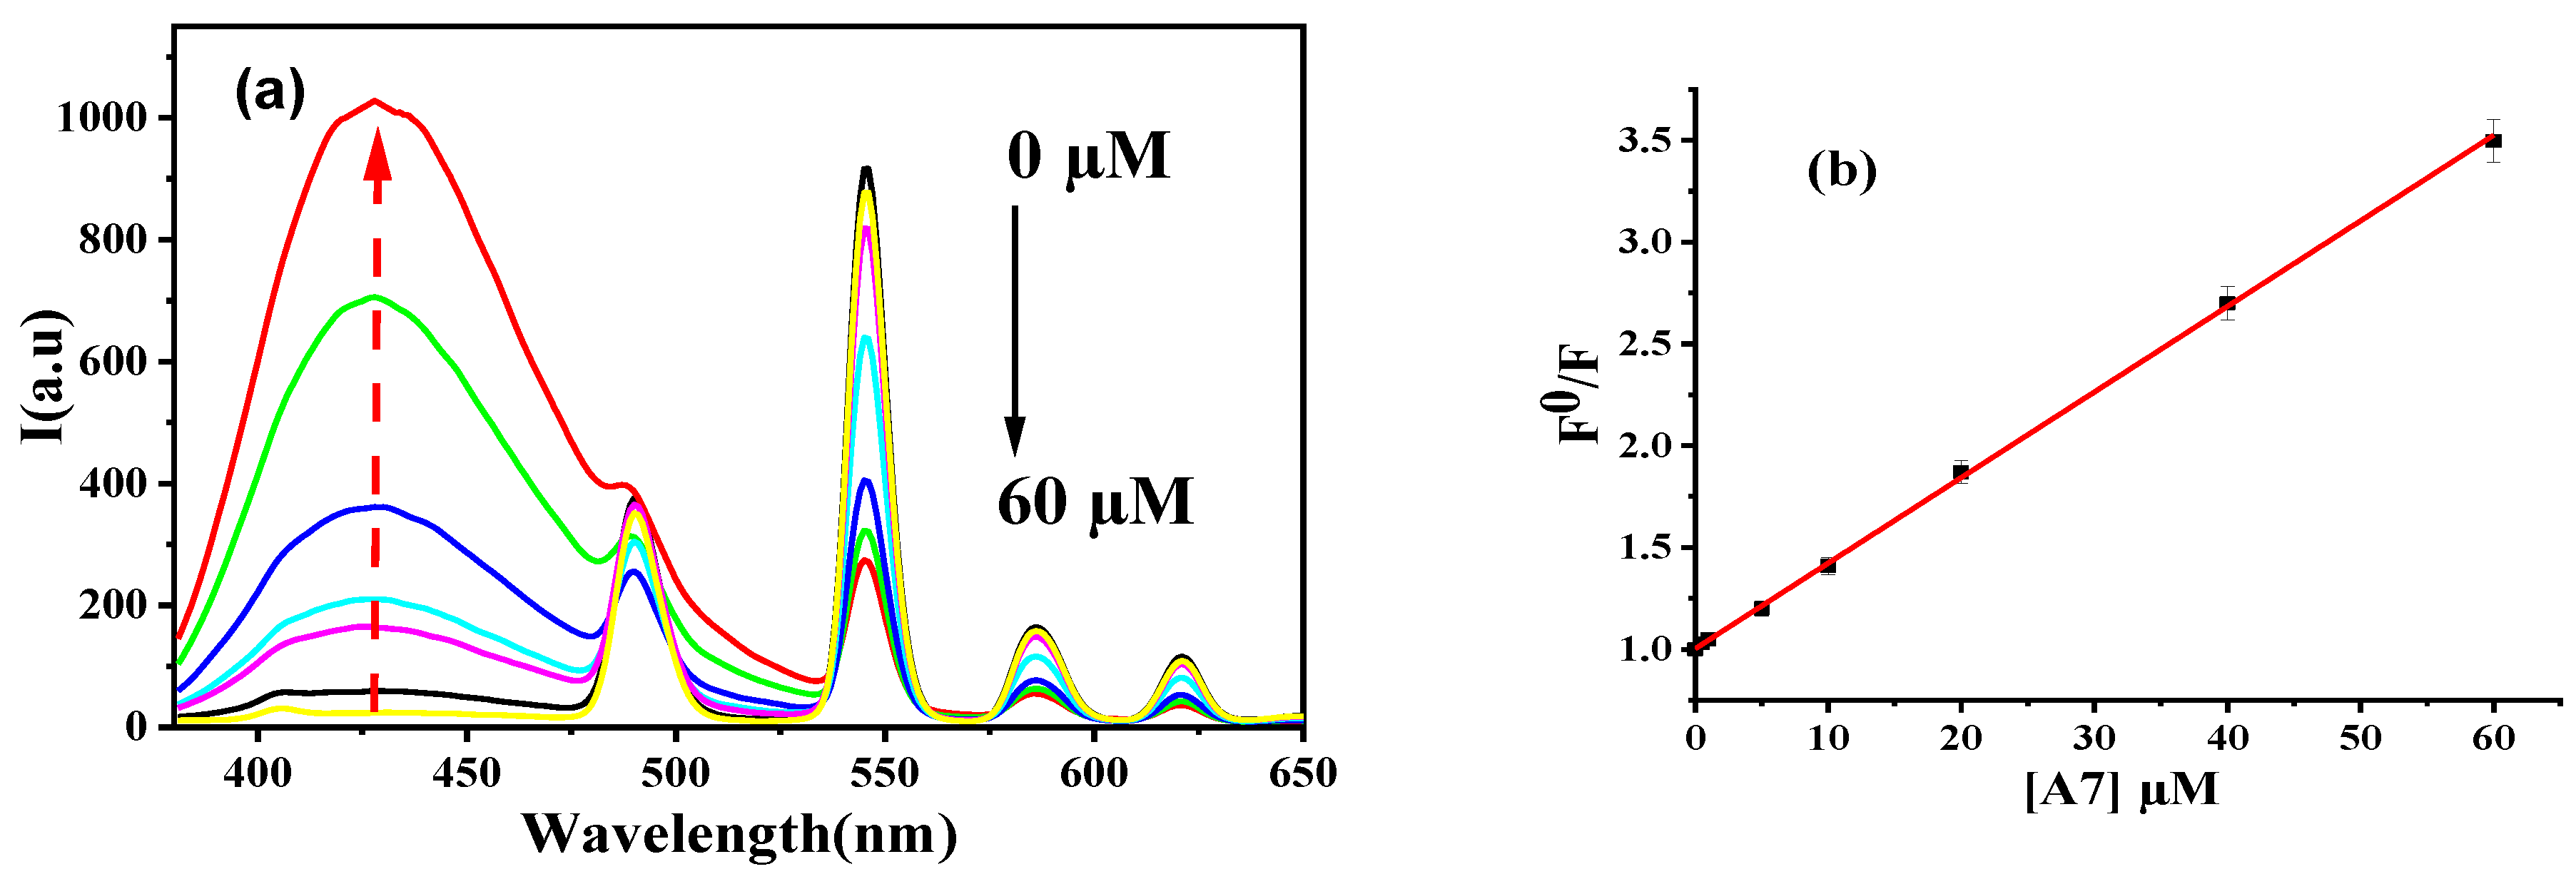
3.6. Calibration Curve
3.7. Mechanism of Quenching
3.8. Thermodynamic Parameters
3.9. Interfering Species
3.10. Application
4. Conclusions
Supplementary Materials
Author Contributions
Funding
Institutional Review Board Statement
Informed Consent Statement
Data Availability Statement
Acknowledgments
Conflicts of Interest
References
- Chen, Y.; Liu, H.; Tian, Y.; Du, Y.; Ma, Y.; Zeng, S.; Gu, C.; Jiang, T.; Zhou, J. In Situ Recyclable Surface-Enhanced Raman Scattering-Based Detection of Multicomponent Pesticide Residues on Fruits and Vegetables by the Flower-like MoS2@Ag Hybrid Substrate. ACS Appl. Mater. Interfaces 2020, 12, 14386–14399. [Google Scholar] [CrossRef]
- Wang, J.; Zhang, J.; Wang, J.; Fang, G.; Liu, J.; Wang, S. Fluorescent Peptide Probes for Organophosphorus Pesticides Detection. J. Hazard. Mater. 2020, 389, 122074. [Google Scholar] [CrossRef]
- Carvalho, F.P. Pesticides, Environment, and Food Safety. Food Energy Secur. 2017, 6, 48–60. [Google Scholar] [CrossRef]
- Singh, R.; Kumar, N.; Mehra, R.; Kumar, H.; Singh, V.P. Progress and Challenges in the Detection of Residual Pesticides Using Nanotechnology Based Colorimetric Techniques. Trends Environ. Anal. Chem. 2020, 26, e00086. [Google Scholar] [CrossRef]
- Lu, Y.; Wei, M.; Wang, C.; Wei, W.; Liu, Y. Enhancing Hydrogel-Based Long-Lasting Chemiluminescence by a Platinum-Metal Organic Framework and Its Application in Array Detection of Pesticides and d-Amino Acids. Nanoscale 2020, 12, 4959–4967. [Google Scholar] [CrossRef]
- Tang, F.H.M.; Lenzen, M.; McBratney, A.; Maggi, F. Risk of Pesticide Pollution at the Global Scale. Nat. Geosci. 2021, 14, 206–210. [Google Scholar] [CrossRef]
- Zhou, B.; Li, X. The Monitoring of Chemical Pesticides Pollution on Ecological Environment by GIS. Environ. Technol. Innov. 2021, 23, 101506. [Google Scholar] [CrossRef]
- Irfan Azizan, M.A.; Taufik, S.; Norizan, M.N.; Abdul Rashid, J.I. A Review on Surface Modification in the Development of Electrochemical Biosensor for Malathion. Biosens. Bioelectron. X 2023, 13, 100291. [Google Scholar] [CrossRef]
- Lai, X.; Zhang, S.; Du, G.; Wang, Y.; Han, Y.; Ye, N.; Xiang, Y. Ultrasensitive Determination of Malathion in Apples by Aptamer-Based Resonance Scattering. Anal. Lett. 2021, 54, 1639–1653. [Google Scholar] [CrossRef]
- Aghoutane, Y.; Diouf, A.; Österlund, L.; Bouchikhi, B.; El Bari, N. Development of a Molecularly Imprinted Polymer Electrochemical Sensor and Its Application for Sensitive Detection and Determination of Malathion in Olive Fruits and Oils. Bioelectrochemistry 2020, 132, 107404. [Google Scholar] [CrossRef] [PubMed]
- Toxicological Profile for Malathion; Agency for Toxic Substances and Disease Registry (ATSDR): Atlanta, GA, USA; United State Department of Health & Human Services: Atlanta, GA, USA; Public Health Services: Atlanta, GA, USA, 2003.
- Chen, Q.; Sheng, R.; Wang, P.; Ouyang, Q.; Wang, A.; Ali, S.; Zareef, M.; Hassan, M.M. Ultra-Sensitive Detection of Malathion Residues Using FRET-Based Upconversion Fluorescence Sensor in Food. Spectrochim. Acta A Mol. Biomol. Spectrosc. 2020, 241, 118654. [Google Scholar] [CrossRef] [PubMed]
- Phopin, K.; Tantimongcolwat, T. Pesticide Aptasensors—State of the Art and Perspectives. Sensors 2020, 20, 6809. [Google Scholar] [CrossRef] [PubMed]
- Khatib, I.; Horyn, O.; Bodnar, O.; Lushchak, O.; Rychter, P.; Falfushynska, H. Molecular and Biochemical Evidence of the Toxic Effects of Terbuthylazine and Malathion in Zebrafish. Animals 2023, 13, 1029. [Google Scholar] [CrossRef] [PubMed]
- Elmorsy, E.; Al-Ghafari, A.; Al Doghaither, H.; Salama, M.; Carter, W.G. An Investigation of the Neurotoxic Effects of Malathion, Chlorpyrifos, and Paraquat to Different Brain Regions. Brain Sci. 2022, 12, 975. [Google Scholar] [CrossRef]
- Vasimalai, N.; Abraham John, S. Biopolymer Capped Silver Nanoparticles as Fluorophore for Ultrasensitive and Selective Determination of Malathion. Talanta 2013, 115, 24–31. [Google Scholar] [CrossRef] [PubMed]
- Uygun, U.; Özkara, R.; Özbey, A.; Koksel, H. Residue Levels of Malathion and Fenitrothion and Their Metabolites in Postharvest Treated Barley during Storage and Malting. Food Chem. 2007, 100, 1165–1169. [Google Scholar] [CrossRef]
- Vettorazzi, G. Pesticide Residues in Food in the Context of Present and Future International Pesticide Managerial Approaches. In Pesticide Management and Insecticide Resistance; Elsevier: Amsterdam, The Netherlands, 1977; pp. 97–128. [Google Scholar]
- Liu, M.; Wei, J.; Wang, Y.; Ouyang, H.; Fu, Z. Dopamine-Functionalized Upconversion Nanoparticles as Fluorescent Sensors for Organophosphorus Pesticide Analysis. Talanta 2019, 195, 706–712. [Google Scholar] [CrossRef]
- Tazarv, M.; Faraji, H.; Moghimi, A.; Azizinejad, F. Bursting-bubble Flow Microextraction Combined with Gas Chromatography to Analyze Organophosphorus Pesticides in Aqueous Samples. J. Sep. Sci. 2021, 44, 2965–2971. [Google Scholar] [CrossRef]
- Harshit, D.; Charmy, K.; Nrupesh, P. Organophosphorus Pesticides Determination by Novel HPLC and Spectrophotometric Method. Food Chem. 2017, 230, 448–453. [Google Scholar] [CrossRef]
- Wang, H.; Qu, B.; Liu, H.; Ding, J.; Ren, N. Analysis of Organochlorine Pesticides in Surface Water of the Songhua River Using Magnetoliposomes as Adsorbents Coupled with GC-MS/MS Detection. Sci. Total Environ. 2018, 618, 70–79. [Google Scholar] [CrossRef]
- Aslantas, S.; Golge, O.; González-Curbelo, M.Á.; Kabak, B. Determination of 355 Pesticides in Lemon and Lemon Juice by LC-MS/MS and GC-MS/MS. Foods 2023, 12, 1812. [Google Scholar] [CrossRef] [PubMed]
- Liu, W.; Quan, J.; Hu, Z. Detection of Organophosphorus Pesticides in Wheat by Ionic Liquid-Based Dispersive Liquid-Liquid Microextraction Combined with HPLC. J. Anal. Methods Chem. 2018, 2018, 8916393. [Google Scholar] [CrossRef] [PubMed]
- Albanis, T.A.; Hela, D.G. Multi-Residue Pesticide Analysis in Environmental Water Samples Using Solid-Phase Extraction Discs and Gas Chromatography with Flame Thermionic and Mass-Selective Detection. J. Chromatogr. A 1995, 707, 283–292. [Google Scholar] [CrossRef]
- Louca Christodoulou, D.; Kourouzidou, O.; Hadjigeorgiou, M.; Hadjiloizou, P.; Constantinou, M.; Constantinou, P.; Kika, K.; Klavarioti, M. Multi-Residue Analysis of Pesticide Residues in Fruits and Vegetables Using Gas and Liquid Chromatography with Mass Spectrometric Detection. Accredit. Qual. Assur. 2018, 23, 145–175. [Google Scholar] [CrossRef]
- Ma, T.; Zhou, J.; Wei, D.; Peng, H.; Liu, X.; Guo, W.; Zhang, C.; Liu, X.; Li, S.; Deng, Y. Ultrasensitive Electrochemical Aptasensing of Malathion Based on Hydroxylated Black Phosphorus/Poly-L-Lysine Composite. Biosensors 2023, 13, 735. [Google Scholar] [CrossRef] [PubMed]
- Alonso-Lomillo, M.A.; Dominguez-Renedo, O.; Matos, P.; Arcos-Martinez, M.J. Disposable Biosensors for Determination of Biogenic Amines. Anal. Chim. Acta 2010, 665, 26–31. [Google Scholar] [CrossRef] [PubMed]
- Lukowiak, A.; Strek, W. Sensing Abilities of Materials Prepared by Sol–Gel Technology. J. Solgel Sci. Technol. 2009, 50, 201–215. [Google Scholar] [CrossRef]
- Umapathi, R.; Park, B.; Sonwal, S.; Rani, G.M.; Cho, Y.; Huh, Y.S. Advances in Optical-Sensing Strategies for the on-Site Detection of Pesticides in Agricultural Foods. Trends Food Sci. Technol. 2022, 119, 69–89. [Google Scholar] [CrossRef]
- Li, W.-K.; Feng, J.-T.; Ma, Z.-Q. Nitrogen, Sulfur, Boron and Flavonoid Moiety Co-Incorporated Carbon Dots for Sensitive Fluorescence Detection of Pesticides. Carbon 2020, 161, 685–693. [Google Scholar] [CrossRef]
- Zhang, B.; Li, B.; Wang, Z. Creation of Carbazole-Based Fluorescent Porous Polymers for Recognition and Detection of Various Pesticides in Water. ACS Sens. 2020, 5, 162–170. [Google Scholar] [CrossRef]
- Cheng, N.; Song, Y.; Fu, Q.; Du, D.; Luo, Y.; Wang, Y.; Xu, W.; Lin, Y. Aptasensor Based on Fluorophore-Quencher Nano-Pair and Smartphone Spectrum Reader for on-Site Quantification of Multi-Pesticides. Biosens. Bioelectron. 2018, 117, 75–83. [Google Scholar] [CrossRef] [PubMed]
- Hu, T.; Xu, J.; Ye, Y.; Han, Y.; Li, X.; Wang, Z.; Sun, D.; Zhou, Y.; Ni, Z. Visual Detection of Mixed Organophosphorous Pesticide Using QD-AChE Aerogel Based Microfluidic Arrays Sensor. Biosens. Bioelectron. 2019, 136, 112–117. [Google Scholar] [CrossRef] [PubMed]
- Shin, Y.-H.; Teresa Gutierrez-Wing, M.; Choi, J.-W. Review—Recent Progress in Portable Fluorescence Sensors. J. Electrochem. Soc. 2021, 168, 017502. [Google Scholar] [CrossRef]
- Wu, D.; Sedgwick, A.C.; Gunnlaugsson, T.; Akkaya, E.U.; Yoon, J.; James, T.D. Fluorescent Chemosensors: The Past, Present and Future. Chem. Soc. Rev. 2017, 46, 7105–7123. [Google Scholar] [CrossRef] [PubMed]
- Nie, Y.; Teng, Y.; Li, P.; Liu, W.; Shi, Q.; Zhang, Y. Label-Free Aptamer-Based Sensor for Specific Detection of Malathion Residues by Surface-Enhanced Raman Scattering. Spectrochim. Acta A Mol. Biomol. Spectrosc. 2018, 191, 271–276. [Google Scholar] [CrossRef] [PubMed]
- Liang, N.; Hu, X.; Li, W.; Mwakosya, A.W.; Guo, Z.; Xu, Y.; Huang, X.; Li, Z.; Zhang, X.; Zou, X.; et al. Fluorescence and Colorimetric Dual-Mode Sensor for Visual Detection of Malathion in Cabbage Based on Carbon Quantum Dots and Gold Nanoparticles. Food Chem. 2021, 343, 128494. [Google Scholar] [CrossRef] [PubMed]
- Bala, R.; Swami, A.; Tabujew, I.; Peneva, K.; Wangoo, N.; Sharma, R.K. Ultra-Sensitive Detection of Malathion Using Quantum Dots-Polymer Based Fluorescence Aptasensor. Biosens Bioelectron 2018, 104, 45–49. [Google Scholar] [CrossRef]
- Zhai, W.; Cao, M.; Xiao, Z.; Li, D.; Wang, M. Rapid Detection of Malathion, Phoxim and Thiram on Orange Surfaces Using Ag Nanoparticle Modified PDMS as Surface-Enhanced Raman Spectroscopy Substrate. Foods 2022, 11, 3597. [Google Scholar] [CrossRef]
- Azab, H.A.; Ibrahim, I.A.; Hassan, N.; Abbas, A.M.; Darwish, H.M. Synthesis and Photo-Physical Properties of Novel Tb(III)-[Ethyl-4-Hydroxy-1-(4-Methoxyphenyl)−2-Quinolinone-3-Carboxylate] Complex and Luminescence Sensitivity towards Malathion and Crotoxyphos Pesticides. J. Lumin. 2017, 192, 376–384. [Google Scholar] [CrossRef]
- Azab, H.A.; Kamel, R.M. Binding of Chlorfenvinphos and Malathion with DNA and Their Detection Using New Sensitive Luminescent Tb(III) Complex Probe. J. Lumin. 2016, 170, 671–678. [Google Scholar] [CrossRef]
- Azab, H.A.; Anwar, Z.M.; Rizk, M.A.; Khairy, G.M.; El-Asfoury, M.H. Determination of Organophosphorus Pesticides in Water Samples by Using a New Sensitive Luminescent Probe of Eu (III) Complex. J. Lumin. 2015, 157, 371–382. [Google Scholar] [CrossRef]
- Azab, H.A.; Duerkop, A.; Anwar, Z.M.; Hussein, B.H.M.; Rizk, M.A.; Amin, T. Luminescence Recognition of Different Organophosphorus Pesticides by the Luminescent Eu(III)–Pyridine-2,6-Dicarboxylic Acid Probe. Anal. Chim. Acta 2013, 759, 81–91. [Google Scholar] [CrossRef] [PubMed]
- Hasegawa, Y.; Wada, Y.; Yanagida, S. Strategies for the Design of Luminescent Lanthanide(III) Complexes and Their Photonic Applications. J. Photochem. Photobiol. C Photochem. Rev. 2004, 5, 183–202. [Google Scholar] [CrossRef]
- Parker, D.; Dickins, R.S.; Puschmann, H.; Crossland, C.; Howard, J.A.K. Being Excited by Lanthanide Coordination Complexes: Aqua Species, Chirality, Excited-State Chemistry, and Exchange Dynamics. Chem. Rev. 2002, 102, 1977–2010. [Google Scholar] [CrossRef] [PubMed]
- Montalti, M.; Prodi, L.; Zaccheroni, N.; Charbonnière, L.; Douce, L.; Ziessel, R. A Luminescent Anion Sensor Based on a Europium Hybrid Complex. J. Am. Chem. Soc. 2001, 123, 12694–12695. [Google Scholar] [CrossRef] [PubMed]
- Richardson, F.S. Terbium(III) and Europium(III) Ions as Luminescent Probes and Stains for Biomolecular Systems. Chem. Rev. 1982, 82, 541–552. [Google Scholar] [CrossRef]
- Thibon, A.; Pierre, V.C. Principles of Responsive Lanthanide-Based Luminescent Probes for Cellular Imaging. Anal. Bioanal. Chem. 2009, 394, 107–120. [Google Scholar] [CrossRef]
- de Bettencourt-Dias, A. Luminescence of Lanthanide Ions in Coordination Compounds and Nanomaterials; de Bettencourt-Dias, A., Ed.; John Wiley & Sons Ltd.: Hoboken, NJ, USA, 2014; ISBN 9781118682760. [Google Scholar]
- Kubeil, M.; Martínez, I.; Bachmann, M.; Kopka, K.; Tuck, K.; Stephan, H. Dual-Labelling Strategies for Nuclear and Fluorescence Molecular Imaging: Current Status and Future Perspectives. Pharmaceuticals 2022, 15, 432. [Google Scholar] [CrossRef]
- Zhao, G.-J.; Han, K.-L. Role of Intramolecular and Intermolecular Hydrogen Bonding in Both Singlet and Triplet Excited States of Aminofluorenones on Internal Conversion, Intersystem Crossing, and Twisted Intramolecular Charge Transfer. J. Phys. Chem. A 2009, 113, 14329–14335. [Google Scholar] [CrossRef]
- Ceba, M.R.; Blanco, C.C.; Sánchez, F.G. Solvent Effects on Electronic Absorption and Fluorescence Spectra of Salicylaldehyde 2-Pyridylhydrazone and Indolaldehyde 2-Salicylhydrazone: Ground and Excited State Dissociation Constants. J. Photochem. 1985, 30, 353–362. [Google Scholar] [CrossRef]
- Ressalan, S.; Iyer, C.S.P. Absorption and Fluorescence Spectroscopy of 3-Hydroxy-3-Phenyl-1-o-Carboxyphenyltriazene and Its Copper (II), Nickel (II) and Zinc (II) Complexes: A Novel Fluorescence Sensor. J. Lumin. 2005, 111, 121–129. [Google Scholar] [CrossRef]
- Ibrahim, I.A.; Abbas, A.M.; Darwish, H.M. Fluorescence Sensing of Dichlorvos Pesticide by the Luminescent Tb(III)-3-Ally-Salicylohydrazide Probe. Luminescence 2017, 32, 1541–1546. [Google Scholar] [CrossRef]
- Azab, H.A.; Khairy, G.M.; El-Ghany, N.A.; Ahmed, M.A. Time-Resolved Fluorescence Sensing of N-Acetyl Amino Acids, Nucleobases, Nucleotides and DNA by the Luminescent Tb (III)-8-Alkyl-2-Oxo-2H-Chromene-3-Carbaldehyde Probe. J. Lumin. 2016, 176, 181–192. [Google Scholar] [CrossRef]
- Li, Q.; Li, T. Jinguang Wu Luminescence of Europium(III) and Terbium(III) Complexes Incorporated in Poly(Vinyl Pyrrolidone) Matrix. J. Phys. Chem. B 2001, 105, 12293–12296. [Google Scholar] [CrossRef]
- Lehn, J.-M. Perspectives in Supramolecular Chemistry—From Molecular Recognition towards Molecular Information Processing and Self-Organization. Angew. Chem. Int. Ed. 1990, 29, 1304–1319. [Google Scholar] [CrossRef]
- Xu, J.; Huang, X.H.; Zhou, N.L.; Zhang, J.S.; Bao, J.C.; Lu, T.H.; Li, C. Synthesis, XPS and Fluorescence Properties of Eu3+ Complex with Polydimethylsiloxane. Mater. Lett. 2004, 58, 1938–1942. [Google Scholar] [CrossRef]
- Kazakov, V.P.; Voloshin, A.I.; Ostakhov, S.S.; Shavaleev, N.M. The Anomalous Influence of Water on the Intensity and Lifetime of Fluorescence in Tris(Benzoyltrifluoroacetonate)Europium(III). Mendeleev Commun. 1998, 8, 47–49. [Google Scholar] [CrossRef]
- Kleiman, M.; Ryu, K.A.; Esser-Kahn, A.P. Determination of Factors Influencing the Wet Etching of Polydimethylsiloxane Using Tetra-n-Butylammonium Fluoride. Macromol. Chem. Phys. 2016, 217, 284–291. [Google Scholar] [CrossRef]
- Wang, S.; Cao, T.; Yan, H.; Li, Y.; Lu, J.; Ma, R.; Li, D.; Dou, J.; Bai, J. Functionalization of Microporous Lanthanide-Based Metal–Organic Frameworks by Dicarboxylate Ligands with Methyl-Substituted Thieno[2,3-b]Thiophene Groups: Sensing Activities and Magnetic Properties. Inorg. Chem. 2016, 55, 5139–5151. [Google Scholar] [CrossRef]
- Genovese, D.; Cingolani, M.; Rampazzo, E.; Prodi, L.; Zaccheroni, N. Static Quenching upon Adduct Formation: A Treatment without Shortcuts and Approximations. Chem. Soc. Rev. 2021, 50, 8414–8427. [Google Scholar] [CrossRef]
- Azab, H.A.; Khairy, G.M.; El-Ghany, N.A.; Ahmed, M.A. A New Luminescent Bio-Probe of Europium(III)-Complex for Sensing Some Biomolecules and CT-DNA. J. Photochem. Photobiol. A Chem. 2019, 374, 1–9. [Google Scholar] [CrossRef]
- Meng, Q.; Liu, H.; Sen, C.; Cao, C.; Ren, J. A Novel Molecular Probe Sensing Polynuclear Hydrolyzed Aluminum by Chelation-Enhanced Fluorescence. Talanta 2012, 99, 464–470. [Google Scholar] [CrossRef] [PubMed]
- Lineweaver, H.; Burk, D. The Determination of Enzyme Dissociation Constants. J. Am. Chem. Soc. 1934, 56, 658–666. [Google Scholar] [CrossRef]
- Lima, E.C.; Gomes, A.A.; Tran, H.N. Comparison of the Nonlinear and Linear Forms of the van’t Hoff Equation for Calculation of Adsorption Thermodynamic Parameters (∆S° and ∆H°). J. Mol. Liq. 2020, 311, 113315. [Google Scholar] [CrossRef]
- Ross, P.D.; Subramanian, S. Thermodynamics of Protein Association Reactions: Forces Contributing to Stability. Biochemistry 1981, 20, 3096–3102. [Google Scholar] [CrossRef] [PubMed]
- Alhamami, M.A.M.; Algethami, J.S.; Rizk, M.A.; Abbas, A.M.; Khairy, G.M. A New Chemosensor Based on a Luminescent Complex for the Investigation of Some Organophosphorus Pesticides in Environmental Samples. Chemosensors 2022, 10, 391. [Google Scholar] [CrossRef]
- Rodríguez, L.C.; Campa[nbreve]Ta, A.M.G.; Linares, C.J.; Ceba, M.R. Estimation of Performance Characteristics of an Analytical Method Using the Data Set Of The Calibration Experiment. Anal. Lett. 1993, 26, 1243–1258. [Google Scholar] [CrossRef]


| Probe | Limit of Detection | Interferent Pesticides | Medium of Detection | Reference |
|---|---|---|---|---|
| Tb(III)- N′,N‴-((1E,2E)-1,2-diphenylethane-1,2-diylidene)bis(3-allyl-2-hydroxybenzohydrazide | 0.118 µM | ------- | Methanol | This work |
| Tb(III)-ethyl-4-hydroxy-1-(4-methoxyphenyl)-2-oxo-1,2-dihydroquinoline-3-carboxylate | 0.94 µM in ethanol 2.68 µM in water | Crotoxyphos | Ethanol or water | [41] |
| Tb(III)-N(acetoacetyl)-3-allyl-2-hydroxy benzaldehyde hydrazone | 9.59 µM | Chlorfenvinphos | Ethanol | [42] |
| Eu(III)–1,10 phenanthroline- 4,4,4-trifluoro-1-(2-naphthyl)-1,3-butanedione | 0.64 µM | Chlorpyrifos endosulfan, heptachlor | HEPS buffer (pH = 7.5) | [43] |
| Eu(III)–2,6-pyridinedicarboxylic acid | 2.50 µM | Azinphos chlorfenvinphos | HEPS buffer (pH = 7.5) | [44] |
| Temp. (K) | Correlation Coefficient (r) | Ksv (Slope) (M−1) |
|---|---|---|
| 298 | 0.999 | 4.20 × 10⁴ |
| 303 | 0.998 | 4.04 × 10⁴ |
| 308 | 0.995 | 3.72 × 10⁴ |
| 313 | 0.988 | 3.09 × 10⁴ |
| 318 | 0.948 | 2.54 × 10⁴ |
| Temp. K | Binding Constant K (M−1) | R2 | ∆H0 (KJ mol−1) | ∆S0 (J mol−1. K−1) | ∆G0 (KJ mol−1) |
|---|---|---|---|---|---|
| 303 | 4.80 × 10⁴ | 0.979 | −13.94 | 43.23 | −26.03 |
| 308 | 4.20 × 10⁴ | 0.981 | −25.77 | ||
| 313 | 3.80 × 10⁴ | 0.999 | −24.04 | ||
| 318 | 3.40 × 10⁴ | 0.998 | −24.32 |
| Interferents | The Tolerant Concentration (µM) |
|---|---|
| Cu2+ | 25 Q |
| Pb2+ | 50 Q |
| Ni2+ | 30 Q |
| Co2+ | 80 Q |
| Cd2+ | 40 Q |
| NO3− | 50 Q |
| CO32− | 10 Q |
| PO43− | 10 E |
| Heptachlor | 80 Q |
| Chlorpyrifos | 100 E |
| Dichlorvos | 100 Q |
| Paraoxon-ethyl | 60 Q |
| Water Sample | Added (µM) | Found (µM) | Recovery (%) | RDS (%) |
|---|---|---|---|---|
| Tap water | 10.00 | 9.53 | 95.30% | 2.52 |
| 10.00 | 9.62 | 96.20% | ||
| 10.00 | 9.55 | 95.50% | ||
| 20.00 | 20.41 | 102.05% | ||
| 20.00 | 20.70 | 103.50% | ||
| 20.00 | 21.79 | 108.95% | ||
| River water | 10.00 | 9.85 | 98.50% | 4.36 |
| 10.00 | 9.70 | 97.00% | ||
| 10.00 | 10.16 | 101.60% | ||
| 20.00 | 19.59 | 97.95% | ||
| 20.00 | 19.78 | 98.90% | ||
| 20.00 | 21.77 | 108.85% | ||
| Wastewater | 10.00 | 10.30 | 103.00% | 3.57 |
| 10.00 | 9.80 | 98.00% | ||
| 10.00 | 9.32 | 93.20% | ||
| 20.00 | 21.20 | 106.00% | ||
| 20.00 | 19.20 | 96.00% | ||
| 20.00 | 19.19 | 95.95% |
Disclaimer/Publisher’s Note: The statements, opinions and data contained in all publications are solely those of the individual author(s) and contributor(s) and not of MDPI and/or the editor(s). MDPI and/or the editor(s) disclaim responsibility for any injury to people or property resulting from any ideas, methods, instructions or products referred to in the content. |
© 2023 by the authors. Licensee MDPI, Basel, Switzerland. This article is an open access article distributed under the terms and conditions of the Creative Commons Attribution (CC BY) license (https://creativecommons.org/licenses/by/4.0/).
Share and Cite
Rizk, M.A.; Alsaiari, M.A.; Alsaiari, R.A.; Ibrahim, I.A.; Abbas, A.M.; Khairy, G.M. New Terbium Complex as a Luminescent Sensor for the Highly Selective Detection of Malathion in Water Samples. Chemosensors 2023, 11, 570. https://doi.org/10.3390/chemosensors11120570
Rizk MA, Alsaiari MA, Alsaiari RA, Ibrahim IA, Abbas AM, Khairy GM. New Terbium Complex as a Luminescent Sensor for the Highly Selective Detection of Malathion in Water Samples. Chemosensors. 2023; 11(12):570. https://doi.org/10.3390/chemosensors11120570
Chicago/Turabian StyleRizk, Moustafa A., Mabkhoot A. Alsaiari, Raiedhah A. Alsaiari, Ibrahim A. Ibrahim, Abbas M. Abbas, and Gasser M. Khairy. 2023. "New Terbium Complex as a Luminescent Sensor for the Highly Selective Detection of Malathion in Water Samples" Chemosensors 11, no. 12: 570. https://doi.org/10.3390/chemosensors11120570
APA StyleRizk, M. A., Alsaiari, M. A., Alsaiari, R. A., Ibrahim, I. A., Abbas, A. M., & Khairy, G. M. (2023). New Terbium Complex as a Luminescent Sensor for the Highly Selective Detection of Malathion in Water Samples. Chemosensors, 11(12), 570. https://doi.org/10.3390/chemosensors11120570