Article

WO3-Nanocrystal-Modified Electrodes for Ultra-Sensitive and Selective Detection of Cadmium (Cd2+) Ions

1
School of Integrated Circuits, School of Optical and Electronic Information, Wuhan National Laboratory for Optoelectronics, Optics Valley Laboratory, Huazhong University of Science and Technology, Wuhan 430074, China
2
Zhengzhou Winsen Electronics Technology Co., Ltd., 299 Jinsuo Road, Hi-tech Zone, Zhengzhou 450001, China
3
School of Energy Science and Engineering, Nanjing Tech University, Nanjing 210000, China
*
Author to whom correspondence should be addressed.
Chemosensors 2023, 11(1), 54; https://doi.org/10.3390/chemosensors11010054
Submission received: 2 December 2022 / Revised: 28 December 2022 / Accepted: 5 January 2023 / Published: 7 January 2023
(This article belongs to the Collection Advances of Chemical and Biosensors in China)

Abstract

:
The detection of heavy metal ions is becoming increasingly important for environmental monitoring and personal safety protection. Owing to their large surface area and suitable conductivity, metal oxide semiconductor nanocrystals have been utilized in chemically modified electrodes for the rapid and low-cost detection of heavy metal ions. However, their sensitivity and selectivity for cadmium ion (Cd2+) detection still remains a challenge. Here, a method of ultra-sensitive and selective Cd2+ detection based on WO3-nanocrystal-modified electrodes is proposed and demonstrated. Colloidal WO3 nanocrystals were synthesized via a solvothermal route and then deposited onto a carbon electrode using a spin-coating method, forming the modification layer at room temperature. The WO3-nanocrystal-modified electrodes exhibit a remarkable signal transduction capability that converts Cd2+ adsorption into current output signals. The peak current was linear to the logarithm of the Cd2+ concentration from 1 nM to 10,000 nM when measured using the anodic stripping voltammetry method. The selectivity mechanism was studied and attributed to the high adsorption energy of cadmium on WO3 compared to other heavy metal ions. Employment of WO3 for a high-performance Cd2+-selective electrode opens many opportunities in portable ion-detection applications.

1. Introduction

Cadmium is one of the heavy metal ions that can cause irreversible damage to the kidneys, osteoporosis, and deformations if its concentration in the human body exceeds the normal standards [1,2]. Monitoring cadmium in the environment is crucial because cadmium present in nature enters the human body through the food chain [3]. The World Health Organization (WHO) suggests that the concentration of cadmium in drinking water should not exceed 27 nM.
Chemically modified electrodes (CMEs) for detecting heavy metal ions have many advantages such as fast speed, low cost and a simple operation process [4,5]. Strong adsorption capacity with the target ions and good charge transport capability are key parameters of CMEs to achieve high sensitivity and good selectivity. Various functional materials such as carbon [6,7], organic polymers [7] and biological materials [8] have been explored to modify the electrode surface and notable progress has been made for the detection of heavy metals in water.
Most of these materials have a large surface area and excellent catalytic activity, improving the detection sensitivity and range [9]. Porous activated-carbon-carrying palladium nanoparticles were modified onto glass carbon electrodes and measured with the square wave anodic stripping voltammetry method [10]. This electrode showed good detection sensitivity for Cd2+, Pb2+ and Cu2+, and the limits of detection were 13.33 nM, 6.6 nM and 11.92 nM, respectively. The high sensitivity has been attributed to the large specific surface area of porous activated carbon and the excellent electrocatalytic performance of palladium nanoparticles. Graphene oxide/κ-carrageenan/L-cysteine nanocomposite [11] was modified onto glass carbon electrodes to detect Cd2+ and Pb2+ with limit of detections of 0.58 nM and 1.08 nM, respectively. Nitrogen-doped graphene quantum dots [12] have been demonstrated as electrode modification materials for detecting trace Pb2+, Cd2+ and Hg2+. The defects introduced by nitrogen doping increased the adsorption energy of graphene quantum dots toward heavy metal ions.
Selectivity is another key parameter of CMEs for ion detection. Owing to their large surface area with suitable conductivity and chemical stability, metal oxide semiconductor nanocrystals have emerged as an alternative to electrode modification. Superior selectivity toward Hg2+ has been observed on both SnO2 and ZnO semiconductor nanocrystal-modified electrodes. The high sensitivity and selectivity were attributed to the strong adsorption energy of Hg2+ on SnO2 [13]. The thin ZnO layer coated on the electrode surface helps the migration of electrons between the redox-active analyte and electrode, leading to the enhanced electrochemical response toward Hg2+ [14]. However, the selective detection of Cd2+ remains a challenge for CMEs.
In this work, we propose and demonstrate that WO3-nanocrystal-modified electrodes are capable of ultra-sensitive and selective Cd2+ detection. Colloidal WO3 semiconductor nanocrystals synthesized via a solvothermal route have excellent solution processability and can be easily deposited onto various substrates. The adsorption energy of different heavy metals on WO3 was calculated and compared for the selectivity design. When measured using anodic stripping voltammetry (ASV), the WO3 nanocrystal-modified electrodes exhibit remarkable signal transduction capability to convert the Cd2+ adsorption into current output signals.

2. Experiment

2.1. Synthesis of WO3 Nanocrystals

WO3 nanocrystals were synthesized via a one-step low-temperature solvothermal method. All the reagents were commercial products and used as-is. Deionized water (18.25 MΩ·cm) was used to prepare all the aqueous solutions. The specific synthesis steps were as follows: 20 mL of oleic acid (OA, tech. Grade, 90%, Aladdin, Shanghai, China), 2.5 mL of oleamine (OLA, tech. Grade, 80–90%, Alfa Aesar, Haverhill, MA, USA) and 0.68 g of WCl6 (Sigma, St. Louis, MO, USA) were added to a beaker and stirred while sonicating until WCl6 was completely dissolved. Then, the beaker was placed in the reactor autoclave and stored in the oven at 180 °C for 3 h. After that, the reactor autoclave was submerged in cold water to cool down quickly. The product was cleaned by centrifugation and then dissolved in 12 mL of toluene to obtain WO3 nanocrystals at a concentration of 33 mg/mL.

2.2. Preparation of WO3-Modified Electrodes

The three-electrode was purchased from Zhejiang Nazhi Biotechnology Co., LTD (Zhejiang, China), in which polyethylene (PE) was used as the substrate of the modified electrode. Moreover, the working electrode (WE) and the counter electrode (CE) were made of carbon, and the reference electrode (RE) was Ag/AgCl. In total, 15 μL of WO3 colloidal nanocrystals were modified on the WE at 800 rpm by spin-coating, and the WO3-modified electrode was obtained after natural drying. Figure 1 illustrates the schematic diagram of the electrode modification and detection process. The uniformly dispersed WO3 nanocrystal solution was spin-coated on the WE of the carbon conducting layer, dried naturally, and kept in the Cd2+ standard solution for testing. The Cd2+ deposition and dissolution reactions occur under a certain voltage.

2.3. Characterization

The micromorphology and structure of WO3 were characterized with a transmission electron microscope (TEM) (JEOL2100 from FEI, Shimadzu, Kyoto, Japan) and X-ray diffraction (XRD) (Maxima_XXRD-7000, Shimadzu). The modified layer structure and elemental distribution of WO3 on the carbon electrode were analyzed with a scanning electron microscope (SEM) and energy dispersive spectrometer (EDS), using a field emission scanning electron microscopy (FE-SEM) device from GeminiSEM, Oberkochen, Germany. The electrochemical performance of the modified electrode was tested using the CHI660E electrochemical workstation (Shanghai Chenhua Company, Shanghai, China).
The Cd2+ concentration was tested using the ASV method, where the solutions to be tested were different concentrations of Cd2+ standard solution prepared from PBS solution with pH 5.5, with a deposition voltage of −0.7 V and a deposition time of 120 s. The starting value of the dissolution voltage was −0.7 V, and the termination voltage was 1 V. The ASV curve in PBS of pH 5.5 was used as the baseline current.

3. Results and Discussion

3.1. Structure and Morphology of the WO3 Nanocrystals and Modified Layers

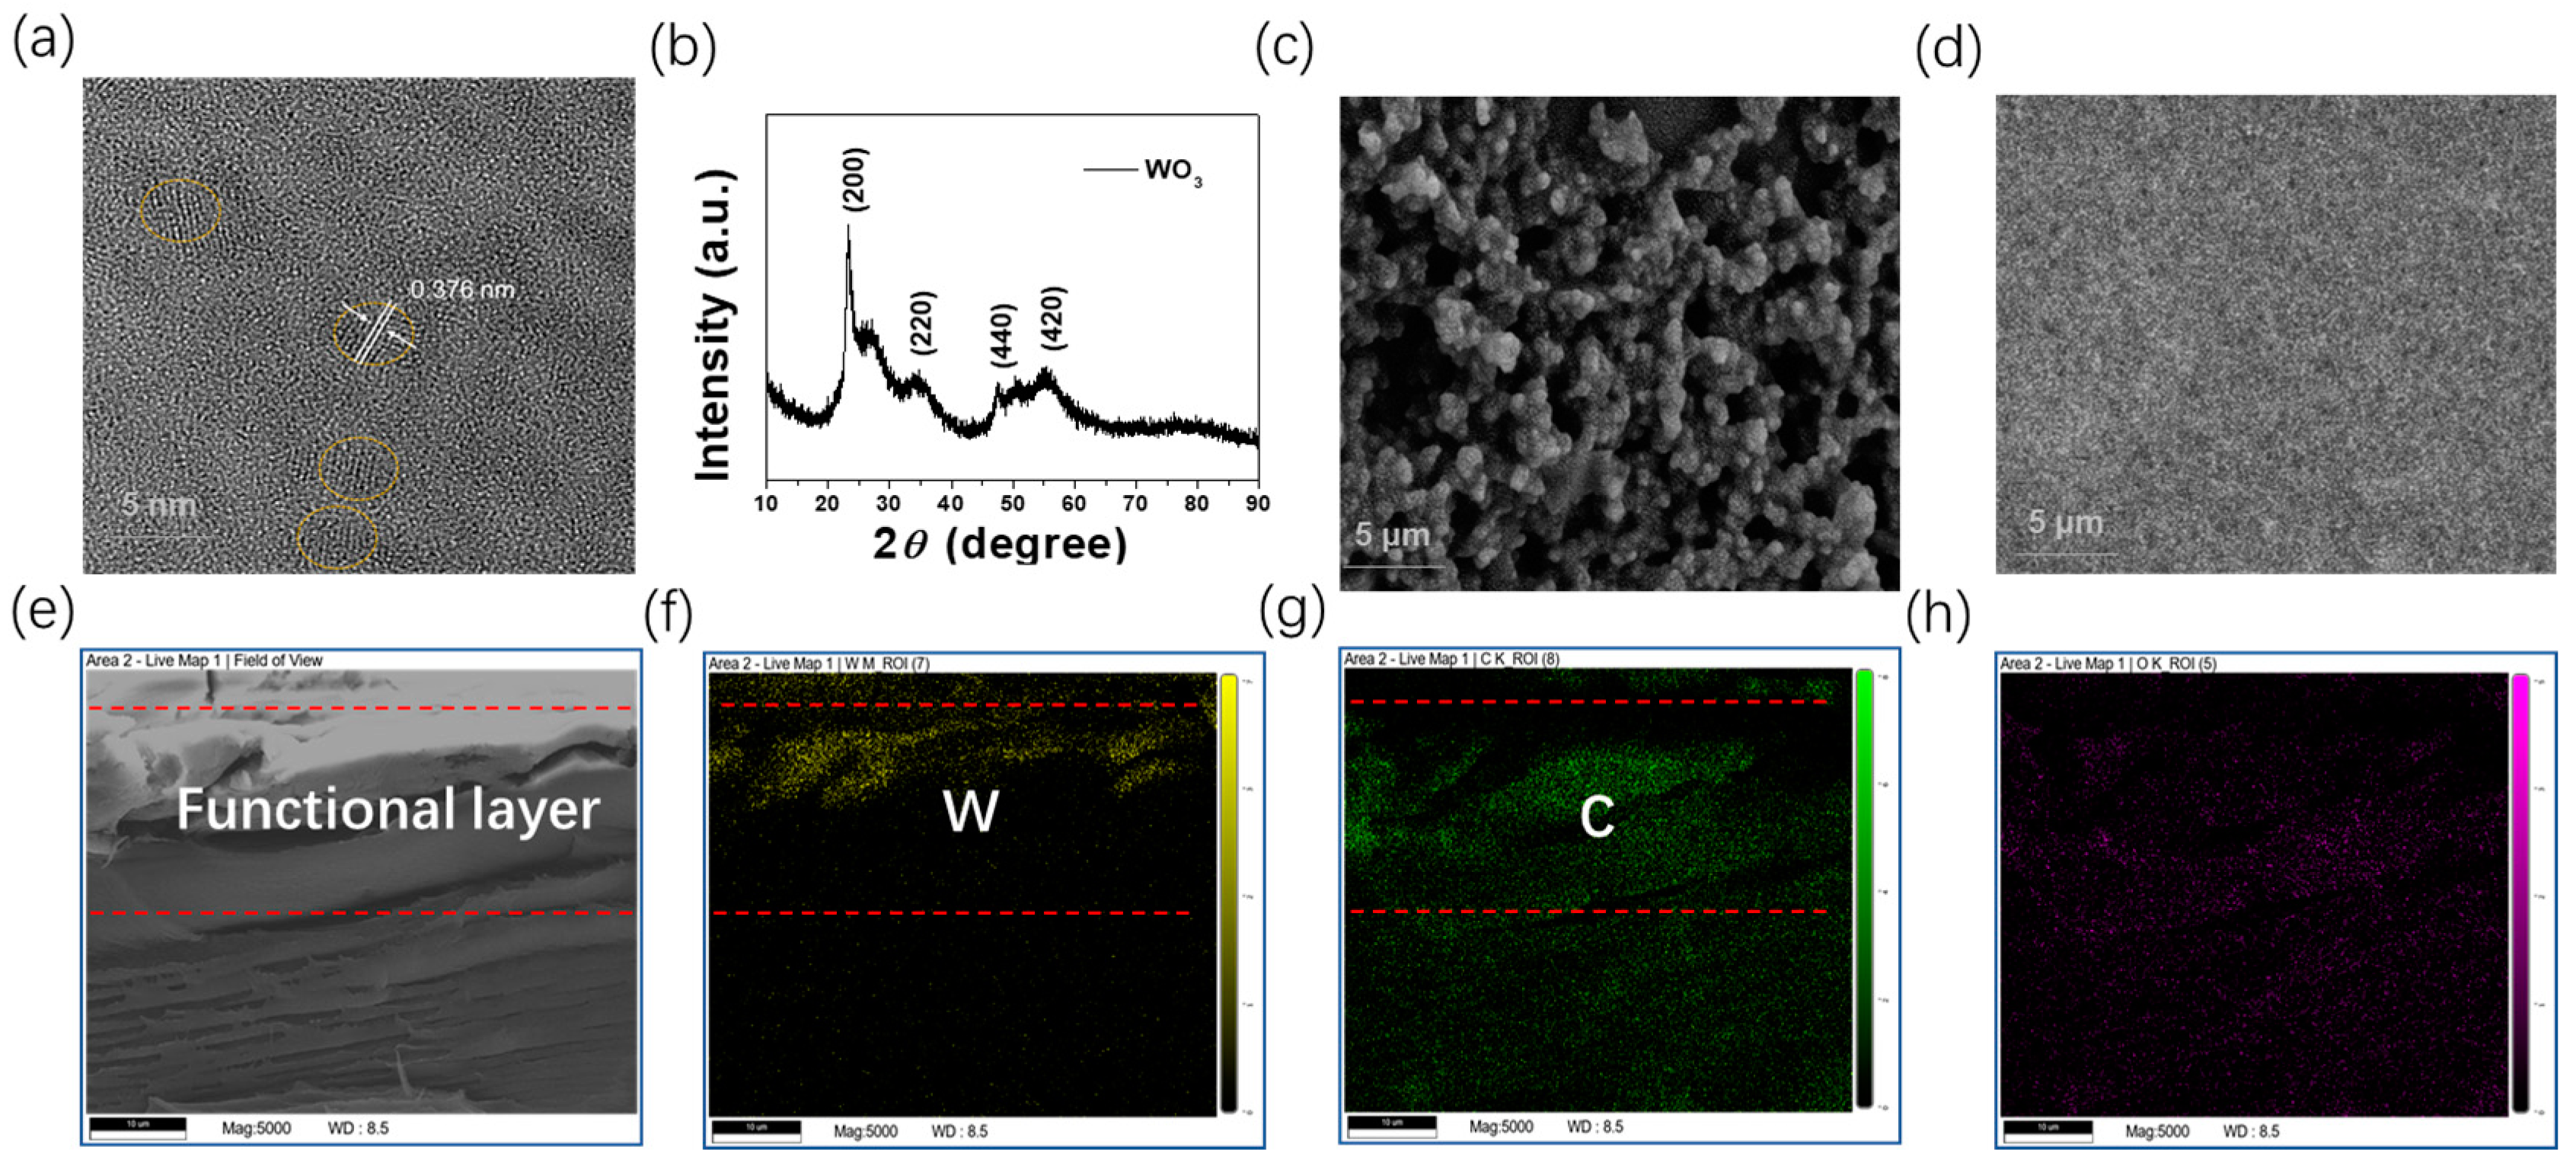
WO3 nanocrystals were synthesized using a solvothermal method. Figure 2 shows the morphology of WO3 nanocrystals and the modified electrode. The TEM diagram of WO3 (Figure 2a) shows that the particle size of WO3 was less than 5 nm, and the lattice was 0.370 nm, corresponding to the (200) crystal face. The structure of WO3 nanocrystals was analyzed using XRD (Figure 2b) and diffraction peaks were found at 24°, 33°, 48° and 55°, corresponding to the crystal faces of (200), (220), (400) and (420), respectively. Moreover, no other evident peaks were visible, indicating the high purity of the nanocrystal. Figure 2c,d show SEM images of the carbon electrodes before and after modification with WO3, respectively. As shown in Figure 2c, the surface of the carbon electrode was loose and porous before modification with WO3, the micropores were distributed in various sizes, and the carbon particles were relatively large.

3.2. Performance Optimization of the WO3-Modified Electrodes

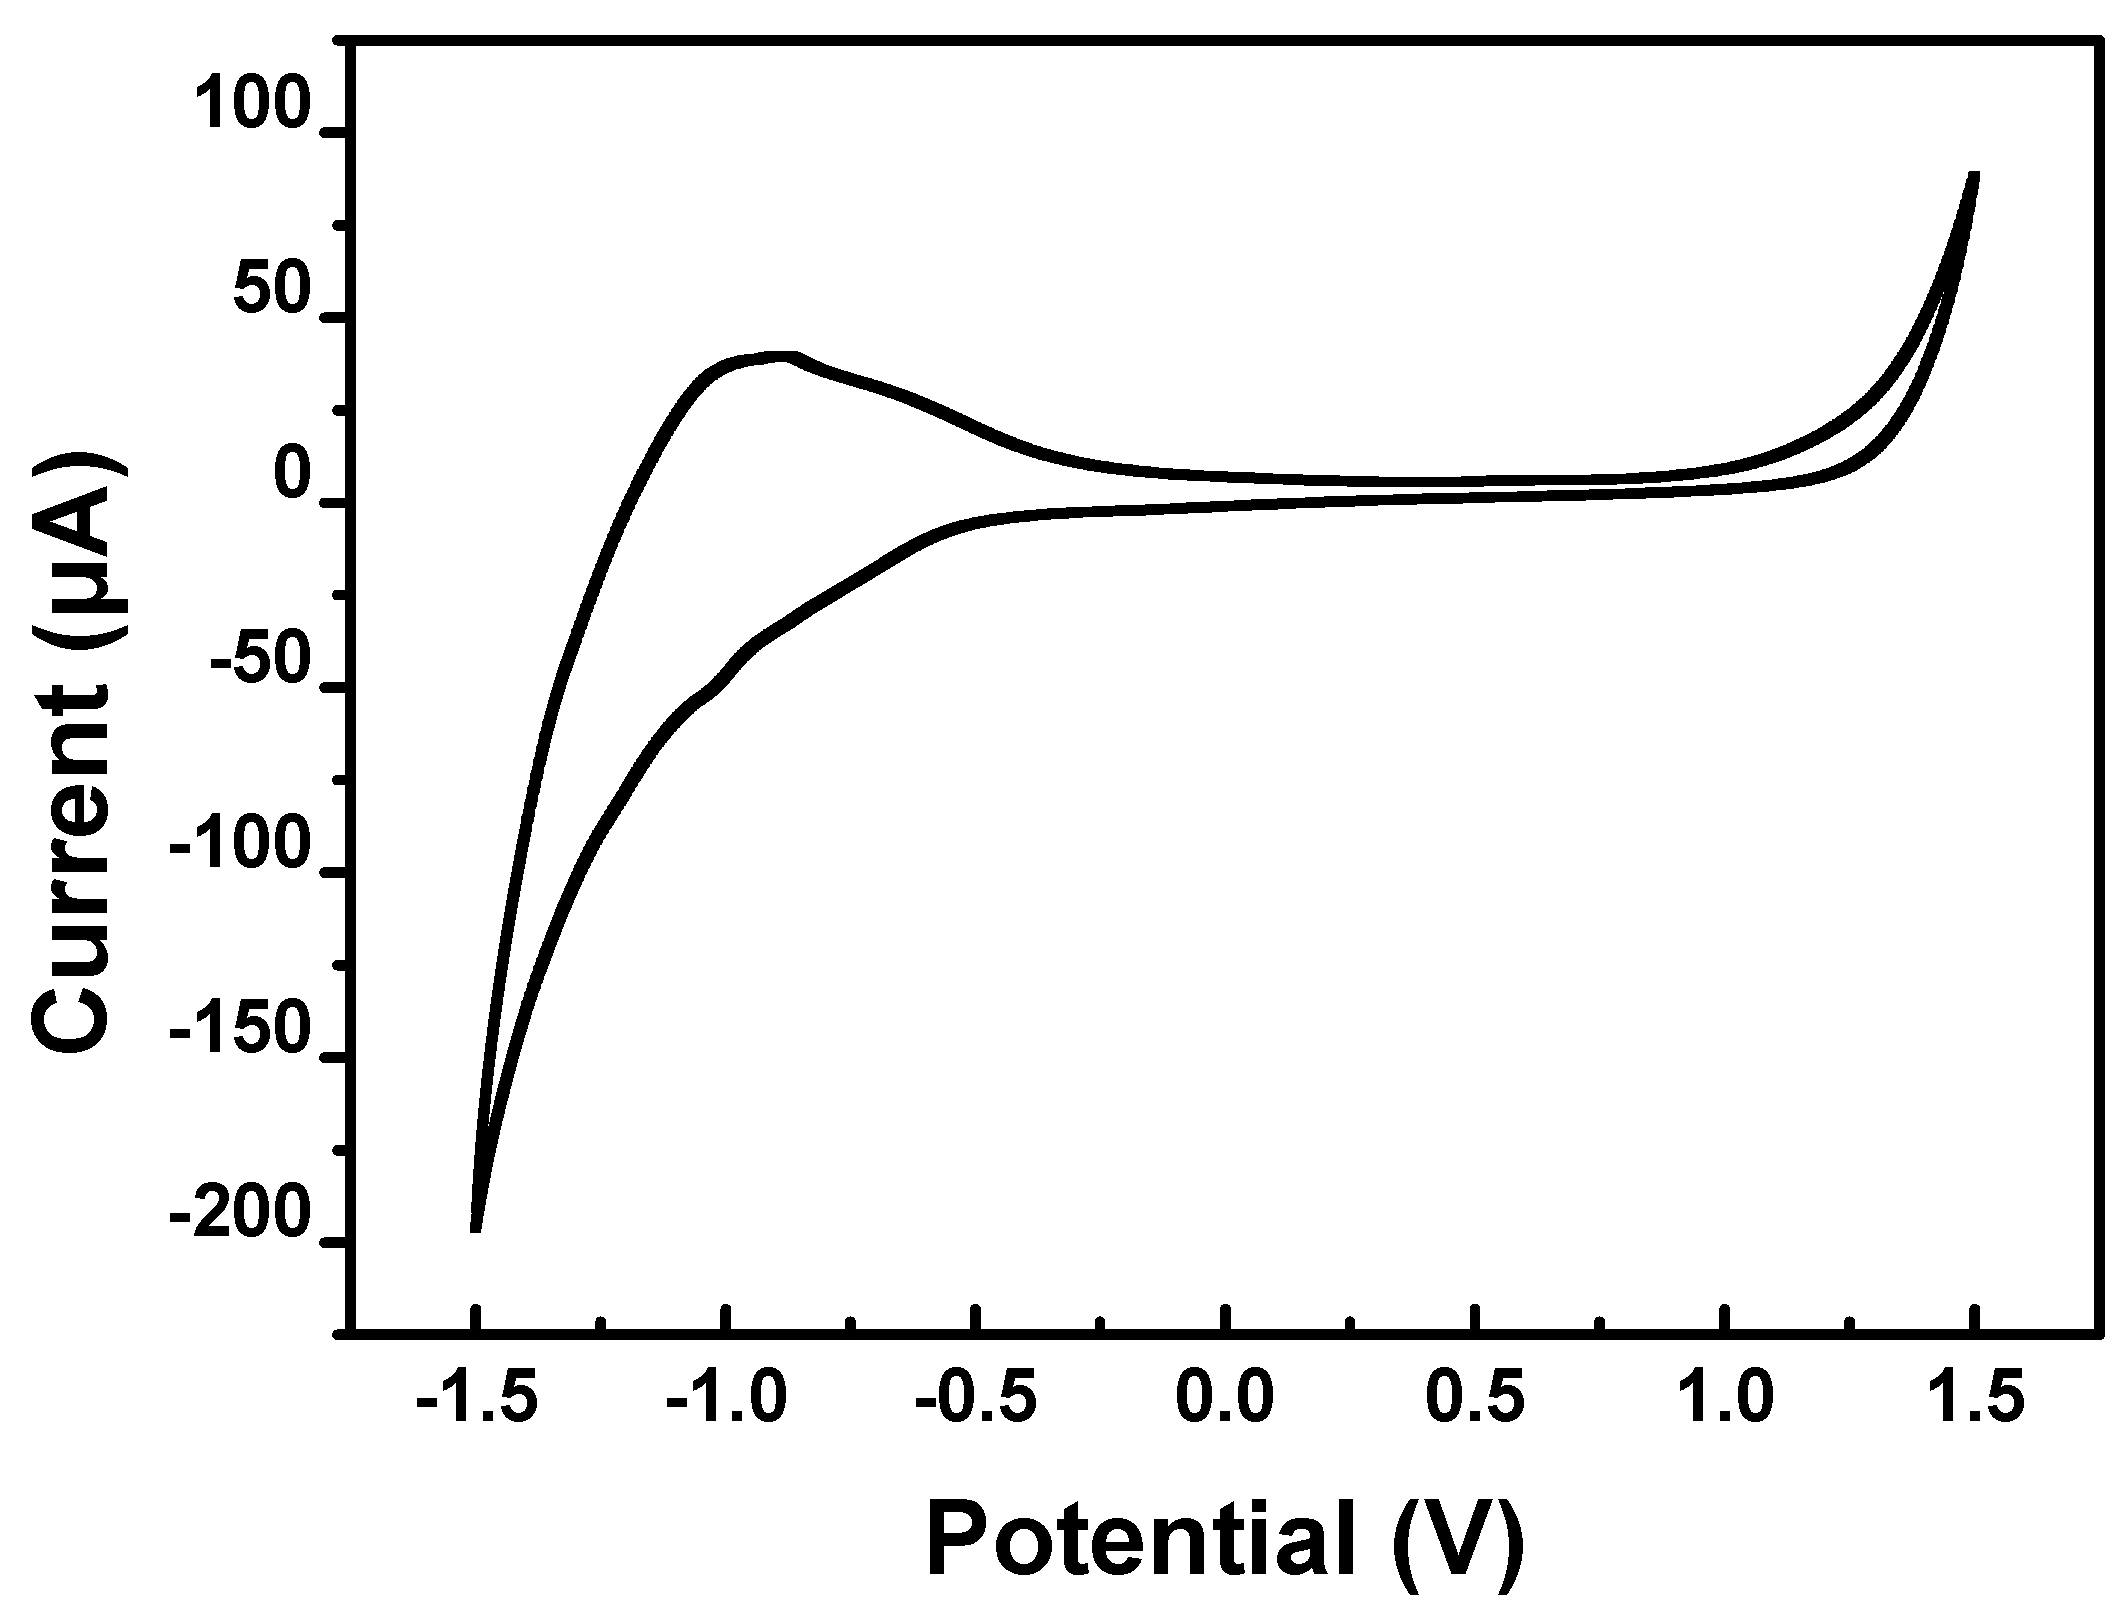
The CV curve of the WO3-modified carbon electrode was first tested in PBS solution with a Cd2+ concentration of 10 μM and pH = 5.5 under the following test conditions: the starting and ending voltage was 0 V, the highest voltage was 1.5 V, the lowest voltage was −1.5 V, and the scanning speed was 0.05 V/s. The test result is shown in Figure 3. From the results it can be seen that the reduction peak appeared at −0.7 V, so −0.7 V was used as the deposited potential.
The number of WO3-modified layers and the pH value of the Cd2+ standard solution were optimized for optimum detection. The electrochemical reaction of the WO3-nanocrystal-modified carbon electrode for heavy metal ions detection is controlled by three fundamental processes: ion diffusion in solution, electrochemical reaction and electron transmission on the electrode surface. All three processes are related to the modified material, and are reflected in the electrochemical properties of the electrode. The equivalent circuit is shown in Figure 4a. The arc radius in the high-frequency region of the electrochemical impedance spectrum (EIS) represents the electron transmission ability (Rct) on the electrode surface. The ability to transmit electrons on the electrode surface decreases with increasing arc radius. The line in the low-frequency region represents the ion diffusion ability, namely, the capacitance characteristic (Cd). Theoretically, increasing the electron transmission and ion diffusion ability can improve the electrode’s sensitivity. The electron transmission ability is directly related to the conductivity of the modified electrode. In addition to the distribution of the double-electric layer on the electrode surface, the ion diffusion ability depends on the ion diffusion characteristics of the test solution. Therefore, the modification parameters of the electrode can be optimized by the size of Rct in the equivalent circuit.
The distribution of WO3 on the electrode surface will directly affect the electron transmission ability of the electrode and the double-electric layer on the electrode surface. The EIS curve of the electrode modified with different layers of WO3 nanocrystals were tested in 0.05 M K3[Fe(CN)6]/K4[Fe(CN)6] and 0.1 M KCl mixed solution (KKS), and in KKS and 10 μM of cadmium ions (Cd2+) mixed solution (KKS/Cd2+) (Figure 4b,c, respectively). The results show that Rct first decreases and then increases with the increased number of modified layers in the KKS solution and KKS/Cd2+ mixed solution after modification with WO3 nanocrystals. This may be attributed to the conversion of electronic transmission from carbon to WO3 and carbon joint transmission. In addition, the electrical conductivity of WO3 is weaker than that of carbon, which decreases the electron transmission ability and increases Rct. As the amount of WO3 increases and covers the electrode surface, the electron transmission on the electrode surface changes from WO3 and carbon joint transmission to WO3 transmission. Owing to the large number of unsaturated suspension bonds, WO3 nanocrystals can adsorb metal ions in the solution and conduct electrochemical reaction on their surface. When the charge caused by the electrochemical reaction accumulates a higher potential, it causes a sudden current release, which enhances the conductivity of the electrode. Consequently, the Rct in the equivalent circuit is reduced. As the number of WO3-modified layers and their thickness increase, the effective adsorption of Fe2+/Fe3+ only occurs on the limited atomic layers in the surface, while the deeper WO3 cannot positively affect electron adsorption and electrochemical reaction. As a relatively poor-conductivity semiconductor material, WO3 nanocrystals become resistant to electronic transmission, thereby increasing the Rct in the equivalent circuit. The addition of Cd2+ did not affect the ion adsorption and the electrochemical reaction, so the change in Rct in the mixture solution of KKS/Cd2+ is consistent with the conditions in the KKS solution. With the increased number of modified layers, the Rct first increases and then decreases. The results show that Rct is minimal when the number of modified layers is three. Meanwhile, the equivalent circuit and the EIS results of three-layer WO3 nanocrystals in KKS/Cd2+ mixture solutions showed that RΩ, Rct and Cd can also be calculated as RΩ = 253 Ω, Rct = 8176 Ω and Cd = 3.788 × 10⁷ μF/cm2, respectively.
The optimal pH value was selected with the optimal number of three modified layers. The bar graph of the ASV peak current of WO3-modified electrodes in 10 μM of Cd2+ solution at different pH values is shown in Figure 4d. As the pH value increases from 4.5 to 7.0, the peak current increases and then decreases. When the pH value of the solution is 5.5, the modified electrode has the highest sensitivity to Cd2+. This is because the products generated by the oxidation of the Cd at the working electrode are mainly Cd2+ in the weakly acidic environment with a pH value of 5.5, and the dissolved oxygen on the CE is reduced and bound to H+ in the solution into water. The corresponding reactions on the WE and the CE are as follows:
WE :   2 Cd 2 Cd 2 +   +   4 e
CE :   O 2 + 4 H + + 4 e -     2 H 2 O
According to the Nernst equation:
φ = φ θ + 0 . 0591 n lg [ C ( O x ) / C θ ] b [ C ( R ed ) / C θ ] a
where the electrode potential for the CE is:
φ O 2 H 2 O = φ θ + 0 . 0591 4 lgC ( O 2 ) / [ C ( H + ) ] 4
The above equation shows that the reactants in the electrochemical reaction on the CE contain H+, and the H+ concentration in the solution affects the electrode potential ( φ ) of the CE. The electrode potential affects the reaction process and the output current, so the solution’s pH has an optimal value for Cd2+ detection and pH 5.5 was selected.

3.3. Electrochemical Performance of WO3-Nanocrystal-Modified Electrodes

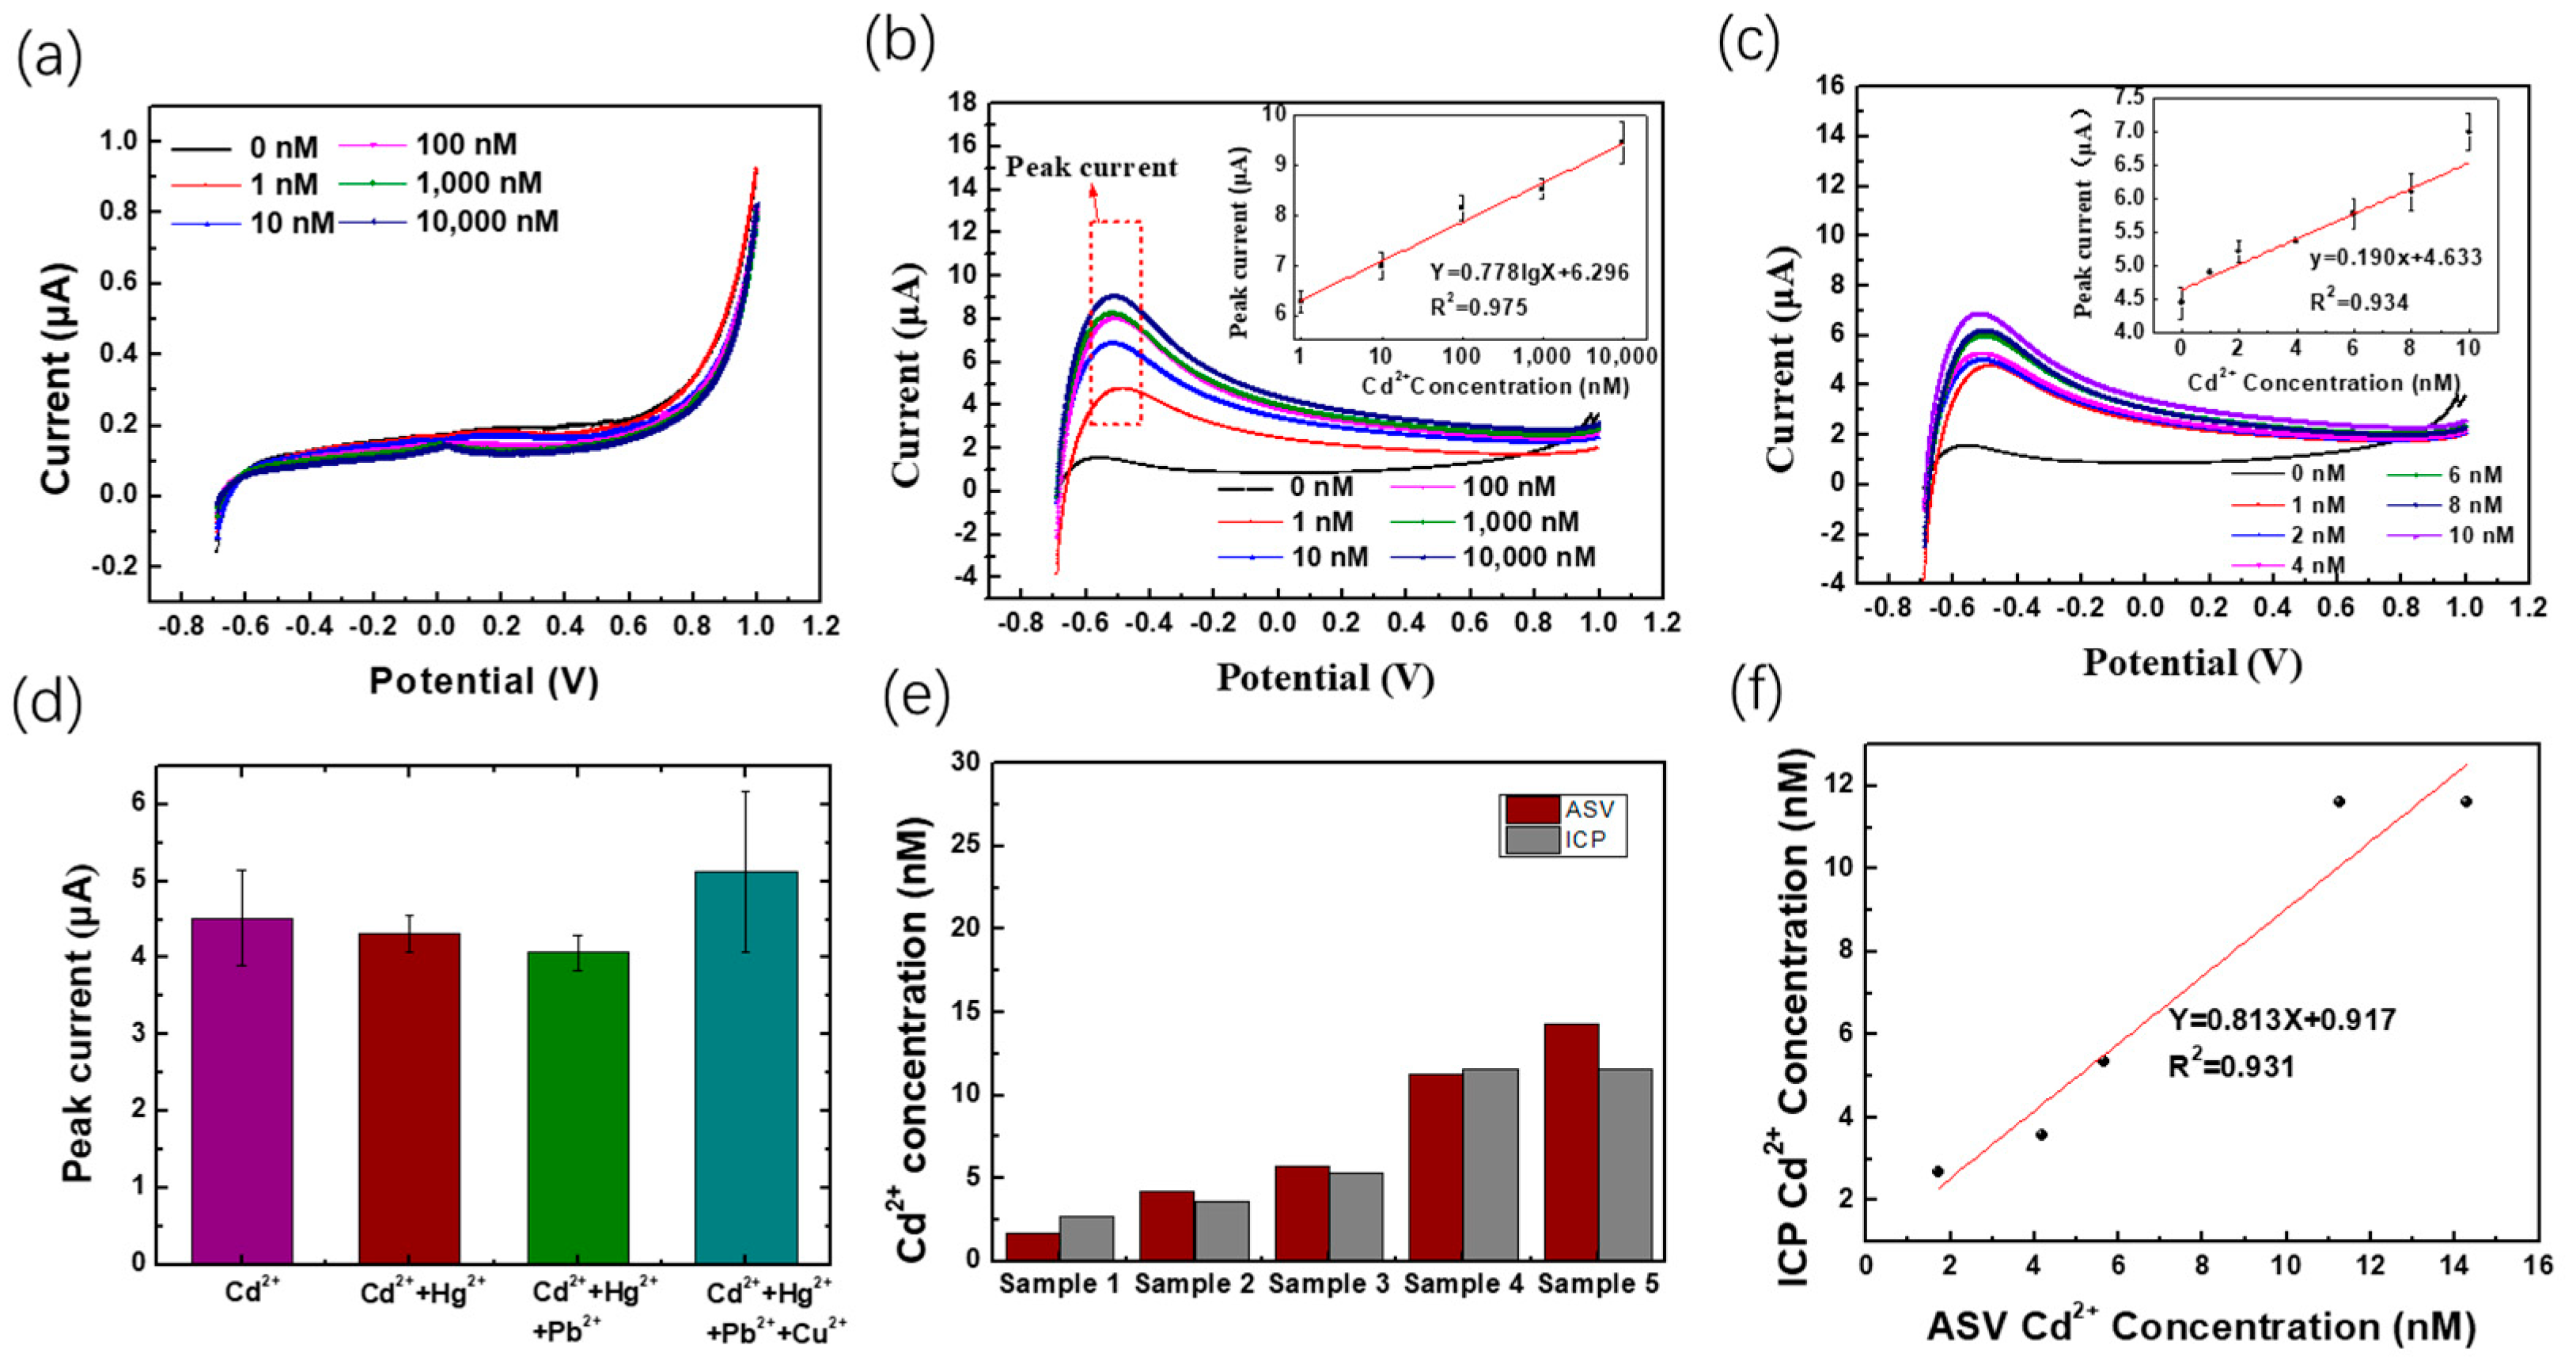
The ASV method was used to detect Cd2+ under the optimal WO3 modification layer number and pH value of the measured solution. Figure 5a,b compare the ASV curves in different Cd2+ concentration solutions before and after modification. The carbon electrode without WO3 has no significant dissolution peaks, and the carbon electrode modified with WO3 has a considerable dissolution peak current in the Cd2+ solution. The peak current increases with increasing the Cd2+ concentration. The potential of the dissolution peak is approximately −0.5 V. This may occur when a specific voltage is applied to WO3, where Cd2+ is first reduced to zero valence Cd at the potential of −0.7 V and then to Cd2+ at the reverse linear scanning voltage while releasing charges and forming the dissolution peak current. The greater the Cd2+ concentration, the greater the current generated by oxidation. Figure 5c further analyzes the ASV curve of the Cd2+ concentration from 0 nM to 10 nM, showing that by further refining the concentration range of Cd2+, WO3-modified electrodes can still clearly distinguish the Cd2+ concentration and achieve a fine detection. It can also be found that the stripping peak potential position differs with the Cd2+ concentration. According to the Nernst Equation (3):
φ Cd 2 + Cd = φ θ ( Cd 2 + Cd ) + 0 . 0591 2 lg [ C ( Cd ) C Cd 2 + )
With the increasing concentration of Cd2+, the electrode potential of Cd2+/Cd moves in a negative direction, in agreement with the results shown in Figure 5c. As the Cd2+ concentration further increases, Cd2+ may accumulate on the electrode surface. The electrode potential approaches the electrode potential of Cd2+/Cd again. The inset in Figure 5b,c extracts the peak current of the ASV curve in the range of 0–10,000 nM and 0–10 nM. It was discovered that the Cd2+ concentration C is linear to the logarithm of the peak current I in the range of 1–10,000 nM and satisfies the linear equation I = 0.778lgC + 6.296, with linear correlation coefficient R2 = 0.975. In the range of Cd2+ concentrations from 0 to 10 nM, the Cd2+ concentration C is linear with the peak current I and satisfies the linear equation I = 0.190C + 4.633 with linear correlation coefficient R2 = 0.934. From the results of the linear fitting, it can be seen that the detection sensitivity of the modified electrode is 0.190 μA/nM. To study the reproducible detection ability of the modified electrode to Cd2+, the above test process was repeated five times. The error bars were added in the inset of Figure 5b,c. The relative error was less than 0.43, suggestive of good repeatability. The limited of detection (LOD) of the modified electrode for Cd2+ was calculated as 0.029 nM using the 3SDblank/slope [15]. Table 1 compares the detection effects of Cd2+ reported in the literature. The results reveal that the WO3-nanocrystal-modified electrode for Cd2+ detection in this article has a wider detection range and lower LOD.
The selectivity of modified electrodes is important for detecting heavy metal ions. Figure 5d shows the peak current extracted from the ASV curve in the presence of different heavy metal ions. The Cd2+ concentration was 1 μM; 25 times that concentration of Hg2+, Pb2+ and Cu2+ were successively added to the Cd2+ solution and their ASV curves at the deposition voltage of −0.7 V were tested. The dissolution peak current of the ASV curve showed that adding Hg2+ and Pb2+ did not significantly change the dissolution peak current, indicating that the WO3-modified carbon electrode had a good anti-interference ability with Hg2+ and Pb2+. After the addition of Cu2+, the dissolution peak current increased slightly, probably because the ionic radius of Cu2+ (0.73 Å) is smaller than that of Cd2+ (0.95 Å). It is easy to deposit on the WO3 surface and combine with the suspension bond. Then, Cu2+ is reduced at the reduction potential of −0.7 V to form a Cd–Cu–W alloy, causing a dissolution peak current due to oxidation. Thus, Cu2+ has some cross-interference with the detection of Cd2+ [16], but the dissolution peak potential of Cu2+ is significantly different from that of Cd2+. Therefore, the interference of Cu2+ can be addressed by the position of the dissolution peak current.
Figure 5e compares the Cd2+ concentrations of several real water samples detected with the WO3-modified electrode and the Inductive Coupled Plasma (ICP) method [17]. The results show that the Cd2+ concentration tested with the two methods were basically consistent and lower than the WHO standard requirements in drinking water, indicating that the WO3-modified electrode has some practical value in detecting Cd2+ in real water. Figure 5f normalizes the test results using ASV and ICP methods, with a slope of 0.813. The closer the slope of the curve is to 1, the more consistent the results are. The test results showed that the modified electrode method was basically consistent with that of ICP.

3.4. Analysis of the Sensitive Mechanism of WO3-Modified Electrodes

To investigate the mechanism of Cd2+ detection using WO3-modified carbon electrodes, different stages of adsorption and electrochemical reaction were studied. Firstly, the effective active area of the electrode was analyzed via the CV curves in the KKS solution before and after WO3 modification at different scan speeds, as shown in Figure 6a,b. The oxidation peak currents at different scan speeds were extracted and plotted against the scan speed v1/2 to obtain Figure 6c. The effective area of the electrode before and after WO3 modification was calculated according to the Randles–Sevcik formula [23]:
i p = 2.69 × 10 5 A n 3 2 D 0 1 2 C 0 * v 1 2
where i p is the peak current of the CV curve; A is the electroactive area; n is the electron number of reaction-transfer (n = 1); D 0 is the diffusion coefficient of the reactants ( D 0 = 7 . 6  ×  10 - 6 cm 2 s - 1 ) ; v is the scan speed; and C 0 * is the initial concentration of the reactants ( C 0 * = 5   mM ) [24].
In this electrochemical system, n = 1, D0 = 7.6 × 10⁻⁶ cm2s−1 and C 0 * = 5   mM . Therefore, the slope of the above formula is only correlated with the effective electroactive area A of the electrode. It can be obtained that the effective electroactive area was 0.672 cm2 and 0.451 cm2 before and after WO3 modification, respectively. The effective electroactive area decreases after modification with WO3 nanocrystals, which is consistent with the SEM analysis before and after modification with WO3 nanocrystals, indicating that the effective active area of the electrode is not the primary reason for improving the detection performance of Cd2+.
The adsorption energy of heavy metal ions on the surface of WO3-modified electrodes was analyzed using the density functional theory (DFT). The simulation was performed with VSAP in the Materials Studio system. Heavy metal ions were found to have the following adsorption surfaces on the WO3-modified carbon electrode (Figure S1): WO3 surface, WO3-C interface and C surface. Each adsorption surface had the following adsorption sites of O-, W-O, W-, C, and C-C, respectively. Their adsorption energies and bond lengths are shown in Table 2. The table reveals that the O- adsorption site of Cd2+ at the WO3–C interface had the largest adsorption energy of −2.054 eV and the minimum bond length of 2.651 Å. Compared with the adsorption energy at C and C-C positions, WO3–C interface sites had the maximum adsorption energy. Therefore, the electrode modified with WO3 has a better performance than the unmodified electrode because of the greater adsorption energy of O-sites.
Table 3 compares the adsorption energy of heavy metal ions such as Cd2+, Pb2+, Hg2+ and Cu2+ at the WO3–C interface. The results demonstrate that Cd2+ has the largest adsorption energy and the shortest bond length. Therefore, WO3 has a good selectivity for Cd2+.
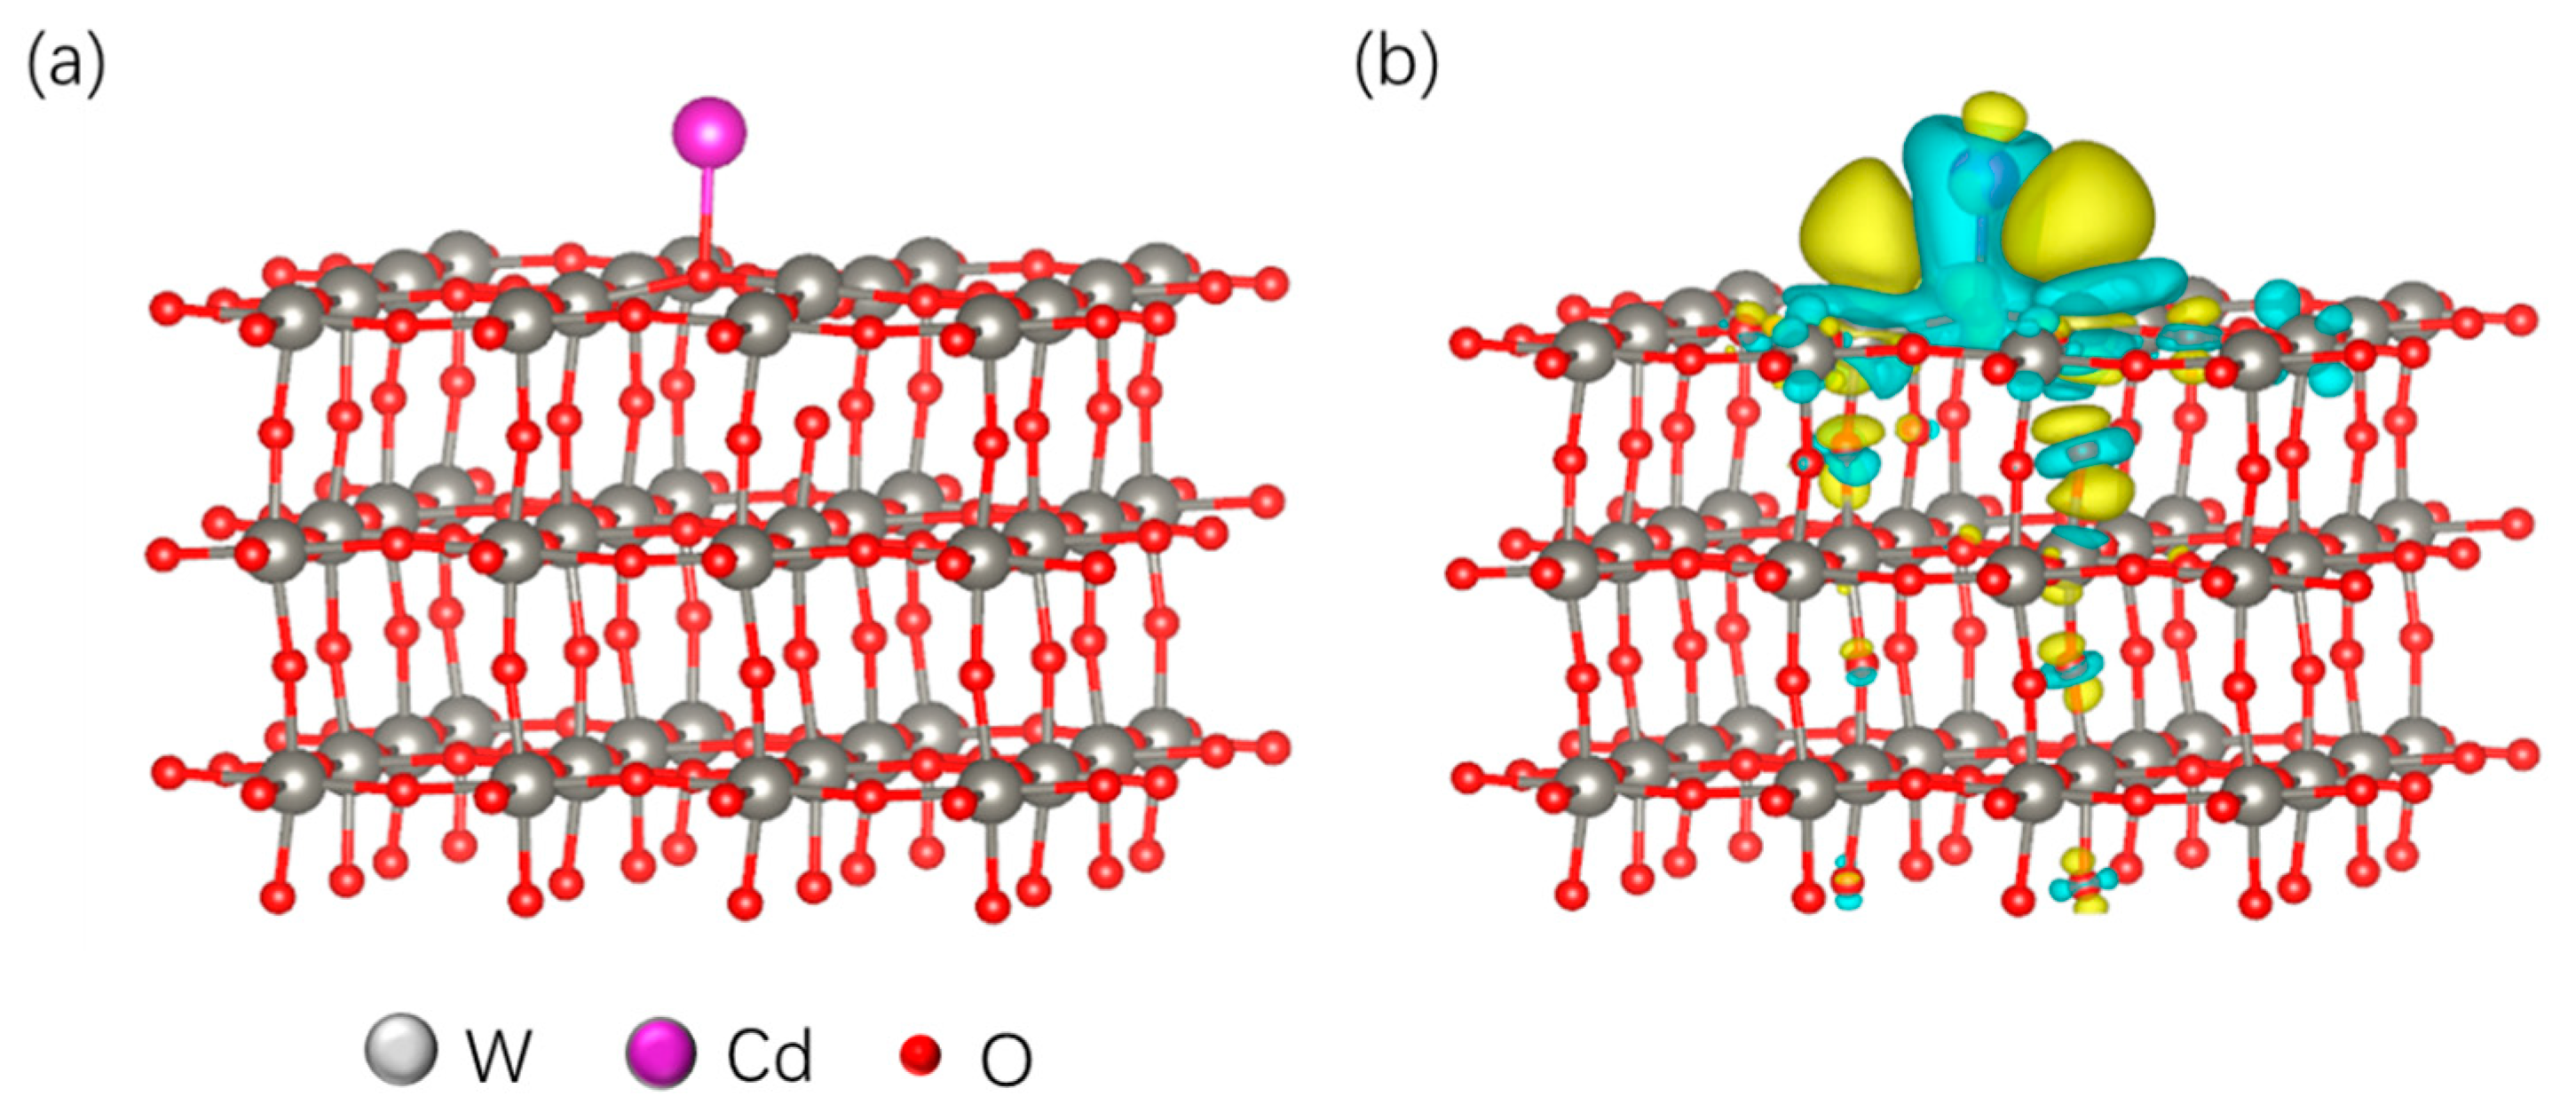
In addition to the strong adsorption capacity of the ions on the electrode surface, the electrons should also be transmitted efficiently. Figure 7a,b present the schematic diagrams of the adsorption sites and electron transfer of Cd2+ on the WO3 surface, as analyzed using the DFT theory. With the absorption of Cd2+ on the O-bond of the WO3 surface, the redistribution of the electron motion trajectory is caused by the overlap of the electron cloud. The blue part in Figure 7b is the electron dissipation region, and the yellow part is the electron accumulation area. Due to the strong electronegativity of the oxygen atoms, the electron cloud shifts to the oxygen atoms overall, forming the accumulation and dissipation regions of the electrons.
The Cd2+ reaction process on the WO3-modified carbon electrode surface may be as follows:
Deposition :   Cd 2 + + 2 e -     Cd
Dissolution :   Cd Cd 2 + + 2 e -
Cd2+ initially diffuses from the solution to the electrode surface under the electric field before being adsorbed on the electrode surface. The concentration of the solution is very low, and the diffusion coefficient of Cd2+ in the solution is a constant ( D = 7 . 2  ×  10 - 6 cm 2 s - 1 ). Therefore, the speed of the reaction process is mainly determined by the deposition speed of Cd2+ on the electrode surface and the electrochemical dissolution reaction speed. The adsorption of cadmium ions on the WO3 surface causes the offset of the electron cloud and the compact electrode structure of WO3 and carbon permeate each other, giving it a good electron transport capability, facilitating the electrochemical reactions and charge transfer, and thus improving the detection of Cd2+.
The detection efficiency of Cd2+ based on the WO3-modified electrode is analyzed in Figure 8. According to the scanning speed (50 mV/s) and the ASV curves with different Cd2+ concentrations (Figure 5b), the current–time curves of Figure 8a can be obtained, which integrate the current into the time to achieve the dissolved charge Q2. The deposited currents at different concentrations of Cd2+ were tested and multiplied by the deposition time of 120 s to yield the deposited charge Q1 (Figure 8b). The detection efficiency η of Cd2+ was obtained by Q2/Q1. Figure 8c shows the detection efficiency at different concentrations of Cd2+. The results demonstrate that when the concentration of Cd2+ is low (≤10 nM), its detection efficiency is relatively high. With the increase in Cd2+ concentration, its detection efficiency gradually decreased. This may be due to the fact that WO3 has enough adsorption sites for the adsorption and dissolution of Cd2+ at low concentration of Cd2+, so the detection efficiency is high. With the increase in Cd2+ concentration, although the dissolution current increases, the proportion of the dissolution sites to the adsorption sites decreases, thus reducing the reaction efficiency.

4. Conclusions

In this paper, WO3 nanocrystals were spin-coated on the carbon electrode surface for Cd2+ detection. The number of WO3 modification layers and pH value of the measured solution were determined to be optimal at three and 5.5, respectively. The ASV method was used to detect Cd2+ concentrations in the range of 1–10,000 nM, and the limit of detection was 0.029 nM. Meanwhile, the WO3-modified electrode has a better selectivity for Cd2+ than other heavy metal ions, which may be attributed to the strong adsorption energy to Cd2+ and remarkable signal transduction capability, which convert the Cd2+ adsorption into current output signals. The excellent Cd2+-detection ability and convenient electrode preparation process indicate that the WO3-nanocrystal-modified electrode has strong application prospects for Cd2+ detection.

Supplementary Materials

The following are available online at https://www.mdpi.com/article/10.3390/chemosensors11010054/s1, Figure S1: Schematic diagram of the adsorption sites of heavy metal ions on the modified electrode surface.

Author Contributions

H.L. and R.G. designed and directed this study and analyzed the data. R.G. contributed to all the experimental work. H.F., L.Z., Z.H., H.L., L.L. and B.C. assisted in all the experimental work. R.G., Y.Z., H.F. and Q.H. wrote the manuscript. All authors have read and agreed to the published version of the manuscript.

Funding

This work was supported by the National Natural Science Foundation of China (61922032) and Hubei Provincial Natural Science Foundation of China (Grant No. 2022CFA035). We thank the Program for HUST Academic Frontier Youth Team (2018QYTD06) and Innovation Fund of WNLO (Wuhan National Laboratory for Optoelectronics) for equipment support.

Institutional Review Board Statement

Not applicable.

Informed Consent Statement

Not applicable.

Data Availability Statement

Not applicable.

Acknowledgments

We thank the Analytical and Testing Center of HUST for the characterization support.

Conflicts of Interest

All authors have given approval to the final version of the manuscript and declare no competing financial interests.

References

  1. Godt, J.; Scheidig, F.; Grosse-Siestrup, C.; Esche, V.; Brandenburg, P.; Reich, A.; Groneberg, D.A. The toxicity of cadmium and resulting hazards for human health. J. Occup. Med. Toxicol. 2006, 1, 22. [Google Scholar] [CrossRef] [Green Version]
  2. Saini, S.; Dhania, G. Cadmium as an Environmental Pollutant: Ecotoxicological Effects, Health Hazards, and Bioremediation Approaches for Its Detoxification from Contaminated Sites. In Bioremediation of Industrial Waste for Environmental Safety: Volume II: Biological Agents and Methods for Industrial Waste Management; Bharagava, R.N., Saxena, G., Eds.; Springer: Singapore, 2020; pp. 357–387. [Google Scholar]
  3. Petroczi, A.; Naughton, D. Mercury, cadmium and lead contamination in seafood: A comparative study to evaluate the usefulness of Target Hazard Quotients. Food Chem. Toxicol. 2009, 47, 298–302. [Google Scholar] [CrossRef] [PubMed]
  4. Wu, Q.; Bi, H.-M.; Han, X.-J. Research Progress of Electrochemical Detection of Heavy Metal Ions. Chin. J. Anal. Chem. 2021, 49, 330–340. [Google Scholar] [CrossRef]
  5. Zhao, G. Recent Advances in Chemically Modified Electrodes, Microfabricated Devices and Injection Systems for the Electrochemical Detection of Heavy Metals: A review. Int. J. Electrochem. Sci. 2017, 12, 8622–8641. [Google Scholar] [CrossRef]
  6. Baghayeri, M.; Alinezhad, H.; Fayazi, M.; Tarahomi, M.; Ghanei-Motlagh, R.; Maleki, B. A novel electrochemical sensor based on a glassy carbon electrode modified with dendrimer functionalized magnetic graphene oxide for simultaneous determination of trace Pb(II) and Cd(II). Electrochim. Acta 2019, 312, 80–88. [Google Scholar] [CrossRef]
  7. Wang, X.; Xu, Y.; Li, Y.; Li, Y.; Li, Z.; Zhang, W.; Zou, X.; Shi, J.; Huang, X.; Liu, C.; et al. Rapid detection of cadmium ions in meat by a multi-walled carbon nanotubes enhanced metal-organic framework modified electrochemical sensor. Food Chem. 2021, 357, 129762. [Google Scholar] [CrossRef]
  8. Dali, M.; Zinoubi, K.; Chrouda, A.; Abderrahmane, S.; Cherrad, S.; Jaffrezic-Renault, N. A biosensor based on fungal soil biomass for electrochemical detection of lead (II) and cadmium (II) by differential pulse anodic stripping voltammetry. J. Electroanal. Chem. 2018, 813, 9–19. [Google Scholar] [CrossRef]
  9. Gumpu, M.B.; Sethuraman, S.; Krishnan, U.M.; Rayappan, J.B.B. A review on detection of heavy metal ions in water-An electrochemical approach. Sens. Actuators B Chem. 2015, 213, 515–533. [Google Scholar] [CrossRef]
  10. Zhang, T.; Jin, H.; Fang, Y.; Guan, J.; Ma, S.; Pan, Y.; Zhu, H.; Liu, X.; Du, M. Detection of trace Cd2+, Pb2+ and Cu2+ ions via porous activated carbon supported palladium nanoparticles modified electrodes using SWASV. Mater. Chem. Phys. 2019, 225, 433–442. [Google Scholar] [CrossRef]
  11. Priya, T.; Dhanalakshmi, N.; Thennarasu, S.; Thinakaran, N. A novel voltammetric sensor for the simultaneous detection of Cd2+ and Pb2+ using graphene oxide/κ-carrageenan/l-cysteine nanocomposite. Carbohydr. Polym. 2018, 182, 199–206. [Google Scholar] [CrossRef]
  12. Ghenaatian, H.R.; Shakourian-Fard, M.; Moghadam, M.R.; Kamath, G.; Rahmanian, M. Tailoring of graphene quantum dots for toxic heavy metals detection. Appl. Phys. A 2019, 125, 754. [Google Scholar] [CrossRef]
  13. Gu, R.; Zhao, Y.; Fu, H.; Yang, J.; Hu, Z.; Li, L.; Li, H.Y.; Huang, Q.; Chen, B.; Liu, H. Nanocrystalline SnO2-Modified Electrode for Ultra-Sensitive Mercury Ion Detection. IEEE Sens. J. 2022, 8, 7590–7598. [Google Scholar] [CrossRef]
  14. Bhanjana, G.; Dilbaghi, N.; Kumar, R.; Kumar, S. Zinc Oxide Quantum Dots as Efficient Electron Mediator for Ultrasensitive and Selective Electrochemical Sensing of Mercury. Electrochim. Acta 2015, 178, 361–367. [Google Scholar] [CrossRef]
  15. Araujo, P. Key aspects of analytical method validation and linearity evaluation. J. Chromatogr. B 2009, 877, 2224–2234. [Google Scholar] [CrossRef]
  16. Labuda, J.; Vanǹičková, M.; Uhlemann, E.; Mickler, W. Applicability of chemically modified electrodes for determination of copper species in natural waters. Anal. Chim. Acta 1994, 284, 517–523. [Google Scholar] [CrossRef]
  17. Sajnóg, A.; Koko, E.; Paszyńska, K.; Barałkiewicz, D. Multielemental speciation analysis of Cd2+, Pb2+ and (CH3)3Pb+ in herb roots by HPLC/ICP-DRC-MS. Validation and application to real samples analysis. Talanta Open 2022, 5, 100119. [Google Scholar] [CrossRef]
  18. Mc Eleney, C.; Alves, S.; Mc Crudden, D. Novel determination of Cd and Zn in soil extract by sequential application of bismuth and gallium thin films at a modified screen-printed carbon electrode. Anal. Chim. Acta 2020, 1137, 94–102. [Google Scholar] [CrossRef]
  19. Hai, T.; Hung, L.; Phuong, T.; Ha, B.; Nguyen, B.-S.; Hai, T.; Nguyen, V.H. Multiwall carbon nanotube modified by antimony oxide (Sb2O3/MWCNTs) paste electrode for the simultaneous electrochemical detection of cadmium and lead ions. Microchem. J. 2020, 153, 104456. [Google Scholar] [CrossRef]
  20. Palisoc, S.T.; Estioko, L.C.D.; Natividad, M.T. Voltammetric determination of lead and cadmium in vegetables by graphene paste electrode modified with activated carbon from coconut husk. Mater. Res. Express 2018, 5, 085035. [Google Scholar] [CrossRef]
  21. Rojas-Romo, C.; Aliaga, M.E.; Arancibia, V.; Gomez, M. Determination of Pb(II) and Cd(II) via anodic stripping voltammetry using an in-situ bismuth film electrode. Increasing the sensitivity of the method by the presence of Alizarin Red S. Microchem. J. 2020, 159, 105373. [Google Scholar] [CrossRef]
  22. Ns, A.; Ashoka, S.; Malingappa, P. Nano zinc ferrite modified electrode as a novel electrochemical sensing platform in simultaneous measurement of trace level lead and cadmium. J. Environ. Chem. Eng. 2018, 6, 6939–6946. [Google Scholar] [CrossRef]
  23. Zhao, X.; Bai, W.; Yan, Y.; Wang, Y.; Zhang, J. Core-Shell Self-Doped Polyaniline Coated Metal-Organic-Framework (SPAN@UIO-66-NH2) Screen Printed Electrochemical Sensor for Cd2+ Ions. J. Electrochem. Soc. 2019, 166, B873–B880. [Google Scholar] [CrossRef]
  24. Ngamchuea, K.; Eloul, S.; Tschulik, K.; Compton, R.G. Planar diffusion to macro disc electrodes—What electrode size is required for the Cottrell and Randles-Sevcik equations to apply quantitatively. J. Solid State Electrochem. 2014, 18, 3251–3257. [Google Scholar] [CrossRef]
Figure 1. Schematic diagram of WO3-modified electrode for Cd2+ sensor. (a) WO3 nanocrystal solution; (b) The electrode modification process with WO3 nanocrystals by spin-coating; (c) Ion adsorption and desorption process.
Chemosensors 11 00054 g001
Figure 2. The characterization of material and electrode micromorphology. (a) TEM image of WO3 nanocrystals; (b) XRD diagram of WO3 nanocrystals; (c) SEM image of the unmodified carbon electrode; (d) SEM image of WO3-modified electrode; (e) Cross-sectional SEM image of the modified electrode; (fh) The W-element (f), C-element (g), and O-element (h) distribution mapping of the electrode’s cross-section.
Chemosensors 11 00054 g002
Figure 3. The CV curve of the WO3-modified electrode in the Cd2+ standard solution.
Chemosensors 11 00054 g003
Figure 4. Optimization of WO3-modified electrodes. (a) The equivalent circuit of the electrochemical system; (b) The EIS (inset) and Rct of the modified electrode with different numbers of layers of WO3 nanocrystals in the KKS solution; (c) The EIS (inset) and Rct of the modified electrode with different numbers of layers of WO3 nanocrystals in the KKS and Cd2+ mixture solution; (d) Dissolution peak currents of WO3-modified electrodes in Cd2+ solutions with different pH values.
Chemosensors 11 00054 g004
Figure 5. Electrochemical performance of the WO3-modified electrodes. (a) ASV curve of the unmodified electrodes in different concentrations of the Cd2+ solution; (b) ASV curve of WO3-modified electrodes in high concentrations of the Cd2+ solution (inset: linear fitting curve of the dissolution peak current of WO3-modified electrodes in different concentrations of the Cd2+ solution); (c) ASV curve of WO3-modified electrodes in low concentrations of the Cd2+ solution (inset: linear fitting curve of the dissolution peak current of WO3-modified electrodes in low concentrations of the Cd2+ solution); (d) Comparison of the dissolution peak current of different heavy metal ions (the concentration of Cd2+ was 1 μM, and the other interfering ions were 25 times that of Cd2+); (e) Comparison of ASV and ICP methods in different water samples; (f) Normalized fitting curve for the ASV method and the ICP method.
Chemosensors 11 00054 g005
Figure 6. Comparison of the CV curves at different scan speeds. (a) CV curve of the unmodified electrodes at different scanning speeds in the KKS solution; (b) CV curve for WO3-modified electrodes at different scanning speeds in KKS solution; (c) Linear fitting curve of the oxidation peak current and v1/2 before and after electrode modification at different scanning speeds.
Chemosensors 11 00054 g006
Figure 7. The adsorption of Cd2+ on the WO3 surface and the transfer of the electron. (a) The adsorption site of Cd2+ on the WO3 surface; (b) The electron transfer at the interface after the adsorption of Cd2+.
Chemosensors 11 00054 g007
Figure 8. Analysis of the detection efficiency for Cd2+. (a) The relationship of dissolution current and scanning time; (b) The relationship of deposition current, deposition charge, dissolution charge and Cd2+ concentration; (c) The relationship between Cd2+ concentration and detection efficiency.
Chemosensors 11 00054 g008
Table 1. Comparison of Cd2+-detection performance of electrodes modified with different chemicals.
Modification MaterialMethodDetection RangeDetection LimitReference
RGO/g-C3N4/BiTFSW-ASV180–4050 nM90 nM[18]
Graphene Oxide/k-carrageenan/L-cysteine nanocompositeSW-ASV550 nM0.58 nM[10]
Pd@PAC/GCESW-ASV25,500 nM13.3 nM[11]
Sb2O3/MWCNTsLASV715,625 nM100 nM[19]
AC/MGPEASV452,678 nM500 nM[20]
Bismuth/GCEDP-ASV9–135 nM0.81 nM[21]
zinc ferrite/GCEDP-ASV89–1160 nM22.5 nM[22]
WO3 nanocrystalsASV1–10,000 nM0.029 nMThis work
Table 2. Adsorption energy and bond length of Cd2+ at different adsorption sites on the surface of WO3-nanocrystal-modified electrode.
SitesItemsOW-OWC-CC
WO3 surfaceEads (eV)−1.373−0.671−0.394————
Length (Å)2.8612.7133.295————
WO3–C interfaceEads (eV)−2.054−1.663−0.617————
Length (Å)2.6512.7413.013————
C surfaceEads (eV)——————−0.855−1.066
Length (Å)——————3.2693.054
Table 3. Adsorption energy of different heavy metal ions on the WO3-modified electrode surface.
SitesItemsCdPbHgCu
OEads (eV)−2.054−1.371−0.751−0.573
Length (Å)2.6512.7632.9682.967
W-OEads (eV)−1.663−0.811−0.423−0.217
Length (Å)2.7412.8613.1543.051
WEads (eV)−0.617−0.185−0.159−0.413
Length (Å)3.0133.2613.3692.975
Disclaimer/Publisher’s Note: The statements, opinions and data contained in all publications are solely those of the individual author(s) and contributor(s) and not of MDPI and/or the editor(s). MDPI and/or the editor(s) disclaim responsibility for any injury to people or property resulting from any ideas, methods, instructions or products referred to in the content.