Next Article in Journal
Emerging Role of Biosensors and Chemical Indicators to Monitor the Quality and Safety of Meat and Meat Products
Next Article in Special Issue
Review of the Status and Prospects of Fiber Optic Hydrogen Sensing Technology
Previous Article in Journal
QCM Measurements of RH with Nanostructured Carbon-Based Materials: Part 2-Experimental Characterization
 
 
Correction published on 3 January 2023, see Chemosensors 2023, 11(1), 41.
Article

Highly Sensitive Hydrogen Sensing Based on Tunable Diode Laser Absorption Spectroscopy with a 2.1 μm Diode Laser

National Key Laboratory of Science and Technology on Tunable Laser, Harbin Institute of Technology, Harbin 150001, China
*
Author to whom correspondence should be addressed.
Chemosensors 2022, 10(8), 321; https://doi.org/10.3390/chemosensors10080321
Submission received: 10 July 2022 / Revised: 7 August 2022 / Accepted: 8 August 2022 / Published: 11 August 2022 / Corrected: 3 January 2023
(This article belongs to the Special Issue Gas Detection Sensors for On-Chip Applications)

Abstract

:
As a new form of energy, hydrogen (H2) has clean and green features, and the detection of H2 has been a hot topic in recent years. However, the lack of suitable laser sources and the weak optical absorption of H2 limit the research concerning its detection. In this study, a continuous-wave distributed feedback (CW-DFB) diode laser was employed for sensing H2. Tunable diode laser absorption spectroscopy (TDLAS) was adopted as the detection technique. The strongest H2 absorption line, located at 4712.90 cm−1 (2121.83 nm, line strength: 3.19 × 10⁻²⁶ cm−1/cm−2 × molec), was selected. We propose a H2-TDLAS sensor based on the wavelength modulation spectroscopy (WMS) technique and a Herriott multipass gas cell (HMPC) with an optical length of 10.13 m to achieve a sensitive detection. The WMS technique and second harmonic (2f) demodulation technique were utilized to suppress system noise and simplify the data processing. The 2f signal of the H2-TDLAS sensor, with respect to different H2 concentrations, was measured when the laser wavelength modulation depth was at the optimal value of 0.016 cm−1. The system’s signal-to-noise ratio (SNR) and minimum detection limit (MDL) were improved from 248.02 and 0.40% to 509.55 and 0.20%, respectively, by applying Daubechies (DB) wavelet denoising, resulting in 10 vanishing moments. The Allan variance was calculated, and the optimum MDL of 522.02 ppm was obtained when the integration time of the system was 36 s.

1. Introduction

The rapid development of the modern industry and the constantly increasing world population have accelerated energy consumption. Non-renewable resources such as natural gas and oil have been overexploited, and the overuse of such fossil fuels has further increased the emission of carbon dioxide [1] and exacerbates the greenhouse effect. By contrast, the utilization of new sources of clean and renewable energy have become an essential strategic goal of most countries, among which hydrogen (H2) has the advantages of being clean, green, pollution-free, abundant, and has a high combustion efficiency [2]; therefore, it is considered to have a promising future [3]. However, H2 is a flammable and explosive gas. Under normal pressure and temperature, when the H2 volume concentration in the air is between 4% and 75.6% and exposed to naked fire, it will cause an explosion, which leads to great risks in the production, storage, and transportation of H2. Therefore, real-time monitoring of atmospheric H2 concentration levels is necessary to eliminate the potential safety hazards caused by H2 leakage.
In recent years, various H2 sensing methods have been continuously emerging. For electrochemical H2 sensors, the H2 concentration can be retrieved by monitoring the current [4,5] or electromotive force [6] of the device. However, the poor long-term stability and detection performance limit the applications of these methods. In resistance-based H2 sensors, the resistance (or variation of resistance) is applied to invert the H2 concentration [7,8,9,10,11]. However, such sensors tend to require high operating temperatures (>100 °C) and suffer from poor sensitivity and interference from humidity. In work function-based H2 sensors, materials such as Pd that are sensitive to H2 are often coated on oxide layers to sense H2 [12,13,14], but this method has the disadvantages of complicated hysteresis, poor repeatability, a non-zero baseline, and a H2-induced drift [15]. In addition, other H2 sensors, such as the mechanical sensor based on the vibration of a cantilever beam [16] or quartz resonator [17], the acoustic sensor based on a surface acoustic wave [18] or sound velocity [19], and the optical sensor based on the shift of transmission/reflection wavelength [20] or surface plasmon resonance [21] are applied in some instances. Unfortunately, all of these are easily disturbed by interfering gases. Furthermore, the mechanical sensors are typically difficult to fabricate. The optical sensors are susceptible to interference from ambient light, and the acoustic sensors are easily obstructed by interfering sound waves and vibrations.
In the field of optical gas sensing, common technologies include quartz-enhanced photoacoustic spectroscopy (QEPAS) [22,23], light-induced thermoelastic spectroscopy (LITES) [24,25], and tunable diode laser absorption spectroscopy (TDLAS). In the QEPAS and LITES methods, a piezoelectric quartz tuning fork (QTF) serves as an acoustic wave or thermal detector [26,27,28]. When the output of a near-infrared semiconductor laser is absorbed by a gas sample, the absorbed energy is transformed to heat energy by non-radiative processes. This results in an increase of the local temperature and pressure in the sample. The absorption of a modulated near-infrared laser beam in a gas sample leads to the generation of an acoustic wave. The intensity of the acoustic wave is related to the sample concentration, which can be detected by a sensitive QTF [29,30]. In the LITES method, a QTF is employed to detect the absorption variation of light intensity [31,32]. When the quartz at the surface of QTF is irradiated by an intensity-modulated laser, the quartz crystal will absorb the laser energy and convert it into photothermal energy. Because of the characteristics of light-thermo-elastic conversion, the QTF will undergo elastic deformation, which results in the mechanical vibration of QTF and the generation of a piezoelectric signal [33,34]. Moreover, the oscillation amplitude and the obtained piezoelectric signal will reach their maximums when the intensity-modulated frequency of light is equal to the resonant frequency of one of flexural modes of the QTF. Compared to the QEPAS technique, the LITES method can be a non-contact measurement technique [35,36,37]. Therefore, it can be used in certain harsh environments, such as in combustion fields. However, silver film is generally the coating applied on QTFs to collect the electrical charge generated. They surely provide excellent conductivity, but they also provide strong reflectivity to light, which is disadvantageous to the signal level. The TDLAS technique is widely applied in the detection of various kinds of gases [38,39,40] because of the advantages of non-contact measurement, in situ detection, high selectivity, quick response, low cost, and multi-component, multi-parameter measurement. In the year of 2019, a TDLAS based H2 sensing was performed, and a precision of 0.02 %v was achieved with 1 m of absorption pathlength and 1 s of integration time [41].
A TDLAS-based H2 sensor is proposed in this paper. A continuous-wave (CW), distributed feedback (DFB) diode laser was employed to cover the strongest absorption line of H2 at 2121.83 nm. Because the H2 absorption line has a weak line strength, a 10.13 m Herriott multipass gas cell (HMPC) was used to increase the optical absorption path of H2 in the gas chamber to laser energy, thereby enhancing the signal amplitude. The wavelength modulation spectroscopy (WMS) and second harmonic (2f) demodulation techniques were utilized to reduce the noise level and improve the sensing performance. Daubechies (DB) wavelet was applied for further signal denoising. The system’s stability was investigated using the Allan variance.

2. Principle

2.1. Principle of TDLAS Technique

As an absorption spectroscopy technology, TDLAS is based on the Beer–Lambert law:
I = I 0 e x p α ν L
When α ν L 1 , this formula can be rewritten as:
I = I 0 1 α ν L
where I0 is the intensity of laser output, I is the intensity of the laser received by the photodetector (PD), L is the absorption optical path, α ν is the absorption coefficient, and can be expressed as follows:
α ν = P S T φ ν C
where P is the gas pressure, C is the gas concentration, S(T) is the line strength of the gas at temperature T, and φ ν is the line shape function.
When the emission laser makes contact with gas molecules, the gas molecules will absorb the laser energy if the wavelength of the laser coincides with the absorption line of the gas molecule. In combination with Equations (2) and (3), the attenuation of the light intensity is proportional to the gas concentration C, absorption optical path L, and line strength S(T) [42]. A larger attenuation of laser intensity tends to produce a stronger TDLAS sensor signal, so there are many methods to improve the detection limit of the TDLAS technique, such as selecting the appropriate absorption spectroscopy line, thereby increasing the absorption optical path [43,44,45,46,47].

2.2. The Selection of Laser Source

In terms of gas spectroscopy detection technology, the performance of the laser has a decisive influence. The main requirements of the laser source are as follows:
  • A laser with a suitable output power. A moderate output power is advantageous in obtaining a high signal-to-noise ratio (SNR).
  • A single-longitudinal-mode and narrow line width output can improve the selectivity and sensitivity of system detection.
  • A stable mode and no mode-hopping output, which can reduce the noise caused by mode competition and improve the stability of system detection.
  • The working wavelength can be quickly tuned, and the tuning range is wide enough to ensure that the spectral absorption range of the target gas can be covered. The requirements of fast response and high-speed data acquisition can be met. The output wavelength range of the laser determines the species and quantity of detectable gases.
  • High beam quality, that is, a small divergence angle and ideal spot shape, which facilitates beam coupling in the optical system and reduces optical noise.
  • A source that is insensitive to changes in environmental conditions. External environment temperature, humidity, and pressure changes will not significantly influence the output performance of the laser.
  • The volume, weight, and power dissipation of the laser should be small, and the lifetime should be long so as to meet the requirements of engineering application.
According to the above, the development of TDLAS technology, which is a spectroscopy technique, is strongly restricted by laser sources [48]. Laser sources that can match H2 absorption lines have just emerged in recent years, which has resulted in rare research on H2 sensing using TDLAS. A distributed feedback laser with a built-in Bragg grating can result in a single mode laser. Due to the excellent monochromaticity and side-mode suppression ratio, the DFB laser has wide gas detection. Compared with other laser sources, it possesses the characteristics of small size, low power consumption, and a low cost. Therefore, a DFB diode laser was adopted in this research.

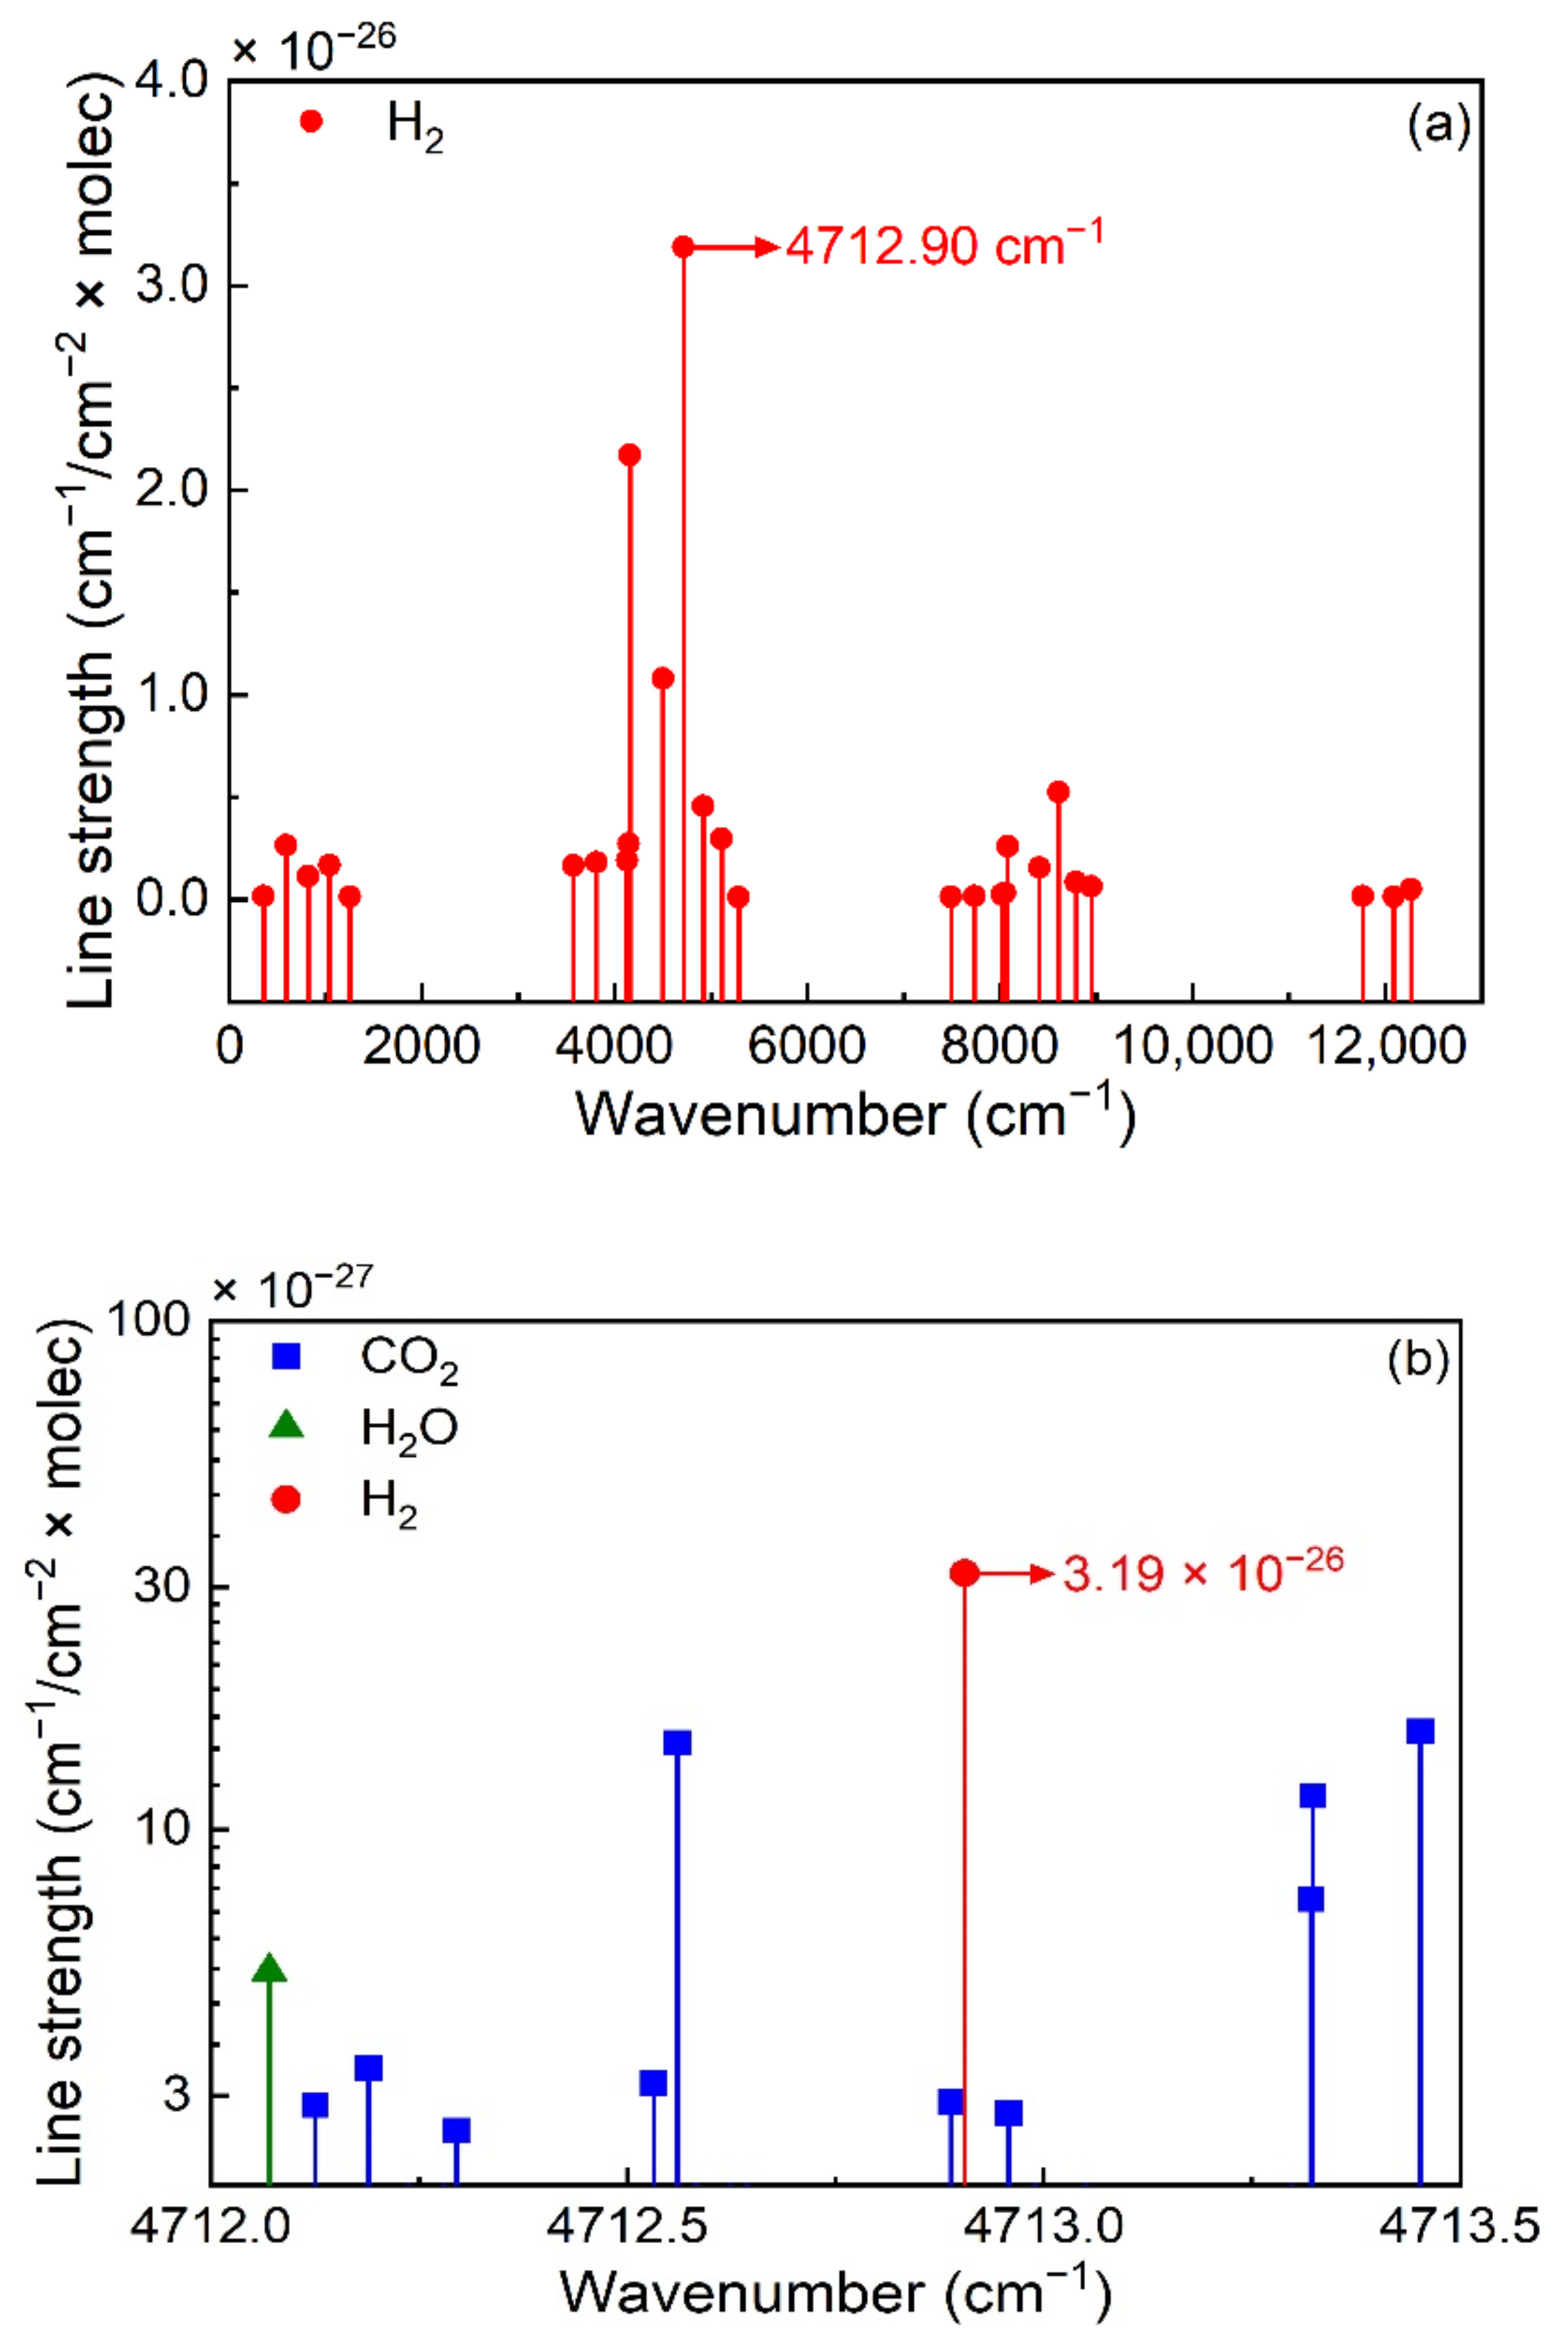
2.3. The Selection of H2 Absorption Lines

It is worth noting that each gas has a different line strength at different wavelengths, which avoids the problem of cross-sensitivity between different gases by selecting the appropriate absorption lines. A strong line strength often results in a large attenuation of the light intensity. Therefore, the selection of absorption lines is important and usually obeys the following rules:
  • The line strength of the selected absorption line should be as large as possible.
  • The selected gas absorption lines minimize the degree of overlap with other gas absorption lines.
  • It should be ensured that a suitable laser source is available to excite the selected gas absorption lines.
Usually, the high-resolution transmission molecular absorption database (HITRAN) is used to predict and simulate the transmission and emission of light in the atmosphere, and we used the database in this study.

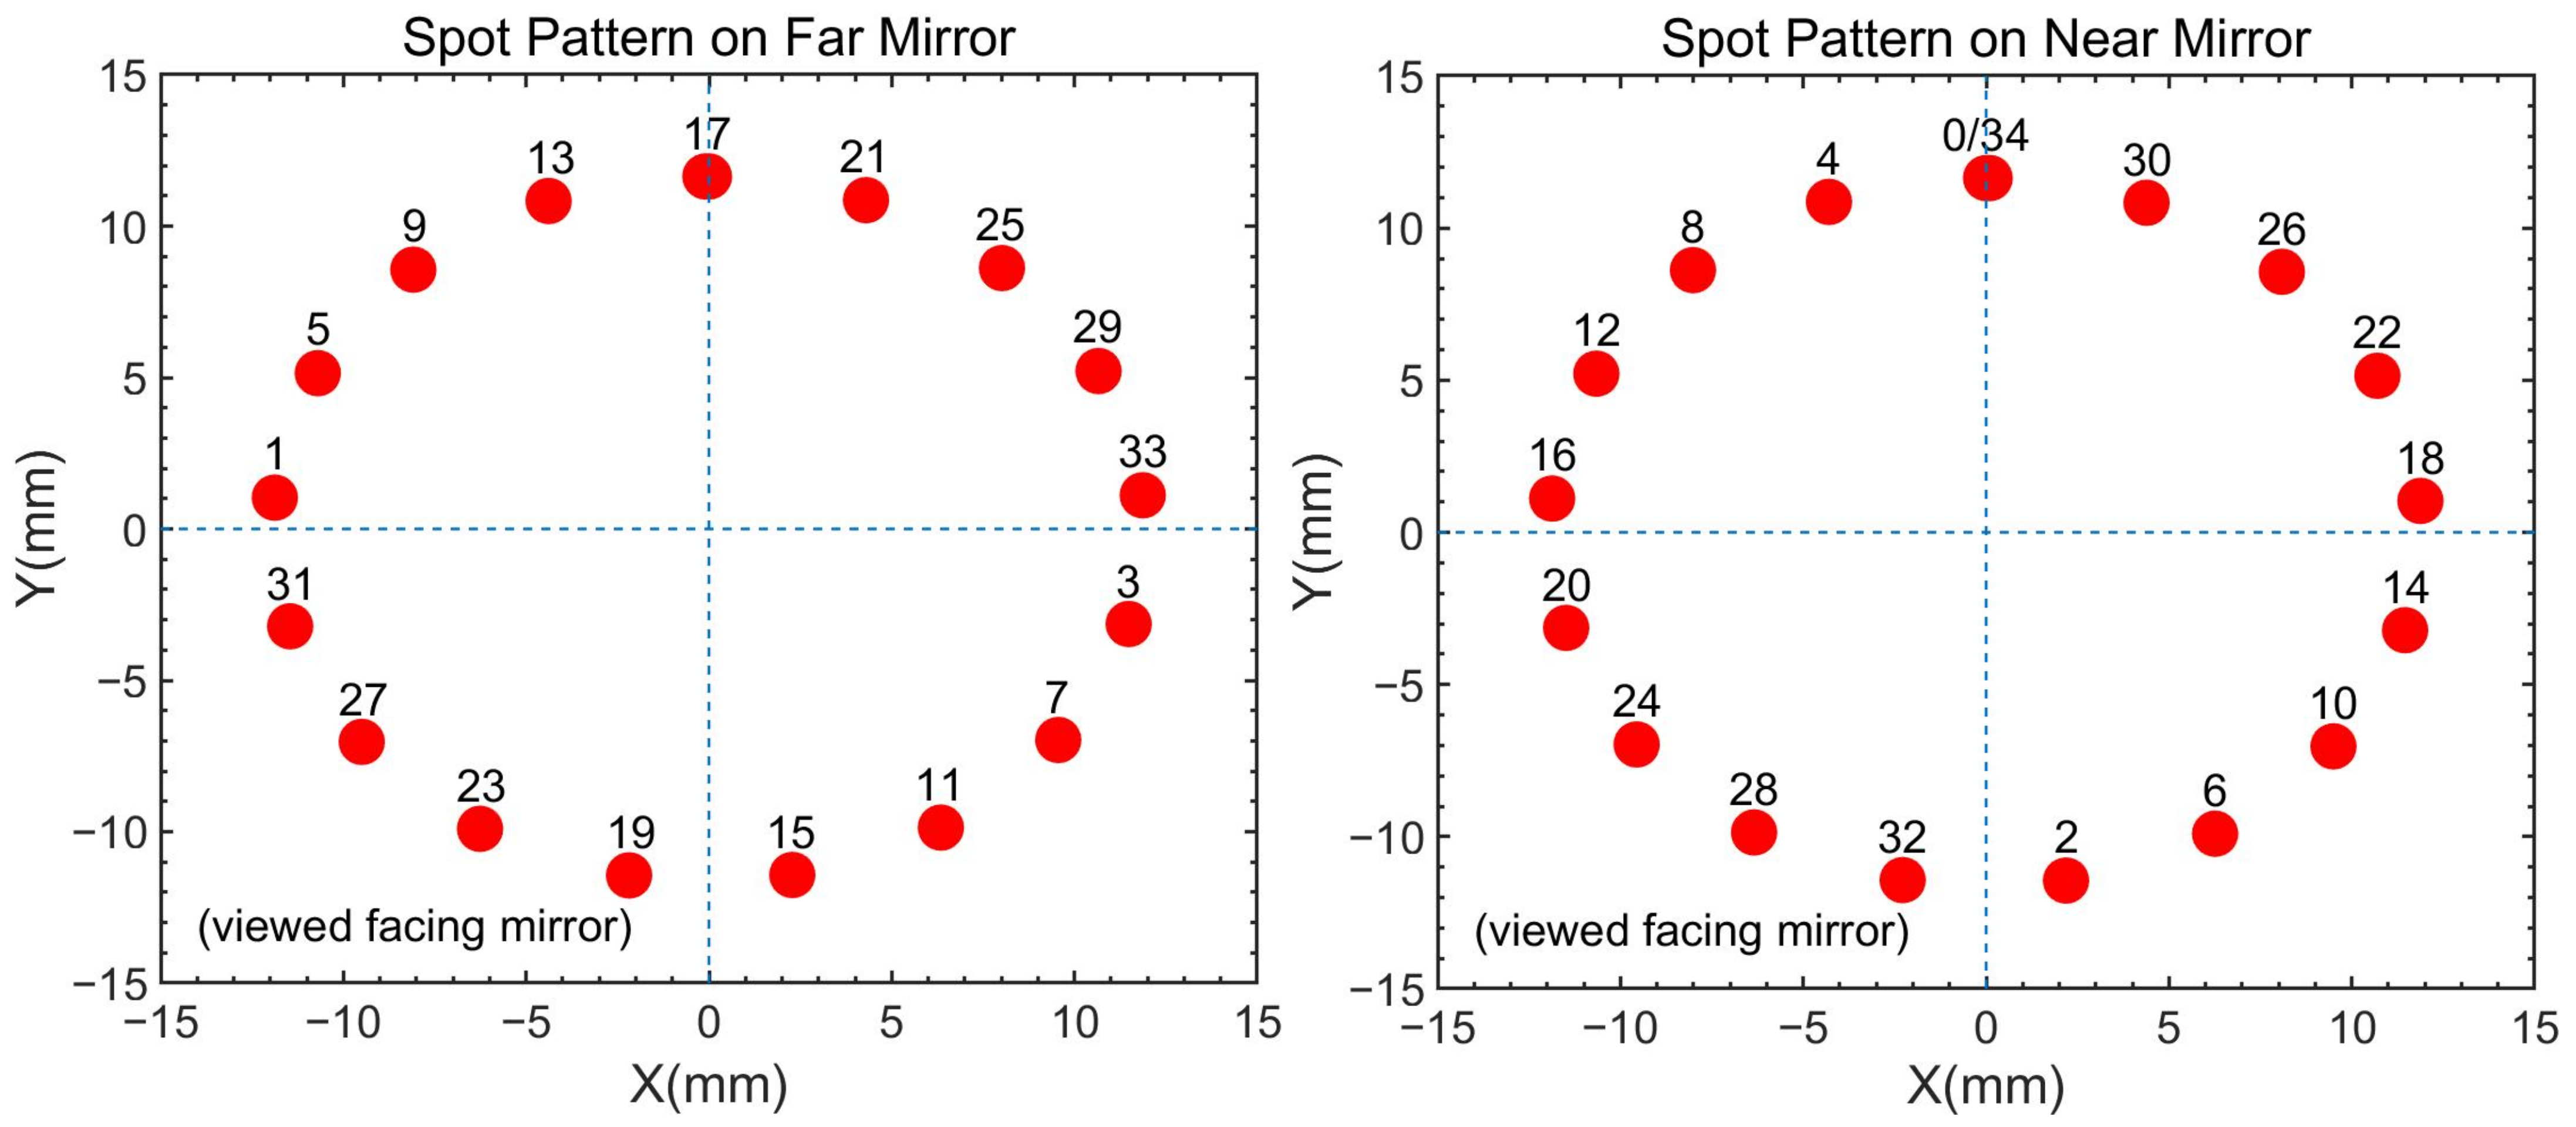
2.4. The Selection of Multipass Gas Cell

The line strength of the strongest absorption line of H2 (10−26) is still much weaker than other gases (~10−21) [38,39,40]. Therefore, it is necessary to increase the amount of light intensity attenuation by using a long optical path gas cell.
Presently, the commonly used method to increase the optical path is through the use of a multipass gas cell, which includes two main kinds of multipass cells: White cells and Herriott cells. The most major difference between a Herriott cell and White cell is the reflection point. Every reflection of a White cell is at the center of the mirror, meaning that there are multiple reflections at the center of each small mirror at the same time, and reflection points overlap with each other. On the other hand, the reflection points of the Herriott cell are distributed around the mirror, forming a ring; each reflection point will form a separate spot of light without overlapping each other. Therefore, if an excitation light source with a narrow line width (such as a laser) is used for the White cell, the overlapping of the reflection points causes the mutual interference of the laser, resulting in interference noise. The Herriott cell can solve this problem as each reflection point of the Herriott cell is independent and does not overlap with another point, so no interference fringes will be generated. A White cell is usually formed by using three mirrors and a Herriott is created by using two mirrors. The Herriott cell is widely adopted in TDLAS technology.

2.5. WMS and Harmonic Demodulation Technique
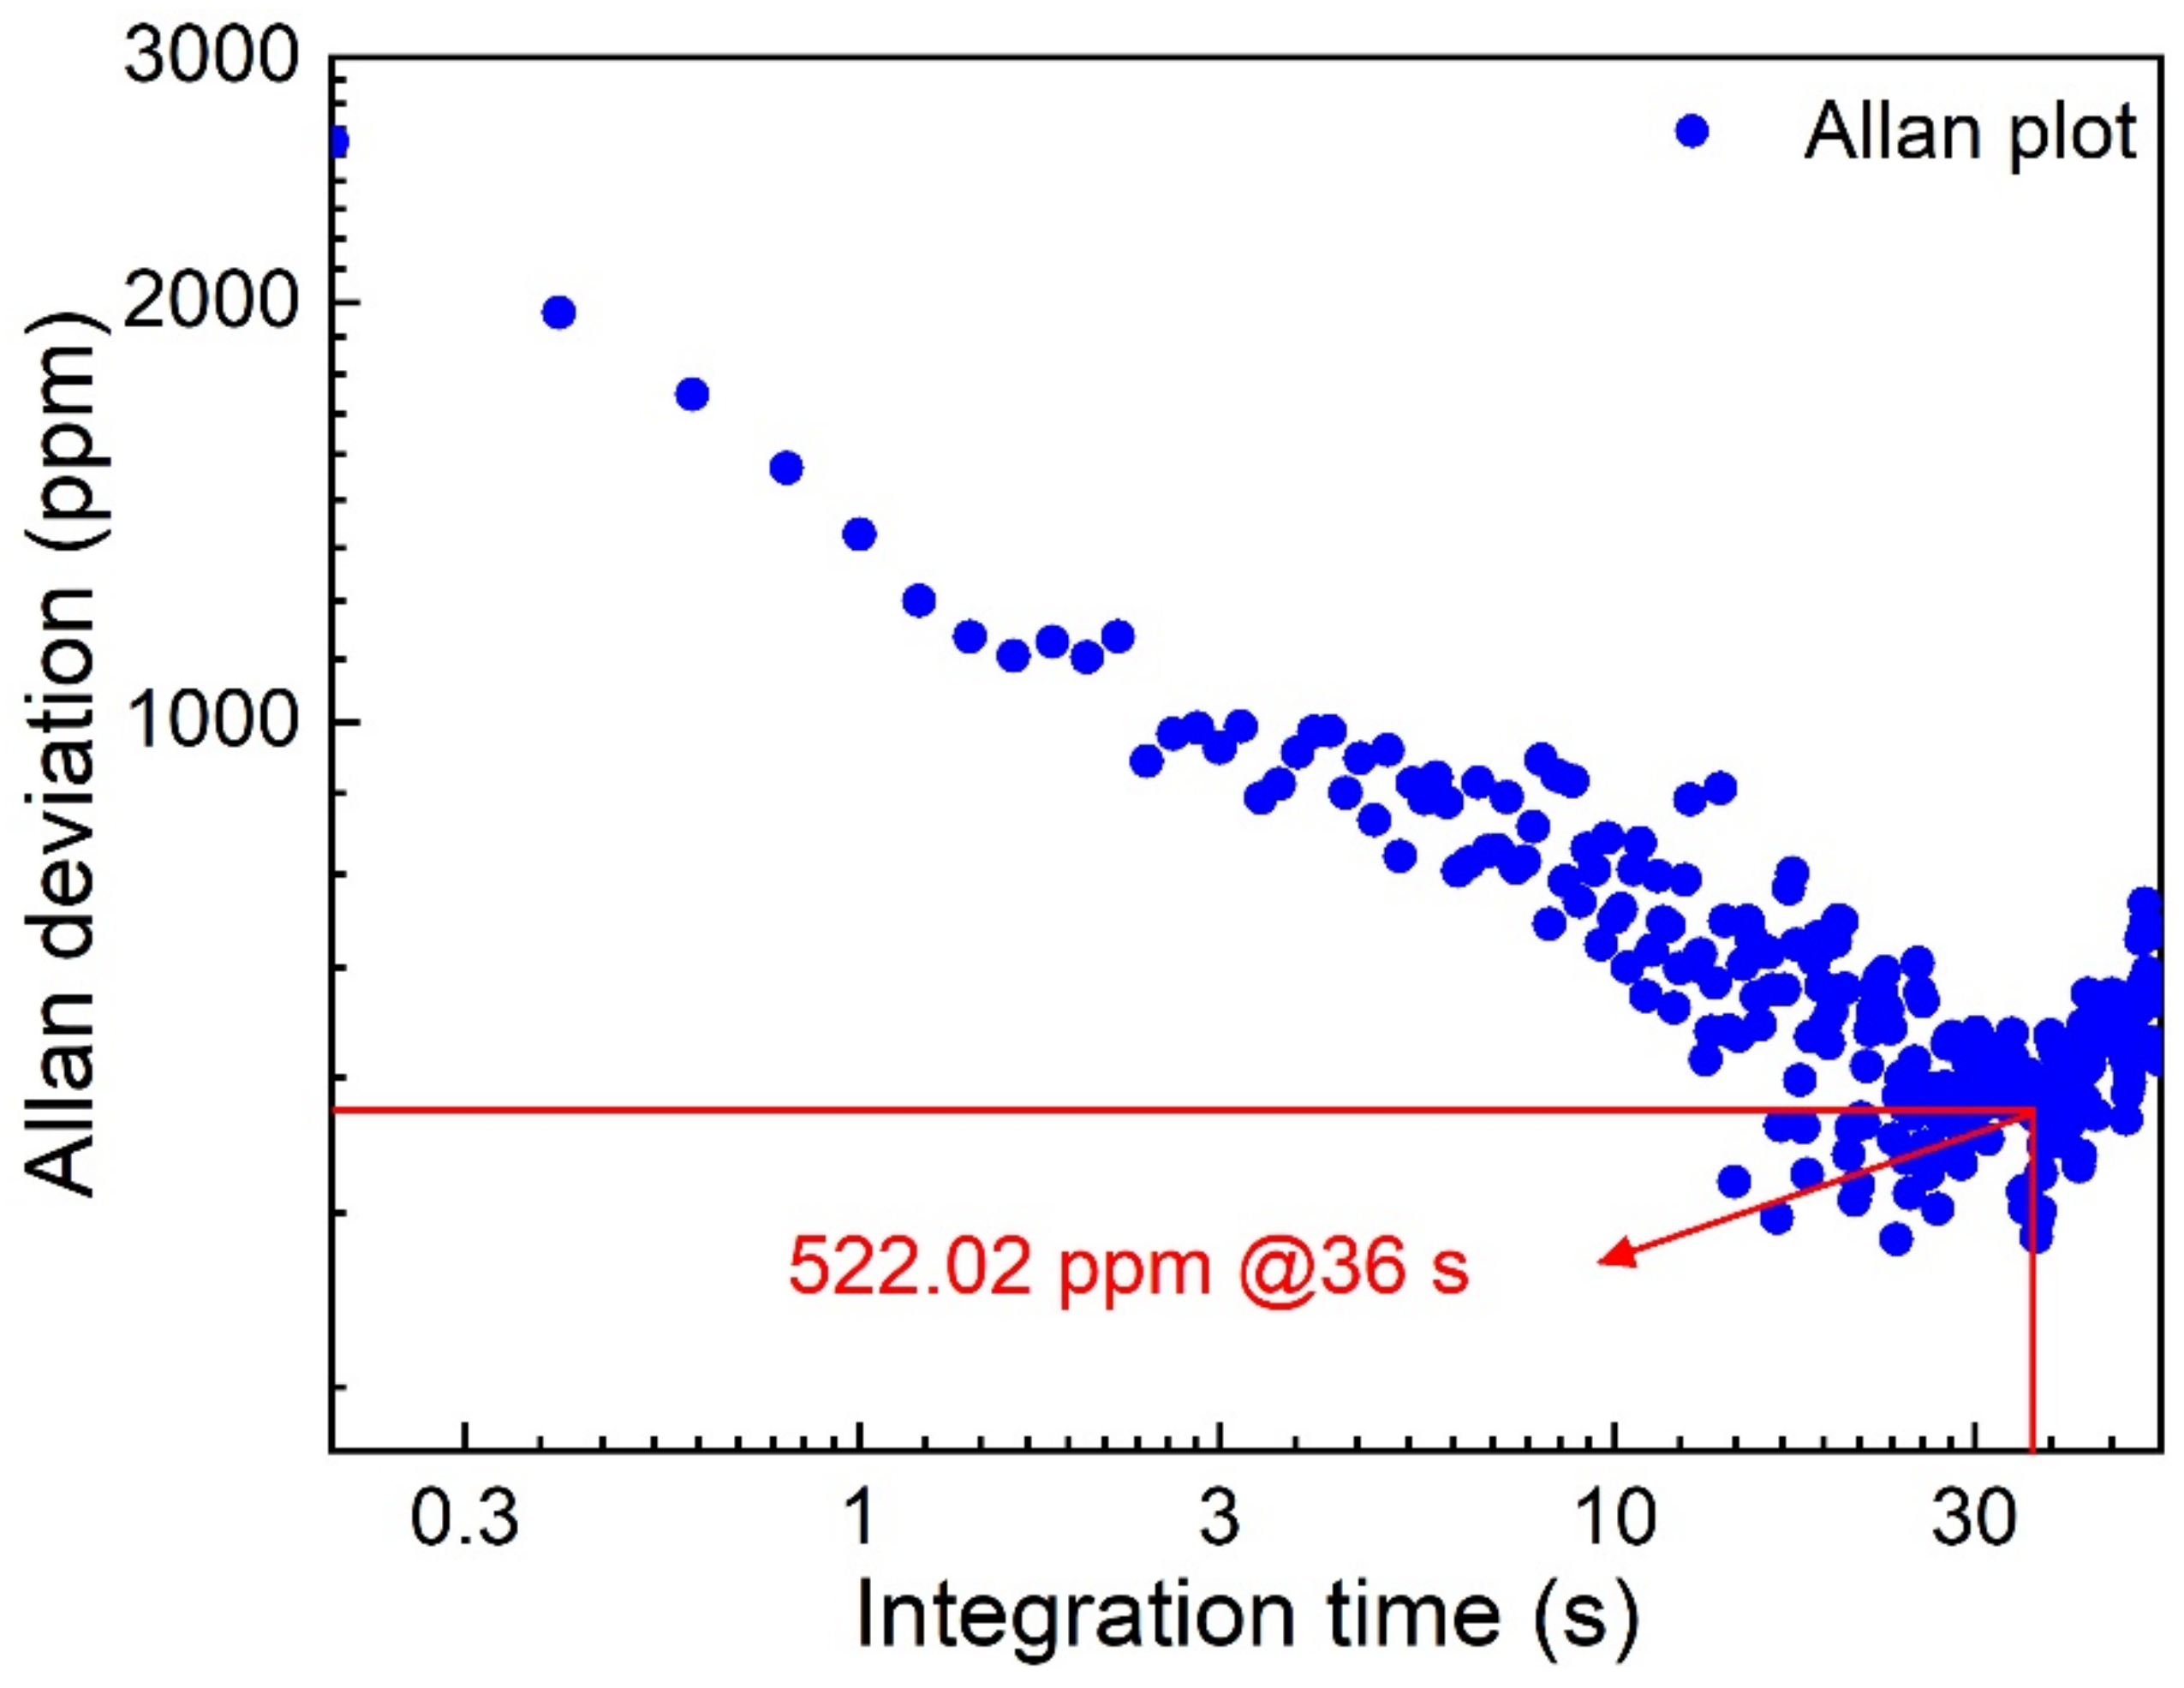
The detection system based on TDLAS technology usually has low frequency background noise, such as the 1/f noise, and most of them have frequencies of less than 1 kHz. Therefore, if WMS technique is employed and the laser wavelength is modulated with a high frequency (>1 kHz), it can effectively reduce the influence of low frequency noise on the signal. Generally, there are two existing WMS methods: fixed-point wavelength modulation and scanning wavelength modulation. In TDLAS, the former method only uses a sine wave to modulate the wavelength corresponding to the center of the absorption line; the latter not only adopts a low frequency sawtooth wave to scan the selected whole absorption line, but applies a high frequency sine wave to modulate the wavelength of the whole absorption line at the same time. The former is only used for single wavelength point measurements, while the latter can scan the entire absorption line and realize multi-point and multi-wavelength measurements. Therefore, the second method is widely used in TDLAS and other laser spectroscopy-based gas sensing.
Harmonic demodulation technique is often used for the demodulation of modulated signals. In TDLAS, the magnitude of the harmonic signal is related to the strength of the gas absorption line corresponding to that wavelength [48]. Hence, the shape of the harmonic signal obtained by demodulation is theoretically a straight line for the first method, while for the second method, the shape of the harmonic signal obtained by demodulation is related to the harmonic order number. In terms of each order of harmonic, the even harmonic peak is located at the center of the absorption line, while the odd harmonic is zero at the absorption peak. With the increase in harmonic order, the harmonic peak decreases rapidly. Compared with other orders of harmonics, the peak value of the second harmonic (2f) is not only located at the absorption peak but also is the largest among even harmonics. Based on these features of harmonic signals, the 2f order is often used during the demodulation of modulated signals.

2.6. Allan Variance

System stability is the main factor that affects high sensitivity measurement. A perfectly stable gas detection system based on spectroscopy technology can theoretically obtain an extremely sensitive detection performance through infinite averaging. However, due to the fluctuations of laser emission wavelength, interference fringe, background spectroscopy, and other reasons, real TDLAS systems are only stable for a limited time, so that the system’s best detection sensitivity is only achieved in a limited time span.
The Allan variance was proposed in 1993 by Werle et al. for the TDLAS system to obtain the best detection sensitivity, which can be written in the following form as a time-domain approximation when neglecting the duty cycle effects [49]:
σ A 2 τ = c w h i t e   n o i s t 1 / τ + c 1 / f + α c d r i f t , α τ α
where τ is the integration time, c w h i t e   n o i s t 1 / τ , c 1 / f , α c d r i f t , α τ α represent the contributions of the frequency independent “white noise”, frequency dependent 1/f, and 1/fα(α > 1) noise to Allan variance, respectively, and α characterizes the type of system drift. It can be seen from Equation (4) that when the integration time τ is small, the Allan variance is mainly caused by white noise and decreases with the increase of integration time. However, as the integration time increases, the main factor affecting the Allan variance becomes the frequency dependent noise which increases with the increase in integration time. Therefore, the curve of the Allan variance as a function of integration time exists at a minimum. Additionally, the square root of the Allan variance in regions dominated by white noise is proportional to the detection limit [49], which means that the Allan variance can be employed to evaluate the system minimum detection limit.

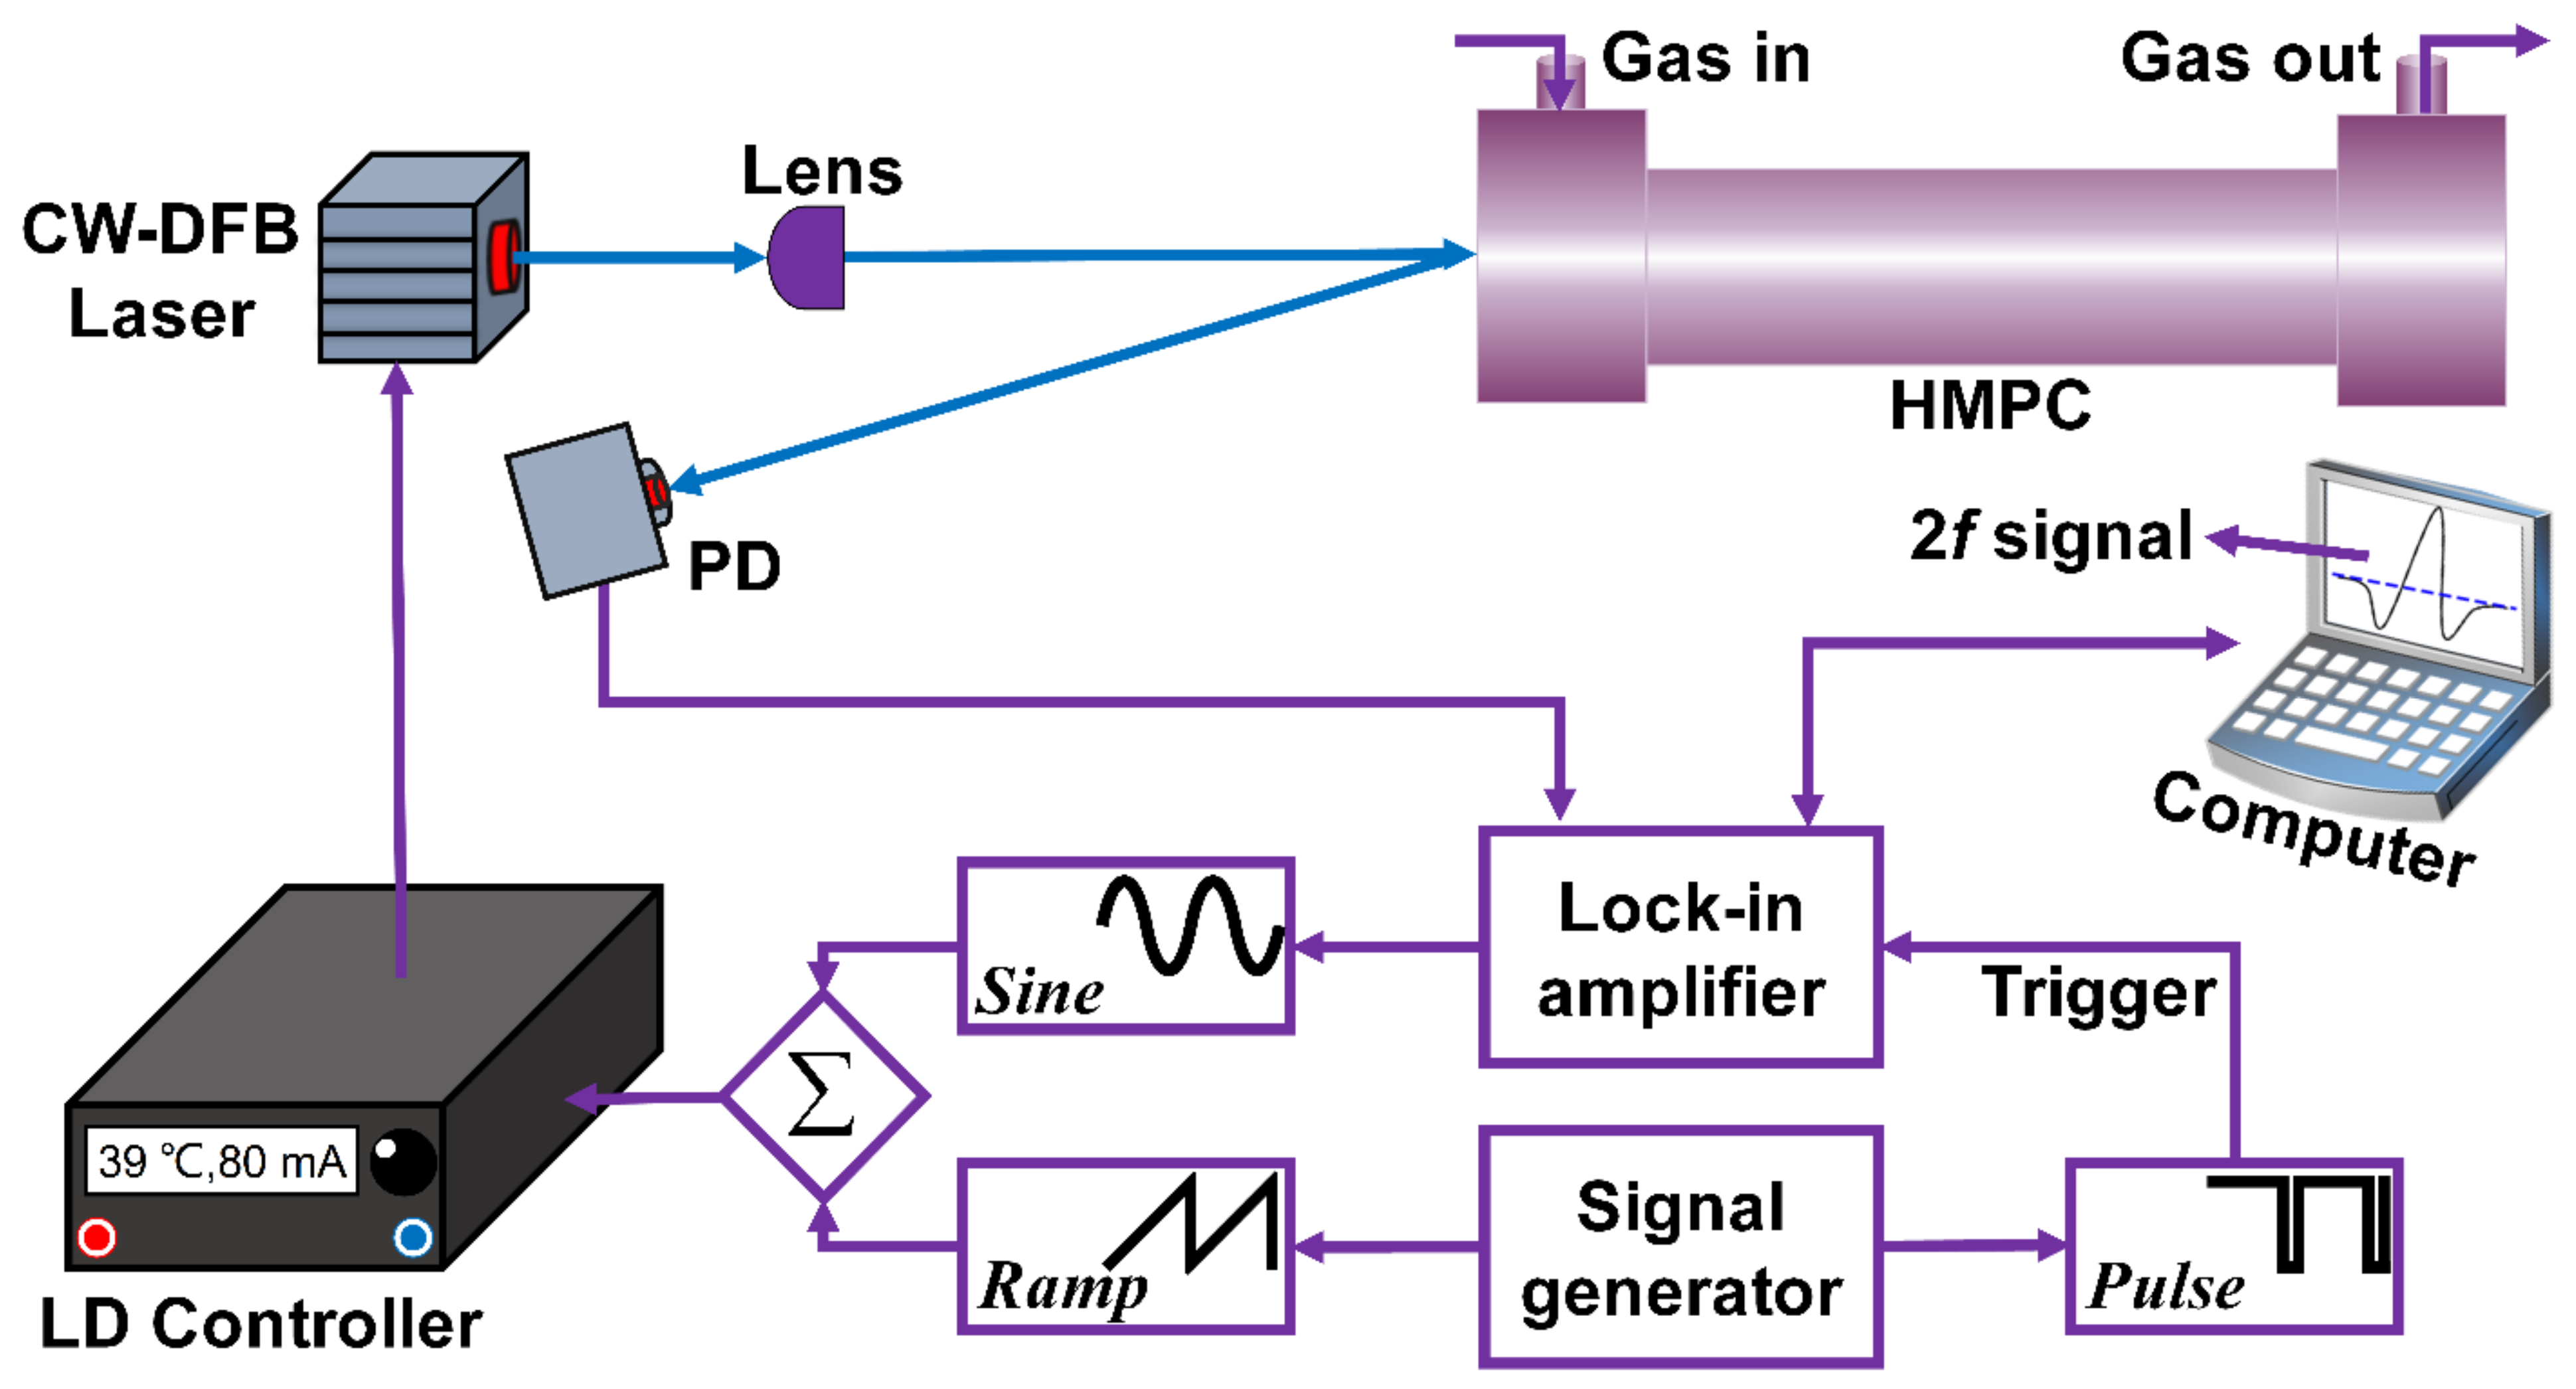
3. Experimental Setup

According to the HITRAN 2020 database [50], all of the absorption lines of H2 are simulated and shown in Figure 1a. Concerning the interference of other gases in the air, the line strength of carbon dioxide (CO2), water vapor (H2O), and H2 located between 4712 cm−1 and 4713.5 cm−1 are depicted in Figure 1b. We observed that the absorption line of H2 located at 4712.90 cm−1 (2121.83 nm) not only had the maximum line strength (3.19 × 1026 cm−1/cm−2 × molec) but also avoided the interference from H2O and had one order of magnitude stronger than the line strength of the adjacent CO2. H2 has narrow line widths due to its simple level structure. Therefore, even if the absorption line of H2 is located close to that of other gases, the detection of H2 by the TDLAS method is less likely to be disturbed. From the above analysis, the absorption line of H2 located at 4712.90 cm−1 was chosen and used in the subsequent studies.
The experimental setup of the H2-TDLAS sensing system, based on the WMS technique and HMPC (model no.: PCI-HC10m; number of passes: 34; optical pathlength: 10.13 m), is shown in Figure 2. The cell volume of the used HMPC was 0.24 L, and the window was a wedge mirror of gallium fluoride (GaF2). First, a CW-DFB diode laser with a typical wavelength of 2121.83 nm (Nanosystems and Technologies GmbH, TO5 cube) was adopted as the excitation light source. A low-frequency sawtooth wave and a high-frequency sine wave were generated by a signal generator and lock-in amplifier (Zurich Instruments), respectively, which were superimposed and then sent into the LD controller (LD2TC5 LAB series combination laser diode and temperature control instrument). The LD controller adjusted the injection current and operating temperature of the laser to modulate the laser emission wavelength. The three parameters of the LD controller, proportion, integration, and differentiation, need to be set to appropriate values. The emission wavelength of the LD controller could match the chosen absorption line of H2 when the injection current and operating temperature of the laser were set to 80 mA and 39 °C, respectively. Under these conditions, the output power of the laser was 10.9 mW. The modulated laser beam was collimated by a convex lens with a 5.95 mm focal length and incident into the HMPC at a specific angle. Viewed from the perspective of facing each mirror, the schematic diagram spot patterns, generated by a correctly oriented input beam on the far and near mirrors of the HMPC, were simulated by mathematical software and are shown in Figure 3. The correctly oriented input laser beam came in between position 0 and position 1, and the corresponding exit laser beam came out between position 33 and position 34. Hence, the correct exit laser beam had the same angle in Y and opposite angles in X as the input laser beam. Finally, the exit light was received and converted into an electrical signal by a PD device (model No. DET10D2, Thorlabs). This electrical signal was demodulated at a particular frequency by the lock-in amplifier when the integration time was 200 ms and the low-pass filter order of the lock-in amplifier was set to 4. Considering that the peak value of the 2f is not only located at the absorption peak but also is the largest among even harmonics, the electrical signal received by the PD device was demodulated to 2f signals using a lock-in amplifier in this experiment. In addition, the signal generator also generated impulse waves to trigger the lock-in amplifier monitoring process, which ensured that the complete second harmonic could be obtained in each pulse period.

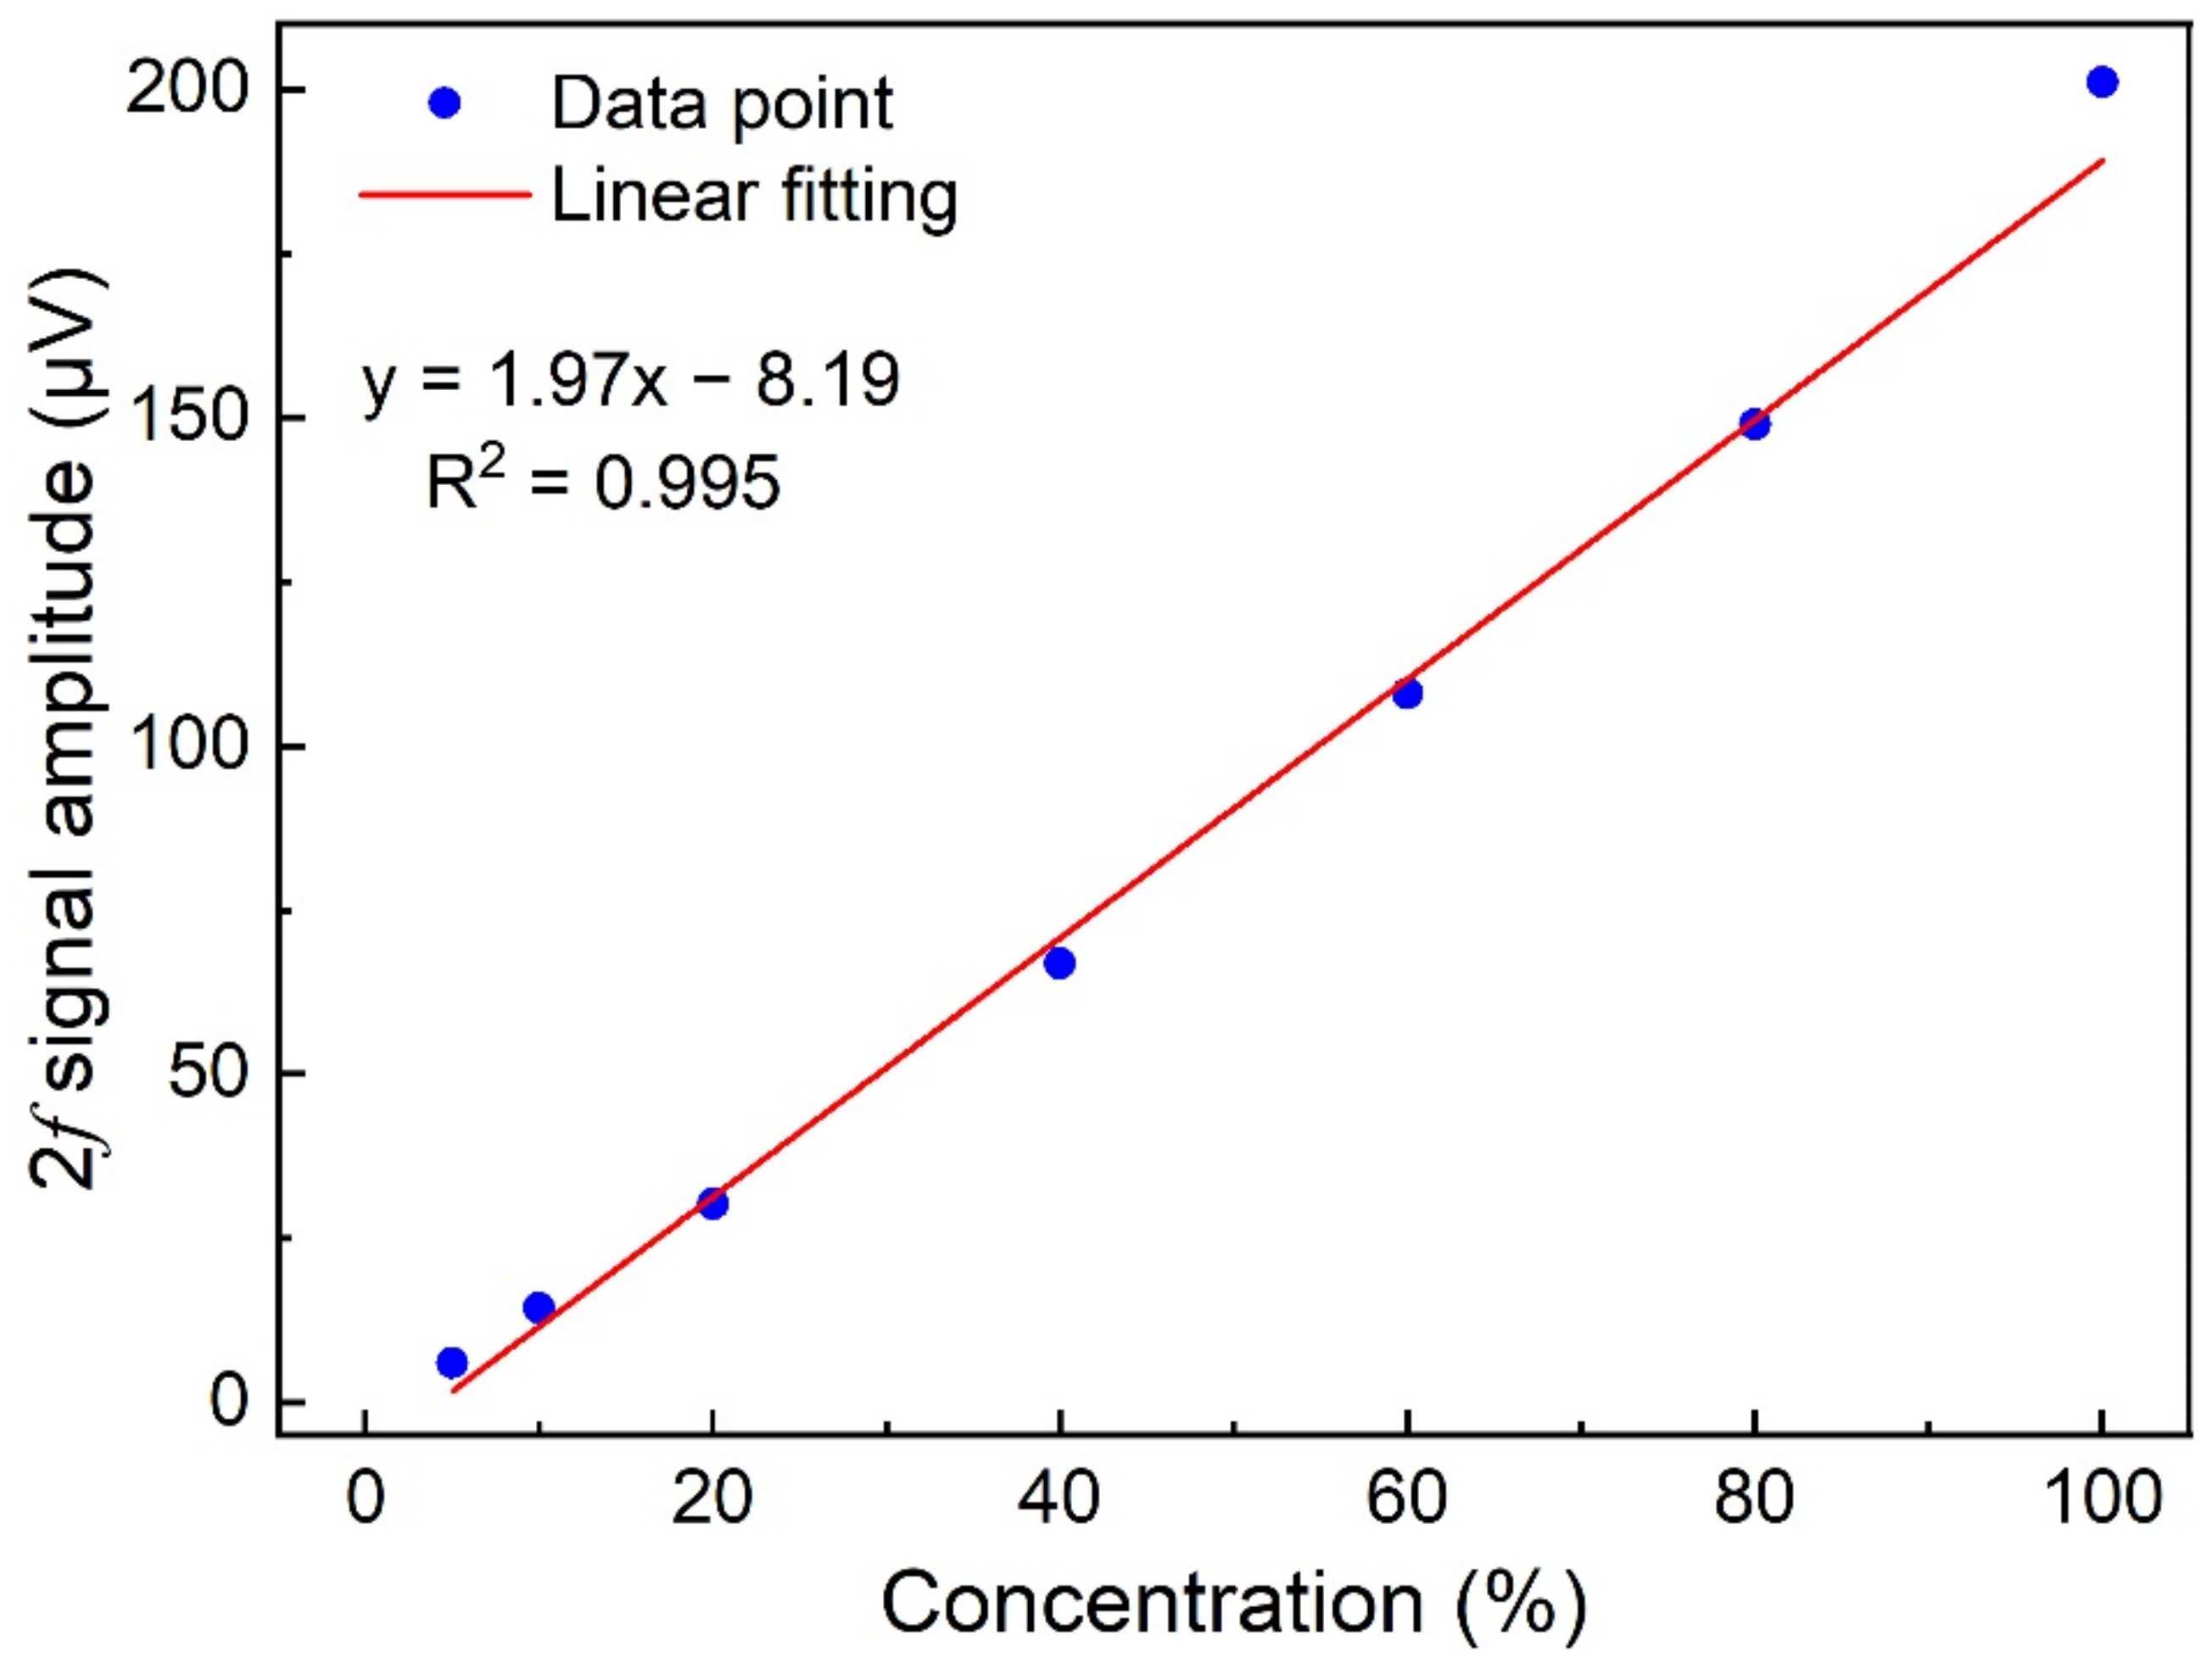
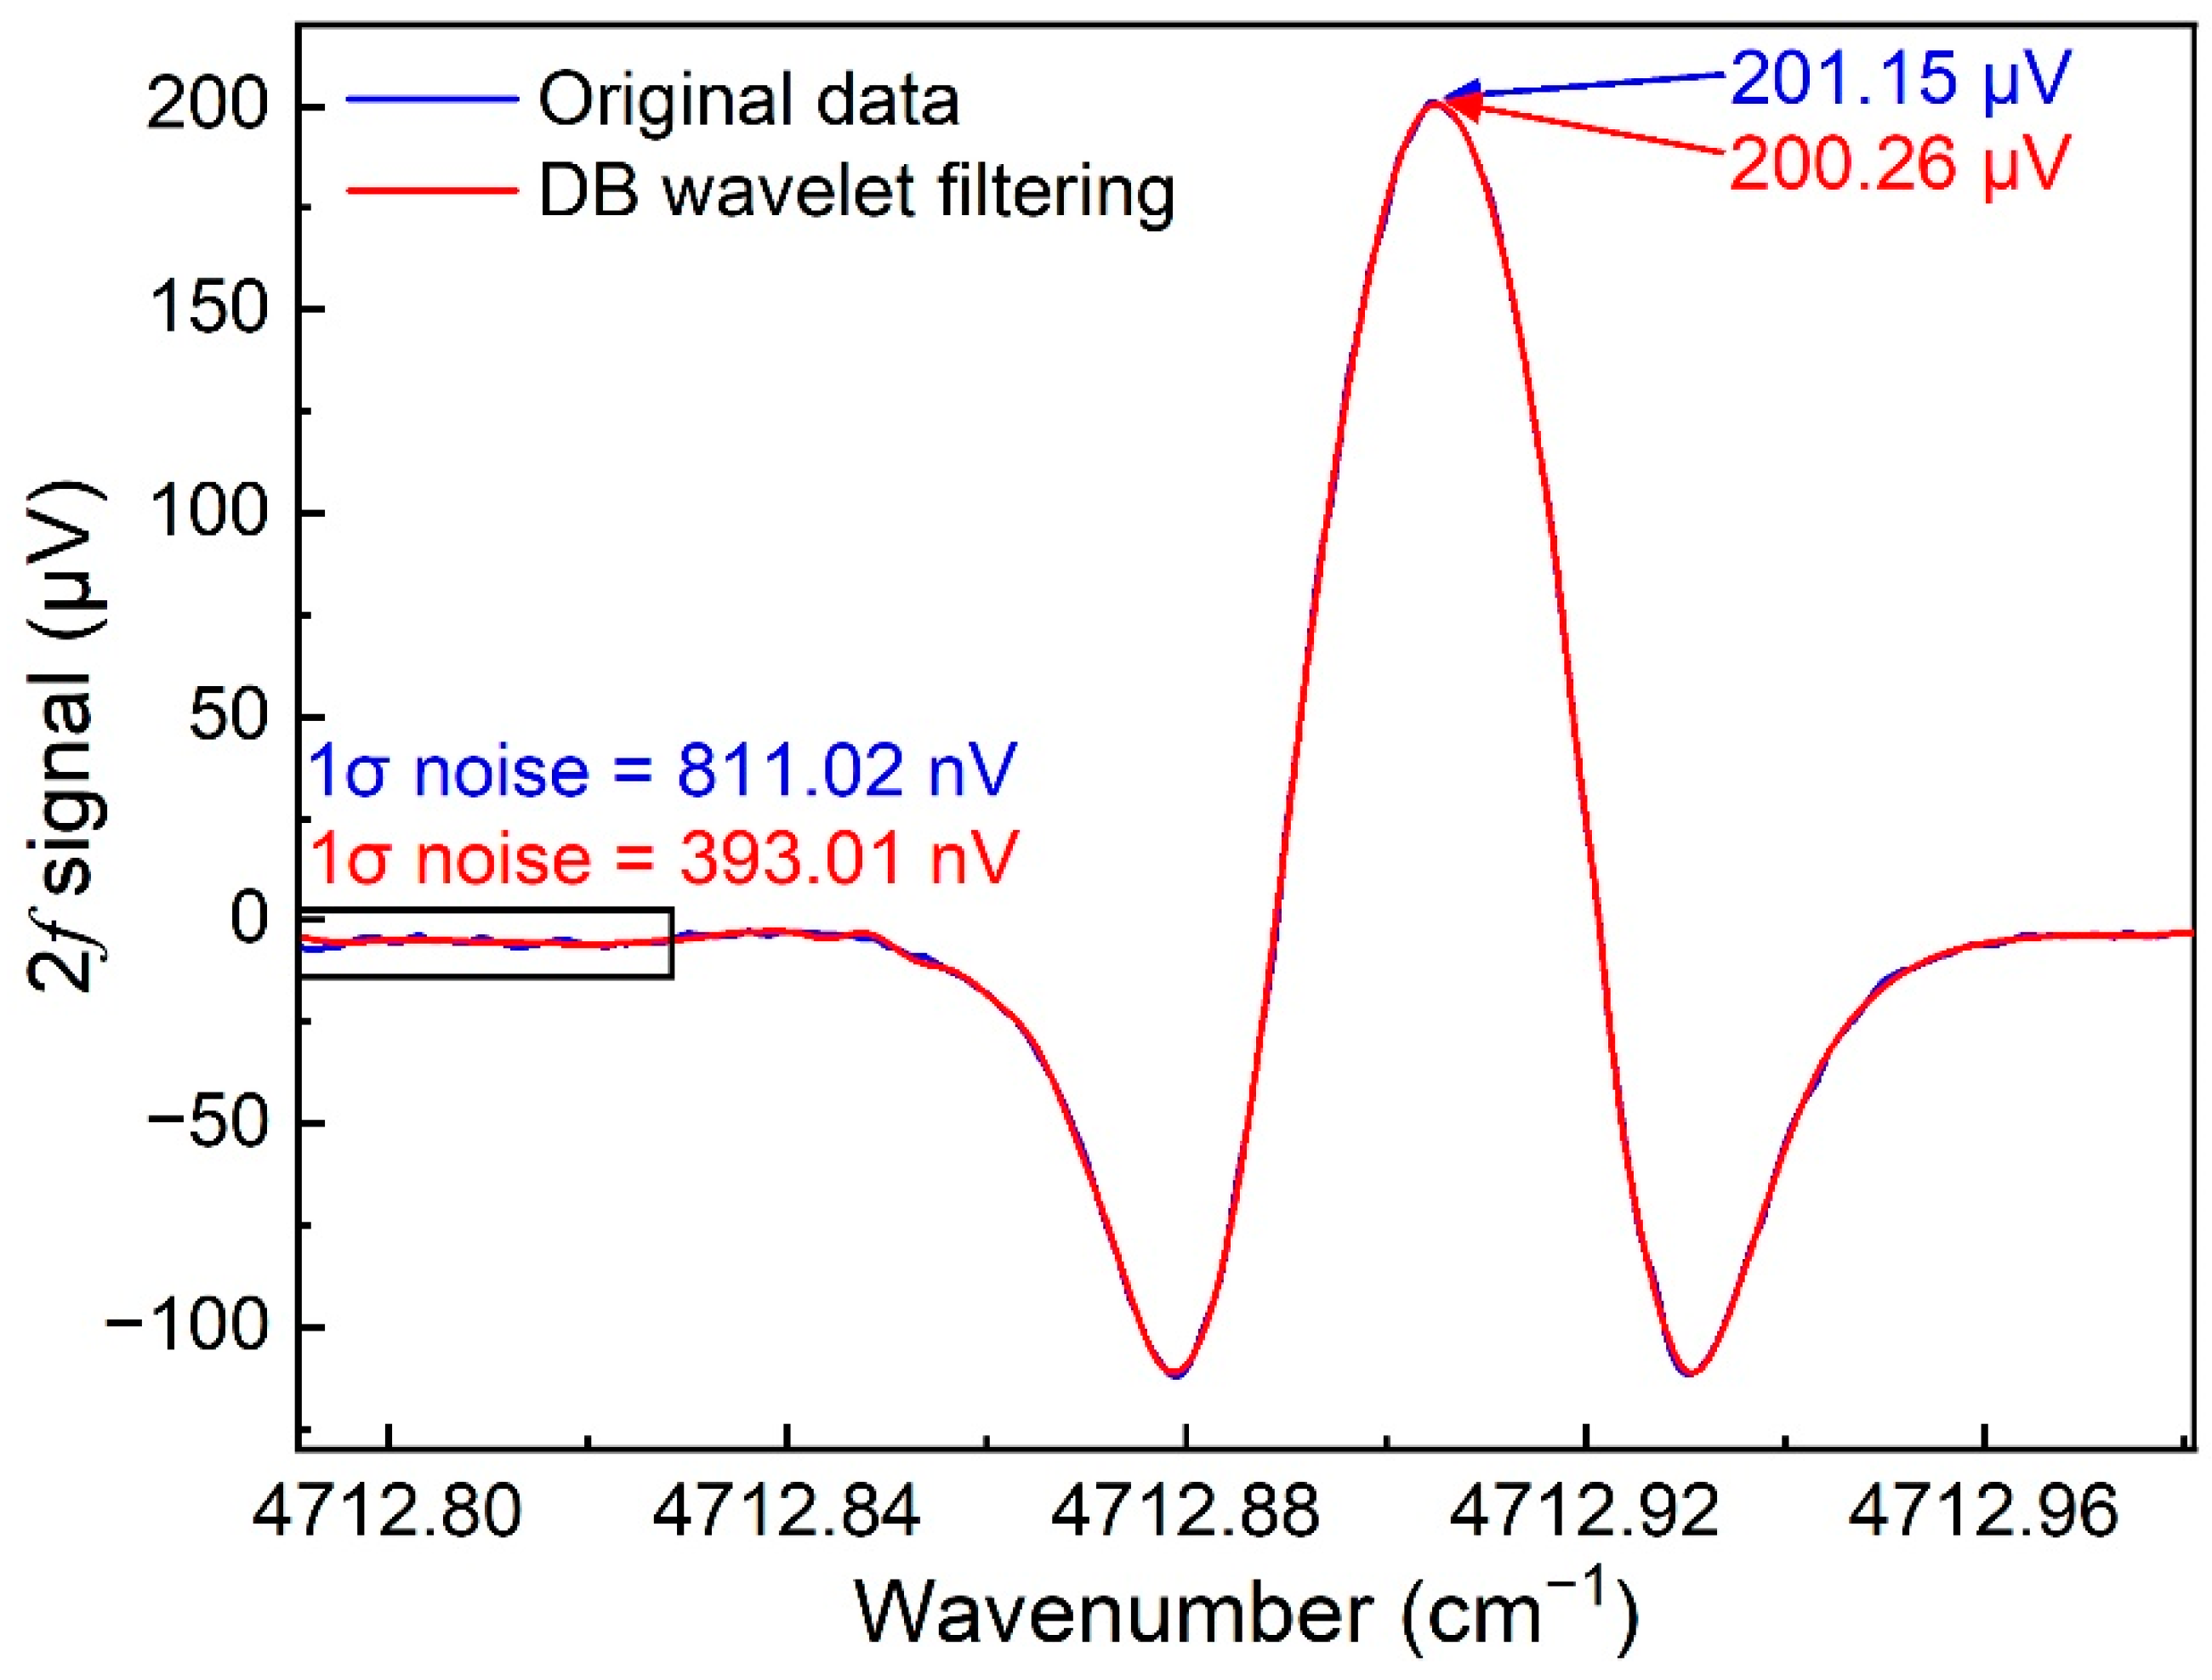
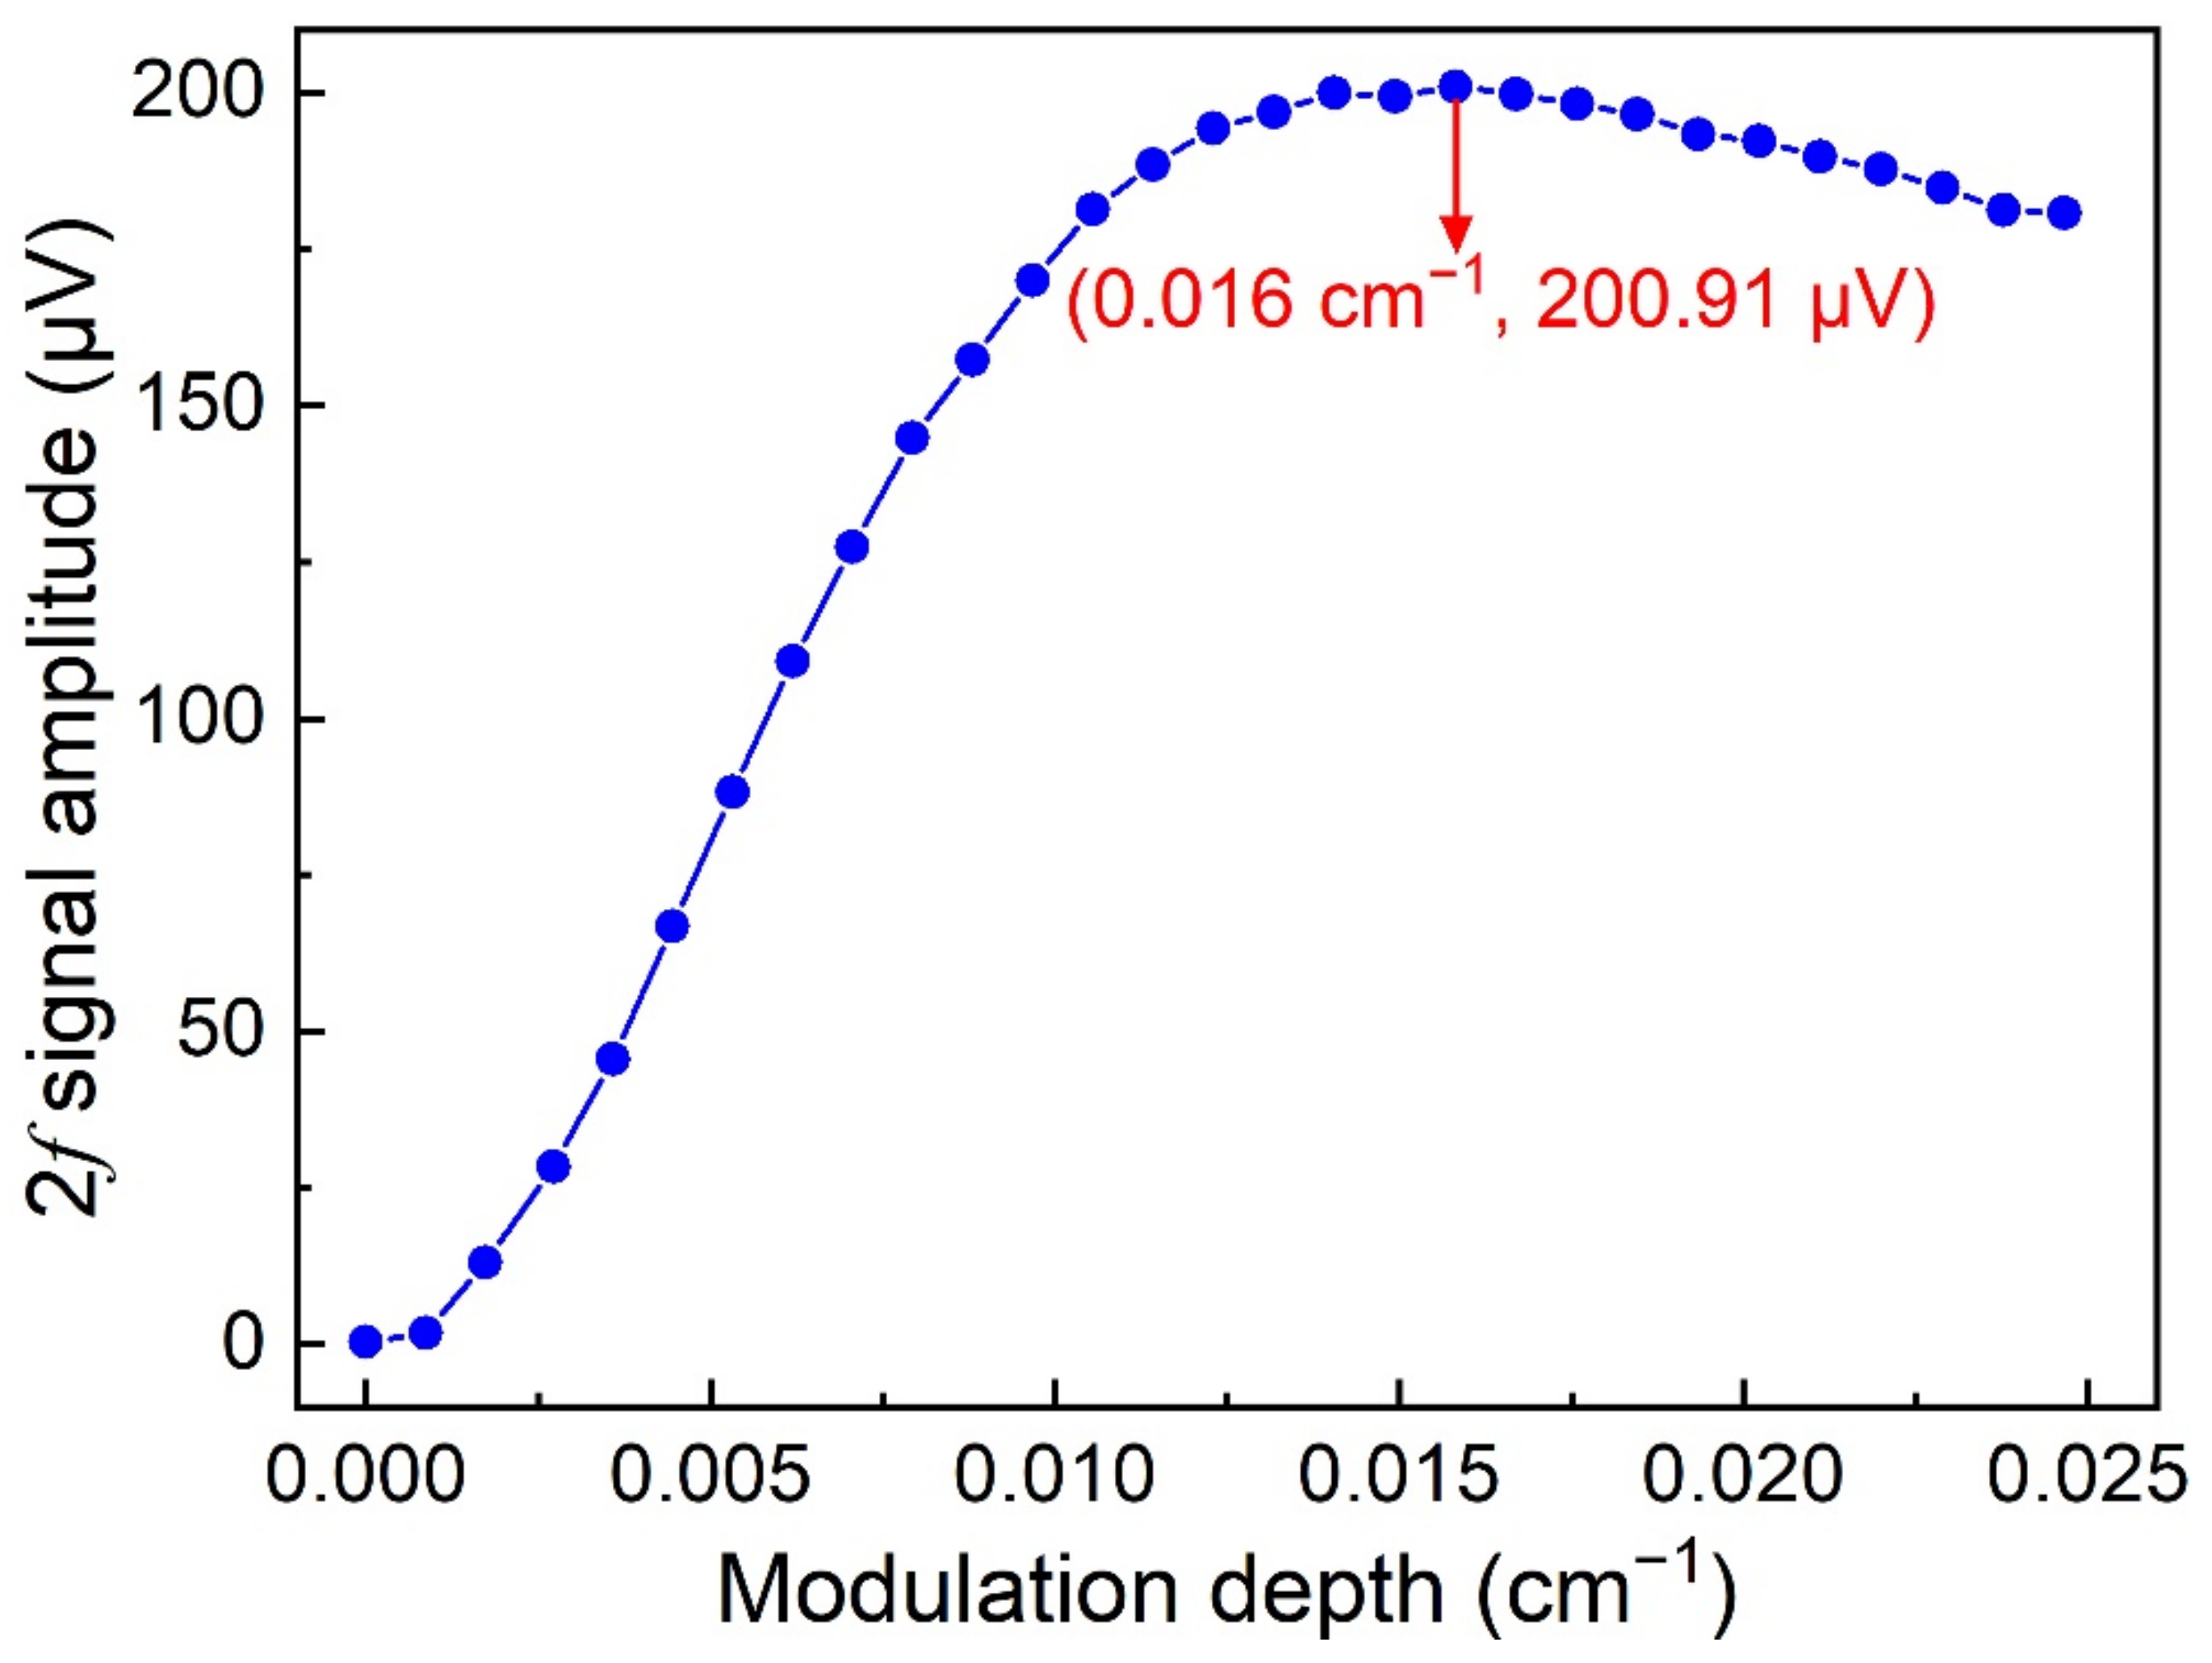
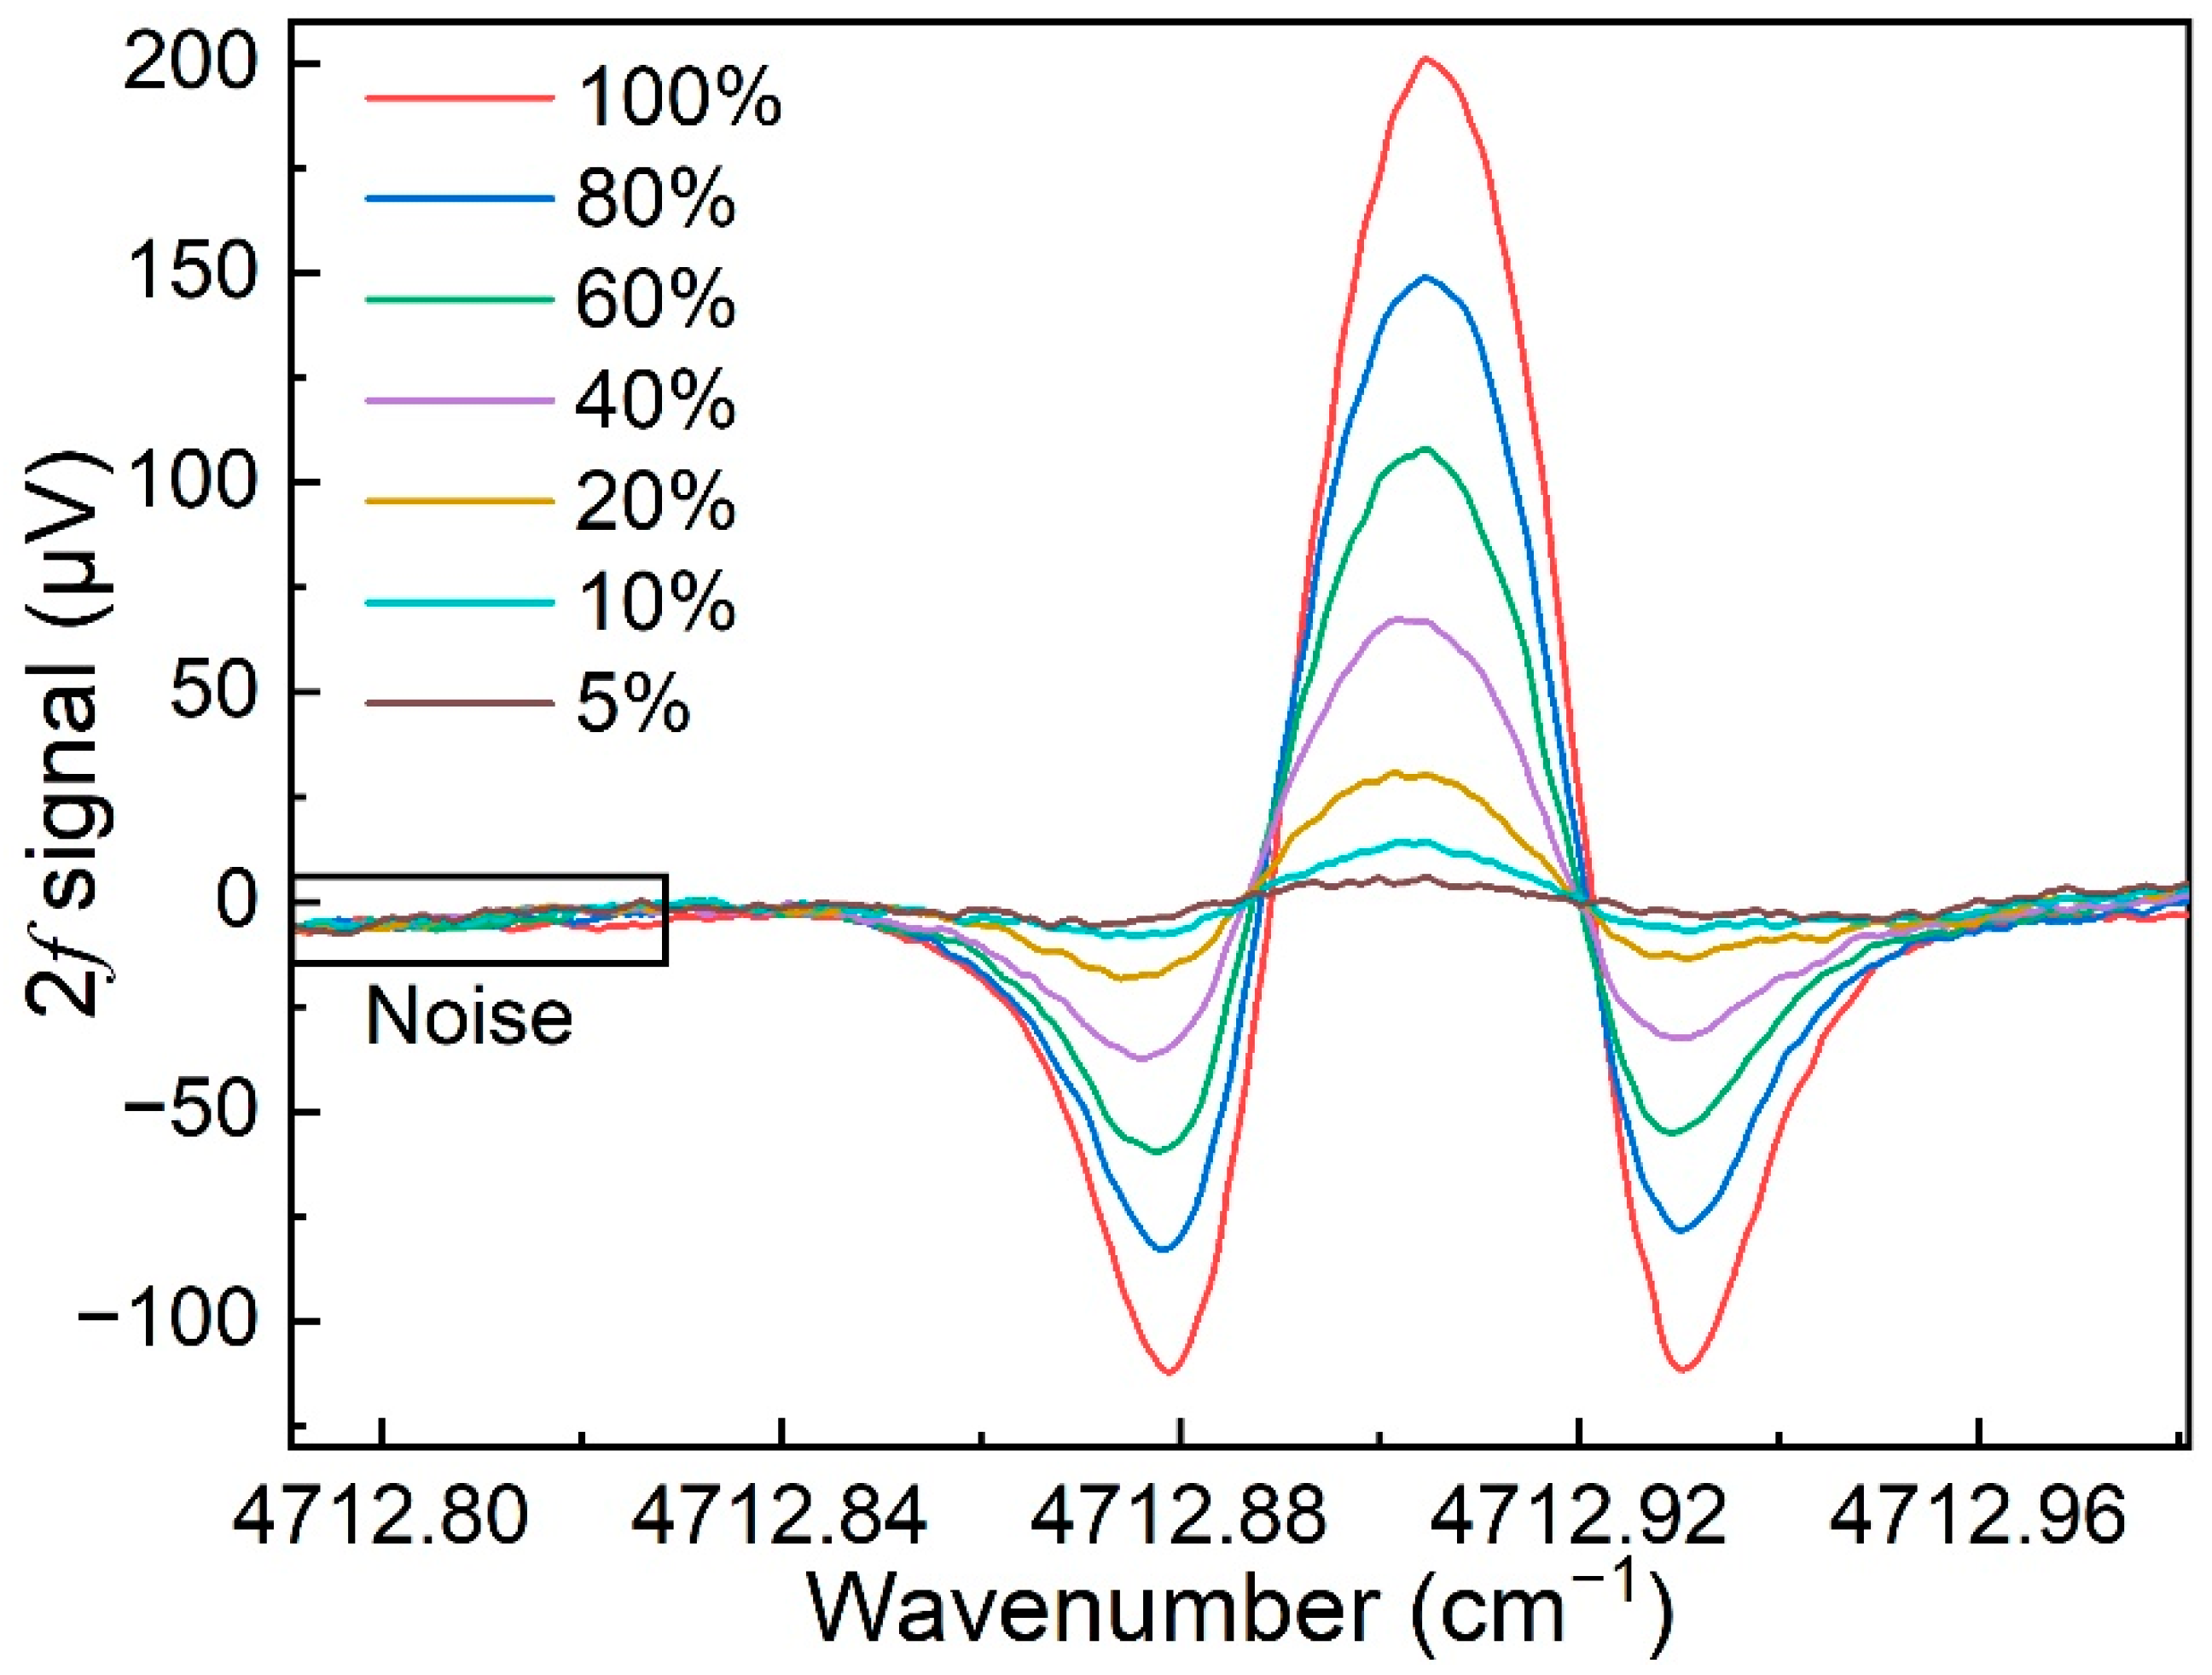
4. Results and Discussion

The intensity of the TDLAS 2f signal is related to the modulation amplitude of the sine wave [45]. Therefore, the relationship between the 2f signal amplitude and the modulation depth was measured when the concentration of H2 was 100%, which is depicted in Figure 4. With the increase in the modulation depth, the 2f signal amplitude increased at the beginning, flattened out, and finally slowly descended. The maximum 2f signal amplitude of 200.91 μV could be obtained when the modulation depth was 0.016 cm−1. This optimum modulation depth was kept for use in the subsequent experiments. In addition, the small value of the optimal modulation depth also proves that H2 has a narrow absorption line width compared to other gases [51,52,53,54,55,56,57].
In order to evaluate the response performance of the WMS-HMPC-based H2-TDLAS sensing system, H2 with a concentration of 100% and pure nitrogen (N2) were sent into the gas dilution system, respectively, and mixed gases with H2 concentrations of 100%, 80%, 60%, 40%, 20%, 10%, and 5% were obtained by controlling the flow rate of two gas flowmeters in the dilution system. The mixed gas was sent into the gas cell at a constant flow rate of 300 mL/min. The 2f signal for the TDLAS sensor with respect to different concentrations of H2 was measured and is shown in Figure 5. The relationship between the 2f signal amplitude and the H2 concentrations is displayed in Figure 6. These data points were linearly fitted by using the equation y = 1.97x − 8.19, and the R-squared value was calculated as 0.995. Additionally, a calculation of 2f signal repeatability at 100% H2 concentration was performed and is shown in Figure 7. In the measurements that were taken 6 times, the mean value was 202.65 μV and the maximum volatility was less than 1.7%, which indicates a good performance in 2f signal’s repeatability in the H2-TDLAS sensing system.
As shown in Figure 5, there was a presence of noise in the measurement of the H2-TDLAS 2f signal. Therefore, the wavelet denoising method was applied to further improve the sensor’s performance. A DB wavelet with 10 vanishing moments was employed for 2f signal denoising by 6 times. The 2f signal, with and without the DB wavelet denoising when H2 concentration was 100%, are shown in Figure 8. The data far from the absorption peak in the 2f signal were considered as the system noise. Compared to the original 2f signal, the 1σ noise deviation with the DB wavelet denoising was reduced by half while the 2f signal amplitude was almost identical. Furthermore, the SNR and minimum detection limit (MDL) improved from 248.02 and 0.40% to 509.55 and 0.20%, respectively.
The H2-TDLAS 2f signal was monitored continuously after filling the GMPC with pure N2 to investigate the optimum detection performance and the system stability of the WMS-HMPC-based H2-TDLAS sensing system. Based on these data, the Allan variance of the WMS-HMPC-based H2-TDLAS sensing system was calculated by the LabView software, and the results are shown in Figure 9. As the integration time increased, the MDL decreased. When the integration time of the system was 36 s, the MDL improved to 522.02 ppm. Finally, the properties of some H2 sensing technologies are listed in Table 1. Compared to these H2 sensors, the H2-TDLAS sensor achieves a better detection performance at a very weak H2 absorption line strength (~1026).

5. Conclusions

As a new form of energy, H2 has clean and green features, and the detection of H2 has been a hot topic in recent years. In this paper, a TDLAS-based H2 sensor is proposed by using a CW-DFB diode laser emission at 2121.83 nm with a TO package. An HMPC with an optical length of 10.13 m was used to increase the absorption strength of H2. The WMS technique and second harmonic detection were employed for the modulation and demodulation of the TDLAS signal, respectively. A strong absorption line in H2, located at 4712.90 cm−1 (2121.83 nm, line strength: 3.19 × 10⁻²⁶ cm−1/cm−2 × molec), was chosen to achieve a high H2-TDLAS signal level. The optimum modulation depth of the WMS-HMPC-based H2-TDLAS sensing system was found to be 0.016 cm−1, which indicated that the line width of the selected H2 absorption line is very narrow, and therefore is not easily susceptible to interference from other gases. The obtained H2-TDLAS 2f signal was further denoised by using the DB wavelet, and the calculated MDL improved from 0.40% to 0.20% after the algorithm was used. The MDL would be expected to further improve if a better denoising method was used. Finally, the Allan variance was calculated. The optimum MDL of 522.02 ppm was obtained when the integration time of the system was increased to 36 s. The detection performance can be further improved when an HMPC with a long optical length is adopted.

Author Contributions

Methodology, validation, and writing—original draft preparation: T.L.; investigation: S.Q.; discussion: X.L.; writing—review and editing and supervision: Y.M. All authors have read and agreed to the published version of the manuscript.

Funding

This research was funded by the National Natural Science Foundation of China (Grant No. 62022032, 61875047, and 61505041), the Natural Science Foundation of Heilongjiang Province of China (Grant No. YQ2019F006), Fundamental Research Funds for the Central Universities, and the Heilongjiang Province Postdoctoral Foundation (Grant No. LBH-Q18052).

Institutional Review Board Statement

Not applicable.

Informed Consent Statement

Not applicable.

Data Availability Statement

The data presented in this study are available on request from the corresponding authors.

Conflicts of Interest

The authors declare no conflict of interest.

References

  1. Penner, S.S. Fossil-fuel resources and CO2 production from combustion. Energy 1991, 16, 1417–1419. [Google Scholar] [CrossRef]
  2. Midilli, A.; Ay, M.; Dincer, I.; Rosen, M.A. On hydrogen and hydrogen energy strategies I: Current status and needs. Renew. Sustain. Energ. Rev. 2005, 9, 255–271. [Google Scholar] [CrossRef]
  3. Mazloomi, K.; Gomes, C. Hydrogen as an energy carrier: Prospects and challenges. Renew. Sustain. Energy Rev. 2012, 16, 3024–3033. [Google Scholar] [CrossRef]
  4. Arora, K.; Puri, N.K. Electrophoretically deposited nanostructured PdO thin film for room temperature amperometric H2 sensing. Vacuum 2018, 154, 302–308. [Google Scholar] [CrossRef]
  5. Bin Taher, M.I.; Halfaya, Y.; Alrammouz, R.; Lazerges, M.; Randi, A.; Moudakir, T.; Sama, N.Y.; Guermont, T.; Pelissier, N.; Pichler, T.; et al. High electron mobility transistor-based hydrogen sensor using ITO as a sensing layer. In Proceedings of the 20th IEEE Sensors Conference, Electr Network, Sydney, Australia, 31 October–4 November 2021. [Google Scholar]
  6. Yi, J.X.; Zhang, H.; Zhang, Z.B.; Chen, D.D. Hierarchical porous hollow SnO2 nanofiber sensing electrode for high performance potentiometric H2 sensor. Sens. Actuator B-Chem. 2018, 268, 456–464. [Google Scholar] [CrossRef]
  7. Yang, F.; Kung, S.C.; Cheng, M.; Hemminger, J.C.; Penner, R.M. Smaller is faster and more sensitive: The effect of wire size on the detection of hydrogen by single palladium nanowires. ACS Nano 2010, 4, 5233–5244. [Google Scholar] [CrossRef]
  8. Hassan, K.; Chung, G.S. Catalytically activated quantum-size Pt/Pd bimetallic core-shell nanoparticles decorated on ZnO nanorod clusters for accelerated hydrogen gas detection. Sens. Actuator B-Chem. 2017, 239, 824–833. [Google Scholar] [CrossRef]
  9. Hashtroudi, H.; Yu, A.M.; Juodkazis, S.; Shafiei, M. Ultra-sensitive photo-induced hydrogen gas sensor based on two-dimensional CeO2-Pd-PDA/rGO heterojunction nanocomposite. Nanomaterials 2022, 12, 1628. [Google Scholar] [CrossRef]
  10. Li, Z.J.; Yan, S.N.; Wu, Z.L.; Li, H.; Wang, J.Q.; Shen, W.Z.; Wang, Z.G.; Fu, Y.Q. Hydrogen gas sensor based on mesoporous In2O3 with fast response/recovery and ppb level detection limit. Int. J. Hydrogen Energy 2018, 43, 22746–22755. [Google Scholar] [CrossRef]
  11. Hossain, M.K.; Drmosh, Q.A. Noble metal-decorated nanostructured Zinc Oxide: Strategies to advance chemiresistive hydrogen gas sensing. Chem. Rec. 2022, 22, e202200090. [Google Scholar]
  12. Yoo, S.M.; Sharma, B.; Kim, J.S. Boron nitride nanotubes (BNNTs) decorated Pd-ternary alloy (Pd63·2Ni34·3CO2.5) for H2 sensing. Int. J. Hydrogen Energy 2021, 46, 12263–12270. [Google Scholar] [CrossRef]
  13. Lin, K.W.; Chen, H.I.; Chuang, H.M.; Chen, C.Y.; Lu, C.T.; Cheng, C.C.; Liu, W.C. Characteristics of Pd/InGaP Schottky diodes hydrogen sensors. IEEE Sens. J. 2004, 4, 72–79. [Google Scholar] [CrossRef]
  14. Al-Ahmadi, N.A. Metal oxide semiconductor-based Schottky diodes: A review of recent advances. Mater. Res. Express 2020, 7, 032001. [Google Scholar] [CrossRef]
  15. Chauhan, P.S.; Bhattacharya, S. Hydrogen gas sensing methods, materials, and approach to achieve parts per billion level detection: A review. Int. J. Hydrogen Energy 2019, 44, 26076–26099. [Google Scholar] [CrossRef]
  16. Boudjiet, M.T.; Bertrand, J.; Pellet, C.; Dufour, I. New characterization methods for monitoring small resonant frequency variation: Experimental tests in the case of hydrogen detection with uncoated silicon microcantilever-based sensors. Sens. Actuator B-Chem. 2014, 199, 269–276. [Google Scholar] [CrossRef]
  17. Zhou, L.J.; Kato, F.; Nakamura, N.; Oshikane, Y.; Nagakubo, A.; Ogi, H. MEMS hydrogen gas sensor with wireless quartz crystal resonator. Sens. Actuator B-Chem. 2021, 334, 129651. [Google Scholar] [CrossRef]
  18. Sil, D.; Hines, J.; Udeoyo, U.; Borguet, E. Palladium nanoparticle-based surface acoustic wave hydrogen sensor. ACS Appl. Mater. Interfaces 2015, 7, 5709–5714. [Google Scholar] [CrossRef]
  19. Wan, J.K.S.; Ioffe, M.S.; Depew, M.C. A novel acoustic sensing system for on-line hydrogen measurements. Sens. Actuator B-Chem. 1996, 32, 233–237. [Google Scholar] [CrossRef]
  20. Liao, C.R.; Xiong, C.; Zhao, J.L.; Zou, M.Q.; Zhao, Y.Y.; Li, B.Z.; Ji, P.; Cai, Z.H.; Gan, Z.S.; Wang, Y.; et al. Design and realization of 3D printed fiber-tip microcantilever probes applied to hydrogen sensing. Light Sci. Appl. 2022, 3, 1–11. [Google Scholar] [CrossRef]
  21. Cai, S.S.; Gonzalez-Vila, A.; Zhang, X.J.; Guo, T.; Caucheteur, C. Palladium-coated plasmonic optical fiber gratings for hydrogen detection. Opt. Lett. 2019, 44, 4483–4486. [Google Scholar] [CrossRef]
  22. Ma, Y.F.; Lewicki, R.; Razeghi, M.; Tittel, F.K. QEPAS based ppb-level detection of CO and N2O using a high power CW DFB-QCL. Opt. Express 2013, 21, 1008–1019. [Google Scholar] [CrossRef]
  23. Zifarelli, A.; De Palo, R.; Patimisco, P.; Giglio, M.; Sampaolo, A.; Blaser, S.; Butet, J.; Landry, O.; Müller, A.; Spagnolo, V. Multi-gas quartz-enhanced photoacoustic sensor for environmental monitoring exploiting a Vernier effect-based quantum cascade laser. Photoacoustics 2022, 28, 100401. [Google Scholar] [CrossRef]
  24. Dello Russo, S.; Zifarelli, A.; Patimisco, P.; Sampaolo, A.; Wei, T.T.; Wu, H.P.; Dong, L.; Spagnolo, V. Light-induced thermo-elastic effect in quartz tuning forks exploited as a photodetector in gas absorption spectroscopy. Opt. Express 2020, 28, 19074–19084. [Google Scholar] [CrossRef] [PubMed]
  25. He, Y.; Ma, Y.F.; Tong, Y.; Yu, X.; Tittel, F.K. Ultra-high sensitive light-induced thermoelastic spectroscopy sensor with a high Q-factor quartz tuning fork and a multipass cell. Opt. Lett. 2019, 44, 1904–1907. [Google Scholar] [CrossRef]
  26. Ma, Y.F.; He, Y.; Zhang, L.G.; Yu, X.; Zhang, J.B.; Sun, R.; Tittel, F.K. Ultra-high sensitive acetylene detection using quartz-enhanced photoacoustic spectroscopy with a fiber amplified diode laser and a 30.72 kHz quartz tuning fork. Appl. Phys. Lett. 2017, 110, 31107. [Google Scholar] [CrossRef]
  27. Ma, Y.F.; He, Y.; Patimisco, P.; Sampaolo, A.; Qiao, S.D.; Yu, X.; Tittel, F.K.; Spagnolo, V. Ultra-high sensitive trace gas detection based on light-induced thermoelastic spectroscopy and a custom quartz tuning fork. Appl. Phys. Lett. 2020, 116, 11103. [Google Scholar] [CrossRef]
  28. Wang, Z.; Wang, Q.; Zhang, H.; Borri, S.; Galli, I.; Sampaolo, A.; Patimisco, P.; Spagnolo, V.L.; De Natale, P.; Ren, W. Doubly resonant sub-ppt photoacoustic gas detection with eight decades dynamic range. Photoacoustics 2022, 27, 100387. [Google Scholar] [CrossRef]
  29. He, Y.; Ma, Y.F.; Tong, Y.; Yu, X.; Peng, Z.F.; Gao, J.; Tittel, F.K. Long distance, distributed gas sensing based on micro-nano fiber evanescent wave quartz-enhanced photoacoustic spectroscopy. Appl. Phys. Lett. 2017, 111, 241102. [Google Scholar] [CrossRef]
  30. Sgobba, F.; Sampaolo, A.; Patimisco, P.; Giglio, M.; Menduni, G.; Ranieri, A.C.; Hoelzl, C.; Rossmadl, H.; Brehm, C.; Mackowiak, V.; et al. Compact and portable quartz-enhanced photoacoustic spectroscopy sensor for carbon monoxide environmental monitoring in urban areas. Photoacoustics 2022, 25, 100318. [Google Scholar] [CrossRef] [PubMed]
  31. Lang, Z.T.; Qiao, S.D.; He, Y.; Ma, Y.F. Quartz tuning fork-based demodulation of an acoustic signal induced by photo-thermo-elastic energy conversion. Photoacoustics 2021, 22, 100272. [Google Scholar] [CrossRef]
  32. Qiao, S.D.; Sampaolo, A.; Patimisco, P.; Spagnolo, V.; Ma, Y.F. Ultra-highly sensitive HCl-LITES sensor based on a low-frequency quartz tuning fork and a fiber-coupled multi-pass cell. Photoacoustics 2022, 27, 100381. [Google Scholar] [CrossRef]
  33. Qiao, S.D.; He, Y.; Ma, Y.F. Trace gas sensing based on single-quartz-enhanced photoacoustic-photothermal dual spectroscopy. Opt. Lett. 2021, 46, 2449–2452. [Google Scholar] [CrossRef]
  34. Ma, Y.F.; Hu, Y.Q.; Qiao, S.D.; He, Y.; Tittel, F.K. Trace gas sensing based on multi-quartz-enhanced photothermal spectroscopy. Photoacoustics 2020, 20, 100206. [Google Scholar] [CrossRef]
  35. Hu, L.E.; Zheng, C.T.; Zhang, M.H.; Zheng, K.Y.; Zheng, J.; Song, Z.W.; Li, X.Y.; Zhang, Y.; Wang, Y.D.; Tittel, F.K. Long-distance in-situ methane detection using near-infrared light-induced thermo-elastic spectroscopy. Photoacoustics 2021, 21, 100230. [Google Scholar] [CrossRef] [PubMed]
  36. Zhang, Q.D.; Chang, J.; Cong, Z.H.; Wang, Z.L. Application of quartz tuning fork in photodetector based on photothermal effect. IEEE Photonics Technol. Lett. 2019, 31, 1592–1595. [Google Scholar] [CrossRef]
  37. Ma, Y.F.; Hu, Y.Q.; Qiao, S.D.; Lang, Z.T.; Liu, X.N.; He, Y.; Spagnolo, V. Quartz tuning forks resonance frequency matching for laser spectroscopy sensing. Photoacoustics 2022, 25, 100329. [Google Scholar] [CrossRef]
  38. Craig, I.M.; Taubman, M.S.; Bernacki, B.E.; Stahl, R.D.; Schiffern, J.T.; Myers, T.L.; Cannon, B.D.; Phillips, M.C. Tunable Diode Laser Absorption Spectrometer for detection of hydrogen fluoride gas at ambient pressure. In Proceedings of the Conference on Lasers and Electro-Optics (CLEO), San Jose, CA, USA, 8–13 June 2014. [Google Scholar]
  39. Dong, L.; Tittel, F.K.; Li, C.G.; Sanchez, N.P.; Wu, H.P.; Zheng, C.T.; Yu, Y.J.; Sampaolo, A.; Griffin, R.J. Compact TDLAS based sensor design using interband cascade lasers for mid-IR trace gas sensing. Opt. Express 2016, 24, A528–A535. [Google Scholar] [CrossRef] [PubMed]
  40. Zhou, X.; Yu, J.; Wang, L.; Gao, Q.; Zhang, Z.G. Sensitive detection of oxygen using a diffused integrating cavity as a gas absorption cell. Sens. Actuator B-Chem. 2017, 241, 1076–1081. [Google Scholar] [CrossRef]
  41. Avetisov, V.; Bjoroey, O.; Wang, J.; Geiser, P.; Paulsen, K.G. Hydrogen sensor based on tunable diode laser absorption spectroscopy. Sensors 2019, 19, 5313. [Google Scholar] [CrossRef] [PubMed]
  42. Werle, P. A review of recent advances in semiconductor laser based gas monitors. Spectroc. Acta Pt. A-Mol. Biomol. Spectr. 1998, 54, 197–236. [Google Scholar] [CrossRef]
  43. Li, C.L.; Guo, X.Q.; Ji, W.H.; Wei, J.L.; Qiu, X.B.; Ma, W.G. Etalon fringe removal of tunable diode laser multi-pass spectroscopy by wavelet transforms. Opt. Quantum Electron. 2018, 50, 275. [Google Scholar] [CrossRef]
  44. Thomazy, D.; So, S.; Kosterev, A.; Lewicki, R.; Dong, L.; Sani, A.A.; Tittel, F.K. Low-power laser-based carbon monoxide sensor for fire and post-fire detection using a compact Herriott multipass cell. In Proceedings of the Conference on Quantum Sensing and Nanophotonic Devices VII, San Jose, CA, USA, 24–28 January 2010. [Google Scholar]
  45. Guo, Y.C.; Qiu, X.B.; Li, N.; Feng, S.L.; Cheng, T.; Liu, Q.Q.; He, Q.S.; Kan, R.F.; Yang, H.N.; Li, C.L. A portable laser-based sensor for detecting H2S in domestic natural gas. Infrared Phys. Technol. 2020, 105, 103153. [Google Scholar] [CrossRef]
  46. Krzempek, K.; Lewicki, R.; Nähle, L.; Fischer, M.; Koeth, J.; Belahsene, S.; Rouillard, Y.; Worschech, L.; Tittel, F.K. Continuous wave, distributed feedback diode laser based sensor for trace-gas detection of ethane. Appl. Phys. B-Lasers Opt. 2012, 106, 251–255. [Google Scholar] [CrossRef]
  47. Shao, L.G.; Fang, B.; Zheng, F.; Qiu, X.B.; He, Q.S.; Wei, J.L.; Li, C.L.; Zhao, W.X. Simultaneous detection of atmospheric CO and CH4 based on TDLAS using a single 2.3 μm DFB laser. Spectroc. Acta Pt. A-Mol. Biomol. Spectr. 2019, 222, 117118. [Google Scholar] [CrossRef]
  48. Lin, S.; Chang, J.; Sun, J.C.; Xu, P. Improvement of the detection sensitivity for Tunable Diode Laser Absorption Spectroscopy: A Review. Front. Phys. 2022, 10, 853966. [Google Scholar] [CrossRef]
  49. Werle, P.; Mücke, R.; Slemr, F. The limits of signal averaging in atmospheric trace-gas monitoring by tunable diode-laser absorption spectroscopy (TDLAS). Appl. Phys. B 1993, 57, 131–139. [Google Scholar] [CrossRef]
  50. Gordon, I.E.; Rothman, L.S.; Hargreaves, R.J.; Hashemi, R.; Karlovets, E.V.; Skinner, F.M.; Conway, E.K.; Hill, C.; Kochanov, R.V.; Tan, Y.; et al. The HITRAN2020 molecular spectroscopic database. J. Quant. Spectrosc. Radiat. Transf. 2022, 277, 107949. [Google Scholar] [CrossRef]
  51. Ma, Y.F.; He, Y.; Yu, X.; Chen, C.; Sun, R.; Tittel, F.K. HCl ppb-level detection based on QEPAS sensor using a low resonance frequency quartz tuning fork. Sens. Actuators B 2016, 233, 388–393. [Google Scholar] [CrossRef]
  52. Ma, Y.F.; Feng, W.; Qiao, S.D.; Zhao, Z.X.; Gao, S.F.; Wang, Y.Y. Hollow-core anti-resonant fiber based light-induced thermoelastic spectroscopy for gas sensing. Opt. Express 2022, 30, 18836–18844. [Google Scholar] [CrossRef]
  53. Ma, Y.F.; He, Y.; Tong, Y.; Yu, X.; Tittel, F.K. Quartz-tuning-fork enhanced photothermal spectroscopy for ultra-high sensitive trace gas detection. Opt. Express 2018, 26, 32103–32110. [Google Scholar] [CrossRef]
  54. Zhang, Z.H.; Zhang, F.B.; Xu, B.; Xie, H.Q.; Fu, B.T.; Lu, X.; Zhang, N.; Yu, S.P.; Yao, J.P.; Cheng, Y.; et al. High-sensitivity gas detection with air-lasing-assisted coherent Raman spectroscopy. Ultrafast Sci. 2022, 2022, 9761458. [Google Scholar] [CrossRef]
  55. E, Y.W.; Zhang, L.L.; Tcypkin, A.; Kozlov, S.; Zhang, C.L.; Zhang, X.C. Broadband THz sources from gases to liquids. Ultrafast Sci. 2021, 2021, 9892763. [Google Scholar] [CrossRef]
  56. Guo, Z.N.; Ge, P.P.; Fang, Y.Q.; Dou, Y.K.; Yu, X.Y.; Wang, J.G.; Gong, Q.H.; Liu, Y.Q. Probing molecular frame wigner time delay and electron wavepacket phase structure of CO molecule. Ultrafast Sci. 2022, 2022, 9802917. [Google Scholar] [CrossRef]
  57. Fu, Y.; Cao, J.C.; Yamanouchi, K.; Xu, H.L. Air-laser-based standoff coherent Raman spectrometer. Ultrafast Sci. 2022, 2022, 9867028. [Google Scholar] [CrossRef]
Figure 1. Simulations of line strength based on the HITRAN 2020 database. (a) All absorption lines of H2. (b) The absorption lines of H2, CO2, and H2O between the spectral range of 4712.0 cm−1 and 4713.5 cm−1.
Chemosensors 10 00321 g001
Figure 2. A schematic diagram of the H2-TDLAS sensing system.
Chemosensors 10 00321 g002
Figure 3. A schematic diagram of the spot patterns on the far and near mirrors of the HMPC with a correctly oriented input beam, from the perspective of directly facing each mirror.
Chemosensors 10 00321 g003
Figure 4. The relationship between the 2f signal amplitude and the modulation depth when H2 concentration was 100% for the H2-TDLAS sensing system.
Chemosensors 10 00321 g004
Figure 5. The 2f signal for the TDLAS sensor with respect to different concentrations of H2 in the H2-TDLAS sensing system.
Chemosensors 10 00321 g005
Figure 6. The linear fitting between the 2f signal amplitude and H2 concentration for the H2-TDLAS sensing system.
Chemosensors 10 00321 g006
Figure 7. The 2f signal repeatability at 100% H2 concentration for the H2-TDLAS sensing system.
Chemosensors 10 00321 g007
Figure 8. H2-TDLAS 2f signal comparison with and without the DB wavelet denoising when H2 concentration is 100%.
Chemosensors 10 00321 g008
Figure 9. Allan variance analysis for the WMS-HMPC-based H2-TDLAS sensing system.
Chemosensors 10 00321 g009
Table 1. The properties of some H2 sensing technologies.
Detection MethodMDLRef.
AlGaN/GaN High-electron-mobility Transistors <1%[5]
Fiber-tip Microcantilever Probes<1.5%[20]
Surface Acoustic Wave <0.16%[21]
TDLAS~0.05%Current study
Publisher’s Note: MDPI stays neutral with regard to jurisdictional claims in published maps and institutional affiliations.

