Article

Recovery of Citric Acid from Citrus Peels: Ultrasound-Assisted Extraction Optimized by Response Surface Methodology

by
Filipa A. Fernandes
1,2,
Sandrina A. Heleno
1,*,
José Pinela
1,*,
Márcio Carocho
1,
Miguel A. Prieto
2,*,
Isabel C. F. R. Ferreira
1 and
Lillian Barros
1
1
Centro de Investigação de Montanha (CIMO), Instituto Politécnico de Bragança, Campus de Santa Apolónia, 5300-253 Bragança, Portugal
2
Nutrition and Bromatology Group, Department of Analytical Chemistry and Food Science, Faculty of Science, Universidad de Vigo, E-32004 Ourense, Spain
*
Authors to whom correspondence should be addressed.
Chemosensors 2022, 10(7), 257; https://doi.org/10.3390/chemosensors10070257
Submission received: 9 May 2022 / Revised: 27 June 2022 / Accepted: 27 June 2022 / Published: 1 July 2022

Abstract

:
The production of citrus juice generates a large quantity of by-products, which are often discarded or used for animal feed. However, several studies have shown its richness in valuable compounds, namely organic acids. Thus, this work intended to valorize orange and lime peels as renewable sources of citric acid. An experimental design combining five levels of the independent variables time (2–45 min), ultrasonic power (50–500 W), and ethanol proportion (0–100%) was implemented and response surface methodology (RSM) was applied to optimize the extraction process. The UPLC-PDA analysis showed that orange peel presented a higher citric acid content than lime. For lime and orange peels, the extraction yield was maximized by sonicating at low power for 5.8 or 35.5 min, using a low ethanol proportion or only water as a solvent, respectively. Overall, optimal UAE conditions were defined for the sustainable extraction of citric acid from citrus by-products, thus contributing to its valorization and upcycling into natural food ingredients.

Graphical Abstract

1. Introduction

The constant increase of the global population over the last few decades and the industrialization have generated two major issues, namely the increased use of natural resources, which has caused their scarcity, and the need to increase food production, leading to an increase in agri-food by-products and waste [1].
A considerable part of these by-products comes from food manufacturing and is usually deposited in open-air landfills, interfering with the balance of the ecosystem, which has led both the industry and academia to work on a sustainable solution to reduce the disposal of biowaste [2,3]. One of the purposed solutions involves the combination of the upcycling of biowaste and by-products into high added-value products with the subsequent use of waste in industries, such as bioenergetics [4,5]. If, on the one hand, it is possible to develop natural additives, such as preservatives, flavorings and colorants, on the other hand, biofuel and other forms of energy can be obtained from the residue resulting from the extraction process of these additives, promoting the efficient use of natural resources and driving the circular bioeconomy [4,6].
The recovering of bioactive and functional molecules from natural resources is also a hot topic due to the high consumer interest in foods with natural ingredients, which can be a healthier alternative to artificial analogues, given the continuous restrictions of the use of certain artificial additives by responsible authorities, namely the Food and Drug Administration (FDA) and the European Food Safety Authority (EFSA) in the United States and the European Union, respectively [7,8,9]. Moreover, the promotion of a circular economy, the reduction in agri-food waste, and the recycling and valorization of by-products and biowaste are well-defined initiatives in the priority strategies of global governments.
Citrus, such as orange (Citrus x sinensis (L.) Osbeck) and lime (Citrus latifolia Tanaka, cv. Tahiti), are widely produced and consumed fruits, and its combined annual production is approximately 120 million tons [10,11]. These fruits are consumed fresh and used in the industrial production of citrus drinks, which has significantly increased, generating a considerable quantity of by-products (e.g., seeds, peels, and pomace) [12]. This raw material can be explored for its richness in molecules with bioactive potential. For instance, citrus peels are described as matrices rich in pectin, limonene and molasses, being currently used mainly in the manufacture of cattle feed. However, several studies show that these by-products are rich in nutritious compounds and compounds beneficial to health, namely amino acids, dietary fiber, organic acids and vitamins. [12,13,14]. Since this raw material is a cheap, abundant and renewable source of valuable molecules, it is of the industry’s great interest to promote its recycling and valorization [12]. A class of compounds abundant in citrus matrices and with scientifically proven biological activities are organic acids (e.g., oxalic, citric and ascorbic acids) [15]. Due to its multifunctional applicability as a preservative or flavoring agent, citric acid finds application in several industries, such as food, pharmaceutical, cosmetics, chemical and even metallurgy. Thus, according to Behera et al. [16], in 2023, the global citric acid market is expected to be USD 3.2 billion. Although citric acid is a compound present in several plant species, a considerable part of the commercialized citric acid comes from fermentation carried out by bacteria, fungi and yeasts [16]. The production of citric acid by fermentation has several advantages, mainly the production cost, which is much lower than that of chemical synthesis. However, the production of citric acid by fermentation requires the control of several parameters (medium composition and pH, oxygen content, type of microorganism and fermentation method) and is labeled as a manufactured citric acid, which is described as an inducer of inflammatory symptoms [16,17]. On the other hand, the availability of citrus agro-industrial by-products has aroused interest in these alternative sources of citric acid [16,18].
Several studies report the extraction of organic acids from natural matrices, namely citric acid. For instance, Fernández-Fernández et al. [19] determined the concentration of citric acid present in tomatoes, peppers and oranges using sonication with an aqueous solution of ethanol (80% v/v). Ben Ayache et al. [20], in their study on the chemical characterization of carob seeds, identified and quantified citric acid in dried seeds using a dynamic extraction with metaphosphoric acid.
Among the different extraction technologies applied in the recovery of bioactive molecules, conventional ones, such as maceration, have been applied, but emerging technologies have also been exploited for being described as green techniques, and also because less extraction times and temperatures are needed, as well as the use of lower solvent amounts and a higher retainment of the extract’s quality [21]. One of the emerging technologies extensively applied is the ultrasound-assisted extraction, in which the high-intensity sound waves cause the rupture of plant tissues leading to the release of extractable molecules in the solvent [21,22]. As it is a practical, easy-to-implement and sustainable technique, industries have shown interest in its use. Chemat et al. [23], in their study on the use of this technique in the food industry, highlights its importance in the process of extracting compounds from natural sources, emphasizing that it is a clean method that uses low amounts of solvent and reduces working time, making it economically advantageous compared to conventional methods.
The present work aimed at valorizing citrus peels as an alternative and natural source of citric acid (a flavoring and preservative agent), thus contributing to the recycling and sustainable use of these by-products. More specifically, it was intended to optimize the ultrasound-assisted extraction (UAE) of citric acid from citrus peels, namely lime and orange, using the response surface methodology (RSM) with an adequate experimental design.

2. Materials and Methods

2.1. Citrus Samples

Oranges and limes were obtained from a local market in Bragança, Portugal. The fruit peel was removed from the pulp and the water content was determined (71.2 ± 0.8% for orange peel, and 70.9 ± 0.2% for lime peel). Then, the peel samples were frozen and lyophilized (FreeZone 4.5, Labconco, Kansas City, MO, USA; collector chamber at −50 °C and 0.012 torr) until constant weight. During this process, aluminum foil was used to protect the samples from light. Afterwards, the samples were ground to ~20 mesh (a particle size to increase the sample-to-solvent contact area and, therefore, the mass transfer) and stored vacuum-packaged at –20 °C for two weeks.

2.2. Standards and Reagents

Practical and high-performance liquid chromatography (HPLC)-grade solvents were purchased from common scientific sellers. The commercial standard of citric acid was acquired from Sigma-Aldrich (St. Louis, MO, USA).

2.3. Experimental Design for Extraction Process Optimization

A central composite rotatable design (CCRD) combining five levels of the independent variables X1 (time, t, 2–45 min), X2 (ultrasonic power, P, 50–500 W) and X3 (ethanol proportion, S, 0–100%, v/v) was implemented to optimize the extraction of citric acid from citrus peels. When defining the range of values for the independent variables, the entire power range of the ultrasonic processor was considered, as well as ethanol proportions from 0 to 100% (a green solvent selected for being authorized in food manufacturing and processing) [24]. The extraction time range was fixed based on previous studies [25] and considering that UAE is intended as a time-saving methodology. Even so, times of up to 45 min were imposed to assess the impact of longer sonication on the target organic acid. Design-Expert software v11 was used to generate the 20 experimental points of the design matrix (α = 1.68). The independent variables were coded according to Equation (1), where X is the coded value for t, P and S, xa is its actual value, x0 is the actual value in the center of the design and Δx is the increment of xa corresponding to a variation of 1 X unit.
X = ( x a x 0 ) / Δ x
The CCRD values and ranges are shown in Table 1. For each design point, mean values obtained from triplicate experiments were used as observed responses.

2.4. Ultrasound-Assisted Extraction (UAE)

The UAE was performed using an ultrasonic system (CY-500, Optic Ivymen System, BCN, Spain) equipped with a titanium probe. Extractions were carried out as follows: 1 g of citrus peel powder was mixed with 50 mL of solvent (hydroethanolic mixtures) and processed following the experimental design matrix (Table 1). All extractions were performed at 20 g/L at room temperature (an ice-water bath was used to prevent overheating). After processing, the mixtures were centrifuged at 4000× g for 10 min and the upper phase was filtered first through Whatman No. 4 filter paper, and then through syringe filters to obtain the citric acid solutions to be injected into the chromatographic system.

2.5. Analysis of Citric Acid

The identification and quantification procedure of citric acid was performed following the methodology described by Barros et al. [26]. An ultra-fast liquid chromatography system (Shimadzu 20A series, Shimadzu Corporation, Kyoto, Japan) coupled to a photodiode array detector (PDA with a selected wavelength of 215 nm) was used in the analysis. A reversed-phase C18 column (250 × 4.6 mm, 5 µm; Phenomenex, Torrance, CA, USA) thermostated at 35 °C was used for chromatographic separation and elution was made with sulfuric acid (3.6 mM) at a flow rate of 0.8 mL/min. For identification of citric acid in the extraction solutions, the retention time and UV-vis spectrum were compared with those of the commercial standard of citric acid. Quantification was determined by comparison of the peak area of the sample with an eight-level calibration curve (y = 1 × 10⁶x − 10,277; r2 = 0.9997; limit of detection (LOD) = 4.4 µg/mL; limit of quantification (LOQ) = 14.5 µg/mL) obtained from the same standard (0.039–5 mg/mL). The results were expressed as g per 100 g of dry peel.

2.6. Models Fitting and Statistical Analysis

The quadratic Equation (2) was used to fit the predictive mathematical models, where Y is the dependent variable (or citric acid content), b0 is the model constant, b1, b2 and b3 are the linear coefficients, b11, b22 and b33 are the quadratic coefficients, b12, b13 and b23 are the interaction coefficients, and t, P and S are the coded values of the independent variables.
Y = b 0 + b 1 t + b 2 P + b 3 S + b 11 t 2 + b 22 P 2 + b 33 S 2 + b 12 t P + b 13 t S + b 23 P S
In order to assess the significance of the models (and their terms) and to determine the lack-of-fit, analysis of variance (ANOVA) was applied using Design-Expert software v11. For the construction of the models, only statistically significant terms (p < 0.05) were used (except those necessary for the hierarchy). The values of R2, R2adj and adequate precision were used to check the adequacy of the equation models to the response.

3. Results and Discussion

RSM is a statistical tool widely used in the optimization of different types of processes, including extractions involving different factors or independent variables and one or more response or dependent variables. When compared to conventional one-factor-at-a-time approaches, RSM has the advantage of reducing the number of experimental trials, as well as the associated operational costs, and evaluating the existence of interaction effects between variables [27]. Therefore, in order to create polynomial models capable of predicting the effects of independent variables on a given response, it is important to guarantee the accuracy of their fitting to the experimental data. In this study, the response data in Table 1, corresponding to the citric acid contents quantified in the 20 runs of the experimental design for each raw material, were fitted to the polynomial model Equation (1), but not all parameters were used in the model’s construction because some coefficients were not significant (ns, p > 0.05) (Table 2).
The results of ANOVA and regression analyses are shown in Table 2, and the model Equations (3) and (4) translate the UAE of citric acid for orange and lime peels, respectively. This organic acid was detected only in the first four runs of the CCRD matrix. This result seemed to be related to the use of 20% ethanol (−1 level), since for higher proportions there was no extraction. This is somewhat supported by the results of Daneshfar et al. [28] who observed a higher solubility of citric acid in water than in ethanol at the temperature used in the present work.
Y = 3.55 + 0.2 t + 0.19 P 1.42 S 0.4 t P
Y = 0.4 + 0.05 t 0.98 S + 0.61 t 2 + 0.26 S 2
The parametric values represent the predicted change in response per unit change in factor value when the remaining factors or variables are held constant. A high parametric value is synonymous with a greater significance of the variable’s weight. For interactions, the positive sign indicates a synergistic effect of the variables and a negative sign indicates their antagonism [29]. The developed model equations show the complexity of the extraction trends. In Table 2, the intercept corresponds to the predicted average response at the center point of the design. These values are lower for lime peel and higher for orange peel.
The effects of the independent variables on the target response were properly described by the model Equations (3) and (4), as they had a non-significant lack-of-fit (p > 0.05) and an adequate precision greater than 21 [30]. The coefficients R2 and R2adj were greater than 0.92 and 0.90 in both cases, respectively (Table 2), which means that the independent variables involved in the UAE process explained the response variability. Therefore, both models were statistically validated and used to predict the optimal processing conditions.
Certain features regarding the overall effects of the independent variables t, P and S on the extraction of citric acid from orange and lime peels can be inferred from the complexity of the mathematical models. For orange peel (Equation (3)), although the three independent variables significantly affected the extraction process, the recovery of citric acid was mainly promoted by the negative linear effects of ethanol proportion (−1.42S), which means that the increase in the ethanol proportion leads to a decrease in the yield of citric acid (Figure 1A,C). This better water efficiency can be partially explained by the findings of Daneshfar et al. [28] who reported citric acid to be more soluble in water than in ethanol at temperatures from 30 to 60 °C. Furthermore, the solvent also affects the ultrasonic waves velocity, being higher for water (and increasing with increasing temperature) than for ethanol or methanol (for which it decreases with increasing temperature) [31]. Thus, in addition to the water having allowed a better solubility of citric acid, the ultrasonic waves would have propagated better in this solvent and promoted the mass transfer and, consequently, made the UAE process more efficient under these conditions. The impact of ultrasound on the structure of citrus water-soluble pectin (causing depolymerization) and possible interactions between water molecules, carboxylic groups of citric acid and pectin, and alcohol functional groups may also be associated with the observed extraction trends.
A negative interaction effect between processing time and ultrasonic power (−0.4tP) was also noticed; thus, as illustrated in Figure 1B, the extraction yield was higher when processing at high ultrasonic powers for reduced times or at low powers for longer times. This result shows that the combination of both factors may not be efficient to promote the maximization of citric acid extraction (at low levels) or can cause degradation of this organic compound (when at high levels).
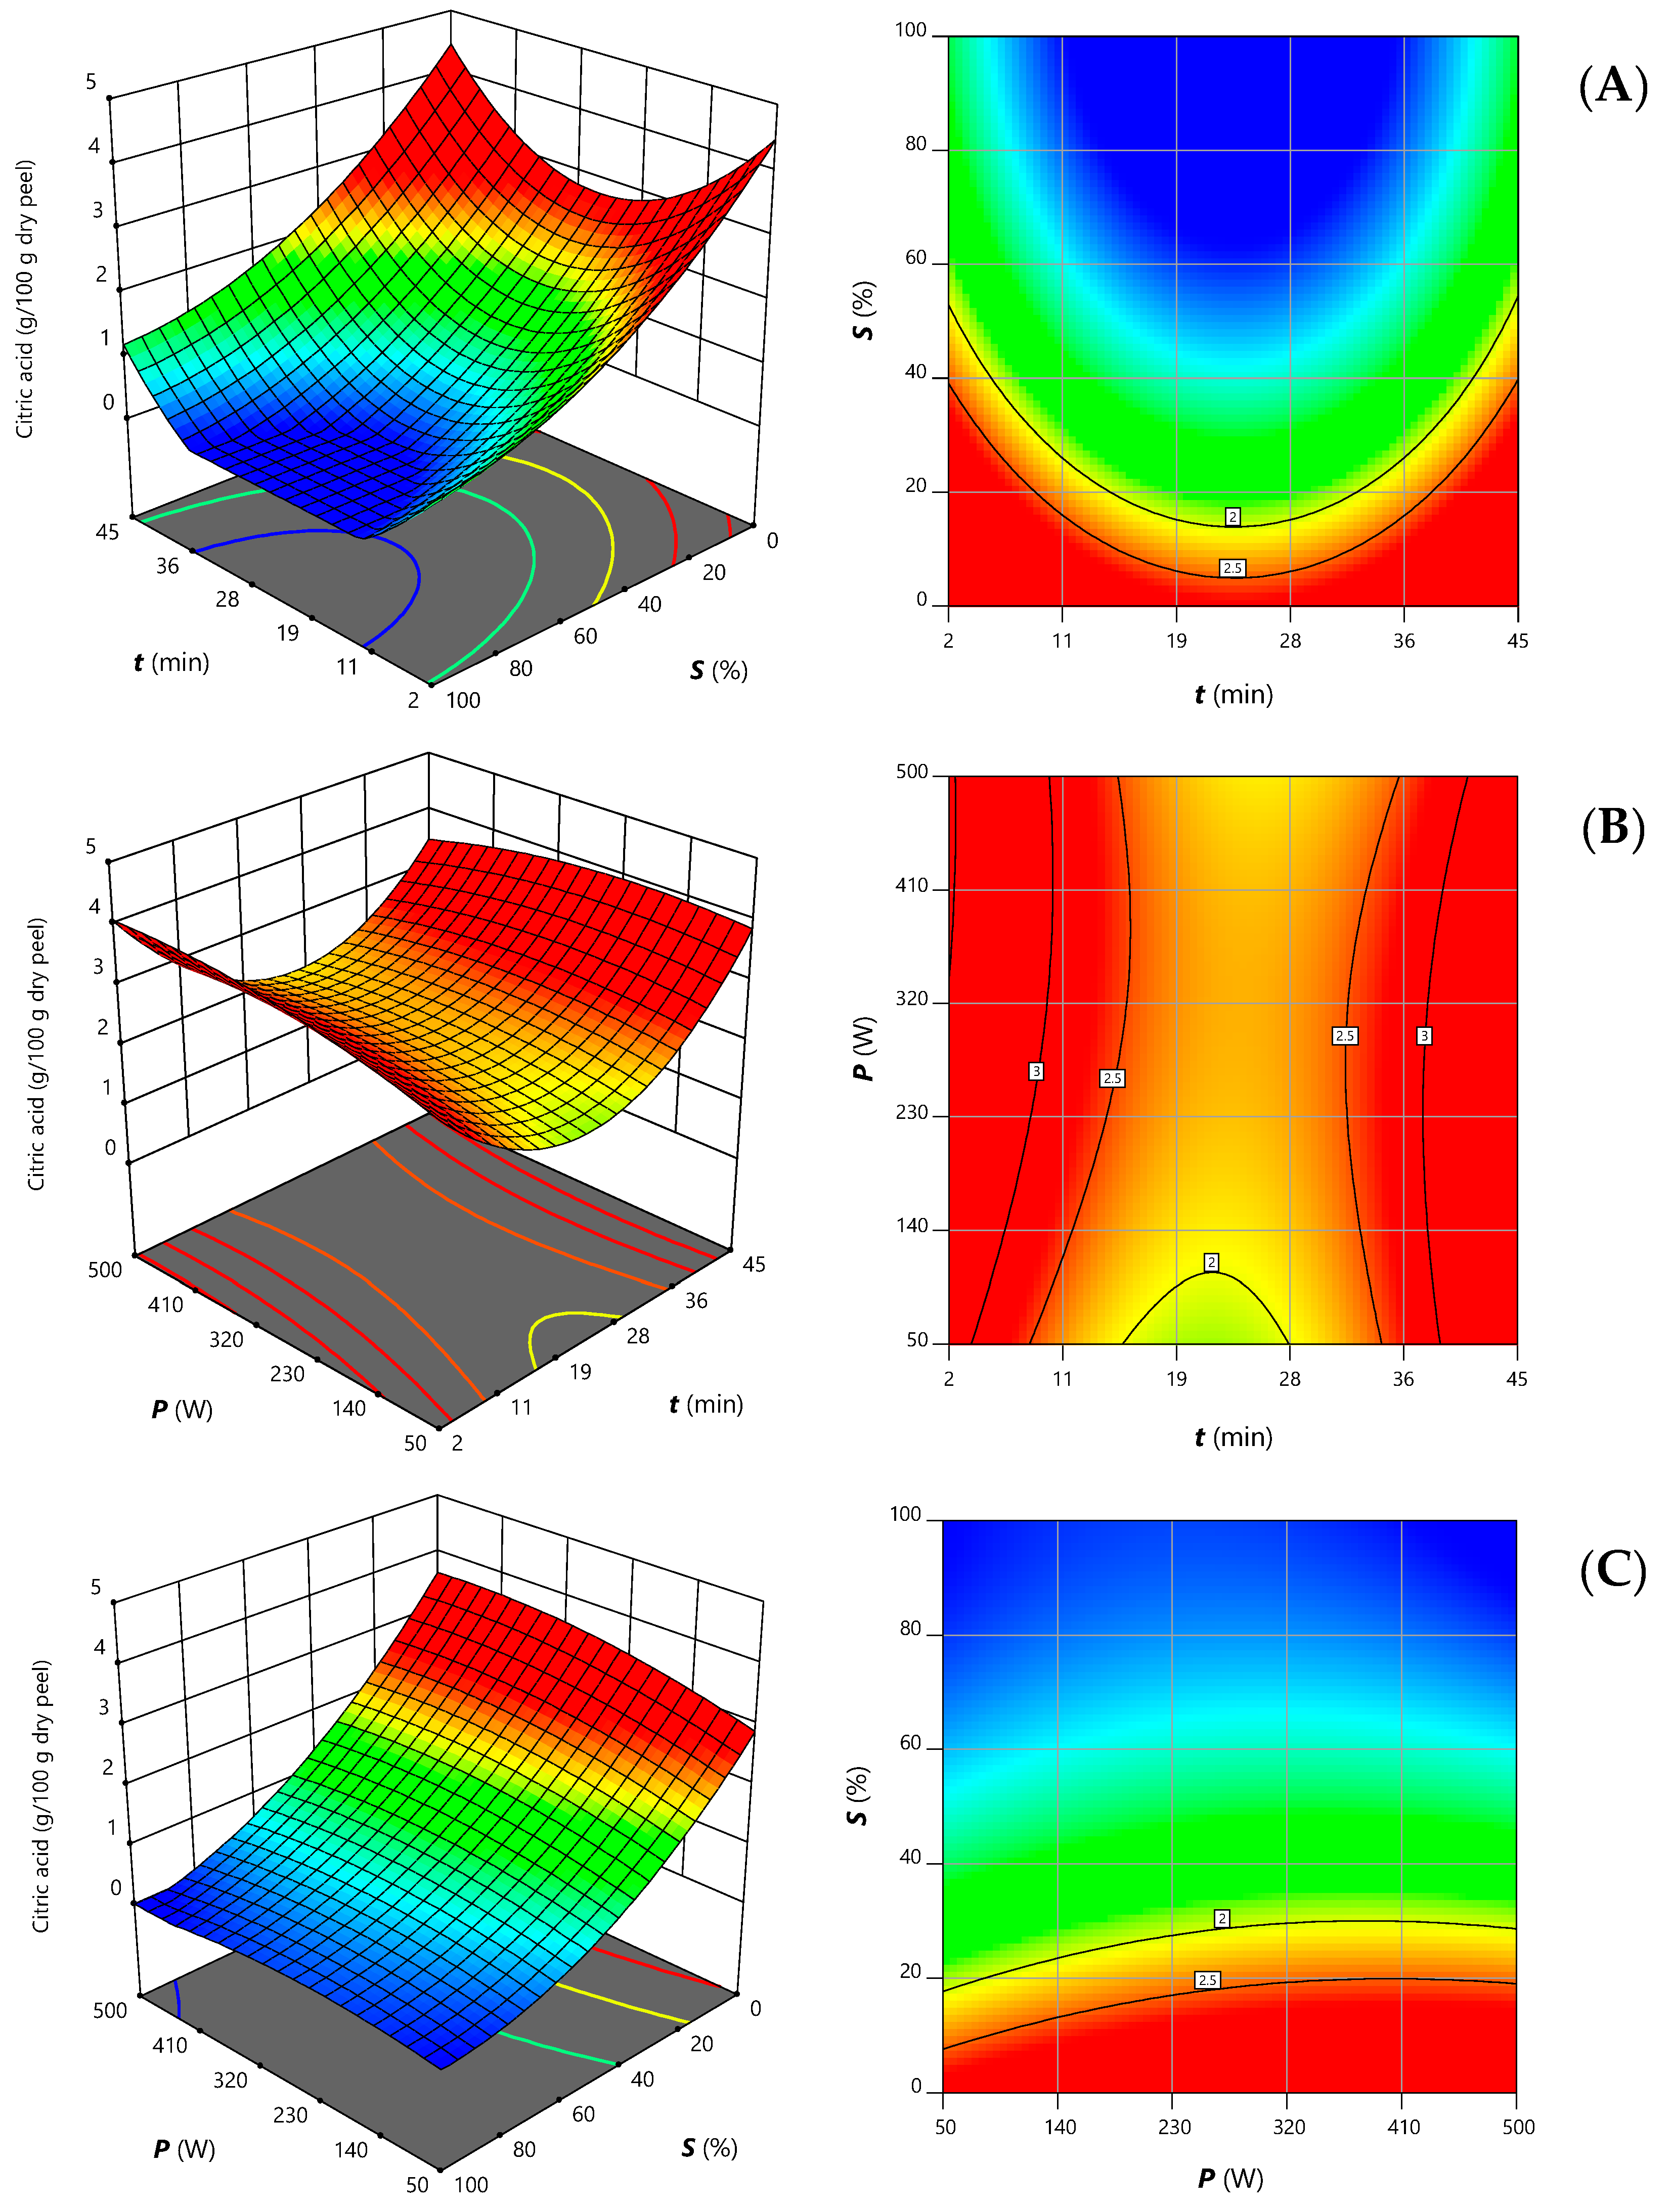
For lime peel (Equation (4)), the ethanol proportion also affected the extraction through negative linear effects (−0.98S) (Figure 2A,C); once again being the variable that most affected the extraction. As discussed above, the better solubility of citric acid in water and the higher velocity of ultrasonic waves in this solvent could support the observed extraction trends, as well as the possible structural or mechanical interactions between citric acid and pectin. On the other hand, unlike what was verified for orange peel, quadratic effects were observed when processing this citrus by-product, caused mainly by the extraction time (0.61t2) (Figure 2A,B) followed by the ethanol proportion (0.26S2). On the other hand, the ultrasonic power did not cause significant effects nor interaction coefficients between the variables in this extraction process. Overall, for both citrus by-products, low ultrasonic power and ethanol proportion were desired for the extraction of citric acid.
For numerical optimization, the intended objectives for the dependent and independent variables need to be defined in order to be combined into a desirability function. The independent variables t, P and S were selected within the experimental range and the response was fixed at the maximum in order to find the set of ideal conditions that meet the desired objective. The result of this optimization step is presented in Table 3. When applying the optimal processing conditions, characterized by 35.3 min sonication at 119.2 W in water or 5.8 min sonication at 346.9 W in 9% ethanol, it was possible to recover about 6.4 g and 3.4 g of citric acid per 100 g of dry orange and lime peels, respectively. For lime peel, the extraction process was faster (<6 min) but required a slightly higher ultrasonic power and ethanol proportion; whereas for orange peel, 100% of water was the most suitable extraction solvent, despite the need to process longer. Therefore, both extraction processes comply with sustainability criteria.
In order to promote the industrial application of these citric acid extracts, their purification and/or stability must be achieved. The purification process for citric acid includes several treatments, such as the use of chemicals and additional extraction processes, as well as spray extraction processes and fractional precipitations [32]. In turn, the extracts can also be encapsulated by spray drying and freeze drying [33].
Most studies on the valorization of citrus peels are focused on the extraction of phenolic compounds [34]. Poyraz et al. [3], in their work on the use of Satsuma mandarin (Citrus unshiu) peel to obtain high value-added bioactive ingredients, optimized the UAE of total phenolics and flavonoids from fresh peel and concluded that the application of 90 min processing at 50 °C, with 56% ultrasound amplitude, leads to the recovery of 8.95 mg gallic acid equivalents/g peel and 5.25 mg catechin equivalents/g peel, respectively. Inoue et al. [35] also optimized the microwave-assisted extraction (MAE) of hesperidin, an active flavanone glycoside, from Citrus unshiu peel, applying an RSM-coupled central composite design of 13 experimental points. The authors maximized the extraction yields and obtained 58.6 mg of hesperidin/g of fresh peel with 7 min processing at 140 °C with 70% ethanol, and proved that the MAE yield is much higher than that obtained with conventional extraction methods. Assefa et al. [36], also with the objective of maximizing the extraction of hesperidin from Citrus junos Sieb. ex Tanaka peels, optimized a maceration process by RSM and concluded that 120 min extraction with 65.5% ethanol at 44 °C yields 337 mg of hesperidin per gram of dry weight.
Regarding the extraction of organic acids from citrus by-products, Montero-Calderon et al. [37] optimized the UAE extraction of ascorbic acid and obtained 53.78 mg/100 g of fresh weight when applying 30 min processing at an ultrasonic power of 400 W and 50% ethanol as solvent. In general, these studies report the use of ethanol proportions much higher than those determined in this study for citric acid, which may be due to the different nature of the target compounds or because they worked with fresh raw material. Pereira et al. [38], in their study on the characterization of different quinoa grains, performed a dynamic extraction with 4.5% metaphosphoric acid at room temperature to recover organic acids, but very low citric acid extraction yields (210 to 317 mg/100 g dw) were obtained when compared to those reached in the present work.
Most citric acid used in industry is obtained through microbial processes and may contains some contaminants resulting from the production process, which can be found in the final product and, therefore, long-term exposure to these compounds can lead to inflammation processes [39]. Thus, it is important to develop sustainable and alternative methodologies to obtain this preservative and flavoring agent from other natural sources, including agri-food by-products, such as citrus peels.

4. Conclusions

The idea that “we are what we eat” is a current topic of investigation that connects eating habits with possible diseases. With the common goal of meeting the growing demand from consumers and the industry for food products free of artificial additives, researchers have been working to develop more efficient and sustainable extraction processes and obtain natural food-grade ingredients. In this work, the UAE of citric acid from citrus peels was optimized using an RSM-coupled experimental design combining the effect of three independent variables. Orange and lime peels proved to be a good source of citric acid. Predictive models describing the UAE trends of the target organic acid from these two by-products were constructed and the optimal extraction conditions were characterized by the use of low ultrasonic power and ethanol proportion, while the sonication time varied depending on the citrus matrix. These models predicted the recovery of 6.4 g and 3.4 g of citric acid per 100 g of dry orange and lime peels, respectively. Even so, it will be necessary to experimentally validate these optimal UAE conditions, not only with citrus peels, but also with waste from the processing industry. The study of the effects of the solid–liquid ratio will also be of interest.
Overall, this study aimed to valorize citrus by-products, upcycling them into natural ingredients with potential application in several industries, such as food, nutraceutical, and beverages. In addition, the developed UAE process may be useful to complement the production of citric acid by microbial fermentation. Still, deeper analysis of the developed natural ingredients will be needed to validate their preservative and flavoring potential. The waste resulting from the extraction processes must also be characterized and introduced into the value cycle to achieve zero waste and resource use efficiency.

Author Contributions

F.A.F.: Methodology, Investigation, Writing—Original Draft; J.P.: Methodology, Investigation, Writing—Original Draft; S.A.H.: Methodology, Writing—Reviewing and Editing; M.C.: Methodology, Writing—Reviewing and Editing; M.A.P.: Conceptualization, Methodology, Writing—Reviewing and Editing; I.C.F.R.F.: Conceptualization, Methodology, Writing—Reviewing and Editing; L.B.: Conceptualization, Methodology, Writing—Reviewing and Editing. All authors have read and agreed to the published version of the manuscript.

Funding

The authors are grateful to the Foundation for Science and Technology (FCT, Portugal) for financial support through national funds FCT/MCTES to CIMO (UIDB/00690/2020); the PhD grant (SFRH/BD/145467/2019) of F. Fernandes, the contract of L. Barros through the institutional scientific employment program-contract, and the contracts of M. Carocho, S.A. Heleno and J. Pinela (CEECIND/01011/2018) through the individual scientific employment program contract. This work was also funded by European Regional Development Fund (ERDF) through the Regional Operational Program North 2020, within the scope of Project GreenHealth—Digital strategies in biological assets to improve well-being and promote green health, Norte-01-0145-FEDER-000042. To MICINN for the financial support Ramón & Cajal have given to the researcher M.A. Prieto and to the Xunta de Galicia for supporting the program EXCELENCIA-ED431F 2020/12. Funding for open access charge: Universidade de Vigo/CISUG.

Informed Consent Statement

Not applicable.

Data Availability Statement

Not applicable.

Conflicts of Interest

The authors declare no conflict of interest.

References

  1. Usmani, Z.; Sharma, M.; Karpichev, Y.; Pandey, A.; Chandra Kuhad, R.; Bhat, R.; Punia, R.; Aghbashlo, M.; Tabatabaei, M.; Gupta, V.K. Advancement in valorization technologies to improve utilization of bio-based waste in bioeconomy context. Renew. Sustain. Energy Rev. 2020, 131, 109965. [Google Scholar] [CrossRef]
  2. Kowalczyk, P.; Ligas, B.; Skrzypczak, D.; Mikula, K.; Izydorczyk, G.; Witek-Krowiak, A.; Moustakas, K.; Chojnacka, K. Biosorption as a method of biowaste valorization to feed additives: RSM optimization. Environ. Pollut. 2021, 268, 115937. [Google Scholar] [CrossRef] [PubMed]
  3. Poyraz, Ç.; Küçükyıldız, G.; Kırbaşlar, Ş.İ.; Ciğeroğlu, Z.; Şahin, S. Valorization of Citrus unshiu biowastes to value-added products: An optimization of ultrasound-assisted extraction method using response surface methodology and particle swarm optimization. Biomass Convers. Biorefin. 2021, 1–11. [Google Scholar] [CrossRef]
  4. Conceição, N.; Albuquerque, B.R.; Pereira, C.; Corrêa, R.C.G.; Lopes, C.B.; Calhelha, R.C.; Alves, M.J.; Barros, L.; Ferreira, I.C.F.R. By-products of camu-camu [Myrciaria dubia (Kunth) McVaugh] as promising sources of bioactive high added-value food ingredients: Functionalization of yogurts. Molecules 2020, 25, 70. [Google Scholar] [CrossRef] [PubMed] [Green Version]
  5. Qin, S.; Shekher Giri, B.; Kumar Patel, A.; Sar, T.; Liu, H.; Chen, H.; Juneja, A.; Kumar, D.; Zhang, Z.; Kumar Awasthi, M.; et al. Resource recovery and biorefinery potential of apple orchard waste in the circular bioeconomy. Bioresour. Technol. 2021, 321, 124496. [Google Scholar] [CrossRef]
  6. Alemán-Ramirez, J.L.; Okoye, P.U.; Torres-Arellano, S.; Mejía-Lopez, M.; Sebastian, P.J. A review on bioenergetic applications of Leucaena leucocephala. Ind. Crops Prod. 2022, 182, 114847. [Google Scholar] [CrossRef]
  7. Carocho, M.; Barros, L.; Barreira, J.C.M.; Calhelha, R.C.; Soković, M.; Fernández-Ruiz, V.; Buelga, C.S.; Morales, P.; Ferreira, I.C.F.R. Basil as functional and preserving ingredient in “serra da Estrela” cheese. Food Chem. 2016, 207, 51–59. [Google Scholar] [CrossRef] [Green Version]
  8. EFSA. European Food Safety Authority. Directive 2008/98/EC of European Parliament and of the Council. Available online: https://eurlex.europa.eu/legal-content/EN/TXT/PDF/?uri=CELEX:32008L0098&from=EN (accessed on 1 June 2022).
  9. FDA. Use of the Term Natural on Food Labeling|FDA. 2018. Available online: https://www.fda.gov/food/food-labeling-nutrition/use-term-natural-food-labeling (accessed on 1 June 2022).
  10. FAO. Citrus Fruit. Fresh and processed-Statistical Bulletin 2016. Trade and Markets Division, 47, 2017. Available online: http://www.fao.org/3/a-i8092e.pdf (accessed on 1 June 2022).
  11. Rafiq, S.; Kaul, R.; Sofi, S.A.; Bashir, N.; Nazir, F.; Ahmad Nayik, G. Citrus peel as a source of functional ingredient: A review. J. Saudi Soc. Agric. Sci. 2018, 17, 351–358. [Google Scholar] [CrossRef] [Green Version]
  12. Chavan, P.; Singh, A.K.; Kaur, G. Recent progress in the utilization of industrial waste and by-products of citrus fruits: A review. J. Food Process Eng. 2018, 41, e12895. [Google Scholar] [CrossRef]
  13. Farag, M.A.; Abib, B.; Ayad, L.; Khattab, A.R. Sweet and bitter oranges: An updated comparative review of their bioactives, nutrition, food quality, therapeutic merits and biowaste valorization practices. Food Chem. 2020, 331, 127306. [Google Scholar] [CrossRef] [PubMed]
  14. Ruviaro, A.R.; de Paula Menezes Barbosa, P.; Alexandre, E.C.; Justo, A.F.O.; Antunes, E.; Macedo, G.A. Aglycone-rich extracts from citrus by-products induced endothelium-independent relaxation in isolated arteries. Biocatal. Agric. Biotechnol. 2020, 23, 101481. [Google Scholar] [CrossRef]
  15. Mani-López, E.; García, H.S.; López-Malo, A. Organic acids as antimicrobials to control Salmonella in meat and poultry products. Food Res. Int. 2012, 45, 713–721. [Google Scholar] [CrossRef]
  16. Behera, B.C.; Mishra, R.; Mohapatra, S. Microbial citric acid: Production, properties, application, and future perspectives. Food Front. 2021, 2, 62–76. [Google Scholar] [CrossRef]
  17. Sawant, O.; Mahale, S.; Ramchandran, V.; Nagaraj, G.; Bankar, A. Fungal Citric acid production using waste materials: A mini-review. J. Microbiol. Biotechnol. Food Sci. 2018, 8, 821–828. [Google Scholar] [CrossRef]
  18. Ozdal, M.; Kurbanoglu, E.B. Citric Acid Production by Aspergillus niger from Agro-Industrial By-Products: Molasses and Chicken Feather Peptone. Waste Biomass Valorization 2019, 10, 631–640. [Google Scholar] [CrossRef]
  19. Fernández-Fernández, R.; López-Martínez, J.C.; Romero-González, R.; Martínez-Vidal, J.L.; Alarcón Flores, M.I.; Garrido Frenich, A. Simple LC-MS determination of citric and malic acids in fruits and vegetables. Chromatographia 2010, 72, 55–62. [Google Scholar] [CrossRef]
  20. Ayache, S.B.; Reis, F.S.; Dias, M.I.; Pereira, C.; Glamočlija, J.; Soković, M.; Saafi, E.B.; Ferreira, I.C.F.R.; Barros, L.; Achour, L. Chemical characterization of carob seeds (Ceratonia siliqua L.) and use of different extraction techniques to promote its bioactivity. Food Chem. 2021, 351, 129263. [Google Scholar] [CrossRef]
  21. Kumar, K.; Srivastav, S.; Sharanagat, V.S. Ultrasound assisted extraction (UAE) of bioactive compounds from fruit and vegetable processing by-products: A review. Ultrason. Sonochem. 2021, 70, 105325. [Google Scholar] [CrossRef]
  22. Azmir, J.; Zaidul, I.S.M.; Rahman, M.M.; Sharif, K.M.; Mohamed, A.; Sahena, F.; Jahurul, M.H.A.; Ghafoor, K.; Norulaini, N.A.N.; Omar, A.K.M. Techniques for extraction of bioactive compounds from plant materials: A review. J. Food Eng. 2013, 117, 426–436. [Google Scholar] [CrossRef]
  23. Chemat, F.; Rombaut, N.; Sicaire, A.G.; Meullemiestre, A.; Fabiano-Tixier, A.S.; Abert-Vian, M. Ultrasound assisted extraction of food and natural products. Mechanisms, techniques, combinations, protocols and applications. A review. Ultrason. Sonochem. 2017, 34, 540–560. [Google Scholar] [CrossRef]
  24. European Parliament Directive 2009/28/EC of the European Parliament and of the Council of 23 April 2009. Off. J. Eur. Union 2009, 140, 16–62.
  25. Dias, M.I.; Albiston, C.; Añibarro-Ortega, M.; Ferreira, I.C.F.R.; Pinela, J.; Barros, L. Sonoextraction of phenolic compounds and saponins from Aesculus hippocastanum seed kernels: Modeling and optimization. Ind. Crops Prod. 2022, 185, 115142. [Google Scholar] [CrossRef]
  26. Barros, L.; Pereira, C.; Ferreira, I.C.F.R. Optimized analysis of organic acids in edible mushrooms from Portugal by ultra fast liquid chromatography and photodiode array detection. Food Anal. Methods 2013, 6, 309–316. [Google Scholar] [CrossRef]
  27. Leichtweis, M.G.; Pereira, C.; Prieto, M.A.; Barreiro, M.F.; Beraldi, I.J.; Barros, L.; Ferreira, I.C.F.R. Ultrasound as a rapid and low-cost extraction procedure to obtain anthocyanin-based colorants from Prunus spinosa L. Fruit epicarp: Comparative study with conventional heat-based extraction. Molecules 2019, 24, 573. [Google Scholar] [CrossRef] [PubMed] [Green Version]
  28. Daneshfar, A.; Baghlani, M.; Sarabi, R.S.; Sahraei, R.; Abassi, S.; Kaviyan, H.; Khezeli, T. Solubility of citric, malonic, and malic acids in different solvents from 303.2 to 333.2K. Fluid Phase Equilib. 2012, 313, 11–15. [Google Scholar] [CrossRef]
  29. Pinela, J.; Prieto, M.A.; Pereira, E.; Jabeur, I.; Barreiro, M.F.; Barros, L.; Ferreira, I.C.F.R. Optimization of heat- and ultrasound-assisted extraction of anthocyanins from Hibiscus sabdariffa calyces for natural food colorants. Food Chem. 2019, 275, 309–321. [Google Scholar] [CrossRef] [PubMed] [Green Version]
  30. Iberahim, N.; Sethupathi, S.; Goh, C.L.; Bashir, M.J.K.; Ahmad, W. Optimization of activated palm oil sludge biochar preparation for sulphur dioxide adsorption. J. Environ. Manag. 2019, 248, 109302. [Google Scholar] [CrossRef]
  31. Vatandas, M.; Koc, A.B.; Koc, C. Ultrasonic velocity measurements in ethanol-water and methanol-water mixtures. Eur. Food Res. Technol. 2007, 225, 525–532. [Google Scholar] [CrossRef]
  32. Mahato, N.; Sinha, M.; Sharma, K.; Koteswararao, R.; Cho, M.H. Modern extraction and purification techniques for obtaining high purity food-grade bioactive compounds and value-added co-products from citrus wastes. Foods 2019, 8, 523. [Google Scholar] [CrossRef] [Green Version]
  33. Papoutsis, K.; Golding, J.B.; Vuong, Q.; Pristijono, P.; Stathopoulos, C.E.; Scarlett, C.J.; Bowyer, M. Encapsulation of citrus by-product extracts by spray-drying and freeze-drying using combinations of maltodextrin with soybean protein and ι-carrageenan. Foods 2018, 7, 115. [Google Scholar] [CrossRef] [Green Version]
  34. Singh, B.; Singh, J.P.; Kaur, A.; Singh, N. Phenolic composition, antioxidant potential and health benefits of citrus peel. Food Res. Int. 2020, 132, 109114. [Google Scholar] [CrossRef] [PubMed]
  35. Inoue, T.; Tsubaki, S.; Ogawa, K.; Onishi, K.; Azuma, J.I. Isolation of hesperidin from peels of thinned Citrus unshiu fruits by microwave-assisted extraction. Food Chem. 2010, 123, 542–547. [Google Scholar] [CrossRef]
  36. Assefa, A.D.; Saini, R.K.; Keum, Y.S. Extraction of antioxidants and flavonoids from yuzu (Citrus junos Sieb ex Tanaka) peels: A response surface methodology study. J. Food Meas. Charact. 2017, 11, 364–379. [Google Scholar] [CrossRef]
  37. Montero-Calderon, A.; Cortes, C.; Zulueta, A.; Frigola, A.; Esteve, M.J. Green solvents and Ultrasound-Assisted Extraction of bioactive orange (Citrus sinensis) peel compounds. Sci. Rep. 2019, 9, 16120. [Google Scholar] [CrossRef]
  38. Pereira, E.; Encina-Zelada, C.; Barros, L.; Gonzales-Barron, U.; Cadavez, V.; Ferreira, I.C. Chemical and nutritional characterization of Chenopodium quinoa Willd (quinoa) grains: A good alternative to nutritious food. Food Chem. 2019, 280, 110–114. [Google Scholar] [CrossRef] [Green Version]
  39. Sweis, I.E.; Cressey, B.C. Potential role of the common food additive manufactured citric acid in eliciting significant inflammatory reactions contributing to serious disease states: A series of four case reports. Toxicol. Rep. 2018, 5, 808–812. [Google Scholar] [CrossRef]
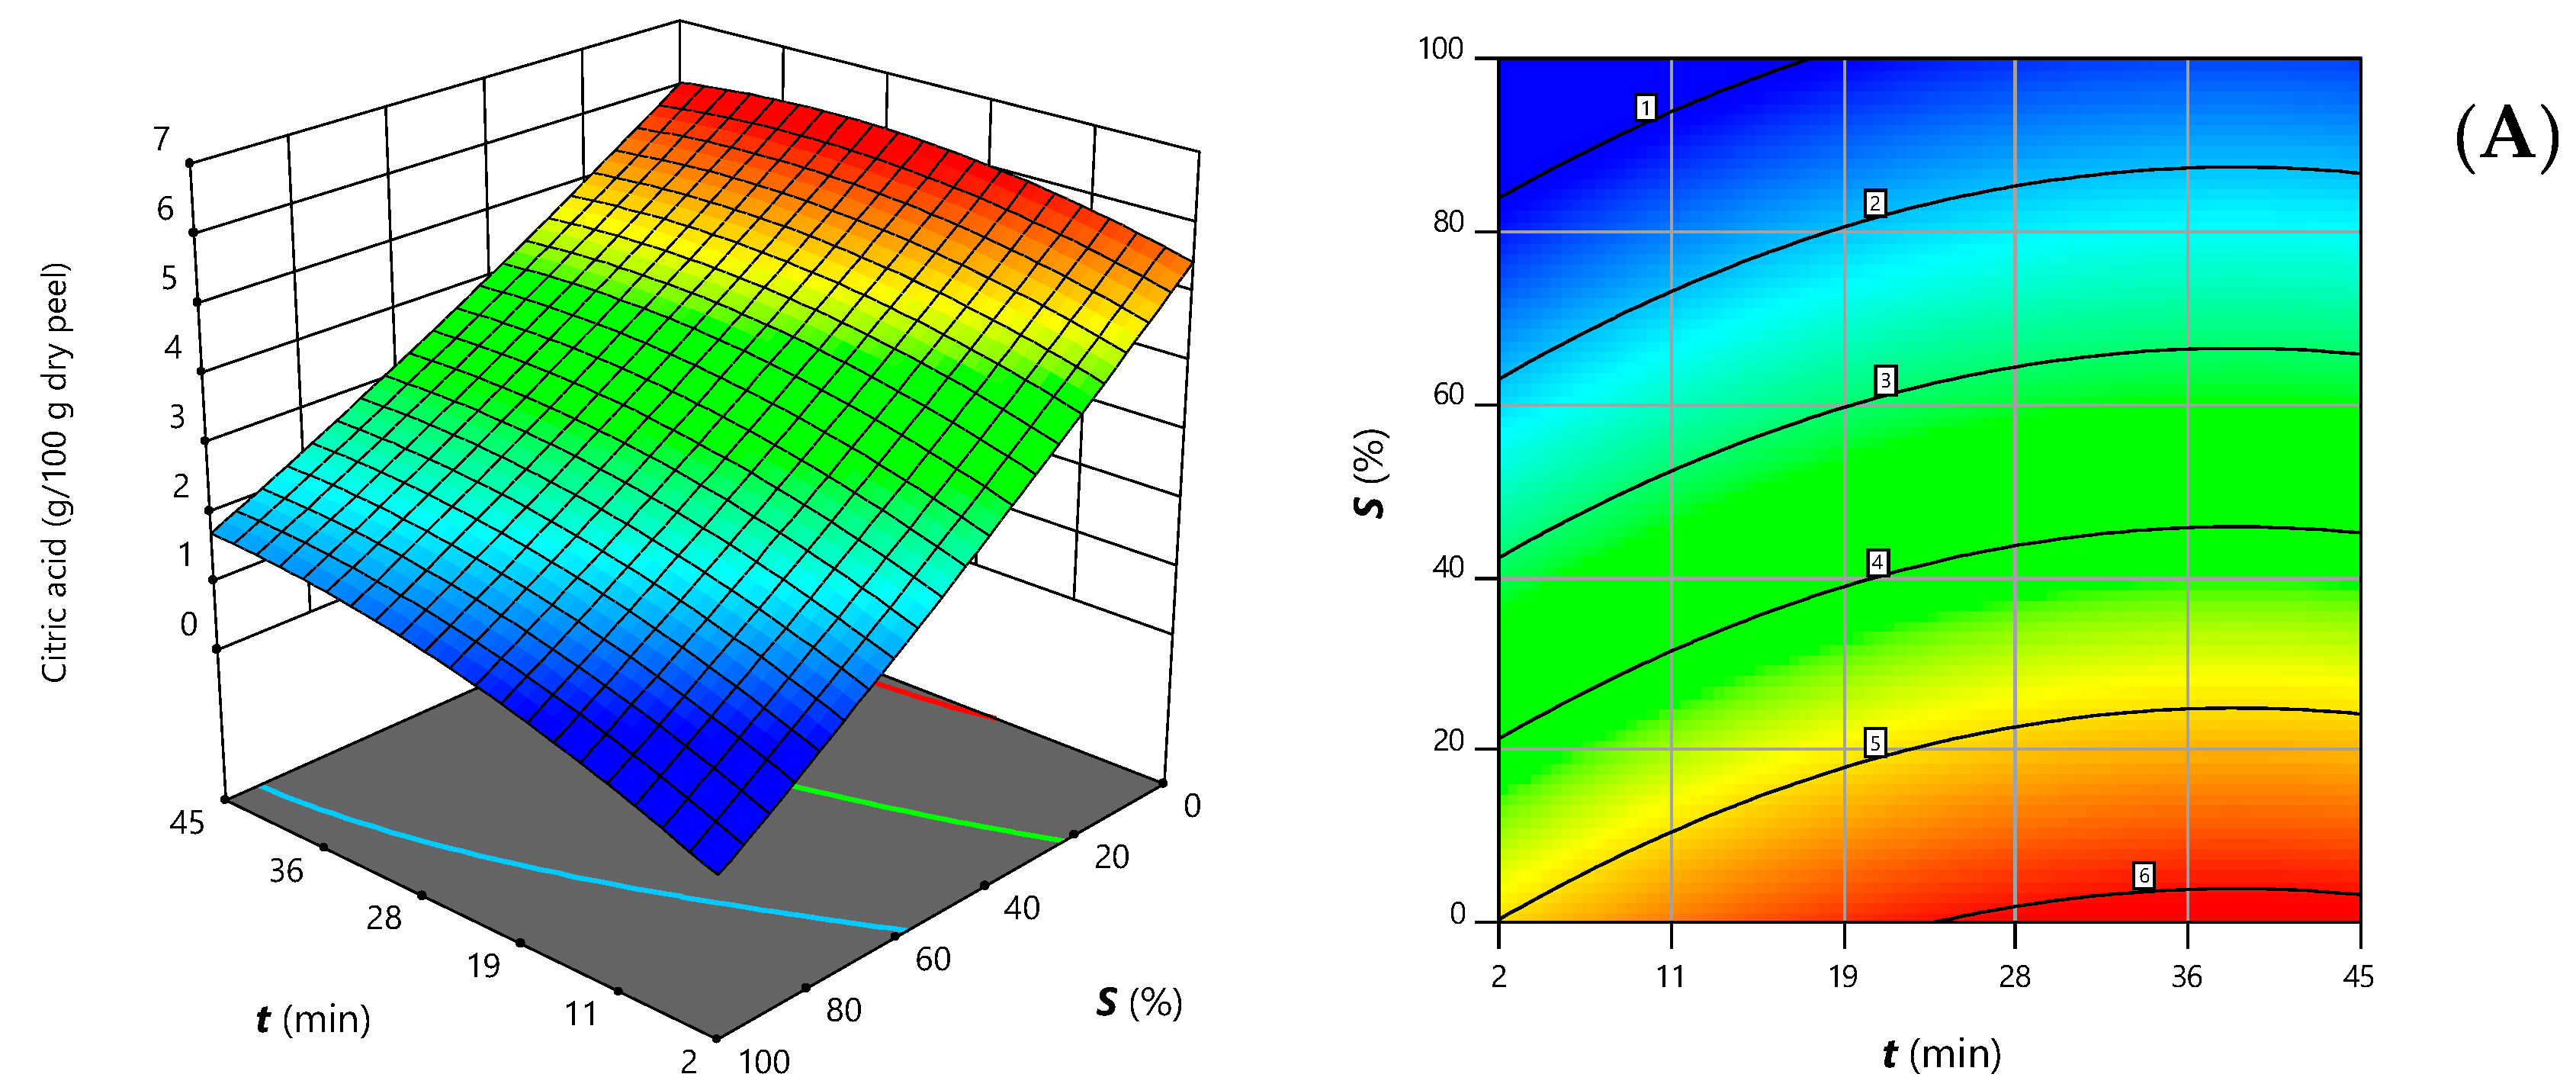
Figure 1. Response surface graphs and contour plots illustrating the combined effects of the independent variables (A) time and solvent, (B) power and time, and (C) power and solvent on the levels of citric acid recovered from orange peels. In each graph, the excluded variable was fixed at its optimum (Table 3).
Chemosensors 10 00257 g001aChemosensors 10 00257 g001b
Figure 2. Response surface graphs and contour plots illustrating the combined effects of the independent variables (A) time and solvent, (B) power and time, and (C) power and solvent on the levels of citric acid present in lime peels. In each graph, the excluded variable was fixed at its optimum (Table 3).
Chemosensors 10 00257 g002
Table 1. Experimental responses obtained under the extraction conditions defined by CCRD matrix for the citric acid content obtained from citrus peels.
RunExperimental Design MatrixExperimental Responses
TimeUltrasonic PowerEthanol ProportionCitric Acid Content (g/100 g Dry Peel) *
(min)(W)(%, v/v)Orange PeelLime Peel
111 (−1)142 (−1)20 (−1)4.391.98
236 (+1)142 (−1)20 (−1)5.712.36
311 (−1)409 (+1)20 (−1)5.522.71
436 (+1)409 (+1)20 (−1)4.632.22
511 (−1)142 (−1)80 (+1)1.510.00
636 (+1)142 (−1)80 (+1)2.800.00
711 (−1)409 (+1)80 (+1)2.520.00
836 (+1)409 (+1)80 (+1)2.520.00
92 (−1.68)275 (0)50 (0)2.682.21
1045 (+1.68)275 (0)50 (0)3.292.26
1124 (0)50 (−1.68)50 (0)2.860.60
1224 (0)500 (+1.68)50 (0)3.930.00
1324 (0)275 (0)0 (−1.68)6.062.46
1424 (0)275 (0)100 (+1.68)1.000.00
1524 (0)275 (0)50 (0)3.200.82
1624 (0)275 (0)50 (0)3.600.61
1724 (0)275 (0)50 (0)3.860.36
1824 (0)275 (0)50 (0)3.580.34
1924 (0)275 (0)50 (0)3.690.32
2024 (0)275 (0)50 (0)3.720.21
* The mean value of three determinations is presented.
Table 2. Parametric coefficients of the model equations and statistical data of the fitting procedure.
Model CoefficientsOrange PeelLime Peel
Interceptb03.55 ± 0.070.4 ± 0.1
Linear termsb10.20 ± 0.080.05 ± 0.05 *
b20.19 ± 0.08ns
b3−1.42 ± 0.08−0.98 ± 0.08
Quadratic termsb11ns0.61 ± 0.08
b22nsns
b33ns0.26 ± 0.08
Interaction termsb12−0.4 ± 0.1ns
b13nsns
b23nsns
Modeling Statistics
Model F-value69.4848.68
Lack-of-fitnsns
R20.94880.9285
R2adj0.93510.9094
Adequate precision29.0221.04
R2: coefficient of determination; R2ajd: adjusted coefficient of determination; ns: not significant. The parametric subscripts 1, 2 and 3 stand for time, ultrasonic power and ethanol proportion, respectively. ns: not significant (p > 0.05). * Not significant but necessary to ensure hierarchy.
Table 3. Optimal extraction conditions that maximize the recovery of citric acid from citrus peels.
Optimal UAE ConditionsCitric Acid Content
Time (min)Ultrasonic Power (W)Ethanol Proportion (%, v/v)(g/100 g Dry Peel)
Orange peel35.5119.20.06.4 ± 0.2
Lime peel5.8141.47.03.4 ± 0.2
Publisher’s Note: MDPI stays neutral with regard to jurisdictional claims in published maps and institutional affiliations.