1. Introduction
Acetoin and diacetyl are natural byproducts in fermentation processes, and have a characteristic butter or butterscotch aroma. In addition to their natural occurrence in alcoholic beverages (e.g., beer and wine), they are often added to food as flavorings [
1,
2]. Diacetyl can affect the organoleptic quality of products and reduce satiety signals, which may contribute to the overconsumption of certain foods. Additionally, at higher concentrations diacetyl has a negative impact on health in the case of continuous exposure [
3].
In beer and wine, acetoin and diacetyl influence the flavor negatively if they exceed a certain concentration level; in the case of high diacetyl concentrations over the sensory threshold, wine and beer smell as if they are spoiled [
4]. The human flavor threshold of diacetyl is reported to be 0.1–0.2 ppm (~1.16–2.32 µM) in lager beers and 0.1–0.4 ppm (~1.16–4.64 µM) in ales [
5]. The taste characteristics of beer are decisive for its acceptance by consumers in general. However, consistent quality and beer taste are crucial for commercial success, despite the rather complex series of production processes. Hence, ideally, these levels have to be monitored and adjusted continuously [
6].
During the brewing process, acetoin and diacetyl are formed by the non-enzymatic degradation of acetolactate and acetohydroxybutyrate, which are metabolic intermediates of amino acid synthesis and therefore accumulate in the fermenting wort [
7]. Diacetyl removal is one of the main objectives of beer maturation, such that diacetyl is reduced to acetoin and butane-2,3-diol. Because the taste threshold of acetoin is much higher than that of diacetyl, the issue of “off-flavor” can be solved in this manner [
8]. Nevertheless, this process is time- and energy-consuming, whereas it is of interest to brewers to reduce the maturation time without compromising the quality of the final beer [
5,
6]. The acetoin and diacetyl levels can indicate how far the process has progressed. For this reason, the detection of the acetoin and diacetyl concentrations over time can serve as a quality control and prevent unnecessarily long maturation [
9]. Typical acetoin and diacetyl concentrations in beer are in the range of ca. 10–50 µM and 1.2 to 2.3 µM, respectively, depending on the type of beer [
5,
10].
Currently, colorimetric and gas chromatographic techniques are commonly applied for measuring acetoin and diacetyl concentrations [
10,
11]. Additionally, high-performance liquid chromatographic, spectrophotometric, fluorescent, and voltammetric measurements have been utilized and discussed in the literature [
3,
4,
12]. However, all these developed methods have the disadvantage that they require quite complex sample preparation, which is not compatible with on-line monitoring. Trained personnel and laboratory equipment are needed, resulting in high costs. Alternatively, the samples can be sent to an external laboratory, which leads to delay.
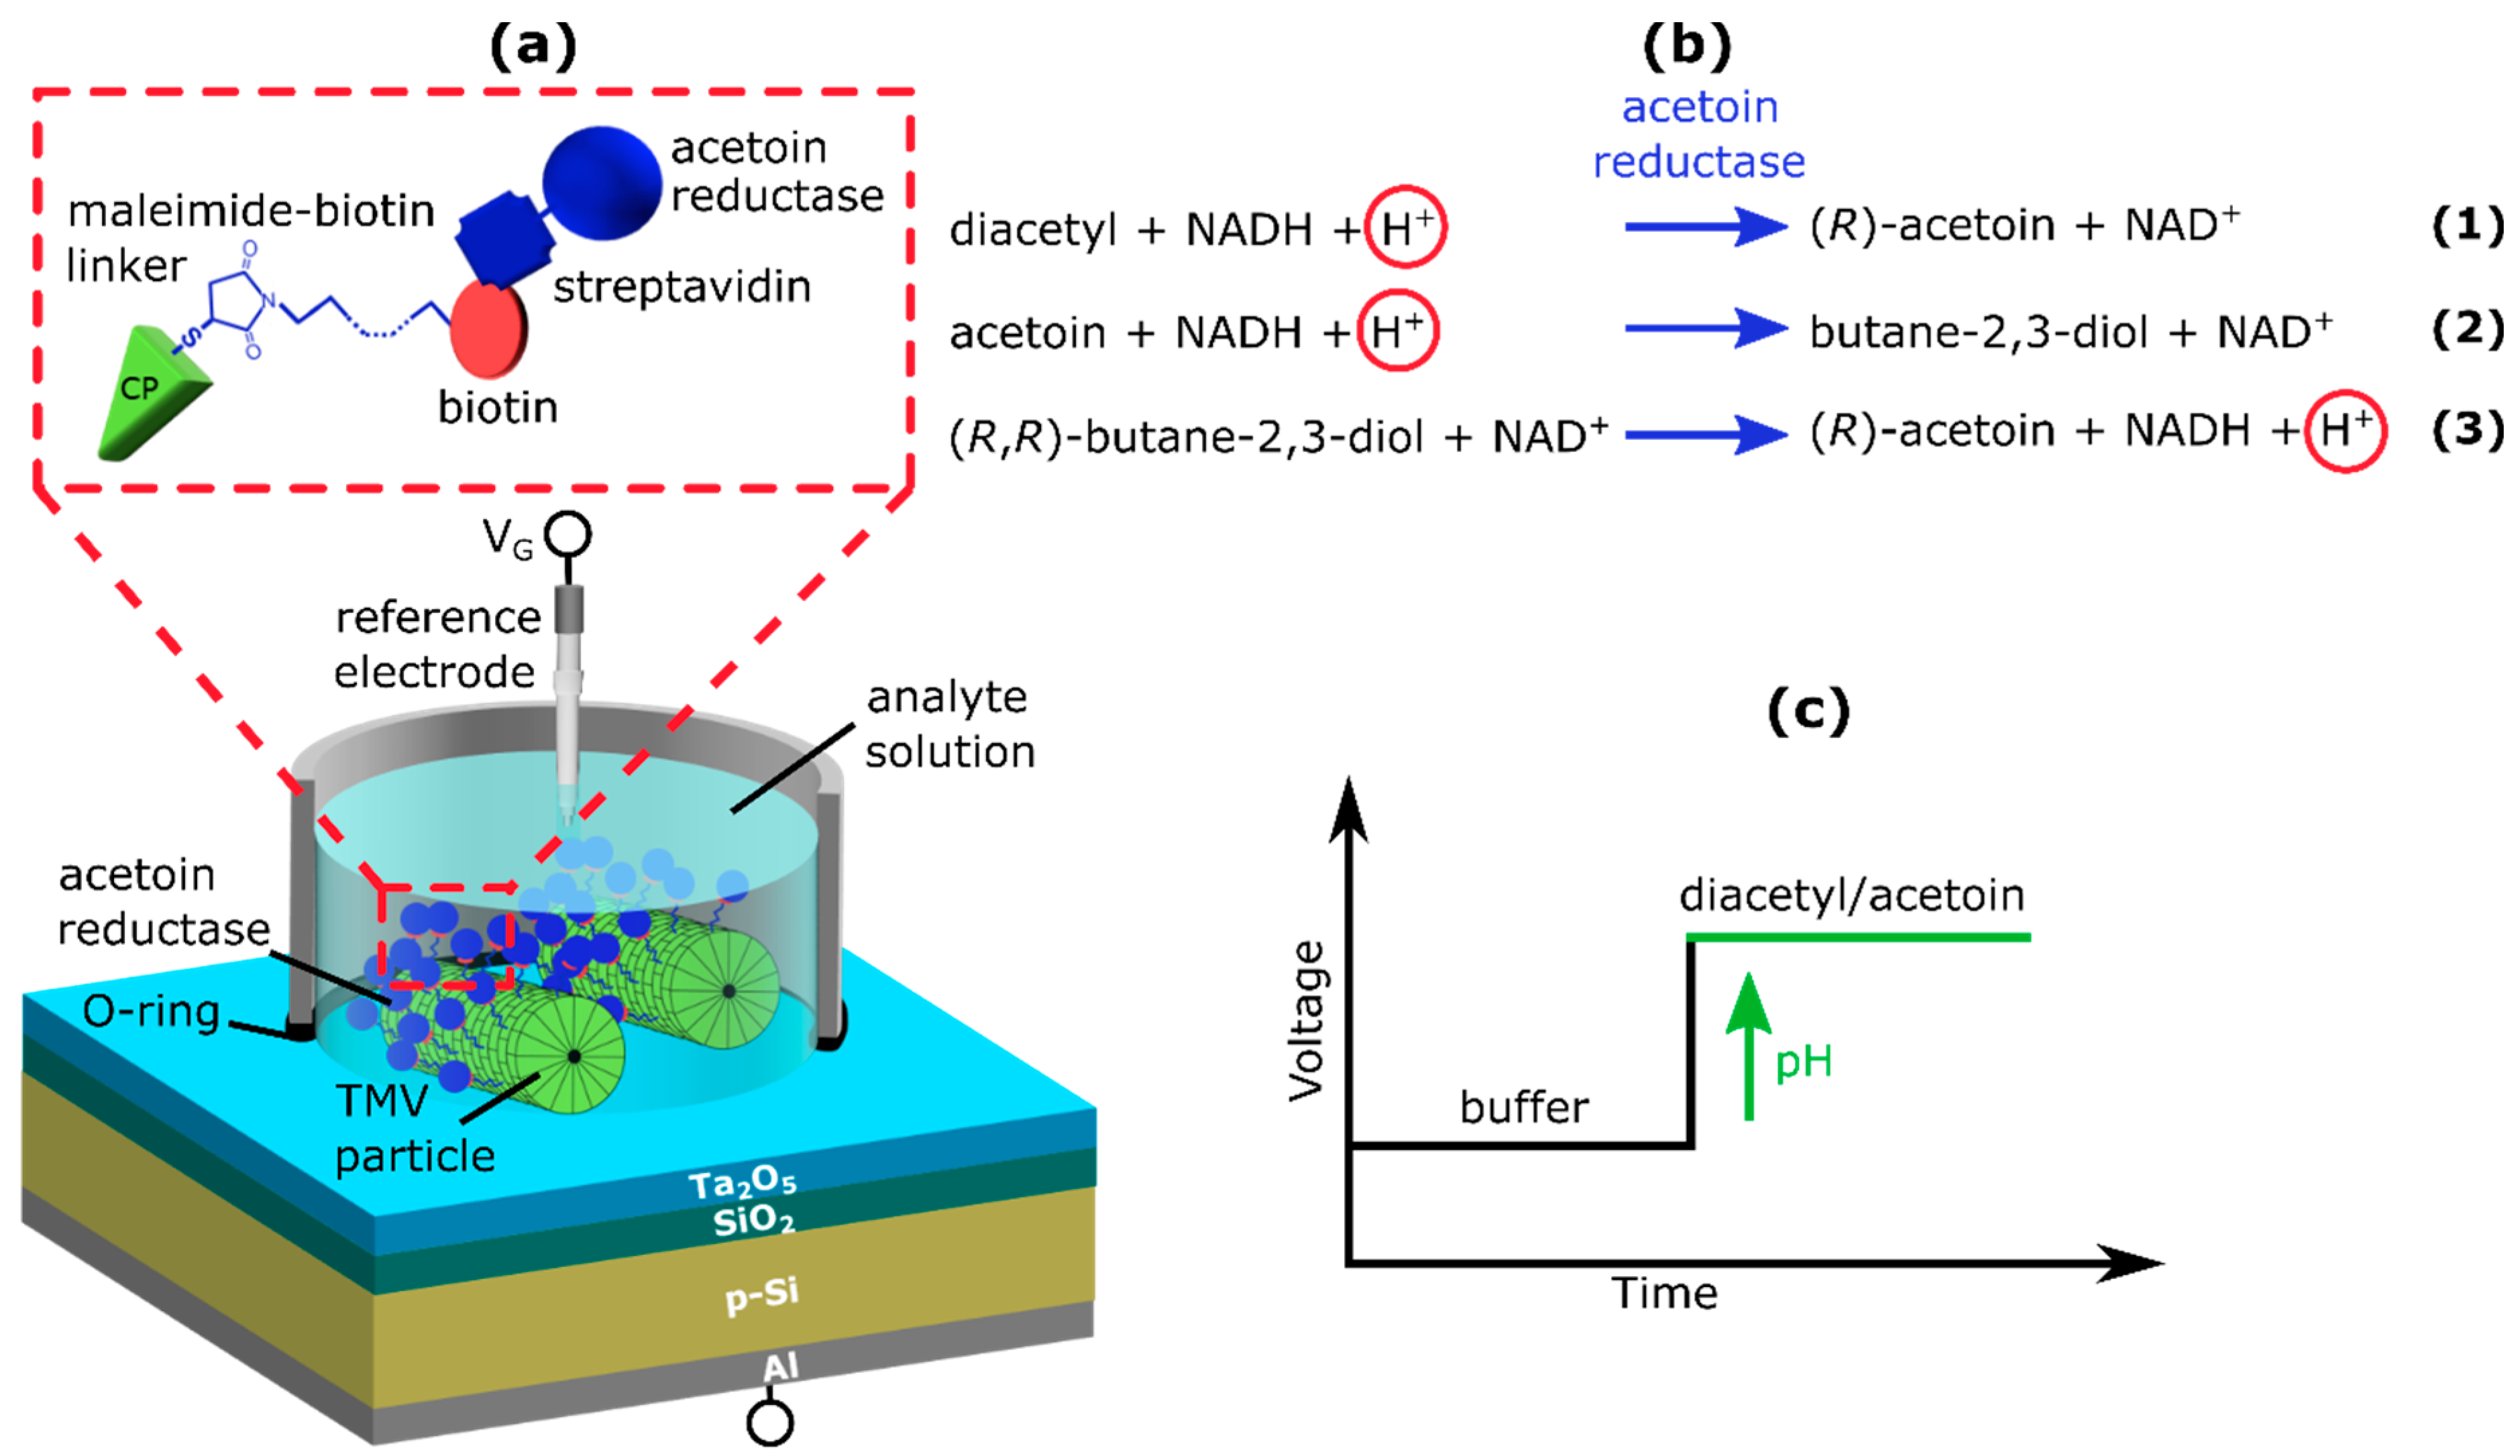
The application of a biosensor for the on-site detection of acetoin and diacetyl with a fast response time could circumvent these challenges. Recently, we introduced a capacitive field-effect biosensor for the detection of acetoin [
13] and characterized this biosensor using real samples [
14]. Here, the enzyme acetoin reductase (AR), known as (
R,
R)-butane-2,3-diol dehydrogenase, from
Alkalihalobacillus clausii DSM 8716
T [
15] was immobilized on the transducer surface of a capacitive electrolyte–insulator–semiconductor (EISCAP) sensor by means of cross-linking. In the present study, we suggest a new strategy for enzyme immobilization:
Tobacco mosaic virus (TMV) particles are utilized as enzyme nanocarriers for the high-density immobilization of the AR, which might allow broadening the spectrum of substrates to be detected. In previous studies, EISCAPs have been applied for the detection of various biomolecules, such as charged molecules, DNA, and biomarkers [
16,
17,
18]. Recently, we utilized a TMV-assisted EISCAP as penicillin-specific biosensor [
19].
The TMV is a nanotube-shaped plant virus with a length of 300 nm and an outer and inner diameter of 18 nm and 4 nm, respectively. The TMV typically possesses 2130 identical helically-arranged coat proteins (CPs) which embed the viral RNA [
20]. Due to this uniform structure, each TMV particle exhibits 2130 regularly spaced surface sites, which can be addressed for dense immobilization of biomolecules such as enzymes [
21,
22,
23]. The three-dimensional arrangement and precisely positioned binding of the enzymes leads to improved diffusion conditions, allowing better substrate access to the active centers and enhanced product diffusion towards the transducer surface in comparison with conventional enzyme binding. In this way, TMV-based biosensors for the amperometric and colorimetric detection of glucose [
24,
25], the potentiometric and colorimetric detection of penicillin [
19,
26], and the potentiometric multi-parameter sensing of penicillin and urea [
27] have been discussed in the literature. The results of these studies indicate that enzyme immobilization via TMV nanoscaffolds has a positive effect on both the sensing performance and the long-term stability of biosensors.
In the current experiments, TMV-assisted Al/p-Si/SiO2/Ta2O5 EISCAPS modified with AR are electrochemically characterized using leakage current, capacitance–voltage (C-V), and constant capacitance (ConCap) methods. The novel biosensor is applied for the detection of both acetoin and diacetyl in buffer solution. Furthermore, the detection of acetoin and diacetyl is demonstrated with the same biosensor setup in buffer solution and in beer samples. Finally, the possibility of tailoring the acetoin and diacetyl sensitivity by adjusting the pH value of the measurement solution is studied.
2. Materials and Methods
2.1. TMV Particles
For application as enzyme nanocarrier, a genetically modified TMV variant (TMV
Cys) was used which displays a cysteine residue on each of the 2130 CP subunits. TMV
Cys particles were coated with polyethylene glycole (PEG
11)-biotin linkers by maleimide–sulfhydryl conjugation as described in [
25]. The biotinylated TMV
Cys (TMV
CysBio) particles were stored with a concentration of 10 mg/mL in 10 mM sodium–potassium–phosphate (SPP) buffer (pH 7.0) at 4 °C. Sodium dodecyl sulphate–polyacrylamide gel electrophoresis and staining with colloidal Coomassie Brilliant Blue G-250 was used to determine the biotinylation rate [
28]. The TMV
CysBio particles in this work exhibited a biotinylation of ~94%, which corresponds to approximately 2000 biotin-loaded CP subunits per TMV
CysBio nanotube. For sensor modification, the TMV
CysBio solution was diluted to a concentration of 0.1 mg/mL.
2.2. Preparation of the Acetoin Reductase
For the heterologous expression of the bdhA gene and production of the AR from Alkalihalobacillus clausii DSM 8716
T,
E. coli BL21(DE3), previously transformed with a plasmid pET28-BcBDH5′ (N-terminal StrepII-tag), was utilized as reported in [
29].
The recombinantly-produced N-terminally Strep-tagged AR was purified from the cell lysate in 10 mM Tris-HCl buffer with 150 mM NaCl + 10 µM ZnSO4 (pH 7.4) using Strep-Tactin® 5 mL Macroprep columns (IBA Lifesciences GmbH, Göttingen, Germany). The purified enzyme was concentrated by centrifugation at 4 °C and 5000× g using a VivaSpin 20 Centrifugal Concentrator (Sartorius, Göttingen, Germany). The produced AR was stored in 10 mM Tris-HCl + 150 mM NaCl + 10 µM ZnSO4 (pH 7.4) at −20 °C.
For binding of the AR to the TMVCysBio particles, the AR was conjugated to streptavidin using a commercial conjugation kit (LYNX streptavidin rapid conjugation kit, Bio-Rad, Feldkirchen, Germany). For the conjugation, a molar ratio between AR and SA of 1:60 was developed. For this aim, the protein amount of the enzyme solution was measured with a microvolume spectrophotometer (NanoDropTM, ThermoFisher Scientific, Waltham, MA, USA) at 280 nm. To provide comparability of the experimental results, the enzyme’s acetoin reduction activity before and after SA conjugation was quantified in 10 mM Tris-HCl + 150 mM NaCl + 10 µM ZnSO4 with 10 mM acetoin and 0.3 mM NADH as substrates at pH 7.4 by photometric analysis (Ultrospec 2100 pro, biochrom, Holliston, MA, USA). Three different SA-AR activities (330, 680, and 1200 Units/mL) were used for the modification of the TMV-assisted EISCAPs.
2.3. Preparation of EISCAPs and Modification with TMVCysBio and SA-AR
The fabrication procedure of the EISCAPs is described in detail in e.g., [
30,
31]. Briefly, a 380 µm thick p-doped Si wafer (<100> orientation, 1–5 Ωcm, Siegert Wafer GmbH, Aachen, Germany) was oxidized in dry oxygen atmosphere at 1000 °C for 30 min to grow a 30 nm SiO
2 layer. Afterwards, 30 nm Ta was deposited via electron-beam evaporation onto the SiO
2 layer and subsequently oxidized in oxygen atmosphere at 520 °C for 60 min in order to achieve an approximately 60 nm thick Ta
2O
2 layer. During the oxidation of the Si an unwanted SiO
2 film was formed on the rear side of the wafer, which was removed by etching it with hydrofluoric acid, followed by the depostion of an Al layer of ca. 300 nm by means of electron-beam evaporation. Finally, the wafer was tempered in N
2 atmosphere at 400 °C and cut into 1 × 1 cm
2 EISCAP sensor chips.
Prior to modification with TMV
CysBio particles and SA-AR, the sensor chips were cleaned in an ultrasonic bath for 5 min each in acetone, isopropanol, ethanol, and deionized water. After that, they were dried with N
2 and mounted into a purpose-built measurement chamber. Here, the EISCAP was sealed with an O-ring on top of the Ta
2O
5-gate transducer as depicted in
Figure 1a. Resulting from this, 0.5 cm
2 of the Ta
2O
5 surface was accessible for the TMV
CysBio, SA-AR, and analyte solution.
For the immobilization of TMVCysBio particles on the Ta2O5-gate-transducer surface, 50 µL of a 0.1 mg/mL TMVCysBio solution was dispensed via drop-coating on the sensor surface and incubated for one hour at room temperature. Afterwards, the sensor surface was washed three times with buffer solution (10 mM Tris-HCl + 150 mM NaCl + 250 µM ZnSO4) to remove non-immobilized virus particles. Subsequently, 50 µL of the SA-AR solution (containing 330, 680, or 1200 Units/mL SA-AR) were drop-coated on the TMV-modified Ta2O5 surface and incubated at 4 °C overnight. Thereafter, the sensor surface was rinsed with measurement buffer (0.2 mM Tris-HCl (pH 7.1, for acetoin measurements) or 0.2 mM MES-NaOH (pH 6.0, for diacetyl measurements) containing 150 mM NaCl and 500 µM NADH). Prior to the electrochemical experiments, the sensor was conditioned in the measurement solution for at least one hour.
2.4. Measurement Principle and Electrochemical Characterization of EISCAPs
Capacitive field-effect sensors are sensitive to changes in the local pH value close to the Ta
2O
5-gate transducer surface. A change in the H
+ ion concentration, e.g., induced by enzymatic reactions, alters the surface charge of the Ta
2O
5 layer, whereby the width of the space-charge region in the p-Si at the SiO
2 interface is changed, and the overall capacitance of the EISCAP is thereby influenced. The operational principle of EISCAPs has been previously described in detail in [
32,
33].
The AR catalyzes three reactions (see
Figure 1b): (1) the reduction of diacetyl to (
R)-acetoin; (2) the reduction of racemic ((
R)- and (
S)-) acetoin to (
R,
R)- and
meso ((R,
S))-2,3-butanediol; and (3) the oxidation of (
R,
R)-butane-2,3-diol to (
R)-acetoin. In reactions (1) and (2), NADH, which serves as a co-substrate, is oxidized to NAD
+ and H
+ ions are consumed, resulting in local pH increase. In reaction (3), NAD
+ is reduced to NADH, and a local pH decrease occurs [
15]. The magnitude of each enzymatically-induced pH change corresponds to the local substrate concentration. Consequently, the change in EISCAP capacitance is correlated with the local acetoin and diacetyl concentration, respectively.
The EISCAPs were electrochemically characterized by leakage–current, C-V, and ConCap measurements. Therefore, an Ag/AgCl reference electrode (Metrohm, Filderstadt, Germany) was immersed in the buffer solution and connected to an impedance analyzer (Zahner Zennium, Zahner Elektrik, Kronach, Germany). The rear side of the Al was likewise electrically connected with the impedance analyzer. The measurements were conducted in a dark Faraday cage to avoid interferences. Leakage–current measurements of the EISCAPs were performed in Titrisol® buffer (pH 7), Tris-HCl (0.2 mM Tris-HCl + 150 mM NaCl + 500 µM NADH, pH 7.1) or MES-NaOH (0.2 mM MES-NaOH + 150 mM NaCl + 500 µM NADH, pH 6.0) buffer solution, which served as a quality control for the oxide–insulator layer. The measurements were performed by varying the gate voltage applied to the reference electrode between −3 V and +3 V in 100 mV steps. Only EISCAPs having a leakage current < 10 nA were used for further electrochemical studies.
Afterwards, C-V measurements were performed in Titrisol
® (pH 7), Tris-HCl or MES-NaOH buffer in order to verify the accurate functioning of the EISCAP and to define the working point for the following ConCap measurements. To this end, gate voltages between −2 V and +2 V were applied in 100 mV steps. Additionally, a small AC (alternating current) voltage of 20 mV with a frequency of 120 Hz was superimposed to measure the capacitance of the EISCAP. During the subsequent ConCap measurements, the capacitance of the EISCAP was set to a constant value by means of a feedback control loop. For this purpose, the operating point was set at approximately 60% of the maximum capacitance in the depletion region of the previously recorded C-V curve. Here, pH-dependent shifts in the measurement curve are particularly well recognizable and can be detected dynamically over time: Changes in the gate surface charge are compensated by applying opposite voltages to the reference electrode. These voltage changes correspond to the sensor signal. Thus, in case of an increasing pH value (decreased H
+ ion concentration), the measurement curve is shifted towards more positive (less negative) voltages, and in case of decreasing pH values (increased H
+ ion concentration), the measurement curve is shifted towards more negative or less positive voltages. For the AR-modified TMV-assisted EISCAP, a shift in the sensor signal towards positive voltages can be expected if diacetyl and/or acetoin are present in the analyte solution (see
Figure 1c).
3. Results and Discussion
3.1. Characterization of Bare EISCAPs
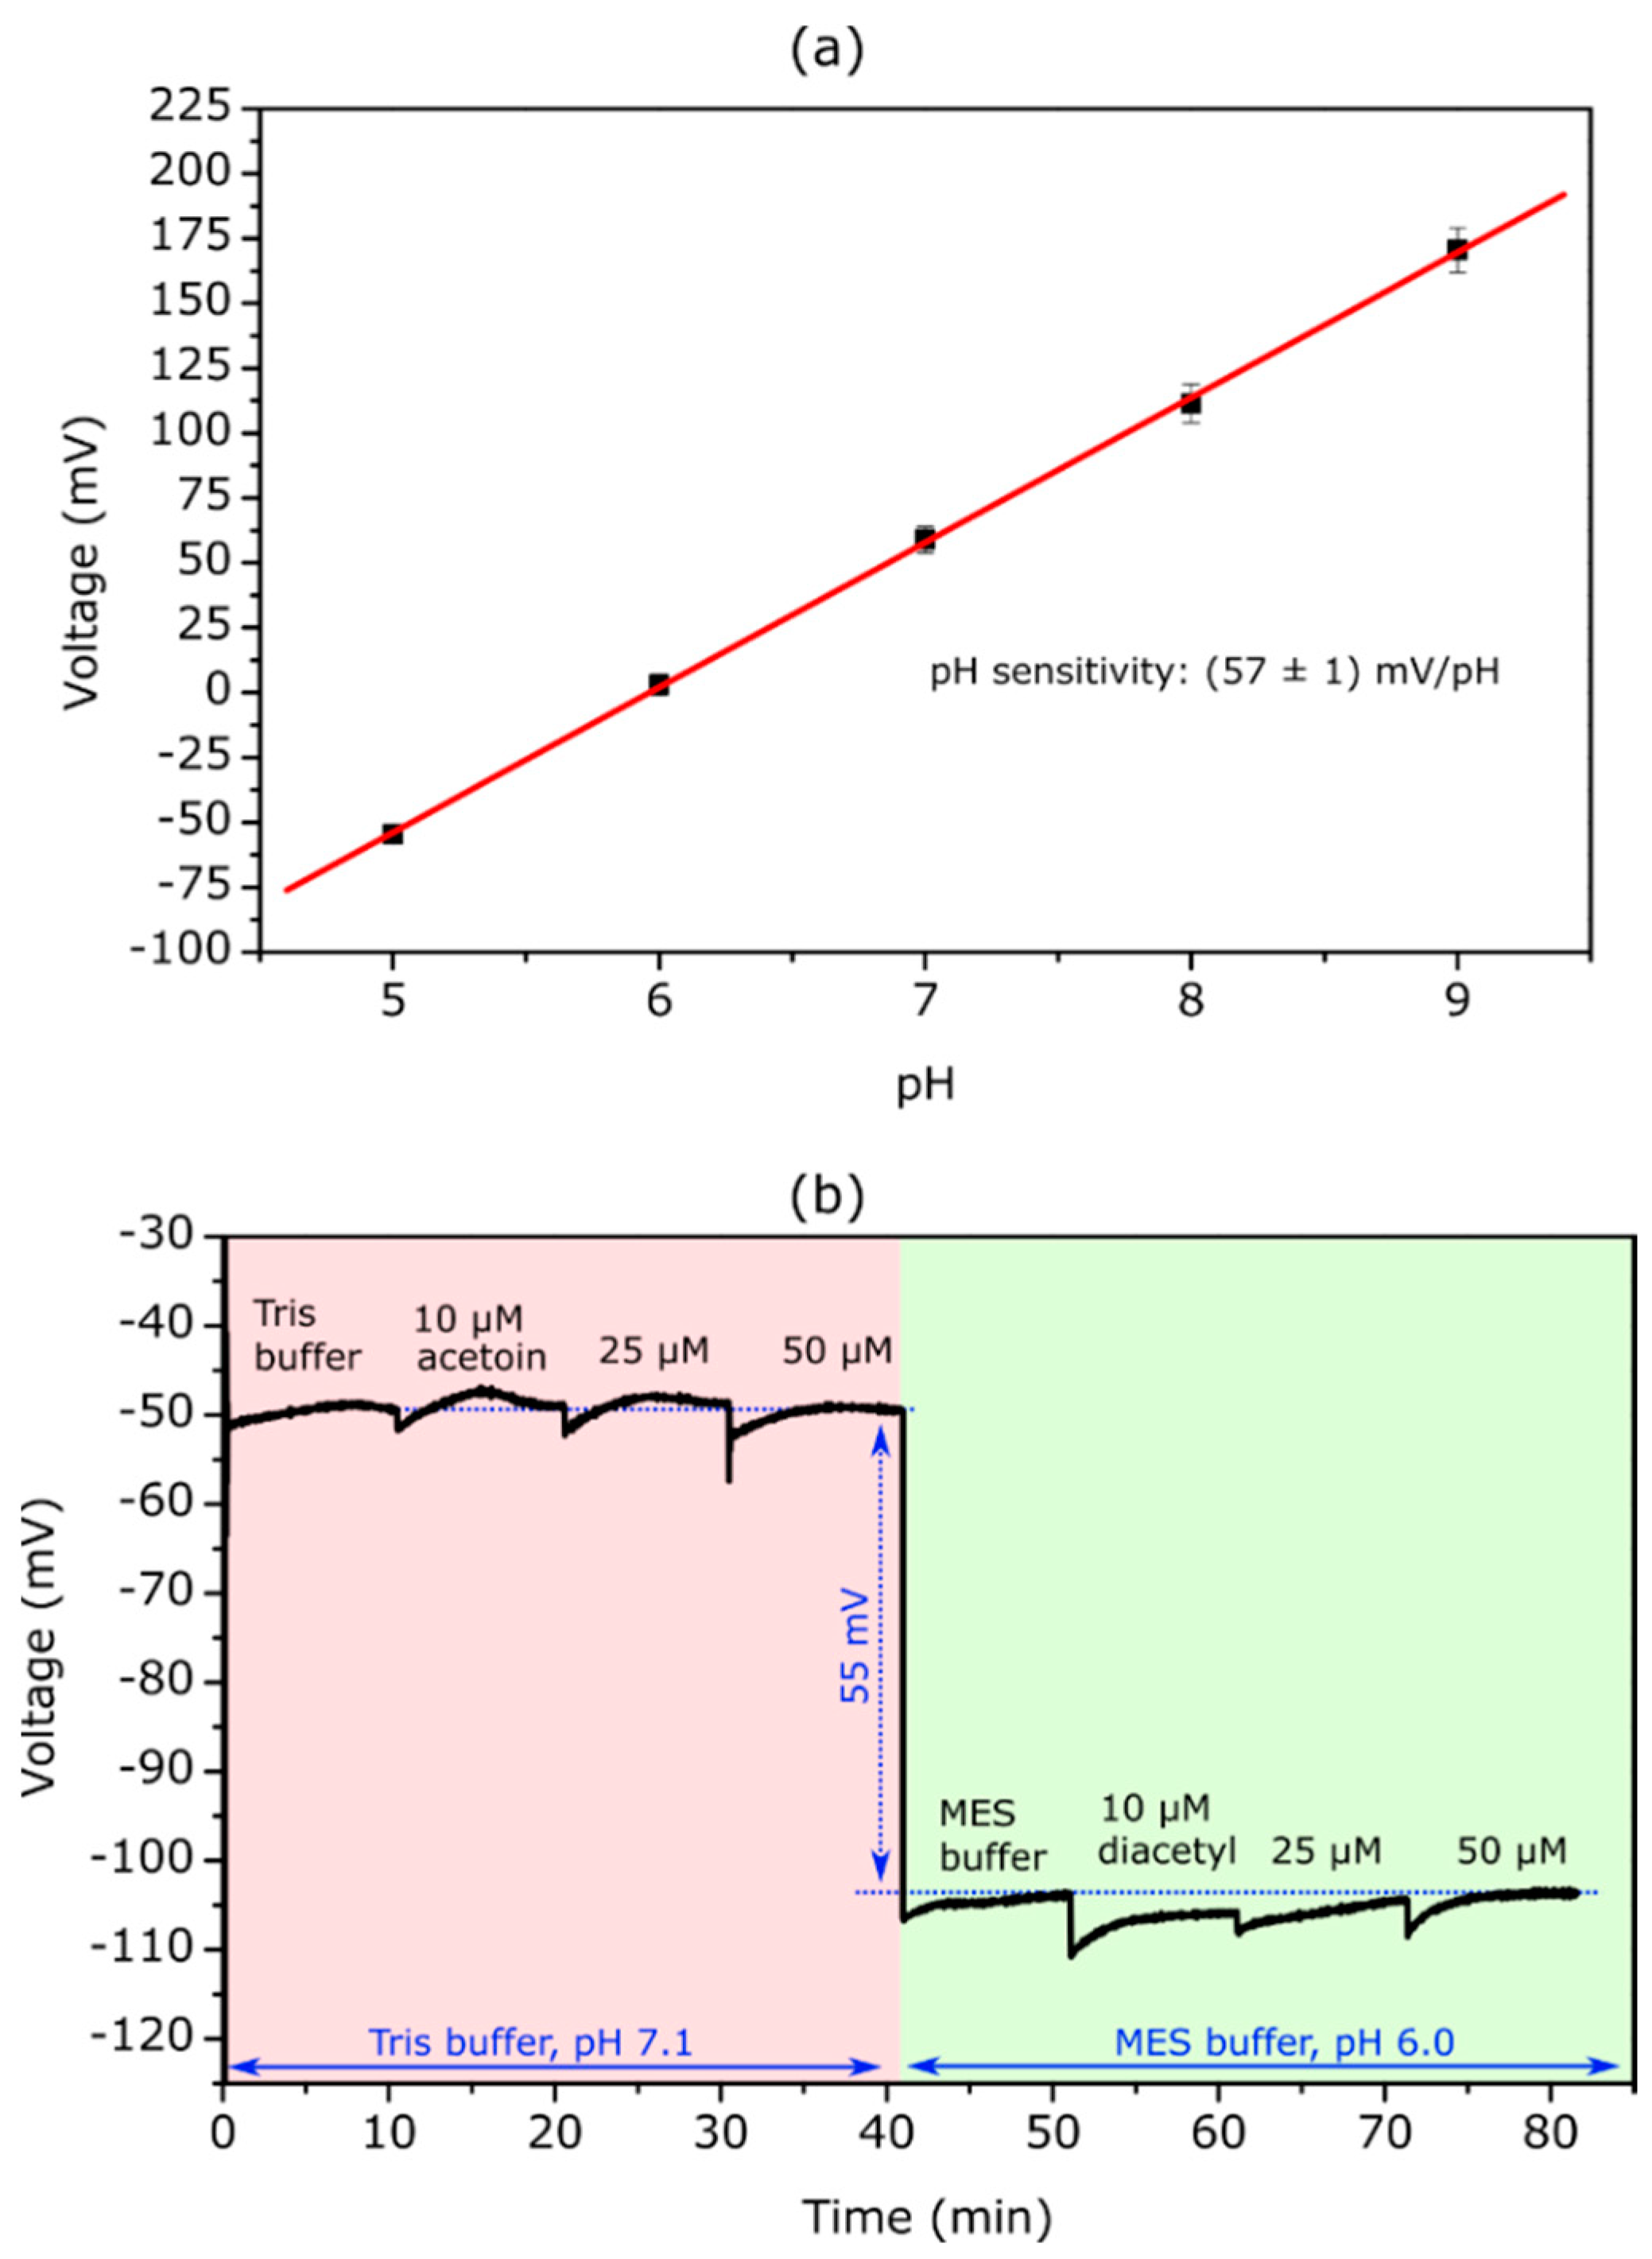
Before measurements with TMV-assisted EISCAPs, the bare EISCAPs were electrochemically characterized. C-V and ConCap measurements were performed in Titrisol® buffer with varying pH values from pH 4 to pH 9 to determine the pH sensitivity.
From the recorded ConCap curves (n = 3), the mean calibration curve was evaluated, which is depicted in
Figure 2a. The bare EIS sensors show a mean pH sensitivity of (57 ± 1) mV/pH, which is in good agreement with sensitivities discribed in literature [
33].
For measurements with TMV-assisted diacetyl and acetoin EISCAPs, it is important that the concentration-dependent sensor–signal shift is only induced by the enzymatic reaction catalyzed by the AR. The bare EISCAP should not react to different acetoin and diacetyl concentrations in the measurement solutions. To prove this, ConCap measurements were carried out in Tris-HCl buffer solution (0.2 mM Tris-HCl + 150 mM NaCl + 500 µM NADH, pH 7.1) containing different acetoin concentrations and in MES-NaOH buffer (0.2 mM MES-NaOH + 150 mM NaCl + 500 µM NADH, pH 6.0) containing different diacetyl concentrations. The recorded ConCap curve is presented in
Figure 2b. In the first part, the measurement was conducted in Tris-buffer (pH 7.1) while increasing acetoin concentration from 10 µM to 50 µM. The sensor signal stays at its initial value, underlining that the bare EISCAP does not react to different acetoin concentrations. In the second part, the measurement was continued in MES buffer (pH 6.0) with diacetyl concentrations ranging from 10 µM to 50 µM. When changing the buffer solution from Tris to MES buffer the sensor signal decreases by 55 mV due to the different pH values, which correlates well with the previously-determined pH sensitivity of 57 mV/pH. The measurement signal remains almost stable in the MES buffer with different diacetyl concentrations, proving that the bare EISCAP does not react to different diacetyl concentrations.
3.2. Acetoin Detection with TMV-Assisted EISCAPs
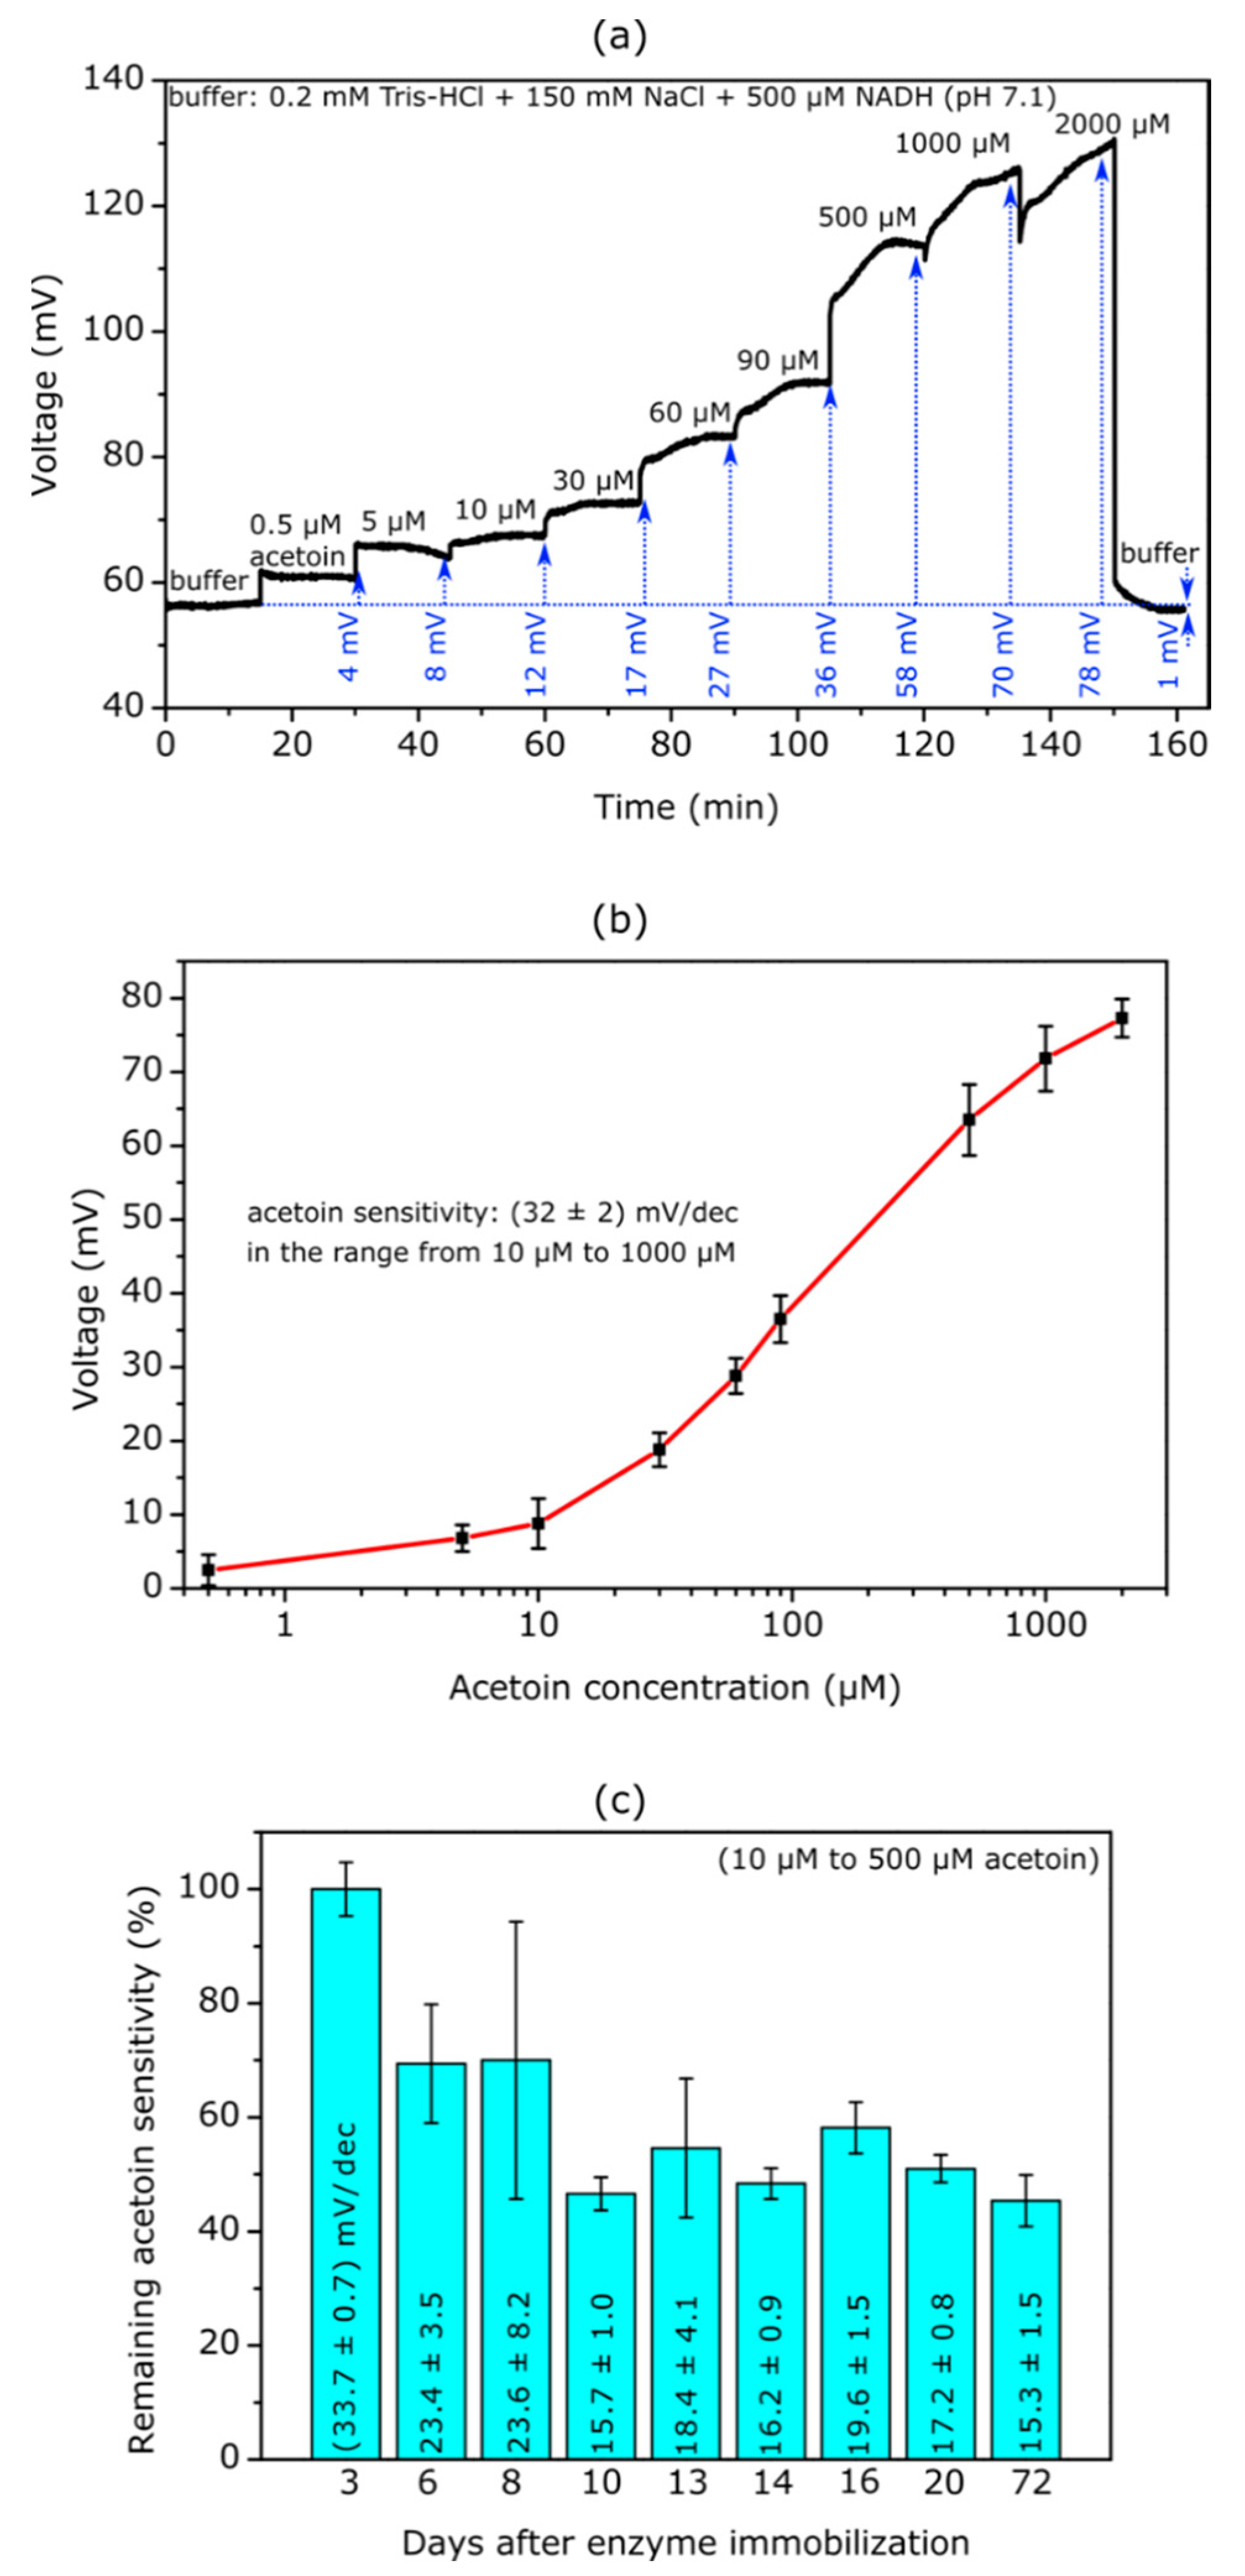
In a first step, the TMV-assisted EISCAPs were characterized regarding their acetoin sensitivity. For this purpose, ConCap measurements with four individual biosensors (modified with 330 Units/mL SA-AR) were conducted in Tris-HCl buffer solution (0.2 mM Tris-HCl + 150 mM NaCl + 500 µM NADH, pH 7.1) with acetoin concentrations ranging from 0.5 µM to 2000 µM. A pH of 7.1 was selected, as this is the pH optimum of immobilized AR for acetoin detection [
13]. An exemplary measurement curve is depicted in
Figure 3a.
The curve reveals clear signal shifts towards more positive voltage values for all concentration steps, starting with the lowest concentration of 0.5 µM acetoin. The immobilized AR catalyzes the conversion of acetoin to butane-2,3-diol, resulting in a local pH increase at the Ta2O5-gate surface. The surface becomes more negatively charged, which is compensated for by a more positive voltage applied to the reference electrode and appears as a shift in the measurement curve. At higher concentrations of 1000 µM and 2000 µM, a drift of the sensor signal towards more positive voltages is recognizable, and it takes longer for a stable signal to be achieved. However, it should be noted that the acetoin concentration is two (1000 µM) or four (2000 µM) times higher than the concentration of the cosubstrate NADH (500 µM), which could lead to reduced enzymatic conversion of acetoin to butane-2,3-diol. Thus, by increasing the NADH concentration, the detection of even higher acetoin concentrations should be possible.
To check the reversibility of the acetoin biosensor, the measurement in Tris-HCl buffer without acetoin was repeated. The sensor signal returned directly back to lower voltage values and reached its initial voltage after approximately 5 min, highlighting the fast recovery time of the biosensor.
The mean calibration curve as evaluated from four ConCap measurements is illustrated in
Figure 3b. The curve exhibits a typical sigmoidal shape with a linear concentration range between 10 µM and 1000 µM, having a mean acetoin sensitivity of (32 ± 2) mV/dec. In our previous work, where the acetoin reductase was immobilized by means of cross-linking, a somewhat higher acetoin sensitivity was achieved in buffer solution [
13]; however, the detectable concentation range was limited to a rather narrow region from 10 µM to 90 µM.
As a next step, the long-term stability of the TMV-assisted acetoin biosensor was studied. ConCap measurements were performed on a regular basis over a time period of 72 days. Between measurements, the biosensors were stored in 10 mM Tris-HCl + 150 mM NaCl + 10 µM ZnSO
4 at 4 °C. The bar chart diagram in
Figure 3c presents the acetoin sensitivities detected at the different measurement days between day 3 and day 72 after enzyme immobilization. The acetoin sensitivity was calculated for the concentration range between 10 µM and 500 µM. The sensitivity of (33.7 ± 0.7) mV/dec for the first measurement at day 3 was set as 100%. At day 6 and 8, the sensitivity decreased to ~70% of the initial sensitivity. Scanning electron microscopy images revealed that the TMV particles were homogeneously distributed on the sensor surface, with bare Ta
2O
5 areas in between (data not shown). In our previous studies, similar immobilization behaviour was observed with the enzymes penicillinase and urease [
19,
27,
31,
34]. The sensitivity decrease at day 6 might hint at detachment of non-specifically bound enzymes on the bare Ta
2O
5 surface between the immobilized TMV particles. Between the fourth and ninth measurement (at day 10 and day 72), the TMV-assisted acetoin EISCAPs showed a slightly fluctuating remaining acetoin sensitivity of 46–58%. This long-term stability of at least 72 days represents a substantial improvement over acetoin biosensors where the enzyme was immobilized via crosslinking, which showed a long-term stability of 5 days [
13] and 21 days [
14], respectively.
In future studies, long-term stability might be further enhanced by increasing the density of immobilized TMV particles on the Ta
2O
5-transducer surface. One strategy could be to utilize the layer-by-layer immobilization technique with a positively charged polyelectrolyte (inter-)layer. Because TMV
CysBio particles are negatively charged, an additional electrostatic repulsion between them and the likewise negatively charged Ta
2O
5 could reduce the number of adsorbed virus particles [
34]. A positively charged polyelectrolyte layer might therefore lead to an electrostatic attraction of the TMV particles, resulting in a higher TMV density. In this way, the unspecific adsorbtion of the AR to the Ta
2O
5 surface should be reduced.
3.3. Diacetyl Detection with TMV-Assisted EISCAPs
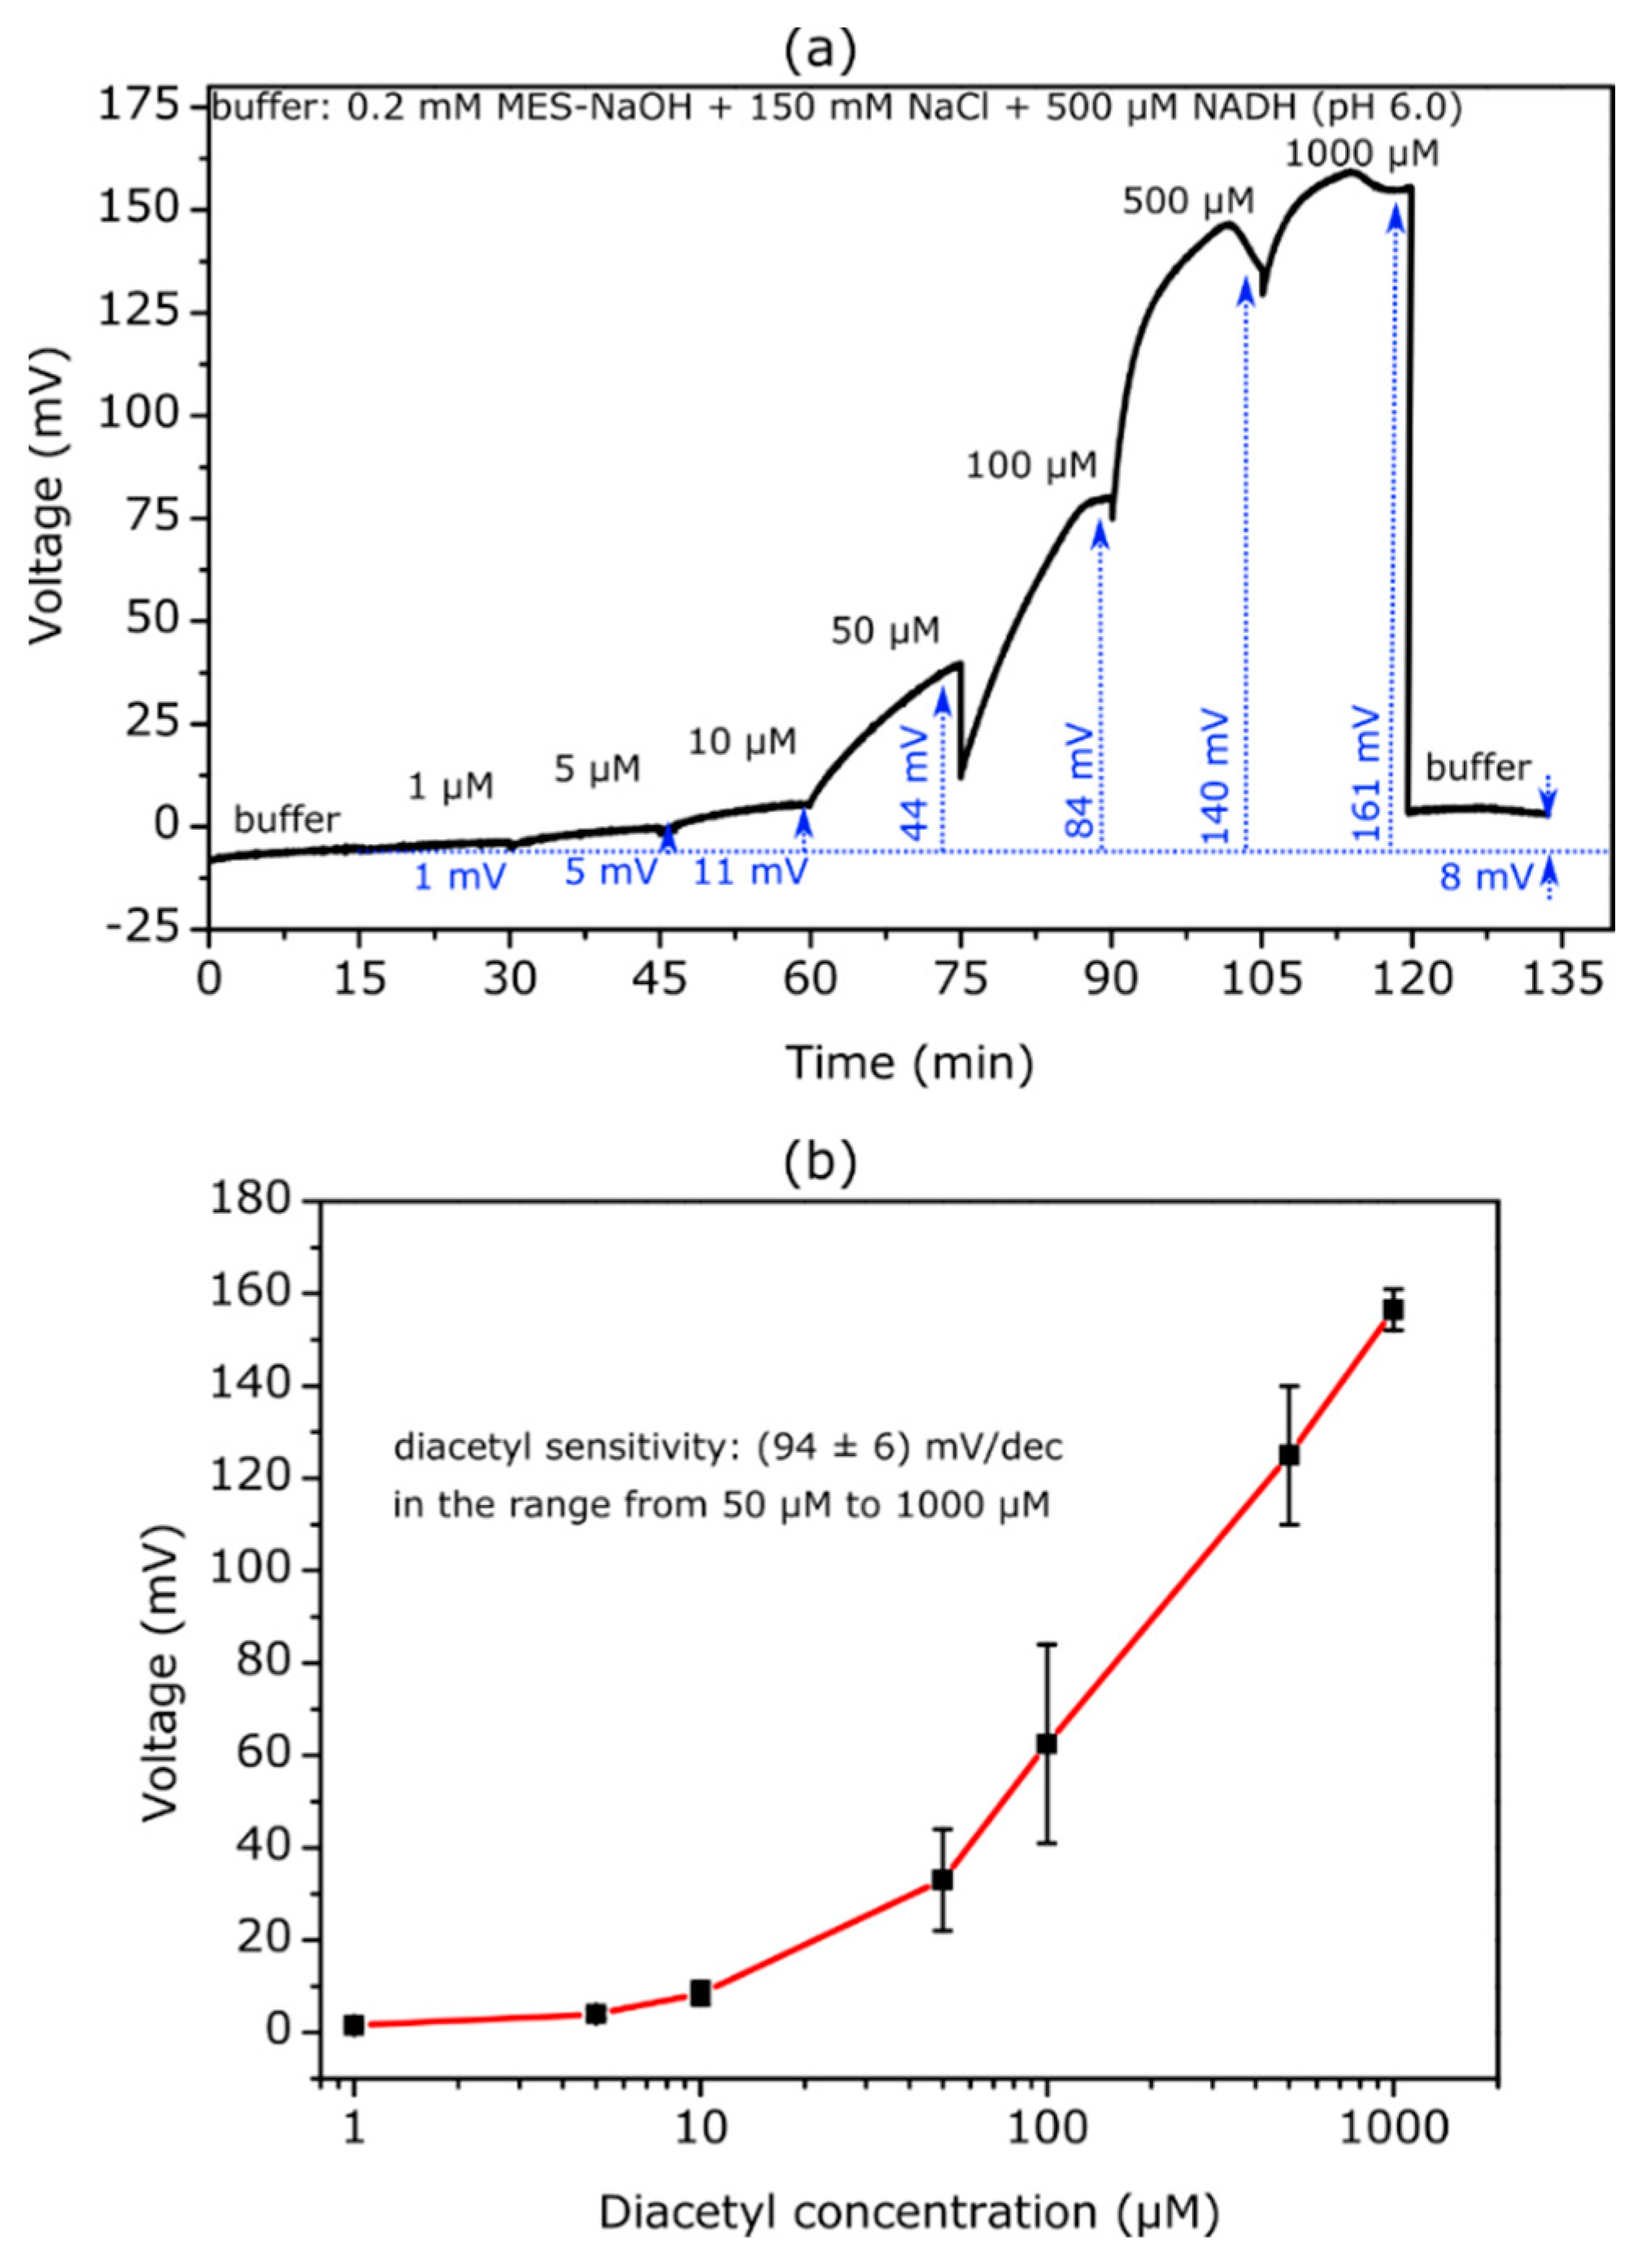
To the best of our knowledge, this is the first time that TMV-assisted EISCAPs have been applied for the detection of diacetyl. For this purpose, the biosensors were manufactured in the same way as those for the acetoin measurements. Each sensor was modified with an SA-AR activity of 330 Units/mL. The electrochemical ConCap measurements were carried out in MES-NaOH buffer (0.2 mM MES-NaOH + 150 mM NaCl + 500 µM NADH) at pH 6.0, representing the pH optimum for the reduction of diacetyl [
15]. The diacetyl concentration was varied between 1 µM and 1000 µM. An exemplary ConCap measurement is depicted in
Figure 4a. The first clear signal shift of 5 mV towards more positive voltages can be recognized at a diacetyl concentration of 5 µM. With further increases in concentration up to 1000 µM, the signal shift becomes higher. When measuring again in MES-NaOH buffer solution without diacetyl the sensor signal decreases directly to less positive voltages, with a relatively low hysteresis of 8 mV.
It is noticeable that the signal amplitude for diacetyl is significantly higher than for the corresponding acetoin concentration (compare
Figure 3a). As an example, the signal shift corresponding to 500 µM diacetyl amounts to 140 mV, while the signal shift for 500 µM acetoin is 58 mV. This can be explained by the fact that AR catalyzes both the reduction of diacetyl to (
R)-acetoin and the reduction of acetoin to butane-2,3-diol (see
Figure 1b). Here, a two-step reaction takes place. First, diacetyl is converted to (
R)-acetoin, which already consumes H
+ ions and increases the local pH. The formed (
R)-acetoin is then reduced to butane-2,3-diol, resulting in a further pH increase.
Nevertheless, at higher concentrations of 500 µM and 1000 µM, the sensor signal shows a slight decrease after a certain measurement time. This behavior might be explained by the fact that the AR additionally catalyzes the oxidation of 2,3-butanediol to (
R)-acetoin. With higher diacetyl concentrations, more acetoin and butane-2,3-diol is produced. After a time, the butane-2,3-diol concentration reaches such a high level that the reverse reaction occurs: 2,3-butanediol is oxidized to
®-acetoin, whereby NAD
+ is reduced to NADH and H
+ ions are released. In addition, the conversion of diacetyl and acetoin shifts the local pH towards higher pH values, and thus closer to the pH optimum for butane-2,3-diol oxidation of pH 8.0 [
15]. Moreover, at higher pH values the catalytic activity of the AR for diacetyl and acetoin is substantially reduced. The TMV-assisted diacetyl EISCAP revealed a high diacetyl sensitivity of (94 ± 6) mV/dec in the concentration range of 50 µM to 1000 µM, as represented in the mean calibration curve in
Figure 4b.
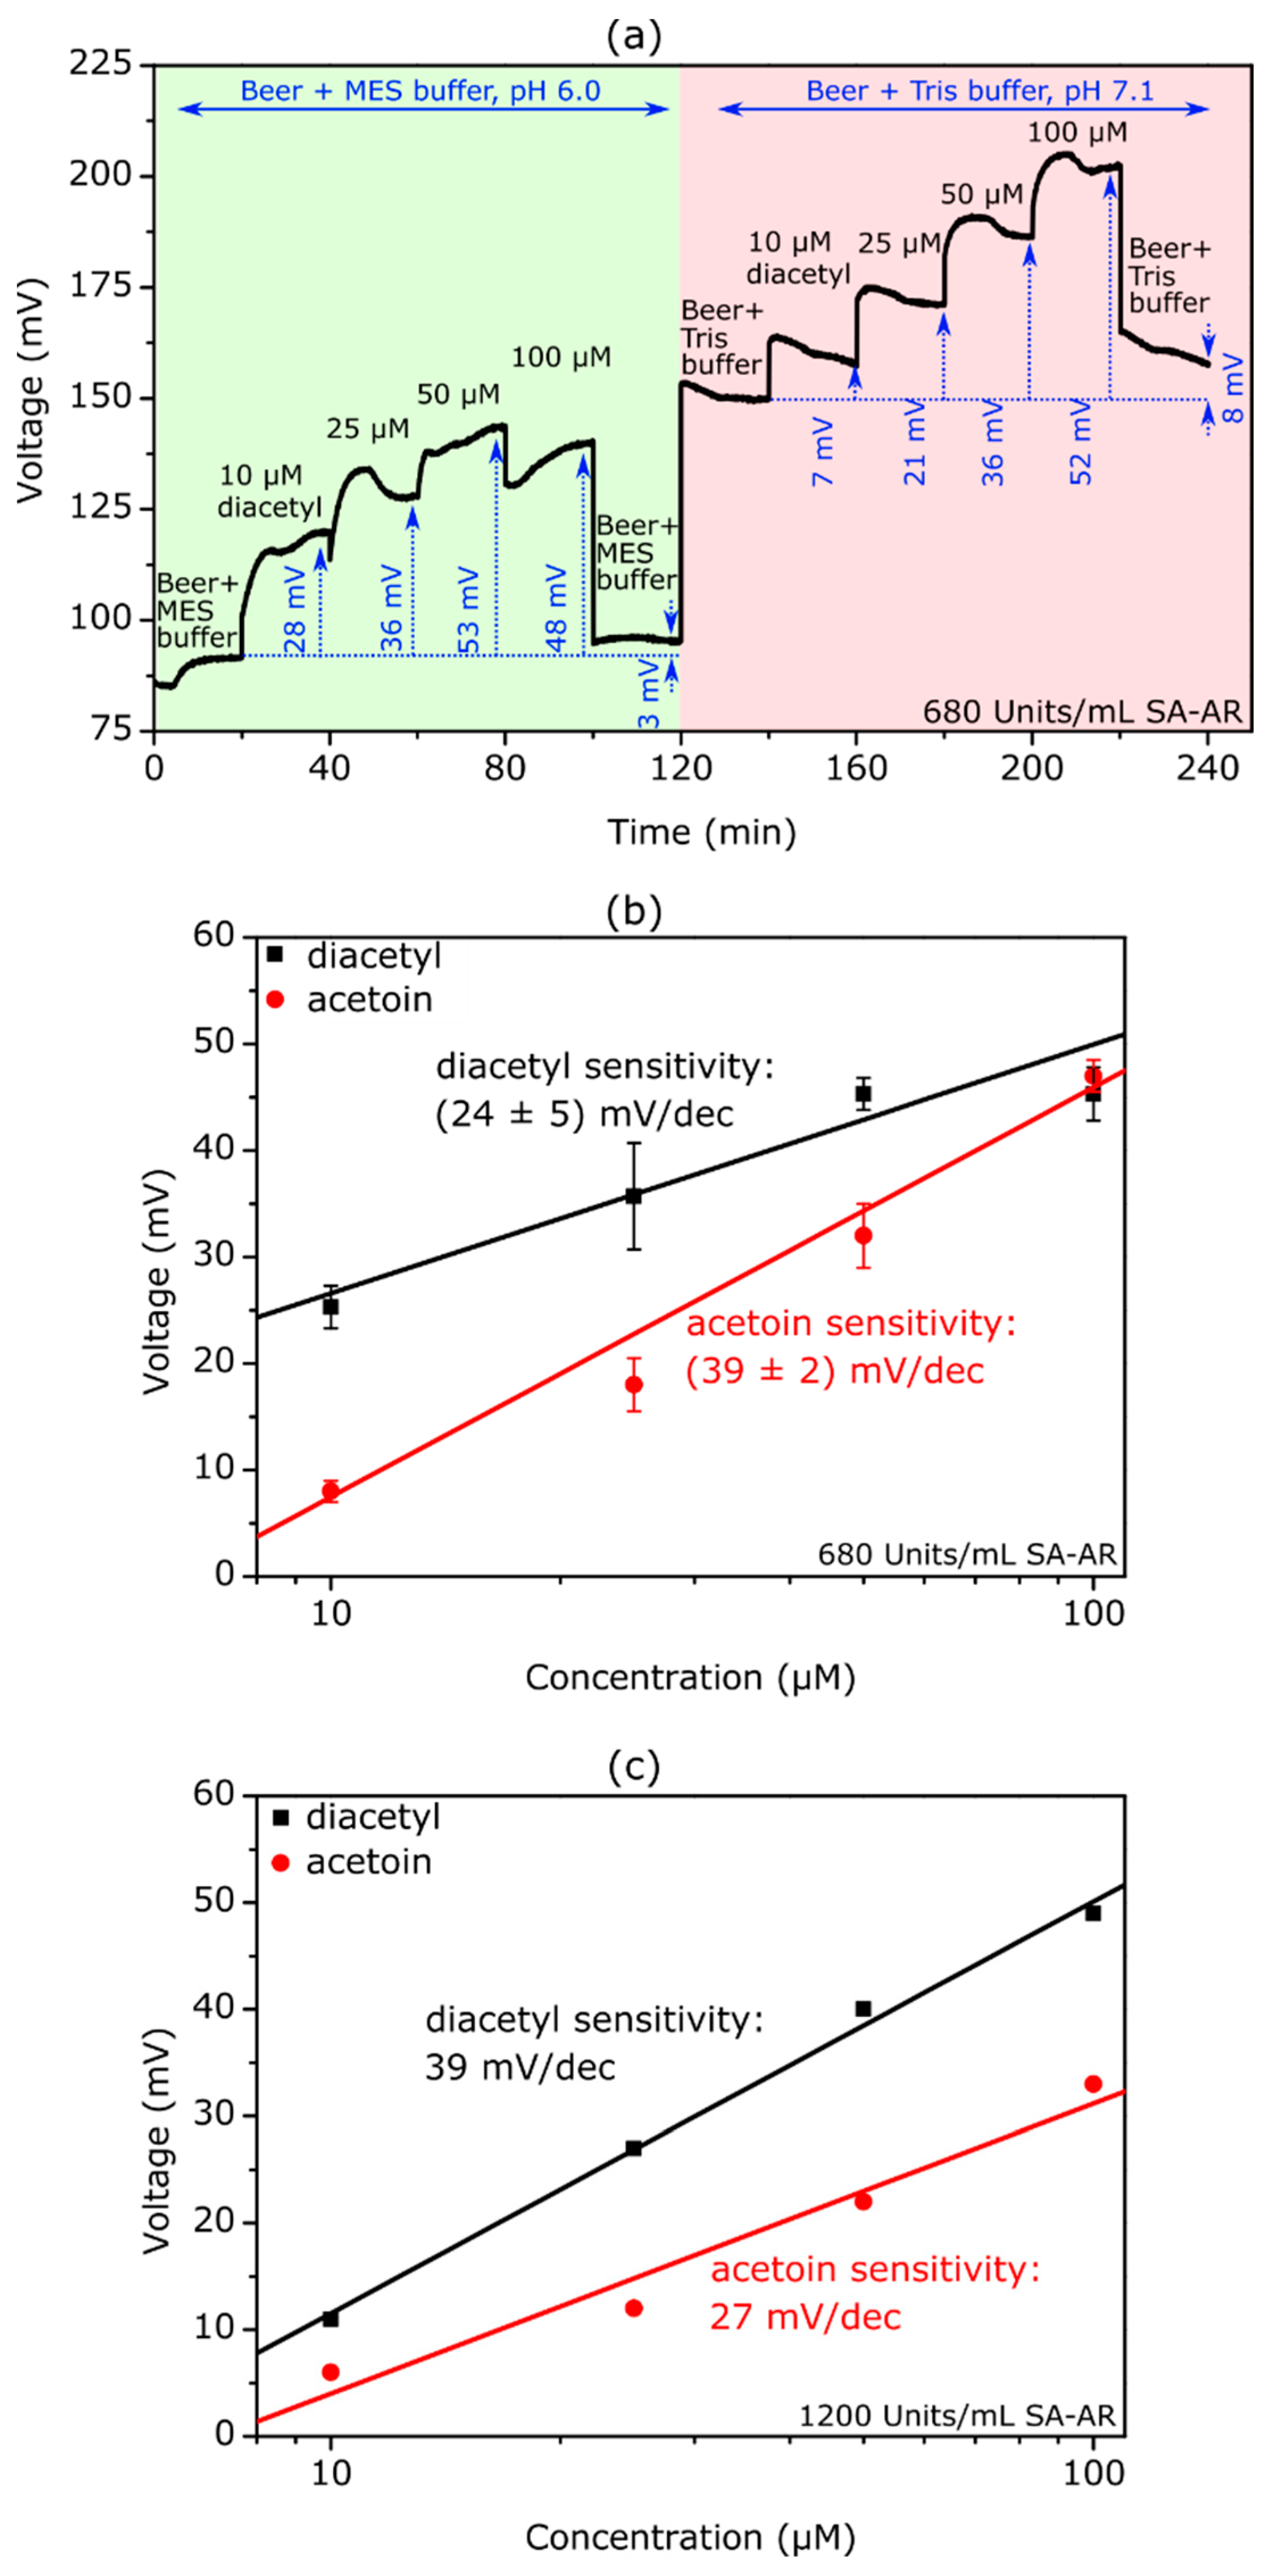
In order to investigate whether the signal amplitude for low diacetyl concentrations could be improved, TMV-assisted diacetyl EISCAPs were prepared with 680 Units/mL and 1200 Units/mL SA-AR, respectively, and the ConCap measurements were repeated. It was found that the signal change could be significantly increased for low diacetyl concentrations (e.g., 23 mV (680 Units/mL) and 34 mV (1200 Units/mL SA-AR) for 10 µM diacetyl). Nevertheless, it could be seen that with increasing enzyme activity the sensor signal at higher diacetyl concentrations stagnated or even decreased. ConCap measurements for the EISCAPs with 680 Units/mL SA-AR and 1200 Units/mL SA-AR can be found in the
Supplementary Materials (Figure S1). Because the detection of low diacetyl concentrations is of particular interest with regard to subsequent practical studies investigating its detection in beer and wine, the SA-AR activities of 680 Units/mL and 1200 Units/mL were used for the following experiments.
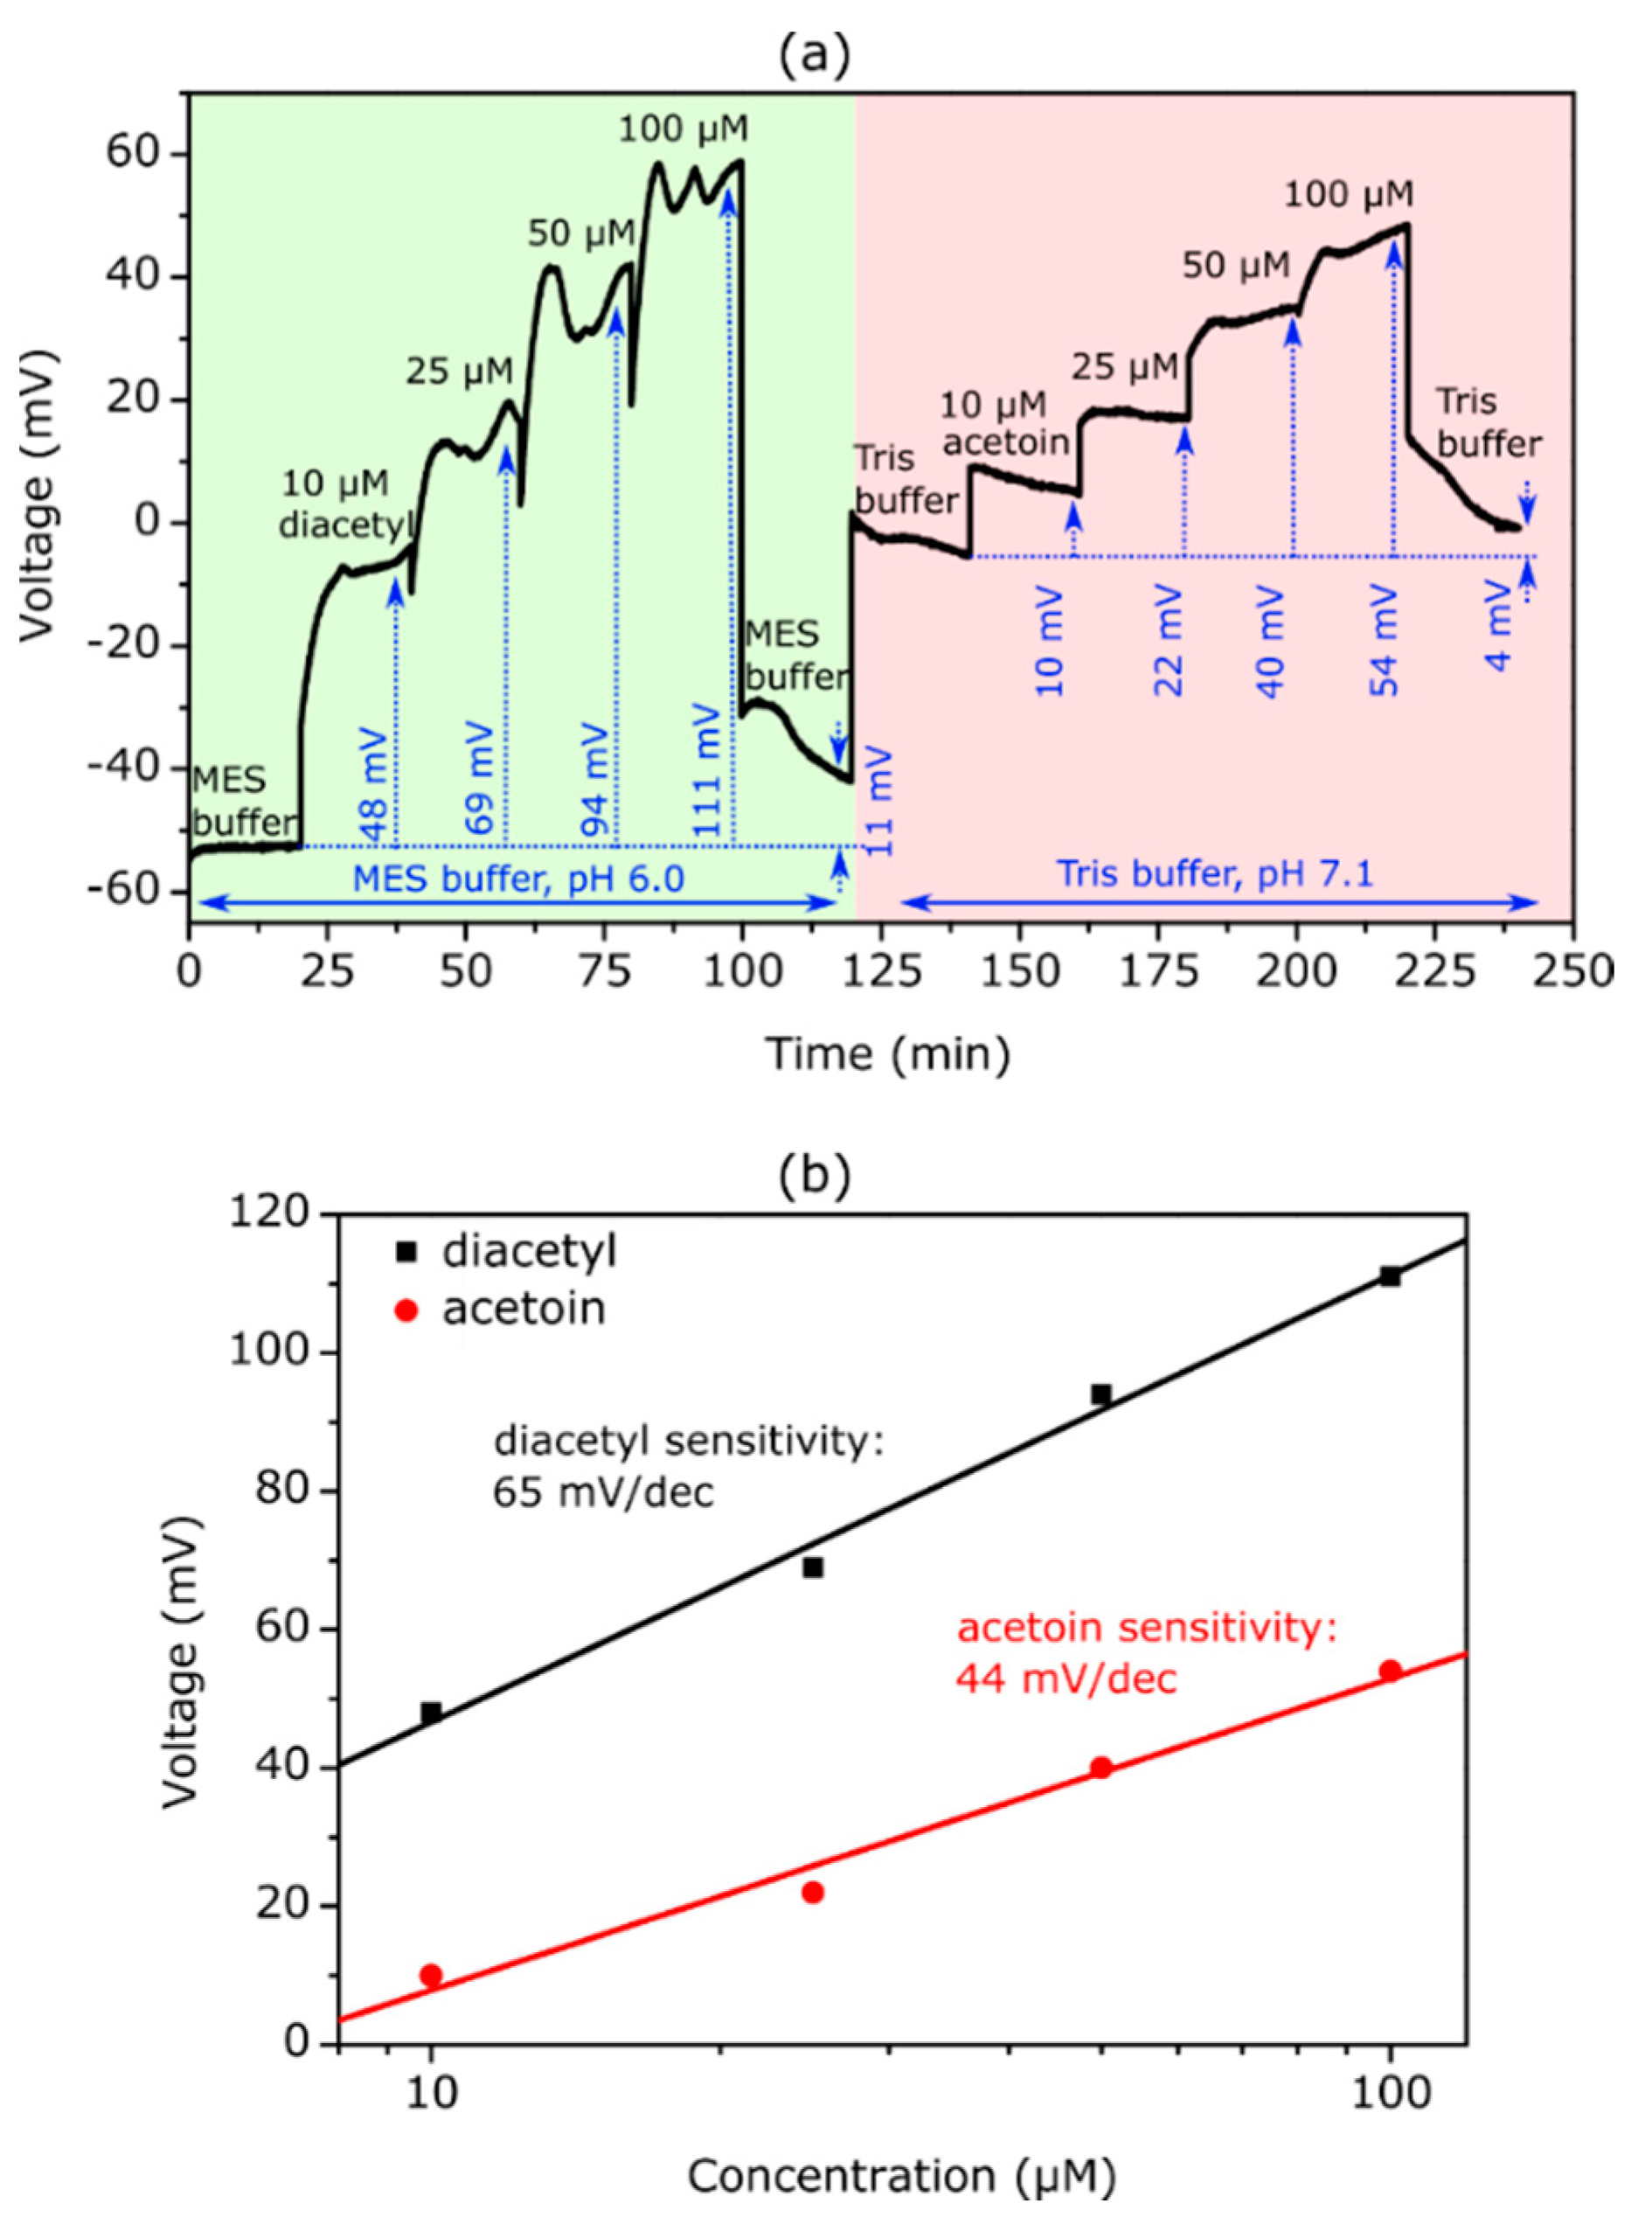
3.4. Detection of Acetoin and Diacetyl with the Same TMV-Assisted EISCAP
Diacetyl and acetoin are particularly important in brewing process technology. Therefore, it is of great advantage to detect both substances with the same sensing platform. ConCap measurements were performed in buffer solutions containing diacetyl and acetoin using the same TMV-assisted EISCAP immobilized with 1200 Units/mL SA-AR.
Figure 5a represents a typical ConCap measurement curve recorded with a TMV-assisted EISCAP biosensor for the simultaneous detection of diacetyl and acetoin. First, diacetyl was monitored in MES-HCl buffer (0.2 mM MES-NaOH + 150 mM NaCl + 500 µM NADH, pH 6.0) with diacetyl concentrations varying from 10 µM to 100 µM. After that, acetoin measurements were performed in Tris-HCl buffer (0.2 mM Tris-HCl + 150 mM NaCl + 500 µM NADH, pH 7.1) with different acetoin concentrations, again ranging from 10 µM to 100 µM.
During the first 20 min, the signal was recorded in MES-NaOH buffer without diacetyl; thereafter, the measurement was continued in solutions with different diacetyl concentrations from 10 to 100 µM diacetyl, followed by a measurement in buffer solution again. Afterwards, the measurement was continued in Tris-HCl buffer, where the acetoin concentration was again increased every 20 min. At the end, between minute 220 and 240, the measurement was again recorded in buffer solution without acetoin. The sensor signal shifted into the direction of more positive (less negative) voltages with each diacetyl concentration step, and returned to more negative voltages when measuring again in buffer solution containing no diacetyl. When the buffer solution was changed from MES-NaOH (pH 6.0) to Tris-HCl (pH 7.1), the baseline signal (indicated as a blue dotted line) increased by about 58 mV, which is in good agreement with the pH difference of 1.1 and the mean pH sensitivity of the bare Ta
2O
5-EISCAPs of 57 mV/pH [
35,
36]. For acetoin detection, the sensor signal again shifted towards more positive voltages with each concentration increase and declined to less positive voltages when re-measured in buffer solution without acetoin.
The calibration plots evaluated from the exemplary ConCap measurement are illustrated in
Figure 5b. The diacetyl and acetoin sensitivity of the biosensor was 65 mV/dec and 44 mV/dec, respectively. In total, three individual TMV-assisted EISCAPs were electrochemically characterized, as shown in
Figure 5a. The mean diacetyl and acetoin sensitivity of these biosensors amounted to (68 ± 24) mV/dec and (44 ± 1) mV/dec in the concentration range from 10 µM to 100 µM diacetyl and acetoin, respectively. The relatively high standard deviation of the diacetyl sensitivity reveals that the reproducibility of the diacetyl sensor could be further improved in future studies.
3.5. Acetoin and Diacetyl Detection in Beer Samples
To determine whether the TMV-assisted EISCAPs are suitable for acetoin and diacetyl detection in real samples, ConCap measurements were performed in beer samples. For this purpose, Bitburger Premium Pils (Bitburg, Germany) was diluted with buffer solution in a ratio of 1:20 (see
Figure 6).
This was due to the high buffer capacity of beer, which would impair the detection of local enzyme-induced pH changes at the sensor surface [
14]. For the detection of diacetyl, the beer sample was diluted with MES-NaOH containing 150 mM NaCl, while for acetoin measurements the beer was diluted with Tris-HCl containing 150 mM NaCl; 500 µM NADH was added to both beer–buffer mixtures. The NADH-containing beer–buffer mixtures were spiked with different acetoin and diacetyl concentrations from 10 µM to 100 µM, respectively. The pH value was adjusted to 7.1 in the acetoin solutions and to 6.0 in the diacetyl solutions by titration with HCl and NaOH, respectively. For these measurements, TMV-assisted EISCAPs modified with 680 Units/mL SA-AR and 1200 Units/mL SA-AR were applied.
Figure 6a depicts an exemplary ConCap curve recorded with an EISCAP modified with 680 Units/mL SA-AR.
The measurement sequence was the same as for the measurements in buffer solution containing diacetyl or acetoin (
Figure 5a): First, increasing diacetyl concentrations were monitored in a beer–MES-NaOH mixture, followed by increasing acetoin concentrations in the beer–Tris-HCl mixture. A shift of the measurement signal towards more positive voltages with increasing diacetyl and acetoin concentration is visible in the beer samples. In case of the diacetyl measurements, however, there is a stagnation when changing from 50 µM to 100 µM. A contributing factor here could be the naturally present diacetyl and acetoin in the beer sample, which might have a saturation effect. Thus, for comparison, in future studies gas chromatographic measurements of the beer samples should be performed in order to determine their natural diacetyl and acetoin content.
When measuring again in a beer–MES-NaOH mixture without spiked diacetyl (i.e., in the presence of only natural diacetyl in beer), the measurement signal returns to its initial voltage value, with a low hysteresis of 3 mV, underlining the short recovery time of the TMV-assisted EISCAP in real beer samples. Again, the baseline signal (blue dotted line) shifts by about 58 mV when the measurement solution is changed from beer–MES-NaOH to a beer–Tris-HCl mixture, as with the measurements in buffer solutions. These results prove that the TMV-assisted EISCAPs maintain their sensor functionality in beer samples spiked with acetoin and diacetyl.
Figure 6b shows the mean calibration plots evaluated from ConCap measurements in diluted beer samples with three individual biosensors modified with 680 Units/mL SA-AR with a mean diacetyl sensitivity of (24 ± 5) mV/dec and a mean acetoin sensitivity of (39 ± 2) mV/dec.
Figure 6c represents the corresponding calibration curves evaluated from ConCap measurements in diluted beer samples of a TMV-assisted EISCAP modified with 1200 Units/mL SA-AR. By increasing the enzymatic activity, the diacetyl sensitivity increased to 39 mV/dec, although the acetoin sensitivity decreased to 27 mV/dec, which shows that selecting an appropriate enzyme activity has a decisive influence on overall sensor performance; this should therefore be further optimized in later works. Nonetheless, these results highlight the capability of TMV-assisted EISCAPs for the detection of acetoin and diacetyl in beer without the need for elaborate sample preparation.
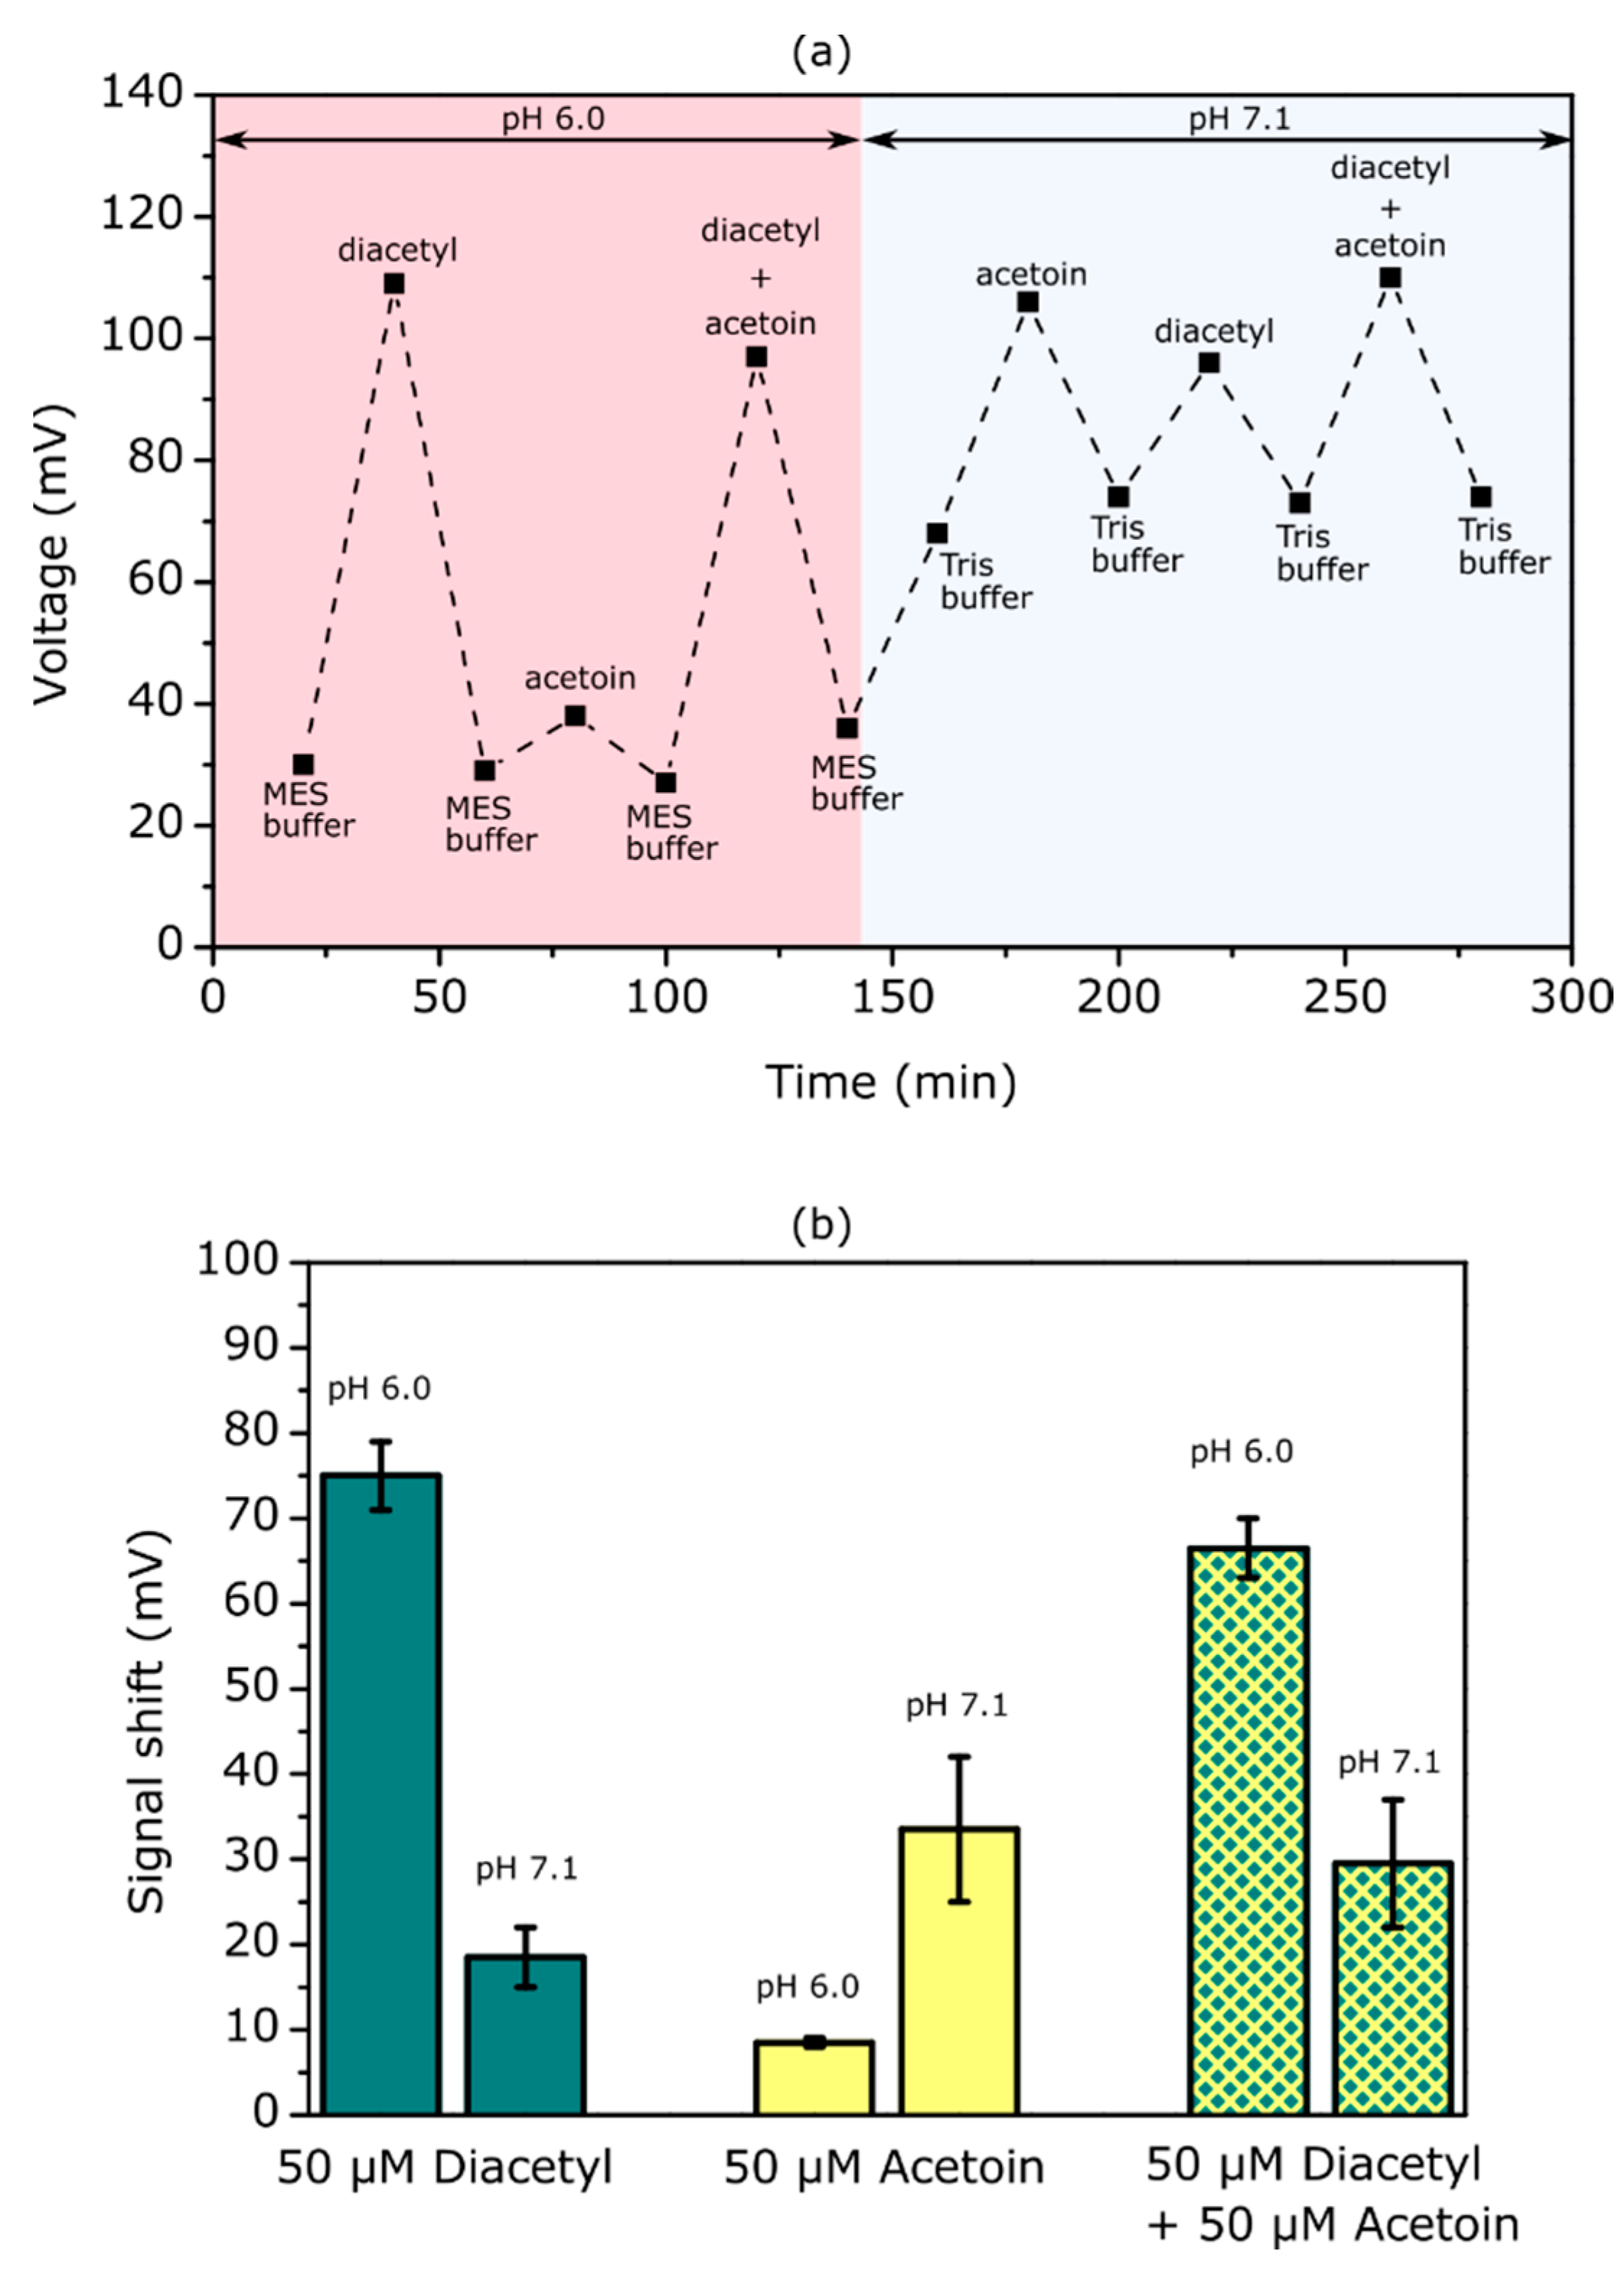
3.6. Tuning the Diacetyl and Acetoin Sensitivity via pH Adjustment
Diacetyl and acetoin are both present in beer in varying concentrations during the brewing process. As the enzyme AR converts acetoin and diacetyl and the developed biosensor is sensitive to both compounds, it should be possible to control which of the two substances is detected during the measurements under real conditions. Because this enzyme’s pH optimum for the conversion of acetoin and the conversion of diacetyl is different, the diacetyl and acetoin sensitivity can be tuned by adjusting the pH value of the beer sample.
To investigate this assumption, ConCap measurements were carried out in buffer solution containing 50 µM diacetyl, 50 µM acetoin, and 50 µM diacetyl + 50 µM acetoin at both pH 7.1 (AR-pH optimum for acetoin) and pH 6.0 (AR-pH optimum for diacetyl). For this purpose, the different acetoin and diacetyl compositions were dissolved in MES-NaOH buffer (pH 6.0) and Tris-HCl buffer (pH 7.1).
Figure 7a depicts the sensor signal results of these experiments. First, the measurement was performed in MES-NaOH buffer at pH 6.0 with a sequence of buffer -> 50 µM diacetyl -> buffer -> 50 µM acetoin -> buffer -> 50 µM acetoin + 50 µM diacetyl -> buffer. For 50 µM diacetyl the sensor signal increased by 80 mV, which is slightly lower than in the previous diacetyl measurements in buffer solution (see
Figure 5a). For 50 µM acetoin the sensor signal increased by only 9 mV, which is significantly lower than in previous measurements at pH 7.1, showing the decreased enzymatic activity of AR towards acetoin at pH 6.0. When measuring in solution containing 50 µM acetoin + 50 µM diacetyl simultaneously, the sensor signal increased by 70 mV, which is somewhat lower than for 50 µM diacetyl without acetoin. Subsequently, the measurement was continued in Tris-HCl buffer at pH 7.1 with a sequence of buffer -> 50 µM acetoin > buffer -> 50 µM diacetyl -> buffer -> 50 µM acetoin + 50 µM diacetyl -> buffer. Here, the sensor signal shifted by 38 mV at 50 µM acetoin, being ca. four times higher than in pH 6.0 buffer. The sensor signal for 50 µM diacetyl was only 22 mV at pH 7.1, which is 3.6 times lower than in pH 6.0. The sensor signal for 50 µM acetoin + 50 µM diacetyl amounted to 37 mV, which is almost equal to that of 50 µM acetoin without diacetyl.
In
Figure 7b, the mean signal shifts at pH 7.1 and pH 6.0 are presented. By changing the pH from 6.0 to 7.1, the mean sensor signal for diacetyl decreased from 75 mV to 18 mV. Accordingly, by shifting the pH from 7.1 to 6.0, the sensor signal for acetoin decreased from 34 mV to 8 mV. This means that the sensor response for acetoin and diacetyl was reduced by 75% by shifting the pH of the measurement solution away from the respective optimum [
13,
15]. On the other hand, the mean sensor signal for 50 µM diacetyl + 50 µM acetoin was 67 mV at pH 6.0 and 30 mV at pH 7.1, which is slightly lower than for 50 µM diacetyl without acetoin and for 50 µM acetoin without diacetyl. This behavior can be explained by the interaction of two competitive substrates with different affinities to the enzyme’s active site.
The achieved results underline that the sensitivity towards acetoin and diacetyl can be tailored using the pH value of the measurement solution. For the monitoring of real samples, this could be adapted by adjusting the pH of the sample to pH 6.0 if diacetyl concentration is predominant or to pH 7.1 if acetoin concentration is the focus. Moreover, experiments at different combinations of acetoin/diacetyl concentrations could be performed to generate characteristic signal patterns, similar to electronic tongues; in the future, this could enable sensors to distinguish between different mixtures.
4. Conclusions
Acetoin and diacetyl are natural byproducts in the fermentation processes of alcoholic beverages. Their concentrations depend on the fermentation point, and therefore they can serve as an indicator of how far the process has progressed. One of the main purposes of maturation in beer brewing is to lower the diacetyl content, which happens through its reduction to acetoin. Excessive diacetyl and acetoin concentrations lead to inedibility of the beer, and thus their monitoring is of crucial importance for quality control and to avoid unnecessary maturation time.
In this study, EISCAPs modified with the enzyme AR displayed on plant-harvested TMV carrier nanotubes were developed for the detection of acetoin and diacetyl and electrochemically characterized in detail. To this end, different enzyme concentrations were utilized for bio-affinity coupling to TMV through binding to the Ta2O5 chip surface. The acetoin sensitivity and long-term stability of the resulting TMV-assisted EISCAPs was studied in buffer solution. It exceeded the detection range of 10 to 90 µM of previously prepared TMV-free sensors with essentially the same layout and enabled the detection of 0.5 µM to 2000 µM acetoin. Furthermore, the TMV-based biosensor exhibited strongly enhanced long-term stability over repeated uses, with ca. 50% activity present after ten weeks of repetitive use. The capacitive biosensor was additionally applied for the AR-based detection of diacetyl for the first time. The detection of diacetyl and acetoin with the same sensor was realized in both buffer solution and real beer samples. Finally, the controllability of the sensor’s sensitivity towards acetoin and diacetyl via the pH value of the measurement solution was demonstrated: By shifting the pH to the optimum for diacetyl conversion, the acetoin sensitivity was reduced by 75% while the diacetyl sensitivity was unchanged. In turn and correspondingly, when shifting the pH value to the optimum of acetoin conversion, the diacetyl sensitivity was reduced by 75% and the acetoin sensitivity was maintained.
The results of this work demonstrate the high potential of the novel TMV-assisted EISCAP for the detection of acetoin and diacetyl in alcoholic beverages. In future studies, we intend to investigate the influence of different beer components on the sensor signal in order to further improve sensor performance. Additionally, the quantification of naturally formed acetoin and diacetyl can be optimized for different types of beer as well as for monitoring the enrichment of these compounds during distinct fermentation processes, e.g., upon vinification and in fruit mash. Furthermore, the TMV-assisted immobilized AR could be embedded in a light-addressable actuator–sensor platform for the manipulation of pH gradients [
37]. In this context, the addressability of diacetyl and acetoin sensitivity through the pH value could be further studied and improved. Sensor functionality and long-term stability might be enhanced by equipping the sensor structure with a positively charged polyelectrolyte layer. This could increase the TMV density on the Ta
2O
5-transducer surface, and thereby raise the number of enzymes specifically immobilized on the surface of the TMV
CysBio particles. In general, the immobilization strategy of binding enzymes via TMV particles to sensor surfaces (especially field-effect devices) can be enlarged to different kinds of bioreceptors.


 ,
, 