Abstract
We report a facile method for the preparation of vesicle-like carbon dots (VCDs) via dry-heating of surfactant solutions. Like most reported CDs, the VCDs possess interesting fluorescence properties. Entrapment of enzymes and gold nanoclusters (AuNCs) inside the VCDs allows for the development of fluorescent probes for the quantitation of various substrates, with the advantages of high sensitivity and selectivity. The AuNCs act as a probe, and the VCDs as an internal standard confine the AuNCs, enzyme, and analyte to provide high local concentrations to enhance the assay sensitivity. In this study, we employed cholesterol oxidase (ChOX) as a model enzyme for the quantitation of cholesterol. The as-formed hydrogen peroxide through the enzyme reaction inside the VCDs causes fluorescence quenching of AuNCs (excitation/emission wavelengths of 320/670 nm), but not that of the VCDs (excitation/emission wavelengths of 320/400 nm). To improve the sensitivity and linearity, the fluorescence ratios of AuNCs/VCDs are plotted against analyte concentration. The present ratiometric fluorescent method allows for the detection of hydrogen peroxide over the concentration range of 1–100 μM, with a detection limit of 0.673 μM, and cholesterol concentrations ranging from 5 to 100 μM, with a detection limit of 2.8 μM. The practicality of this fluorescent method has been further validated by evaluating cholesterol levels in human serum samples with sufficient accuracy and recovery, revealing its great prospective in diagnosis and biomedical applications.
1. Introduction
Cholesterol is an indispensable component of the human body. It maintains many important biological functions (such as hormones), providing the stability and fluidity of cell membranes [1]. Generally, the normal range of human serum cholesterol levels is 3.23–5.17 mM (125–200 mg dL−1) [2]. The high content of cholesterol is suggested to be associated with a variety of diseases, such as type 2 diabetes, hypertension, heart disease, atherosclerosis, and so on [3,4]. On the other hand, low serum cholesterol level is often related to Tangier disease, hepatic disease, and even COVID-19 [5,6]. Therefore, the development of a sensitive, accurate, and effective cholesterol detection method is of great significance in the clinical and medical fields.
In recent years, numerous approaches have been developed for the quantitation of cholesterol, such as chromatography [7], colorimetry [8], chemiluminescence [9], and electrochemical methods [10]. Fluorescence approaches are generally based on the fluorescence changes of probes induced by hydrogen peroxide (H2O2) formed through the enzyme reaction of cholesterol oxidase (ChOX) and cholesterol, with the advantages of sensitivity and selectivity [11,12]. In most cases, the fluorescence intensity at a single wavelength is measured; however, it is sensitive to the test system and environmental factors. To minimize the disadvantage, ratiometric fluorescence methods are employed [13,14,15]. In addition, owing to the hydrophobic nature of cholesterol, surfactant is commonly added to the sensing system to enhance the solubility of cholesterol and thus its sensitivity [16].
In this study, our aim is to develop a new sensing system for the quantitation of cholesterol by taking advantage of two relatively new emerging fluorescent nanomaterials, including gold nanoclusters (AuNCs) and carbon dots (CDs). Biocompatible and fluorescent AuNCs with large Stokes shifts are easy in preparation and bioconjugation, the potential applications in sensing and cell imaging of which have already been shown [17,18,19,20]. Various ligands and templates, including small thiol molecules [21,22], DNA [23,24], and proteins [25,26], have been used in the preparation of AuNCs to detect H2O2 [27,28]. Carbon dots (CDs), a new class of emerging zero-dimensional carbon nanomaterials, have attracted much attention for their high biocompatibility, photostability, simplicity of synthesis, and unique optical properties [29,30,31,32,33].
To enhance the solubility of cholesterol, CDs were prepared from span-20 through dry heating. The as-formed CDs possess a vesicle (V)-like structure and thus are represented as VCDs. This is the first paper on the synthesis, characterization, and application of VCDs prepared from span-20 by the dry heating method. The VCDs were then used to encapsulate cholesterol oxidase (ChOX) and AuNCs to form nanoreactors (nanoprobes) for cholesterol detection. ChOX catalyzes the reaction of cholesterol and O2 to form H2O2, leading to the fluorescence quenching of AuNCs [34]. Because the fluorescence of VCDs is inert to H2O2, their blue emission can serve as an internal standard. We investigated important factors, including the concentrations of VCDs, AuNCs, pH, incubation temperature, and response time on determining the sensitivity, selectivity, and reproducibility of this approach for the quantitation of cholesterol. Under optimal conditions, the ratiometric fluorescence approach allows for sensitive and selective quantitation of cholesterol. The practicality of this approach was further validated by the quantitation of cholesterol in serum samples, with the advantages of rapid response, superior reproducibility, and stability.
2. Materials and Methods
2.1. Chemicals
Hydrogen tetrachloroaurate (III) trihydrate (HAuCl4·3H2O), bovine serum albumin (BSA), glutathione (GSH), Amplex Red (AR; 10-acetyl-3,7-dihydroxyphenoxazine), rhodamine B isothiocyanate (RITC), and sorbitan monolaurate (span-20) were purchased from Sigma-Aldrich (St. Louis, MO, USA). Phosphoric acid, monobasic, dibasic, and tribasic sodium salts of phosphate, and sodium hydroxide were purchased from J.T. Baker (Phillipsburg, NJ, USA). Ultrapure water (18.2 MΩ cm) from a Milli-Q system (Millipore, Billerica, MA, USA) was used in all experiments.
2.2. Instruments
UV/visible absorption spectra of the tested materials were recorded by Evolution 220 UV–Visible Spectrophotometers (Thermo Fisher Scientific Inc., Waltham, MA, USA). Fluorescence spectra were recorded using a monochromatic microplate spectrophotometer (Synergy 4 Multi-Mode; Biotek Instruments, Winooski, VT, USA). X-ray photoelectron spectroscopy (XPS) measurements were carried out with ES-CALAB 250 spectrometer (VG Scientific, East Grinstead, UK), having Al Kα X-rays as the excitation source. Fourier transform infrared (FTIR) spectra were obtained using Nicolet iS5 FTIR spectrometer (Thermo Scientific, Waltham, MA, USA). Dynamic light scattering (DLS, Zetasizer 3000HS analyzer, Malvern Instruments Ltd., Worcestershire, UK). The particle sizes and morphologies of the GSH/BSA-AuNCs, and VCDs were obtained using a Tecnai 20 G2 S-Twin transmission electron microscope (Philips/FEI, Hillsboro, OR, USA) and Hitachi S-4800 Field Emission Scanning Electron Microscope (Hitachi High-Technologies, Tokyo, Japan), respectively. The encapsulation ability of VCDs was observed in different fluorescence channels under an inverted fluorescence microscope (Olympus BX 51, Tokyo, Japan)
2.3. Synthesis of GSH/BSA-AuNCs
AuNCs were synthesized using BSA as a template and using GSH as a reducing agent according to a previous report [35] with minor modification. Briefly, aqueous HAuCl4 solution (1 mL, 20 mM) was added into BSA (120 µM) and GSH (4 mM) mixture solution (8.75 mL). Subsequently, NaOH (250 µL, 1 M) solution was added to the mixture with vigorous stirring and the reaction was carried out at 70 °C for 30 min. To purify GSH/BSA-AuNCs, the solution was centrifuged at 8000 rpm using molecular weight cutoff of 50 kDa membrane to remove excess reactants and washed three times. The concentration of the as-prepared GSH/BSA-AuNCs was denoted as 1× (50 µM).
2.4. Synthesis of Vesicle Carbon Dots
VCDs were synthesized via a simple dry heating method: span-20 (200 mg) in a 20-mL beaker was placed in a muffle furnace and heated at a temperature of 230 °C for 3 h, producing brown residues. After returning to room temperature, the residue was dissolved in ethanol prior to centrifugation at 8000 rpm for 20 min to remove large particles. Then, the solution was dialyzed against ultrapure water in a dialysis membrane (MW: 3 kDa) for 24 h. Finally, the purified VCDs solution was freeze-dried and resuspended in ethanol for further experiment.
2.5. Validation of GSH/BSA-AuNCs and ChOX Encapsulation
ChOX was labeled with the fluorescent dye rhodamine B isothiocyanate (RITC) for further confirmation of encapsulation. For the labeling procedure, ChOX (20 mg) was dissolved in 0.1 M bicarbonate buffer (pH 9, 10 mL). RITC (0.1 mg) was dissolved in dimethyl sulfoxide (DMSO, 50 µL) and was added dropwise with vigorous stirring of the solution. After stirring RITC-ChOX for 8 h at room temperature, the RITC-ChOX conjugate was separated from the unreacted labeling agent using Sephadex G-25 column. In order to remove excess salt, the RITC-ChOX solution was centrifuged three times at 8000 rpm with a molecular weight cut-off membrane of 10 kDa, and then lyophilized for quantification.
To encapsulate GSH/BSA-AuNCs and RITC-ChOX in VCDs, a solvent injection method was used. Briefly, 100 μL VCDs (0.5 mg mL−1) in ethanol was rapidly added into 900 μL of 10 mM phosphate buffer (pH 5.0) with 0.02× GSH/BSA-AuNCs or 0.1 U/mL ChOX. The encapsulation of GSH/BSA-AuNCs and RITC-ChOX was confirmed by comparison with substrate-free VCDs by fluorescence microscopy following their purification with Sephadex G-150 column.
2.6. Fluorescence Detection of H2O2
The stock solution of H2O2 was freshly diluted to a 30% solution with 0.1 M phosphate buffer (pH 5.0). GSH/BSA-AuNCs (0.2×, 100 μL) and phosphate buffer (100 mM, pH 5.0, 100 μL) were added to aqueous solutions (790 μL), and aliquots (10 μL) of different concentrations of H2O2 were then added (final concentrations 0–0.6 mM). After 10 min of incubation at 55 °C, the fluorescence intensity of each mixture was measured at 670 nm when excited at 320 nm.
2.7. Fluorescence Detection of Cholesterol
Standard cholesterol solution was diluted with ethanol (0–5 mM) prior to mixing with an equal volume of VCDs (10 mg mL−1). For cholesterol determination, each (100 μL) of the prepared cholesterol-VCDs ethanol solution was rapidly added into 900 μL of reaction buffer (containing 10 mM pH 5.0 phosphate buffer, 0.02× GSH/BSA-AuNCs and 0.1 U/mL ChOX). After 10 min of incubation at 55 °C, the fluorescence at 400 and 670 nm of each mixture was measured when excited at 320 nm. The ratiometric fluorescence ratios of AuNCs (670 nm)/VCDs (400 nm) were obtained to establish a plot against cholesterol concentration. The limit of detection (LOD) was calculated by 3 times of standard deviations of the blank.
2.8. Peroxidase Kinetic Analysis
Peroxidase kinetic analysis was measured in a black 96-well microplate using a Synergy 4 microplate reader. Amplex Red (AR) and H2O2 were prepared in 180 μL Tris-HCl (5 mM, pH 7) buffer solution in each well of the plate, and the reaction was started by adding enzyme solution (20 μL) to each well. Various concentrations of H2O2 (0−5 mM) were used as substrates for BSA (1 μM) and GSH/BSA-AuNCs (1 μM) at a constant AR concentration (20 μM).
2.9. Analysis of Real Serum Samples
The concentrations of free cholesterol in serum were assessed using the standard addition method. Specifically, 50 μL of human serum sample was added to 450 μL of ethanol solution containing VCDs (final concentration 5 mg mL−1), then ultrasonicated for 10 min, and centrifuged at 8000 rpm for 10 min to remove the precipitation matrix. Then, 100 μL of suspension was added into 900 μL reaction buffer (containing 10 mM pH 5.0 phosphate buffer, 0.02× GSH/BSA-AuNCs and 0.1 U/mL ChOX). The mixtures were separately incubated at 55 °C for 1 h before fluorescence measurement.
3. Results
3.1. Characteristics of Vesicle-like Carbon Dots
The vesicle-like carbon dots (VCDs) were produced by heating liquid span-20 directly in an autoclave. During heating, the liquid turned brown, indicating carbonization of span-20. Various carbonization times and temperatures were investigated to obtain the optimized condition for forming VCDs (Figure S1); the optimal condition of 230 °C for 3 h was obtained based on the fluorescent intensity and product stability. The as-prepared VCDs, like its precursor, are highly dispersed in ethanol, but exhibit a stronger absorption peak at 220 nm (Figure 1A, spectra B) due to the presence of aromatic π–π transition as a result of carbonization [36,37,38]. Furthermore, the VCDs and their precursor (Figure 1A, spectra C and D) share an obvious scattering phenomenon due to emulsification in water, suggesting that VCDs inherit the amphiphilic nature of the precursor successfully [39]. The excitation-dependent fluorescence property of VCDs displayed in Figure 1B indicates aromatic clusters in the VCDs. FTIR analysis of the VCDs in Figure S2A reveals slightly increased C=O residues after carbonization. The XPS data shown in Figure S3 further suggest that the increase in C=O residues was accompanied by decreased C-O residues, supporting the oxidation of the reactants during heating. DLS analysis (Figure S2B) showed that both VCDs and precursors self-assembled to form vesicles in an aqueous solution, with average sizes of 172.3 and 301.1 nm, respectively. The morphology and size of VCDs before and after self-assembly were characterized using TEM, as shown in Figure 1C, D. Monodisperse VCDs with a size of approximately 4.05 ± 0.96 nm (132 counts) were observable when VCDs were dispersed in ethanol (Figure 1C), confirming the formation of carbon dots after dry heating. VCDs, on the other hand, self-assemble into uniform spherical vesicles and exhibit hollow structures when placed in the aqueous phase (Figure 1D and Figure S4A). VCDs have a self-assembled size of approximately 0.41 ± 0.20 µm (134 counts), which is consistent with SEM findings (0.42 ± 0.20 µm, Figure S4B,C). The particle sizes in TEM and SEM were both larger than in DLS, which could indicate that the structure of the formed vesicles collapsed upon drying. In addition to the vesicle properties of VCDs, the optical microscopic image of VCDs displayed in Figure 1E. Compared with the precursor in Figure S5, VCDs possessed unique fluorescence properties and their positions were perfectly matched with those in the bright field. Furthermore, we utilize the emission of Nile red as a probe molecule to determine the critical micelle concentration (CMC) of span-20 and VCDs. As shown in Figure S6, the fluorescence of Nile red increases sharply when the concentration of span-20 or VCDs increases to CMC concentrations. The critical micelle concentration of VCDs is 0.0526 mg mL−1, which is not much different from that of the precursor. From the above results, it can again demonstrate that VCDs have the properties of surfactants and possess a vesicle-like structure.
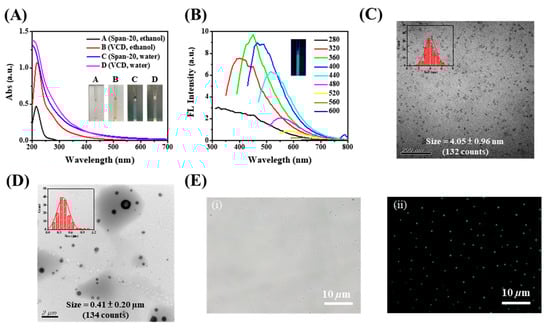
Figure 1.
(A) UV–visible absorption spectra of 0.5 mg/mL span-20 (spectra A, C) and VCDs (spectra B, D) in ethanol (spectra A, B) and aqueous (spectra C, D) systems, respectively. Inset photos show span-20 and VCDs in a different environment. (B) Effect of excitation wavelength on the emission behavior of VCDs. The insert photograph displays the VCDs fluorescence observed under a 365 nm UV lamp. TEM images of VCDs suspended in ethanol (C) and aqueous solution (D), respectively. Insets are the particle-size distribution of the corresponding samples. (E) Bright-field (i) and fluorescence (λex = 360–370 nm; λem ≥ 420 nm) microscopic images (ii) of VCDs.
3.2. Characterization of GSH/BSA-AuNCs
The freshly prepared GSH/BSA-AuNCs exhibited a dark brown color and produced strong red fluorescence in the presence of UV light. The fluorescence excitation and emission spectra of GSH/BSA-AuNCs are shown in Figure 2A (spectra a and b). Moreover, MALDI-MS (Bruker Daltonics, Bremen, Germany) analysis (Figure S7) was consistent with the previous literature, the peak (72.73 kDa) of GSH/BSA-AuNCs is around 6.70 kDa upshifted in mass compared to BSA, confirming the formation of GSH6/BSA-Au25NCs [35]. The morphology of GSH/BSA-AuNCs was observed by TEM. As shown in Figure S8A, AuNCs displayed well dispersion characteristics, and it can be seen from Figure S8B that the particle size distribution is about 2–5 nm. Figure S8C shows that GSH/BSA-AuNCs still display strong fluorescence under extreme pH and ionic strength, indicating superior stability based on protein as a template. GSH/BSA-AuNCs, on the other hand, are attributed to the reduction of GSH, leading to their fluorescence enhancement and sensitivity to H2O2. In Figure 2B, as opposed to AuNCs synthesized without GSH, which rarely respond to H2O2, GSH/BSA-AuNCs are excellent candidates for indirectly detecting cholesterol levels in human serum.
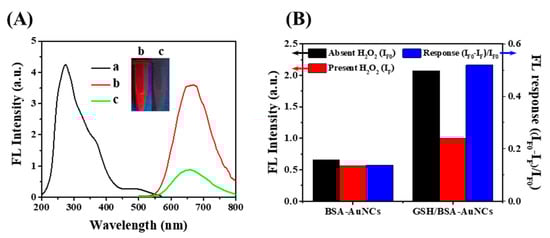
Figure 2.
(A) The excitation (λem = 670 nm, spectra a) and emission (λex = 320 nm, spectra b) in the presence of 1 mM H2O2 (spectra c) fluorescence spectra of as-prepared GSH/BSA-AuNCs. The insert photograph displays the luminescence of the AuNCs in the absence and presence of H2O2 under a 365 nm UV lamp. (B) Fluorescence (λex = 320 nm; λem = 670 nm) of 1 µM BSA-AuNCs and GSH/BSA-AuNCs before (black) and after (red) addition of H2O2 (200 μM), and the corresponding response in fluorescence (blue).
3.3. Optimization of the Sensing Parameters and Detection of H2O2
Since cholesterol is detected through the detection of H2O2 formed from its reaction with ChOX, various reaction parameters such as solution pH, incubation temperature, and response time were evaluated and optimized in order to achieve the greatest H2O2 detection performance. Fluorescence response ratio [(IF0 − IF)/IF0] against different pH values in the presence of H2O2 (200 μM) are shown in Figure S9A, in which IF0 and IF are the fluorescence intensity of AuNCs at 670 nm when excited at 320 nm in the absence and presence of H2O2, respectively. The results reveal that GSH/BSA-AuNCs are more sensitive to H2O2 in an acidic environment, reaching the maximum sensitivity at pH 5.0. We then examined the fluorescence change of GSH/BSA-AuNCs at pH 5.0 with and without H2O2, over an incubation temperature range from 25 to 65 °C. According to the trend of (IF0 − IF)/IF0 for the GSH/BSA-AuNCs corresponding to temperature (Figure S9B), the sensor performed better at high temperatures. Furthermore, the kinetics curves of incubation time (Figure S9C) demonstrated that GSH/BSA-AuNCs completed the response to H2O2 within a short period (within 10 min) at 55 °C.
The optimal conditions for the determination of H2O2 were obtained by placing GSH/BSA-AuNCs in sodium phosphate aqueous solution (pH 5.0), then incubating at 55 °C for 10 min after adding H2O2. As shown in Figure 3A, the fluorescence intensity of GSH/BSA-AuNCs gradually decreased with increasing H2O2 concentration. The Au–S bond of GSH/BSA-AuNCs is oxidized in the presence of H2O2 to induce fluorescence quenching. A good linear correlation (R2 = 0.946) was obtained between (IF0 − IF)/IF0 and the H2O2 concentration in the range of 5–100 µM. A detection limit of 2.4 μM was calculated from the equation. Even though the single-wavelength fluorescence method is very sensitive to H2O2, its performance can be compromised by instrument and external environment variations. Due to its ability to confine the reaction and serve as an internal standard of ratiometric fluorescence, VCDs can further lower the detection limit of H2O2. In the sensing system, adding VCDs to the GSH/BSA-AuNCs did not affect their reactivity to H2O2, but increased local H2O2 concentration. The fluorescent peak at 400 nm of VCDs remained stable (Figure 3B). When compared to the single-wavelength fluorescence approach, the ratiometric approach (I670/I400) exhibits not only better linearity (R2 = 0.996) but great sensitivity (detection limit 0.673 μM). To sum up, the ratiometric fluorescent probe exhibits sensitive detection of H2O2, meaning that it is appropriate for monitoring cholesterol indirectly.
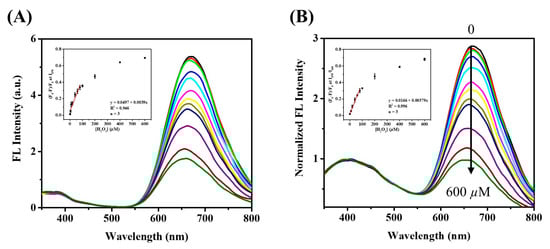
Figure 3.
Fluorescence emission spectra of (A) GSH/BSA-AuNCs and (B) GSH/BSA-AuNCs@VCDs in aqueous solution upon addition of various concentrations of H2O2 (from top to bottom: 0, 1, 4, 10, 20, 40, 60, 80, 100, 200, 400, 600 µM), excitation at 320 nm. Insert: Stern–Volmer plot.
3.4. Cholesterol Sensing Based on the GSH/BSA-AuNCs, ChOX, and VCDs System
The morphologies of self-assembly of nonionic surfactants in aqueous dispersions can be predicted by hydrophilic-lipophilic balance (HLB) and critical packing parameter (CPP) values [40]. Surfactants with a high HLB value are more hydrophilic, and those with an HLB number around 3 to 8 are compatible with bilayer surface preparation [41]. The CPP value was calculated to determine the type of aggregate formed by the surfactant, as defined below.
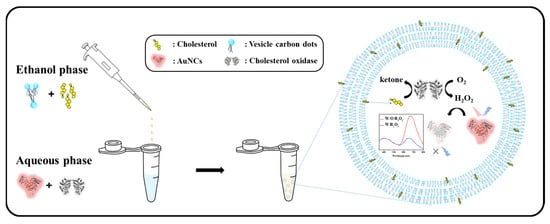
where v is the hydrophobic group volume, lc is the critical hydrophobic group length and a0 is the area of the hydrophilic head group. Based on the CPP value, surfactants can be predicted to form micelles (CPP ≤ 1/2), bilayer vesicles (1/2 < CPP < 1), or reverse micelles (1 ≤ CPP) [42]. Span-20 was used as the precursor of VCDs, and its HLB (8.6) and CPP (1/2 < CPP < 1) values were both suitable for the formation of vesicles. TEM and SEM images showed that the VCDs self-assembled to form a uniform spherical shape, which should have inherited the precursor’s characteristics to form a vesicle. GSH/BSA-AuNCs and ChOX were encapsulated in VCDs by the facile solvent injection method [43]. As shown in Scheme 1, VCDs and cholesterol were first dispersed in ethanol and then injected into a buffer solution (final EtOH: buffer = 1:9) containing GSH/BSA-AuNCs and ChOX. Based on the literature [44,45], cholesterol tends to anchor on the hydrophobic membrane of VCDs, while more hydrophilic ChOX and AuNCs were incorporated into the hydrophilic layer of VCDs. Without high-pressure extrusion after solvent injection, the VCDs should be larger-sized multilamellar vesicles rather than the double layer in the hollow vesicles. Fluorescence microscopy images demonstrate their adequate encapsulation by VCDs. Bright-field (Figure 4) revealed no obvious change in the morphology of VCDs after embedding ChOX or AuNCs. GSH/BSA-AuNCs-encapsulated VCDs, however, showed red fluorescence (Figure 4B) in the blue channel (λex = 360–370 nm; λem ≥ 420 nm) of an inverted fluorescence microscope instead of pristine blue-green fluorescence (Figure 4A), proving that AuNCs were successfully encapsulated. RITC-labeled ChOX is also used to examine whether it is embedded in the VCDs. Comparing Figure 4A, the red channel (λex = 525–545 nm; λem ≥ 575 nm) in Figure 4C shows stronger red fluorescence within a much shorter exposure time, representing the successful encapsulation of RITC-ChOX in VCDs.
Scheme 1.
Schematic drawing of a sensing system for detecting cholesterol.
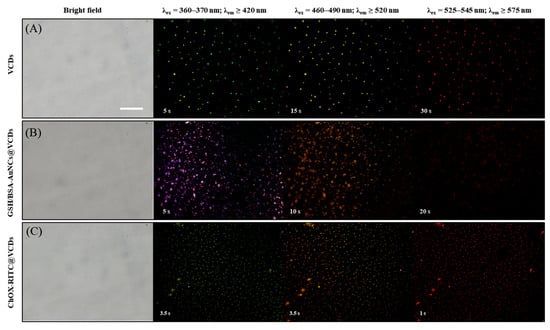
Figure 4.
Bright field, blue (λex = 360–370 nm; λem ≥ 420 nm), green (λex = 460–490 nm; λem ≥ 520 nm), and red (λex = 525–545 nm; λem ≥ 575 nm) fluorescence microscopic images of (A) VCDs, (B) GSH/BSA-AuNCs@VCDs, and (C) ChOX-RITC@VCDs. Exposure times are labeled in the left corner of each image. Scale bar = 10 μm.
Under the optimized conditions, the fluorescence spectra of the sensing system to cholesterol were measured as shown in Figure 5B. With increasing cholesterol concentration, the intensity of fluorescence emission from GSH/BSA-AuNCs (I670) decreases, while the fluorescence emission intensity from VCDs (I400) does not change. With the concentration range of cholesterol between 5 μM and 100 μM, there is a good linear relationship between intensity ratio (I670/I400) and cholesterol concentration, with a detection limit of 2.8 μM. By contrast, in the absence of VCDs, cholesterol would be unable to disperse in the aqueous surrounding, significantly limiting the response of GSH/BSA-AuNCs to cholesterol (Figure 5A). Based on the result, we point out that the VCDs can act as a fluorescence standard as well as enhance the local concentration of cholesterol to improve the catalytic reaction efficiency. Moreover, when the I670/I400 ratio was quenched by cholesterol at 100 μM, no obvious change was detected with the additions of 100 μM interferences. Various interferences commonly exist in serum (black bars in Figure S10), and the fluorescence response was not influenced by the interfering substance’s coexisting (red bars in Figure S10). In view of the high specificity and similar sensitivity of the present invention to previous fluorescent methods reported for detecting cholesterol (Table S1), it can be widely applied to human serum samples.
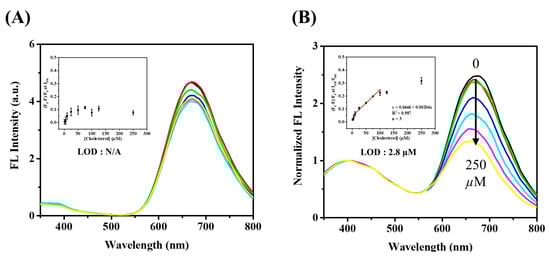
Figure 5.
Fluorescence emission spectra of (A) GSH/BSA-AuNCs and (B) GSH/BSA-AuNCs@VCDs in aqueous solution upon addition of various concentrations of cholesterol (from top to bottom: 0, 1, 5, 25, 50, 125, 250 µM), excitation at 320 nm. Insert: Stern–Volmer plot.
3.5. The Mechanism of the Fluorescence Response of GSH/BSA-AuNCs toward Cholesterol
Besides, we assessed the XPS spectrum, fluorescence lifetime, and peroxidase activity assay in order to explain the mechanism behind the sensitive fluorescence response of GSH/BSA-AuNCs to cholesterol. In BSA-templated gold clusters, the photoluminescence (PL) is derived from the icosahedral core of Au(0) atoms mixed with [–S–Au(I)–S–Au(I)–S–] semirings [46,47]. Thus, once the Au cluster’s Au–S bond is broken by several factors, such as oxidant, PL will be quenched sensitively. Summarizing previous studies, in the presence of H2O2, ligands or templates that are bound to Au nanoclusters through Au–S bonding are likely oxidized to form disulfide (RS–SR) or sulfonic acid product (–RSO3-) [48,49]. In this study, the spectra of GSH/BSA-AuNCs XPS S 2p treated with different concentrations of H2O2 were analyzed. Figure 6 shows S 2p3/2 and 2p1/2 peaks at 161.9 eV and 163.1 eV, indicating the formation of the S–Au bond. However, with the increase in H2O2 concentration, the characteristic peaks of S–Au decreased, while the peaks at 167.0 eV and 168.2 eV of the sulfonic acid group increased significantly, representing the fact that H2O2 oxidized S–Au and the as-formed R-SO3- dominated the fluorescence quenching of gold nanoclusters. Secondly, Figure S11A shows that with the addition of H2O2, the average lifetime of the GSH/BSA-AuNCs remains almost the same, proving that the fluorescence quenching mechanism is static in nature, which is also supported by the XPS analyzed. Additionally, numerous reports claim that AuNCs have peroxidase-like activity [50,51,52,53,54]. Therefore, we suspect that the sensitivity of GSH/BSA-AuNCs in response to H2O2 is due to its peroxidase-mimic, which converts H2O2 to OH radical with strong oxidative activity and then oxidizes S–Au bonds to quench its fluorescence. The peroxidase activity of GSH/BSA-AuNCs was determined using Amplex Red (AR) as a substrate. When GSH/BSA-AuNCs transform H2O2 to OH radicals, AR is converted to highly fluorescent resorufin (λex = 560 nm; λem = 590 nm) upon oxidation [55]. Figure S11B shows the fluorescence kinetics of AR and GSH/BSA-AuNCs signals simultaneously in various concentrations of H2O2. As the H2O2 concentration and reaction time increased, resorufin fluorescence improved along with the decrease in GSH/BSA-AuNCs, demonstrating that GSH/BSA-AuNCs possessed peroxidase-like activity that was absent from pristine BSA (Figure S11C).
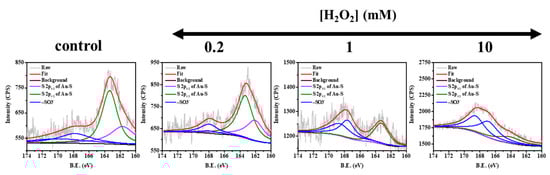
Figure 6.
High-resolution XPS of S 2p spectra for GSH/BSA-AuNCs treated with 0–10 mM H2O2.
3.6. Determination of Cholesterol in Real Serum Samples
The feasibility of the present ratiometric fluorescence approach was further investigated by quantitation of cholesterol in human blood serum. Serum samples were analyzed using a standard addition method. As shown in Table 1, the cholesterol levels of the two volunteers were 2.06 mM and 1.98 mM, which are in good agreement with the commercially available Amplex Red Cholesterol Assay Kit results of 2.10 mM and 1.99 mM. The recovery in human serum is 97.18–101.45% and the RSD is 2.9–7.9%, indicating the dual-emission ratiometric fluorescent sensor has satisfactory accuracy and reliability and has great application potential.

Table 1.
Results of measurement of cholesterol in serum.
4. Conclusions
We have demonstrated a cholesterol biosensor based on the ratiometric fluorescence of VCDs and GSH/BSA-AuNCs. In the assay system, VCDs simultaneously increased the dispersion of cholesterol in an aqueous solution and the efficiency of cholesterol enzymatic oxidation. In the catalytic reaction, the generated H2O2 does not impact the fluorescence of VCDs, which were used as internal standards, but it does severely quench the fluorescence of GSH/BSA-AuNCs. As a result, the present ratiometric approach can provide a satisfactory detection limit (2.8 μM) for the quantitation of cholesterol. Additionally, it was confirmed that the ratiometric sensing system was successful in monitoring cholesterol levels in human serum with satisfactory accuracy and recovery, which can be used as a promising analytical tool for cholesterol.
Supplementary Materials
The following supporting information can be downloaded at: https://www.mdpi.com/article/10.3390/chemosensors10050160/s1, Figure S1. Fluorescence intensity (λex = 320 nm, λem = 400 nm) of aqueous vesicle-like carbon dots (1 mg/mL) solution at various carbonization time (A) and temperature (B). Insert: photographs of VCDs formed from span-20 surfactant at RT to 250 °C; Figure S2. (A) FTIR spectra of span-20 and VCDs. (B) DLS analysis of 0.5 mg/mL VCDs and span-20 in 10 mM sodium phosphate buffer solution (pH 5); Figure S3. XPS spectra of Span-20 and VCDs synthesized at 230 °C; Figure S4. (A) Enlarge TEM image of VCDs. (B) SEM image of VCDs. Insert is particle size distribution image of the corresponding samples. (C) Enlarge SEM image of VCDs; Figure S5. Bright-field (i) and fluorescence (λex = 360–370 nm; λem ≥ 420 nm) microscopic images (ii) of span-20 and the corresponding exposure times are labeled in the left corner; Figure S6. Nile red fluorescence intensity (λex = 515 nm; λem = 585 nm) as a function of logarithm of the surfactant concentration. CMC was determined by the intersection of the two tangents created in the graph; Figure S7. MALDI-MS spectra of (A) BSA (B) GSH6/BSA-Au25NCs; Figure S8. (A) TEM image of GSH/BSA-AuNCs. (B) The particle size distribution histogram of GSH/BSA-AuNCs. (C) Stability test of GSH/BSA-AuNCs; Figure S9. Fluorescence response of the GSH/BSA-AuNCs (λex = 320 nm; λem = 670 nm) in presence of 200 μM H2O2 at different pH (A), incubation temperature (B) and incubation time (C); Figure S10. The selectivity and interference of the sensing system. Fluorescence response of GSH/BSA-AuNCs@VCDs ratio in the presence of 100 μM of different substances before (black) and after (red) addition of cholesterol (100 μM); Figure S11. (A) Fluorescence decay of the GSH/BSA-AuNCs as a function of time with different concentrations of H2O2. (B) Simultaneous monitoring of the fluorescence kinetics of (i) Amplex Red (λex = 560 nm; λem = 590 nm) and (ii) GSH/BSA-AuNCs (λex = 320 nm; λem = 670 nm) signal at series of H2O2 concentrations. Reactions were carried out in 10 mM sodium phosphate buffer and the concentration of GSH/BSA-AuNCs and Amplex Red was 1 μM and 20 μM, respectively. (C) Kinetic curves of I590 (λex = 560 nm) for monitoring the catalytic oxidation of Amplex Red in the presence of 1 μM BSA at 0–5 mM H2O2. The reaction media was the same as in (B); Table S1. Comparison of fluorescence nanomaterials and their analytical performance for cholesterol detection. References [56,57,58,59,60] are cited in the supplementary materials.
Author Contributions
Conceptualization, H.-T.C.; Methodology, S.-R.H. and C.-R.Y.; Project administration, H.-T.C.; Supervision, Y.-F.H., C.-C.H. and H.-T.C.; Validation, S.-R.H. and C.-R.Y.; Writing—original draft, S.-R.H.; Writing—review and editing, Y.-F.H., C.-C.H., Y.-L.C. and H.-T.C. All authors have read and agreed to the published version of the manuscript.
Funding
The Ministry of Science and Technology supported this study, Taiwan, under contracts 110-2113-M-002-005-MY3, 110-2622-M-002-001, and 108-2638-M-002-001-MY2.
Institutional Review Board Statement
The study was conducted in accordance with the Declaration of Helsinki, and the protocol was approved by the Institutional Review Board of Kaohsiung Medical University Hospital (KMUHIRB-E(I)-20190389) and approval dated was 20210319.
Informed Consent Statement
Informed consent was obtained from all subjects involved in the study.
Data Availability Statement
The data presented in this study are available in the Supplementary Materials section.
Conflicts of Interest
The authors declare no conflict of interest.
References
- Xiao, W.; Yang, Z.; Liu, J.; Chen, Z.; Li, H. Sensitive cholesterol determination by β-cyclodextrin recognition based on fluorescence enhancement of gold nanoclusters. Microchem. J. 2022, 175, 107125. [Google Scholar] [CrossRef]
- Wang, X.; Hu, L. Enzymatic strips for detection of serum total cholesterol with point-of-care testing (POCT) devices: Current status and future prospect. J. Electrochem. Soc. 2020, 167, 037535. [Google Scholar] [CrossRef]
- Feringa, F.M.; Van der Kant, R. Cholesterol and Alzheimer’s disease; from risk genes to pathological effects. Front. Aging Neurosci. 2021, 13, 333. [Google Scholar] [CrossRef] [PubMed]
- Zhang, Y.; Vittinghoff, E.; Pletcher, M.J.; Allen, N.B.; Zeki Al Hazzouri, A.; Yaffe, K.; Balte, P.P.; Alonso, A.; Newman, A.B.; Ives, D.G. Associations of blood pressure and cholesterol levels during young adulthood with later cardiovascular events. J. Am. Coll. Cardiol. 2019, 74, 330–341. [Google Scholar] [CrossRef]
- Burnett, J.R.; Hooper, A.J.; McCormick, S.P.A.; Hegele, R.A. Tangier Disease. In GeneReviews((R)); Adam, M.P., Ardinger, H.H., Pagon, R.A., Wallace, S.E., Bean, L.J.H., Stephens, K., Amemiya, A., Eds.; University of Washington: Seattle, WA, USA, 1993. [Google Scholar]
- Zaki, N.; Alashwal, H.; Ibrahim, S. Association of hypertension, diabetes, stroke, cancer, kidney disease, and high-cholesterol with COVID-19 disease severity and fatality: A systematic review. Diabetes Metab. Syndr. Clin. Res. Rev. 2020, 14, 1133–1142. [Google Scholar] [CrossRef]
- Lütjohann, D.; Björkhem, I.; Friedrichs, S.; Kerksiek, A.; Lövgren-Sandblom, A.; Geilenkeuser, W.-J.; Ahrends, R.; Andrade, I.; Ansorena, D.; Astiasarán, I. First international descriptive and interventional survey for cholesterol and non-cholesterol sterol determination by gas-and liquid-chromatography–Urgent need for harmonisation of analytical methods. J. Steroid Biochem. Mol. 2019, 190, 115–125. [Google Scholar] [CrossRef]
- Nirala, N.R.; Saxena, P.S.; Srivastava, A. Colorimetric detection of cholesterol based on enzyme modified gold nanoparticles. Spectrochim. Acta A Mol. Biomol. Spectrosc. 2018, 190, 506–512. [Google Scholar] [CrossRef]
- Hassanzadeh, J.; Khataee, A. Ultrasensitive chemiluminescent biosensor for the detection of cholesterol based on synergetic peroxidase-like activity of MoS2 and graphene quantum dots. Talanta 2018, 178, 992–1000. [Google Scholar] [CrossRef]
- Huang, Y.; Tan, J.; Cui, L.; Zhou, Z.; Zhou, S.; Zhang, Z.; Zheng, R.; Xue, Y.; Zhang, M.; Li, S. Graphene and Au NPs co-mediated enzymatic silver deposition for the ultrasensitive electrochemical detection of cholesterol. Biosens. Bioelectron. 2018, 102, 560–567. [Google Scholar] [CrossRef]
- Yan, X.; Li, H.; Jin, R.; Zhao, X.; Liu, F.; Lu, G. Sensitive sensing of enzyme-regulated biocatalytic reactions using gold nanoclusters-melanin-like polymer nanosystem. Sens. Actuators B Chem. 2019, 279, 281–288. [Google Scholar] [CrossRef]
- Chang, H.-C.; Ho, J.-a.A. Gold nanocluster-assisted fluorescent detection for hydrogen peroxide and cholesterol based on the inner filter effect of gold nanoparticles. Anal. Chem. 2015, 87, 10362–10367. [Google Scholar] [CrossRef] [PubMed]
- Wang, K.; Ren, H.; Li, N.; Tan, X.; Dang, F. Ratiometric fluorescence sensor based on cholesterol oxidase-functionalized mesoporous silica nanoparticle@ ZIF-8 core-shell nanocomposites for detection of cholesterol. Talanta 2018, 188, 708–713. [Google Scholar] [CrossRef] [PubMed]
- Ma, Y.; Cen, Y.; Sohail, M.; Xu, G.; Wei, F.; Shi, M.; Xu, X.; Song, Y.; Ma, Y.; Hu, Q. A ratiometric fluorescence universal platform based on N, Cu codoped carbon dots to detect metabolites participating in H2O2-generation reactions. ACS Appl. Mater. Interfaces 2017, 9, 33011–33019. [Google Scholar] [CrossRef]
- Yue, G.; Li, S.; Liu, W.; Ding, F.; Zou, P.; Wang, X.; Zhao, Q.; Rao, H. Ratiometric fluorescence based on silver clusters and N, Fe doped carbon dots for determination of H2O2 and UA: N, Fe doped carbon dots as mimetic peroxidase. Sens. Actuators B Chem. 2019, 287, 408–415. [Google Scholar] [CrossRef]
- Derina, K.; Korotkova, E.; Barek, J. Non-enzymatic electrochemical approaches to cholesterol determination. J. Pharm. Biomed 2020, 191, 113538. [Google Scholar] [CrossRef]
- Bai, Y.; Shu, T.; Su, L.; Zhang, X. Fluorescent gold nanoclusters for biosensor and bioimaging application. Crystals 2020, 10, 357. [Google Scholar] [CrossRef]
- He, Z.; Shu, T.; Su, L.; Zhang, X. Strategies of luminescent gold nanoclusters for chemo-/bio-sensing. Molecules 2019, 24, 3045. [Google Scholar] [CrossRef] [Green Version]
- Nasaruddin, R.R.; Chen, T.; Yan, N.; Xie, J. Roles of thiolate ligands in the synthesis, properties and catalytic application of gold nanoclusters. Coord. Chem. 2018, 368, 60–79. [Google Scholar] [CrossRef]
- van de Looij, S.M.; Hebels, E.R.; Viola, M.; Hembury, M.; Oliveira, S.; Vermonden, T. Gold Nanoclusters: Imaging, Therapy, and Theranostic Roles in Biomedical Applications. Bioconjug. Chem. 2021, 33, 4–23. [Google Scholar] [CrossRef]
- Yan, X.; He, L.; Zhou, C.; Qian, Z.-J.; Hong, P.; Sun, S.; Li, C. Fluorescent detection of ascorbic acid using glutathione stabilized Au nanoclusters. Chem. Phys. 2019, 522, 211–213. [Google Scholar] [CrossRef]
- Yu, H.; Chen, X.; Yu, L.; Sun, M.; Alamry, K.A.; Asiri, A.M.; Zhang, K.; Zapien, J.A.; Wang, S. Fluorescent MUA-stabilized Au nanoclusters for sensitive and selective detection of penicillamine. Anal. Bioanal. Chem. 2018, 410, 2629–2636. [Google Scholar] [CrossRef]
- Hosseini, M.; Ahmadi, E.; Borghei, Y.-S.; Ganjali, M.R. A new fluorescence turn-on nanobiosensor for the detection of micro-RNA-21 based on a DNA–gold nanocluster. Methods Appl. Fluoresc. 2017, 5, 015005. [Google Scholar] [CrossRef] [PubMed]
- Wang, H.-B.; Li, Y.; Bai, H.-Y.; Liu, Y.-M. DNA-templated Au nanoclusters and MnO2 sheets: A label-free and universal fluorescence biosensing platform. Sens. Actuators B Chem. 2018, 259, 204–210. [Google Scholar] [CrossRef]
- Ju, Y.J.; Li, N.; Liu, S.G.; Han, L.; Xiao, N.; Luo, H.Q.; Li, N.B. Ratiometric fluorescence method for malachite green detection based on dual-emission BSA-protected gold nanoclusters. Sens. Actuators B Chem. 2018, 275, 244–250. [Google Scholar] [CrossRef]
- Li, M.; Zhu, N.; Zhu, W.; Zhang, S.; Li, F.; Wu, P.; Li, X. Enhanced emission and higher stability ovalbumin-stabilized gold nanoclusters (OVA-AuNCs) modified by polyethyleneimine for the fluorescence detection of tetracyclines. Microchem. J. 2021, 169, 106560. [Google Scholar] [CrossRef]
- Wu, Y.; Gao, Y.; Du, J. Bifunctional gold nanoclusters enable ratiometric fluorescence nanosensing of hydrogen peroxide and glucose. Talanta 2019, 197, 599–604. [Google Scholar] [CrossRef]
- Jain, V.; Bhagat, S.; Singh, S. Bovine serum albumin decorated gold nanoclusters: A fluorescence-based nanoprobe for detection of intracellular hydrogen peroxide. Sens. Actuators B Chem. 2021, 327, 128886. [Google Scholar] [CrossRef]
- Ross, S.; Wu, R.-S.; Wei, S.-C.; Ross, G.M.; Chang, H.-T. The analytical and biomedical applications of carbon dots and their future theranostic potential: A review. J. Food Drug Anal. 2020, 28, 677–695. [Google Scholar] [CrossRef]
- Wei, S.-C.; Lin, Y.-W.; Chang, H.-T. Carbon dots as artificial peroxidases for analytical applications. J. Food Drug Anal. 2020, 28, 558–574. [Google Scholar] [CrossRef]
- Chang, H.-T. Grand Challenges in Analytical Science. Front. Anal. Sci. 2021, 1, 2. [Google Scholar] [CrossRef]
- Xu, D.; Lin, Q.; Chang, H.T. Recent advances and sensing applications of carbon dots. Small Methods 2020, 4, 1900387. [Google Scholar] [CrossRef]
- Yan, F.; Sun, Z.; Zhang, H.; Sun, X.; Jiang, Y.; Bai, Z. The fluorescence mechanism of carbon dots, and methods for tuning their emission color: A review. Mikrochim. Acta 2019, 186, 583. [Google Scholar] [CrossRef] [PubMed]
- Chen, X.; Baker, G.A. Cholesterol determination using protein-templated fluorescent gold nanocluster probes. Analyst 2013, 138, 7299–7302. [Google Scholar] [CrossRef]
- Wu, B.-Y.; Wang, C.-W.; Chen, P.-C.; Chang, H.-T. Glutathione assisted preparation of gold nanoclusters using minimum amount of protein. Sens. Actuators B Chem. 2017, 238, 1258–1265. [Google Scholar] [CrossRef]
- Debnath, K.; Majumder, T.; Mondal, S.P. Photoelectrochemical and photosensing study of nitrogen doped carbon nanoparticles sensitized TiO2 nanorods. Diam. Relat. Mater. 2021, 120, 108683. [Google Scholar] [CrossRef]
- Wei, Y.; Chen, L.; Wang, J.; Liu, X.; Yang, Y.; Yu, S. Investigation on the chirality mechanism of chiral carbon quantum dots derived from tryptophan. RSC Adv. 2019, 9, 3208–3214. [Google Scholar] [CrossRef] [Green Version]
- Emanuele, A.; Cailotto, S.; Campalani, C.; Branzi, L.; Raviola, C.; Ravelli, D.; Cattaruzza, E.; Trave, E.; Benedetti, A.; Selva, M. Precursor-dependent photocatalytic activity of carbon dots. Molecules 2020, 25, 101. [Google Scholar] [CrossRef] [Green Version]
- Abismaıl, B.; Canselier, J.; Wilhelm, A.; Delmas, H.; Gourdon, C. Emulsification processes: On-line study by multiple light scattering measurements. Ultrason. Sonochem. 2000, 7, 187–192. [Google Scholar] [CrossRef]
- Ag Seleci, D.; Seleci, M.; Walter, J.-G.; Stahl, F.; Scheper, T. Niosomes as nanoparticular drug carriers: Fundamentals and recent applications. J. Nanomater. 2016, 2016, 7372306. [Google Scholar] [CrossRef]
- Moghassemi, S.; Hadjizadeh, A. Nano-niosomes as nanoscale drug delivery systems: An illustrated review. J. Control. Release 2014, 185, 22–36. [Google Scholar] [CrossRef]
- Kumar, G.P.; Rajeshwarrao, P. Nonionic surfactant vesicular systems for effective drug delivery—An overview. Acta Pharm. Sin. B. 2011, 1, 208–219. [Google Scholar] [CrossRef] [Green Version]
- Estupiñan, O.R.; Garcia-Manrique, P.; Blanco-Lopez, M.d.C.; Matos, M.; Gutiérrez, G. Vitamin D3 Loaded Niosomes and Transfersomes Produced by Ethanol Injection Method: Identification of the Critical Preparation Step for Size Control. Foods 2020, 9, 1367. [Google Scholar] [CrossRef] [PubMed]
- Somjid, S.; Krongsuk, S.; Johns, J.R. Cholesterol concentration effect on the bilayer properties and phase formation of niosome bilayers: A molecular dynamics simulation study. J. Mol. Liq. 2018, 256, 591–598. [Google Scholar] [CrossRef]
- Bhardwaj, P.; Tripathi, P.; Gupta, R.; Pandey, S. Niosomes: A review on niosomal research in the last decade. J. Drug Deliv. Sci. Technol. 2020, 56, 101581. [Google Scholar] [CrossRef]
- Wen, X.; Yu, P.; Toh, Y.-R.; Tang, J. Structure-correlated dual fluorescent bands in BSA-protected Au25 nanoclusters. J. Phys. Chem. C 2012, 116, 11830–11836. [Google Scholar] [CrossRef]
- Unnikrishnan, B.; Wei, S.-C.; Chiu, W.-J.; Cang, J.; Hsu, P.-H.; Huang, C.-C. Nitrite ion-induced fluorescence quenching of luminescent BSA-Au25 nanoclusters: Mechanism and application. Analyst 2014, 139, 2221–2228. [Google Scholar] [CrossRef]
- Shiang, Y.-C.; Huang, C.-C.; Chang, H.-T. Gold nanodot-based luminescent sensor for the detection of hydrogen peroxide and glucose. Chem. Commun. 2009, 23, 3437–3439. [Google Scholar] [CrossRef]
- Jin, L.; Shang, L.; Guo, S.; Fang, Y.; Wen, D.; Wang, L.; Yin, J.; Dong, S. Biomolecule-stabilized Au nanoclusters as a fluorescence probe for sensitive detection of glucose. Biosens. Bioelectron. 2011, 26, 1965–1969. [Google Scholar] [CrossRef]
- Wang, G.-L.; Jin, L.-Y.; Dong, Y.-M.; Wu, X.-M.; Li, Z.-J. Intrinsic enzyme mimicking activity of gold nanoclusters upon visible light triggering and its application for colorimetric trypsin detection. Biosens. Bioelectron. 2015, 64, 523–529. [Google Scholar] [CrossRef]
- Sun, F.; Liang, Y.; Jin, L.; Shi, J.; Shang, L. Weak Interaction-Tailored Catalytic Interface of Ultrasmall Gold Nanoclusters as Enzyme Mimics for Enhanced Colorimetric Biosensing. ACS Appl. Mater. Interfaces 2021, 13, 58209–58219. [Google Scholar] [CrossRef]
- Chen, C.; Zhao, D.; Jiang, Y.; Ni, P.; Zhang, C.; Wang, B.; Yang, F.; Lu, Y.; Sun, J. Logically regulating peroxidase-like activity of gold nanoclusters for sensing phosphate-containing metabolites and alkaline phosphatase activity. Anal. Chem. 2019, 91, 15017–15024. [Google Scholar] [CrossRef] [PubMed]
- Huang, Y.-Q.; Fu, S.; Wang, Y.-S.; Xue, J.-H.; Xiao, X.-L.; Chen, S.-H.; Zhou, B. Protamine-gold nanoclusters as peroxidase mimics and the selective enhancement of their activity by mercury ions for highly sensitive colorimetric assay of Hg (II). Anal. Bioanal. Chem. 2018, 410, 7385–7394. [Google Scholar] [CrossRef] [PubMed]
- Hu, L.; Liao, H.; Feng, L.; Wang, M.; Fu, W. Accelerating the peroxidase-like activity of gold nanoclusters at neutral pH for colorimetric detection of heparin and heparinase activity. Anal. Chem. 2018, 90, 6247–6252. [Google Scholar] [CrossRef] [PubMed]
- Dębski, D.; Smulik, R.; Zielonka, J.; Michałowski, B.; Jakubowska, M.; Dębowska, K.; Adamus, J.; Marcinek, A.; Kalyanaraman, B.; Sikora, A. Mechanism of oxidative conversion of Amplex® Red to resorufin: Pulse radiolysis and enzymatic studies. Free Radic. Biol. Med. 2016, 95, 323–332. [Google Scholar] [CrossRef] [Green Version]
- Adel, R.; Ebrahim, S.; Shokry, A.; Soliman, M.; Khalil, M. Nanocomposite of CuInS/ZnS and Nitrogen-Doped Graphene Quantum Dots for Cholesterol Sensing. ACS Omega 2021, 6, 2167–2176. [Google Scholar] [CrossRef]
- Xu, H.V.; Zhao, Y.; Tan, Y.N. Nanodot-directed formation of plasmonic-fluorescent nanohybrids toward dual optical detection of glucose and cholesterol via hydrogen peroxide sensing. ACS Appl. Mater. Interfaces 2019, 11, 27233–27242. [Google Scholar] [CrossRef]
- Hassanzadeh, J.; Khataee, A.; Eskandari, H. Encapsulated cholesterol oxidase in metal-organic framework and biomimetic Ag nanocluster decorated MoS2 nanosheets for sensitive detection of cholesterol. Sens. Actuators B Chem. 2018, 259, 402–410. [Google Scholar] [CrossRef]
- Guo, L.; Chen, S.; Yu, Y.-L.; Wang, J.-H. A Smartphone Optical Device for Point-of-Care Testing of Glucose and Cholesterol Using Ag NPs/UiO-66-NH2-Based Ratiometric Fluorescent Probe. Anal. Chem. 2021, 93, 16240–16247. [Google Scholar] [CrossRef]
- Huang, S.; Yang, E.; Yao, J.; Chu, X.; Liu, Y.; Zhang, Y.; Xiao, Q. Nitrogen, cobalt co-doped fluorescent magnetic carbon dots as ratiometric fluorescent probes for cholesterol and uric acid in human blood serum. ACS Omega 2019, 4, 9333–9342. [Google Scholar] [CrossRef] [Green Version]
Publisher’s Note: MDPI stays neutral with regard to jurisdictional claims in published maps and institutional affiliations. |
© 2022 by the authors. Licensee MDPI, Basel, Switzerland. This article is an open access article distributed under the terms and conditions of the Creative Commons Attribution (CC BY) license (https://creativecommons.org/licenses/by/4.0/).