Article

Wax-Printed Fluidic Controls for Delaying and Accelerating Fluid Transport on Paper-Based Analytical Devices

1
Laboratory of Analytical Chemistry, School of Chemistry, Faculty of Sciences, Aristotle University of Thessaloniki, 54124 Thessaloniki, Greece
2
Laboratory of Analytical Chemistry, Department of Chemistry, University of Ioannina, 45110 Ioannina, Greece
*
Author to whom correspondence should be addressed.
Chemosensors 2022, 10(5), 155; https://doi.org/10.3390/chemosensors10050155
Submission received: 23 March 2022 / Revised: 16 April 2022 / Accepted: 20 April 2022 / Published: 24 April 2022
(This article belongs to the Section Applied Chemical Sensors)

Abstract

:
In this work, we explore a new method for controlling fluid transport rate on paper-based analytical devices that enables both the delay and the acceleration of fluid flow. The delays were incorporated by wax printing linear patterns of variable width within the flow channel and melted to penetrate the paper. In this manner, the surface tension of the fluid decreases while its contact angle increases, causing a pressure drop along the fluid path that reduces capillary flow. The acceleration of flow was accomplished by overlaying hydrophobic stripes (prepared by wax printing and melting the wax) on the hydrophilic path (top or top–bottom). In this manner, the fluid was repelled from two dimensions (vertical and applicate), increasing the flow rate. The combination of these methods on the same devices could adjust wicking time in intermediate time internals. The method enabled a wide timing of fluid transport, accomplishing a change in wicking times that extended from −41% to +259% compared to open paper channels. As a proof of concept, an enzymatic assay of glucose was used to demonstrate the utility of these fluid control methods in kinetic methods of analysis.

Graphical Abstract

1. Introduction

Paper-based devices have been attracting increasing attention as a platform for fabricating microfluidic devices that can be used to perform on-site testing at the point of need (e.g., environment, agriculture/aquaculture, food quality, public safety) or point of care (e.g., at the bedside, in remote healthcare units, medical self-testing) [1,2,3]. The main advantages of paper, in comparison with other materials such as silicone, plastics and glass, are (a) that it is readily available, at low cost; (b) the high surface area to volume ratio; (c) the spontaneous, capillary-force-driven flow of liquids without external energy sources; and (d) the fibrous nature that allows reagents to be stored dry and reactivated upon rehydration [2,3]. These properties have been used for the development of analytical assays in two main modalities [4,5]. The first is spot analysis where the sample is placed on the paper device and reactions with the appropriate reagents occur within a specific area or vertically oriented areas in contact with each other, isolated with hydrophobic barriers without horizontal wicking of the fluids [6,7,8,9,10]. The second mode involves the wicking of the sample liquid into pre-defined channels where various reagents have been added and dried to perform additional reactions before detection (masking of interferences, derivatization or complexation, enzymatic reactions, electrochemical detection, etc.) in a specific sequence [11,12,13,14]. The main challenge in flow-through methods is to control fluid transport rate so that chemical reactions occur in a controllable and reproducible manner that ensures the accuracy and the precision of the analytical results.
The necessity to regulate fluid transport in paper-based devices has led to the development of various techniques that rely either on active or passive fluid control [15]. Active fluid control systems employ mechanical valves connected to an external energy source to control the flow of liquids [15,16]. Such systems enable an accurate manipulation of fluid transport rate, but they are difficult to design and require external microequipment. On the other hand, passive fluid control can be embedded in paper devices and adjust the fluid flow rate without external energy input. This can be accomplished either by changing the dimensions of the microfluidic channel (i.e., width and length), a technique that provides limited capabilities of fluid control, or by using more advanced methods such as chemical modification of the paper surface (e.g., hydrophobic modification, water-dissolvable polymers or sugars) or mechanical methods such as laser writing, paper crafting and enclosed channels [1,2,4,15,16,17]. Most of these methods mainly accomplish the delay of fluid wicking on paper, but some can also accelerate fluid transport rate (e.g., paper crafting, fully enclosed paper channels). Therefore, to accomplish fluid acceleration and delay in different parts of the same device, several methods must be applied. However, each of these methods requires different equipment, has certain specifications that may not be compatible with other modification methods, and involves different fabrication procedures of variable complexity. The adaptation of many fluid control techniques in microfluidic channels is an intricate undertaking that requires advanced technological skills, multiple devices and processing steps, and delicate control of the fabrication procedure to ensure that each modification does not interact with the precedent or succeeding fabrication process and is compatible with the detection reagents. Therefore, a single method that can be used to incorporate a variety of fluid velocity controls to control wicking over a wide temporal range without the need for different procedures or apparatus would be desirable.
In this work, we report a new method of passive fluid control on paper-based microfluidic devices (μPADs) mediated only by wax printing that can be used to accomplish both the delay and the acceleration of fluid transport on paper surfaces. First, we describe the fabrication of fluid barriers that could decelerate the wicking rate of fluids by wax printing line barriers of variable width at different positions inside the fluid path (onset or end of fluid flow), heated to transversely penetrate through the width of the paper. Then, we report methods for accomplishing fluid acceleration by wax printing paper strips, heated to create a fully hydrophobic paper tape and overlayed on the hydrophilic zones of the paper devices (on top or top–bottom) to create one- or two-ply enclosed paper devices. Finally, we demonstrate, as a proof of principle, the application of these fluid controls in a paper-based kinetic enzymatic assay of glucose.

2. Materials and Methods

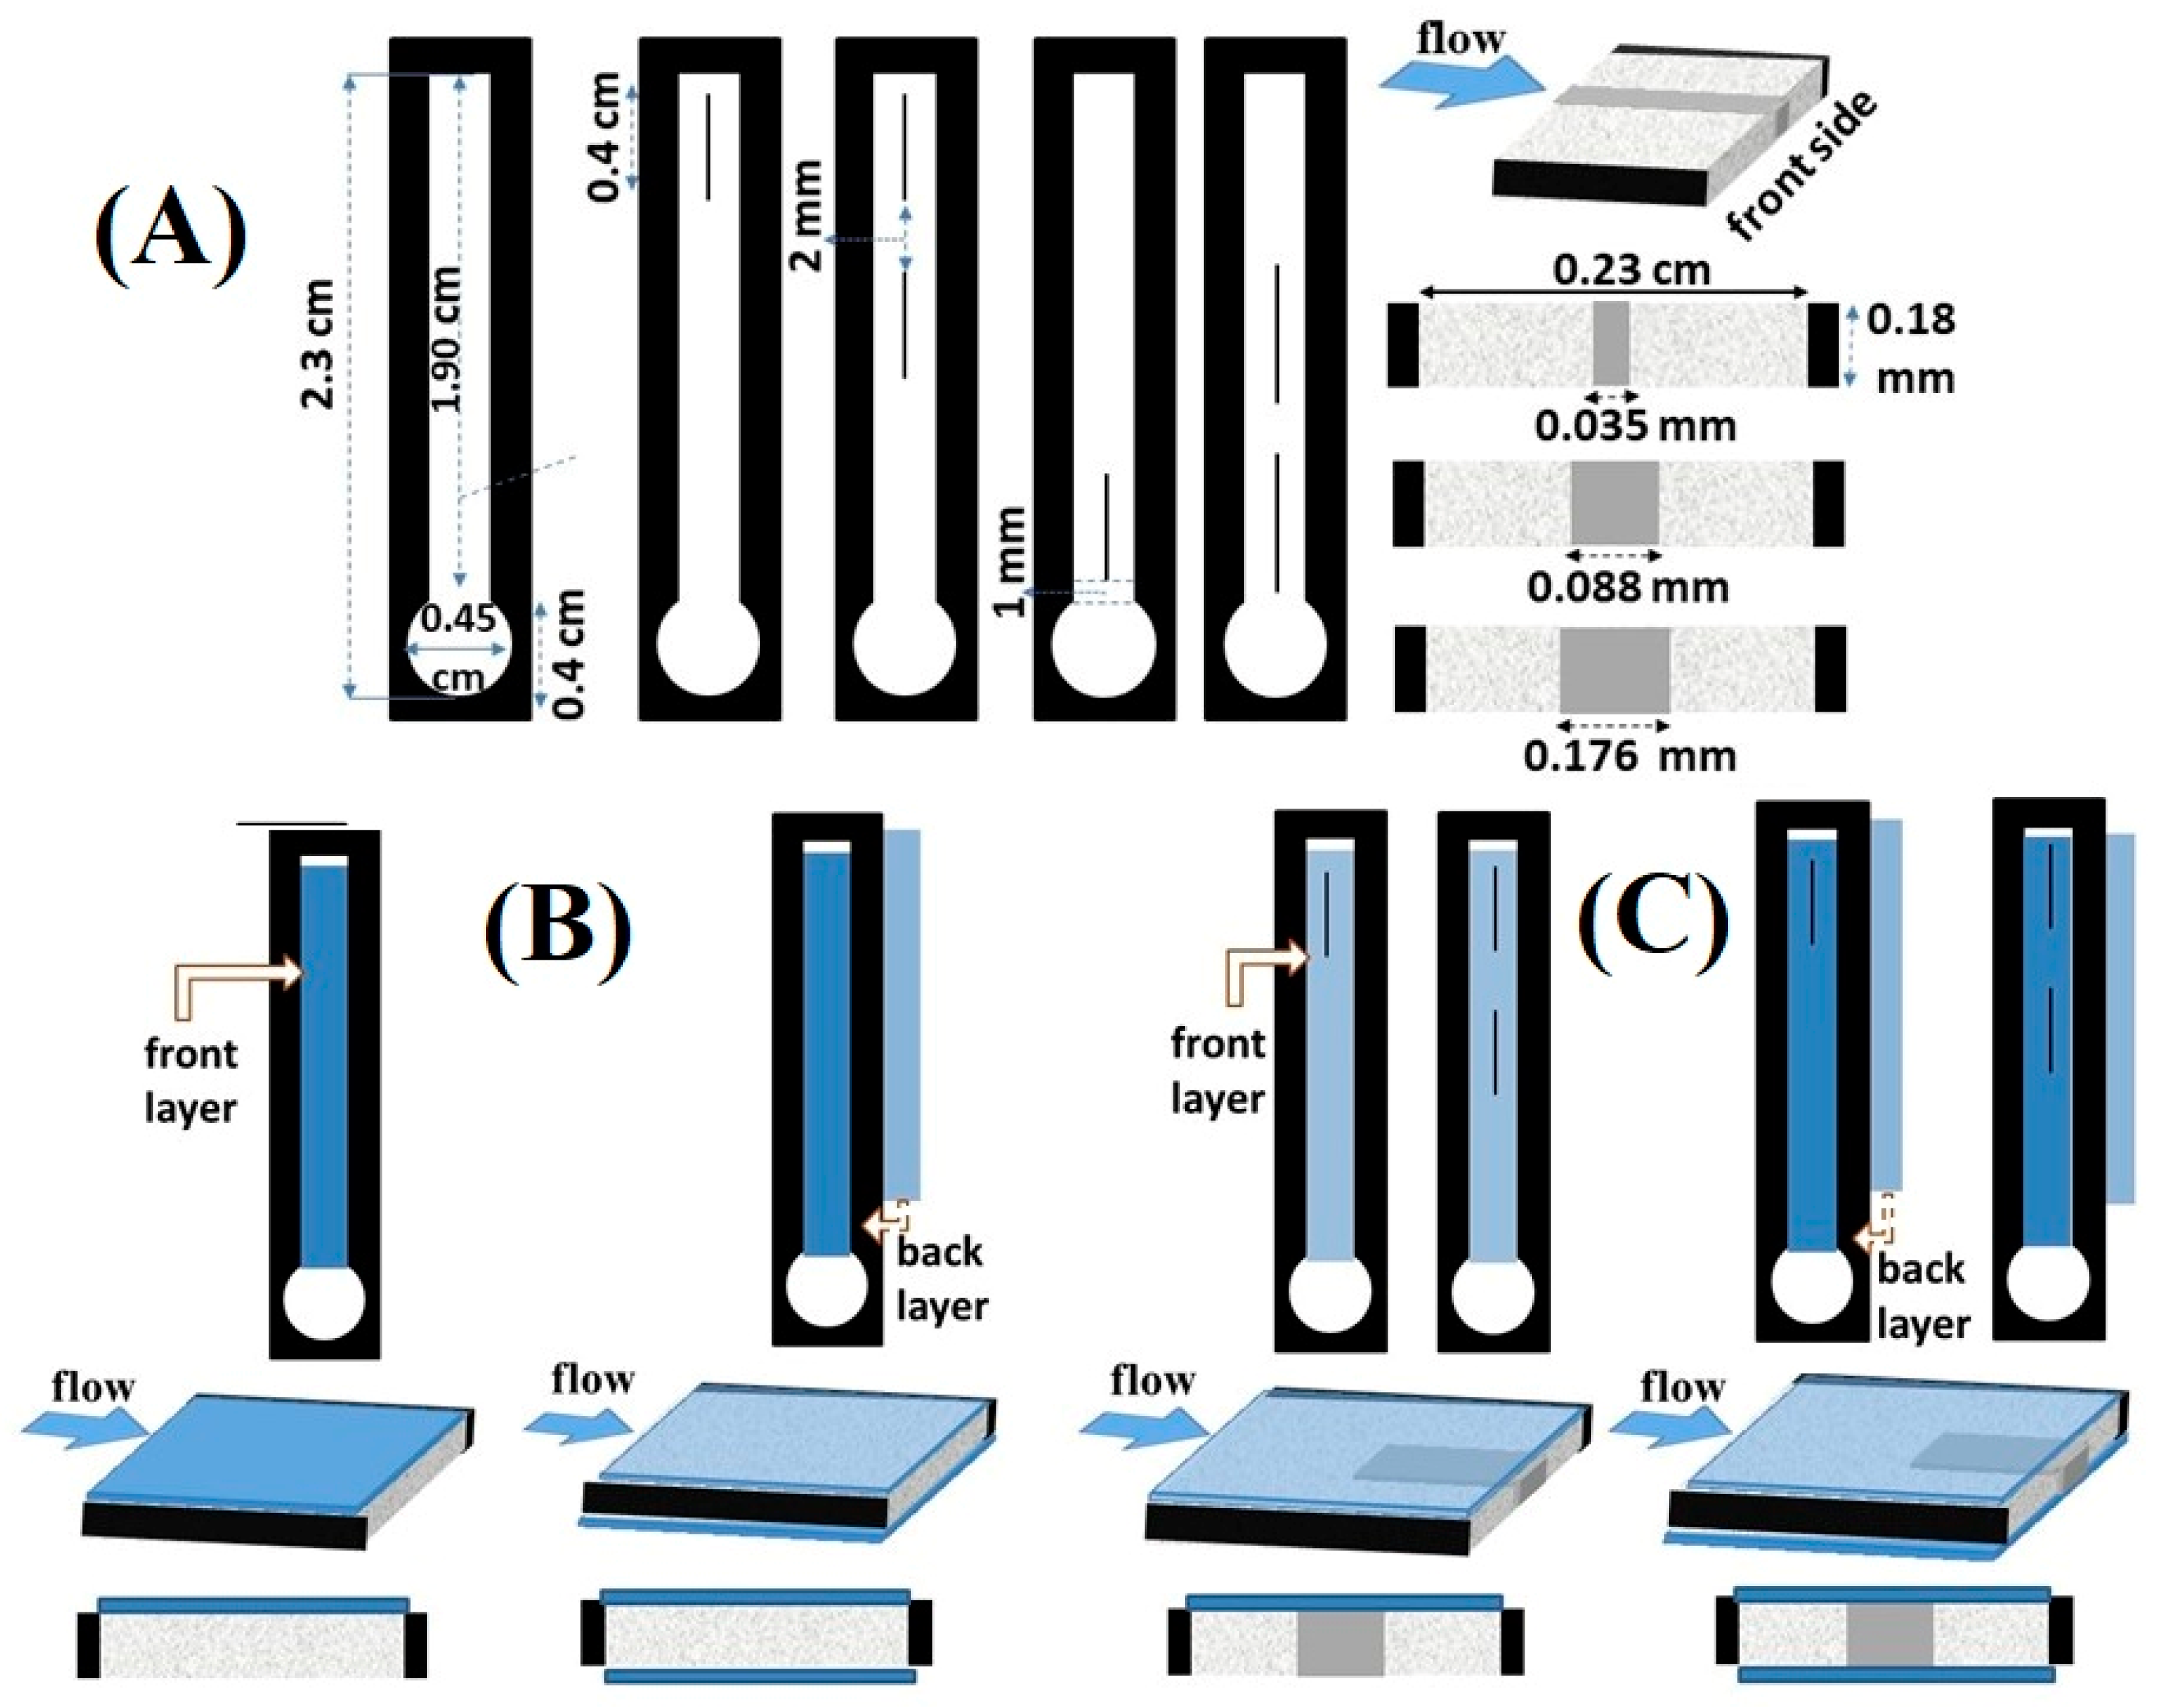
2.1. Fabrication of Paper-Based Devices with Wax-Printed Delays and Accelerators

A flow chart summarizing the technical procedure for the fabrication of the devices is presented in Figure S1. First, we prepared the µPADs using a Xerox Phaser 8560DN printer (Xerox Corporation, Norwalk, CT, USA.) by depositing solid ink on Whatman No. 1 chromatography paper (0.18 mm, 87 g m−2). The μPAD design consisted of a thermometer-like pattern with a sample deposition reservoir. The device length was 2.3 cm with a 1.91 × 0.25 cm (LxW) hydrophilic channel and a sample reservoir of 0.45 cm diameter (Figure 1A).
On these μPADs, we printed wax-printed fluidic time delays in two different designs. The first contained linear delays (one or two) of variable width (0.035–0.175 mm) in two different configurations: close to the end-point of the flow path and at the starting point, right after the sample deposition area (Figure 1A). The paper devices were then heated in a ventilated oven for 2.0 min at 150 ± 5 °C to melt the wax. In this manner, the wax melted and transversely penetrated through the width of the paper to create (a) hydrophobic barriers bounding the hydrophilic channel and the sample reservoir and (b) hydrophobic (wax-printed) linear fluid delays in the flow channel.
Fluidic accelerators were prepared by printing rectangular strips of the same dimensions as the hydrophilic channel with the same solid ink on Whatman No.1 paper and baked to melt the wax and create completely hydrophobic stripes of paper. These layers were then cut with the Silhouette Cameo cutting tool, placed on the devices (top or top–bottom) to completely cover the hydrophilic channel, and adhered with an adhesive tape to ensure tight contact with the hydrophilic channel (Figure 1B) in order to create a duct-like design. Combined designs containing both fluidic barriers and accelerators were prepared by combining the above procedures (Figure 1C).

2.2. Fluid Flow Rate Experiments

To investigate the effect of fluid delays and accelerators on liquid delivery time, we deposited 12 μL of an aqueous methyl red (MR) solution (6 × 10⁻⁴ mol L−1 in 0.2% ethanol) in the sample reservoir and allowed it to wick to the end of the device (n = 10). The volume of liquid was kept constant to ensure that it did not affect the wicking rate. The time required for the fluid to travel through the entire hydrophilic fluid transport channel was determined with 2-digit accuracy by video recording the fluid flow.

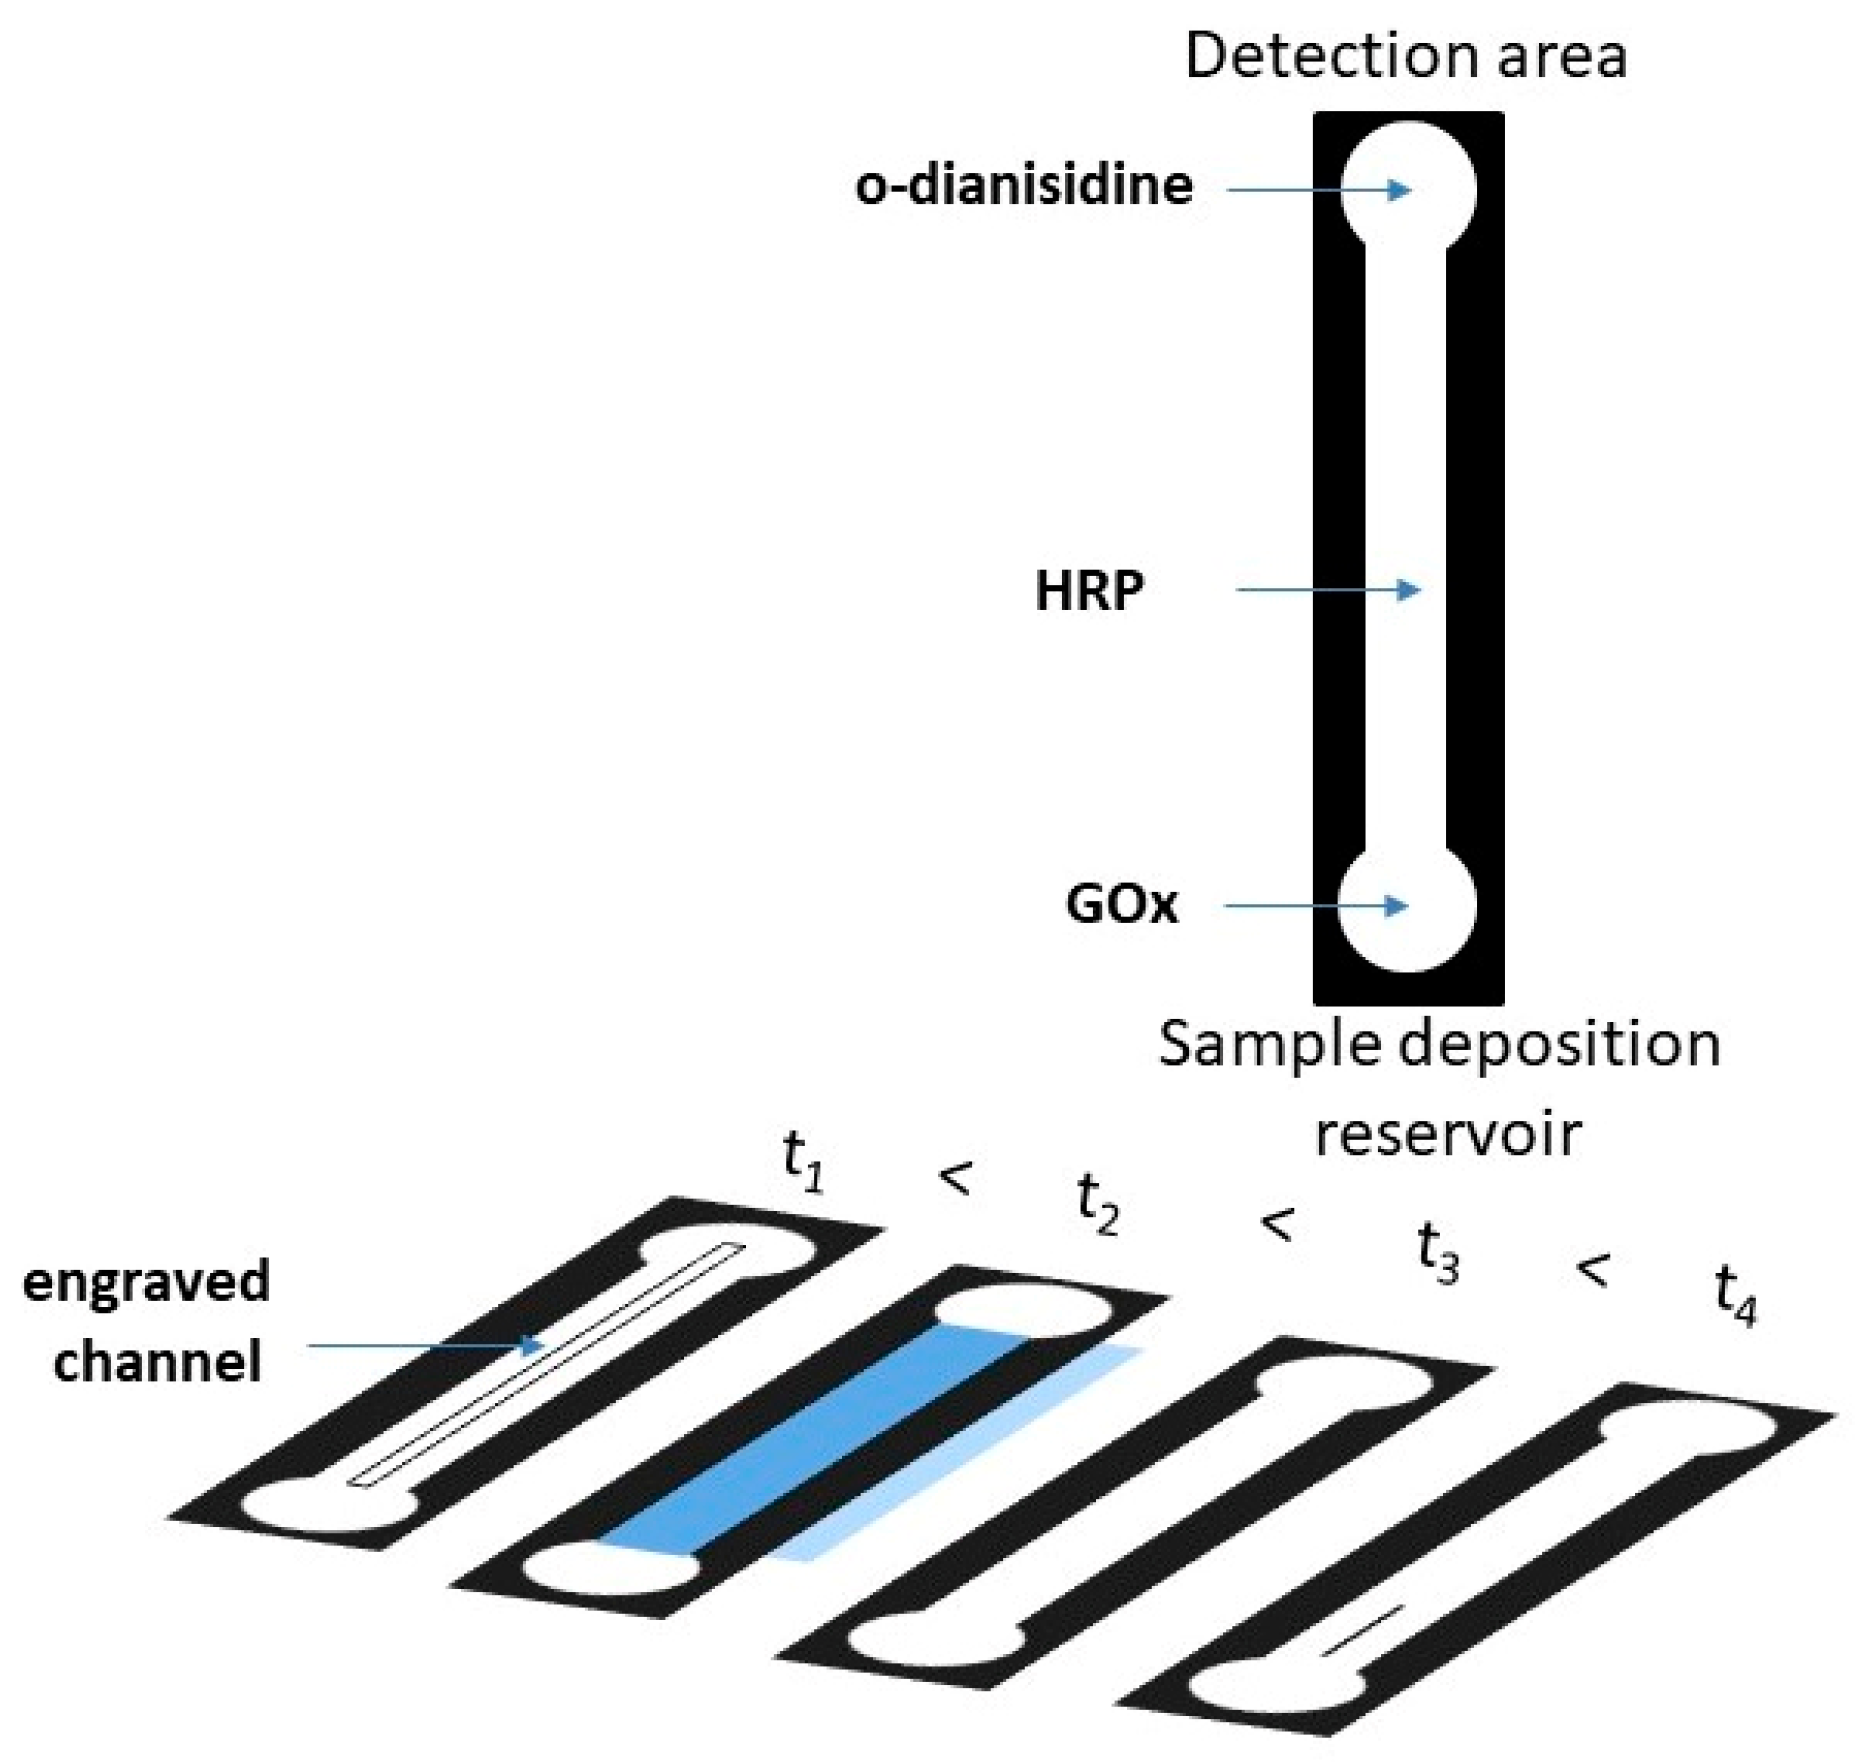
2.3. Paper-Based Kinetic Enzymatic Assay

The enzymatic assay of glucose with horseradish peroxidase (HRP) and glucose oxidase (GOx) was used to demonstrate the utility of wax-printed fluidic time controls for performing kinetic assays on paper devices. The assay is based on the ability of GOx to selectively oxidize glucose to gluconic acid and hydrogen peroxide. In the presence of HRP, the hydrogen peroxide can oxidize the colorless oxygen acceptor o-dianisidine to give a brown oxidation product, the intensity of whose color is proportional to the amount of glucose. Four μPADs with different fluid delays and accelerators were prepared (Figure 2), instead of one device with four channels, to maintain the same design and thus ensure that the timing of fluid transport in the fluid path and reaction time in the detection zone are the same as those determined with the methyl red indicator.
Based on this rationale, fluid control was accomplished with paper devices that contained: (a) an open channel without modification, (b) a channel with a 0.035 mm barrier delay at the beginning of the flow regime, (c) a channel with two overlayed hydrophobic layers as accelerators and (d) an open groove that was engraved along the fluid path as described in our previous work [17]. An engraved channel was used because it enabled the very fast delivery of the fluid to the detection area (almost 50% faster than the use of 2 overlayed layers). In this manner, we could complete the analysis within 2.3 min. Other combinations of fluid delays and accelerators were also tested, but they required longer analysis times.
To these devices, 3 × 3 μL of GOx (0.53 mg mL−1, 70000 units) in 1×PBS buffer were added in the middle of the sample deposition reservoir. After each addition, the solution was left to dry protected from light exposure. To the hydrophilic paths, 2 × 0.4 μL each of HRP (1 mg mL−1) in sodium acetate/acetic acid buffer (pH 4) were added with interim drying between the additions. An aliquot of 0.4 μL of o-dianisidine (5 mg mL−1) in ethanol was finally added to the detection area and left to dry. To ensure that the reaction time was reproducibly controlled in each device, a multichannel pipette was used to deposit the same sample volume (12 μL) simultaneously to all devices. A camera was used to record a video of the analysis. A video still was cropped 2.3 min after the sample introduction. Depending on the presence of a fluid delay or accelerator, the reaction time in the detection zone differed as a function of the fluid transport rate in the channel (Table S1). The mean grey area intensity in each channel was plotted against time, and the slope of the curves was used to calculate the reaction rate. The plot of reaction rate vs. glucose concentration was used to prepare a calibration plot.

3. Results and Discussion

The passive movement of a fluid through the porous paper substrate is driven by capillary forces and can be categorized as paper wet-out, where the fluid front wicks along a dry porous medium, and the fully wetted flow, where fluid transport occurs along a pre-wetted porous medium [18]. The wet-out process can be modeled by the Lucas–Washburn equation, which relates wicking length (L) to the square root of time (t) [15,18,19]:
L 2 = γ   r   c o s Θ 2 μ   t   t = 2   μ γ   r   cos θ L 2
where γ is the interfacial surface tension of the liquid, r is the average pore radius of the paper, θ is the water contact angle on the paper surface and μ is the viscosity of the liquid. According to Equation (1), the fluid-front velocity decreases with time due to the flow resistance of the surface of the porous medium [20].
Once the paper is wet or on pre-wet surfaces, Darcy’s law gives the flow rate of the liquid according to the following formula [15,18,19]:
Q = k   w   h μ   L Δ P
where Q is the volumetric flow rate, k is the paper permeability, w is the channel width, h is the paper thickness, θ is the liquid contact angle and ΔP is the pressure difference over the wetted region, known as Laplace pressure [15,19]:
P c = 2   γ   c o s θ r
where l is the distance traversed down the channel (m) at time t (s), γ is the interfacial tension (N m−1), r is the mean capillary radius (m), θ is the fluid contact angle on the paper and μ is the fluid viscosity (N s m−1).
From Equation (2), it can be inferred that the flow rate can be controlled by changing the dimensions of the flow path (w, h, L) and by changing the permeability (k) of the paper. By changing these parameters, several studies have reported the passive control of fluid transport on paper devices [6,21,22,23]. Beyond these parameters, the surface tension of the liquid γ and the liquid contact angle θ also affect the flow rate and the fluid transport time. Therefore, we reasoned that by changing γ and θ it could also be possible to adjust the flow rate on paper devices. This was accomplished by printing and heating hydrophobic barriers along the flow path to change the surface tension of the fluid or by overlaying hydrophobic layers on the paper devices to adjust the water contact angle or by combining both.

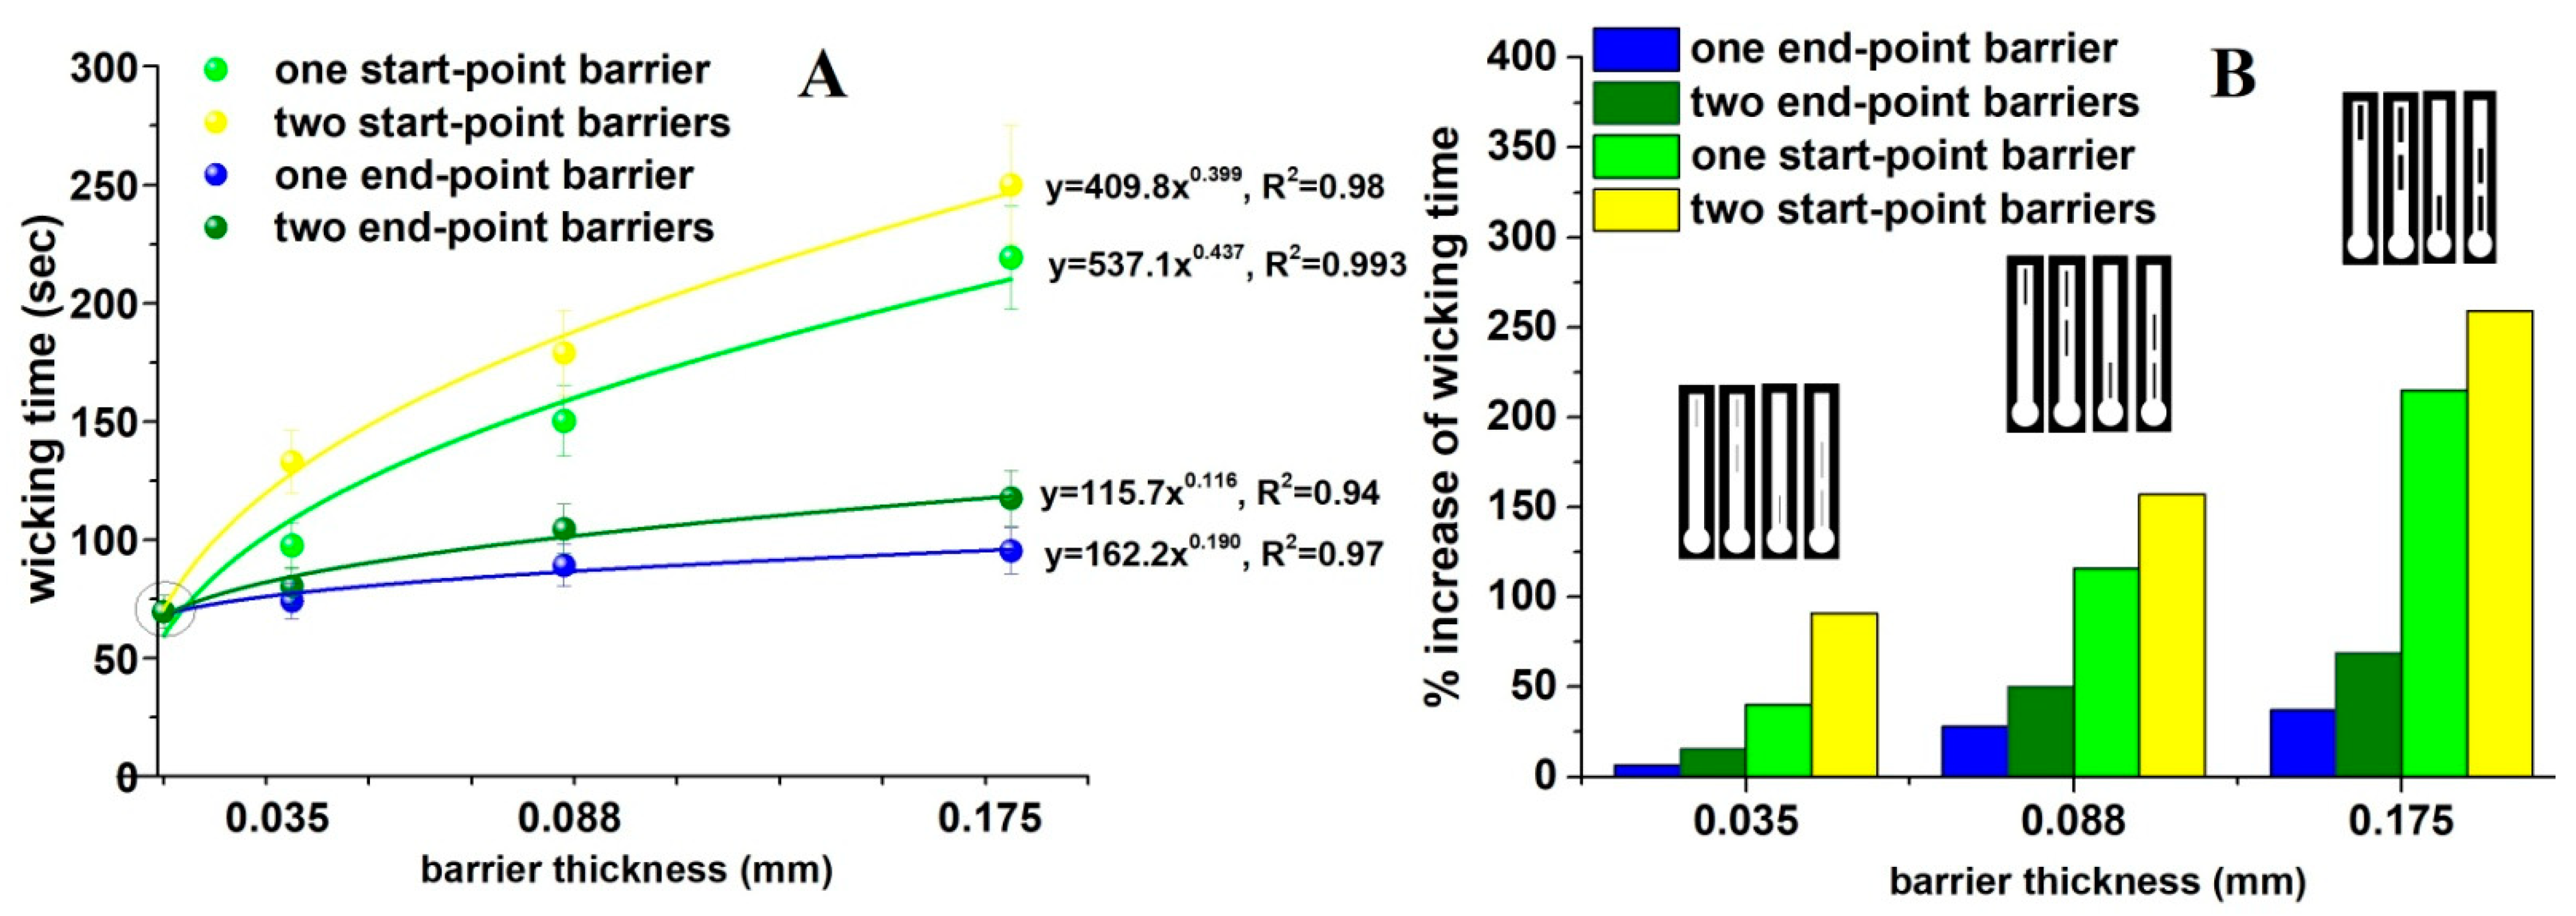
3.1. Hydrophobic Fluidic Delays for Delaying Fluid Transport

Fluidic time delays were introduced on μPADs by wax printing linear delays of variable width along the flow direction (Figure 1A). After heating the devices, the width of the flow path decreased from 0.25 cm to 0.16 cm, due to the lateral spreading of the wax, while the width of the linear delays also broadened (we could not measure the final width quantitatively because it was <1 mm), thereby further decreasing the width of the flow channel. The results of Figure 3 show a measurable reduction in wicking speed with increasing wax coverage that was accomplished by increasing the width of the barriers, the number of barriers in the flow regime and both. Compared to the standard open channel of the same dimensions, wicking time increased from 6 to 70%, as a function of the number of barriers and their width.
According to the Lucas–Washburn equation (Equation (1)) and Darcy’s law (Equation (2)), the decrease in flow rate can be explained by the decrease in the surface tension due to the increase in hydrophobicity in the flow path and the increase in water contact angle. Therefore, upon contact of the aqueous fluid with hydrophobic surfaces (device boundaries and barrier delays), an additional resistance force was added that delayed the fluid transport rate [24].
When the same linear barriers were printed at the beginning of the flow path, the wicking time decreased further. Compared to the standard open channel of the same dimensions, wicking time increased by 40 to 360% as a function of the number of barriers and their width (Figure 3). Since the geometric specifications of the barriers were the same (width and number of barriers) as those added at the end of the fluid path, the reduction in fluid transport rate could only be attributed to the geometric characteristics of the barriers. At the onset of capillary flow, the average liquid velocity is very small and assumed to be almost zero [19]. As the fluid leaves the sample deposition area, it comes in contact with the hydrophobic delay barrier. The water contact angle increases and surface tension decreases, causing a decrease in capillary pressure (Pc) (Equation (3)). Therefore, the flow rate decreases (Equations (2) and (3)).

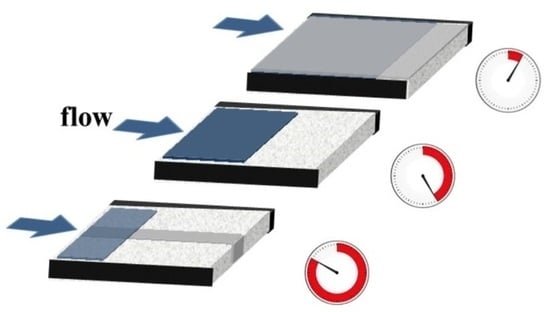
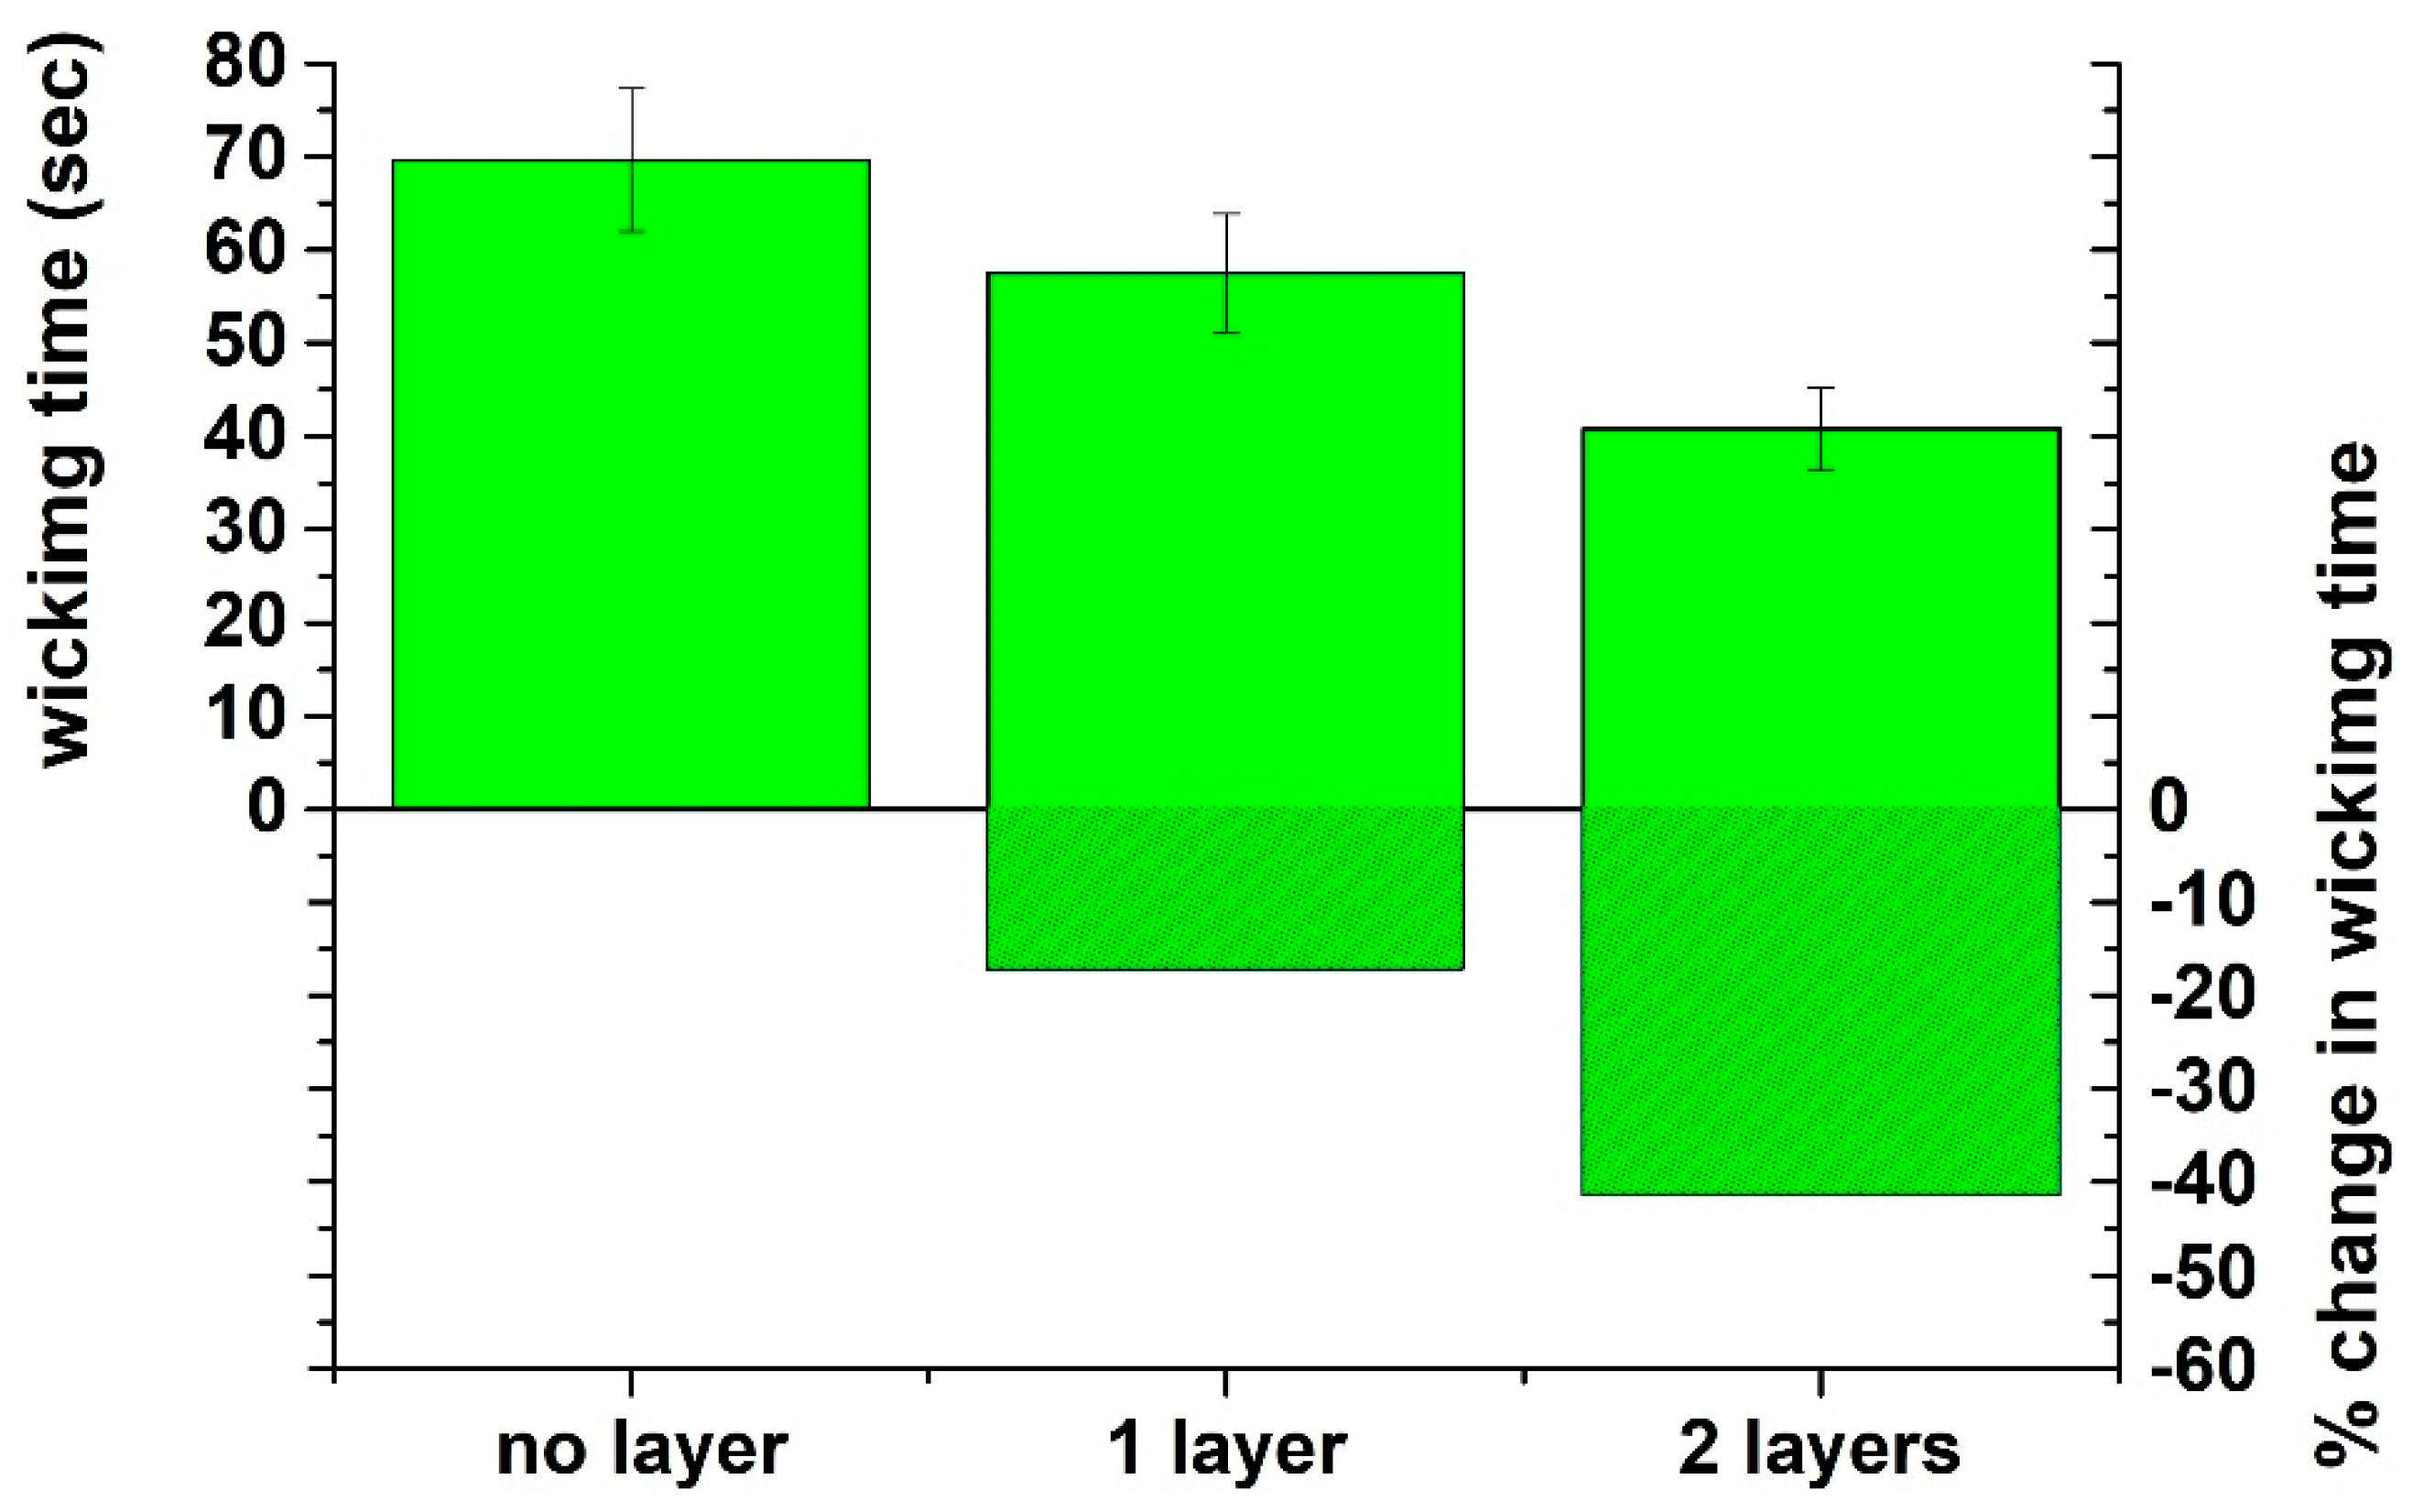
3.2. Hydrophobic Overlays for Accelerating Fluid Transport

Fluid accelerators were prepared by wax printing sheets of paper and heating them to accomplish full wax coverage. Then, these hydrophobic sheets were placed on top and on top–bottom of the hydrophilic flow path of the devices with the aid of adhesive tape to bring the two layers in close contact with the hydrophilic fluid path and cover its upper surface or fully enclose it. The bar plots of Figure 4 show that these layers accomplished the acceleration of fluid transport rate from 17% (one top layer) to 41% (one layer at top and one layer at bottom), corresponding to a decrease in wicking time from ~70 s in standard open channels to ~57 s and ~41 s, respectively.
According to Newton’s law of flow, the application of stress on a liquid leads to flow in direct proportion to the amount of stress applied. The overlaying hydrophobic layers repel the water, forcing it to move along the only favorable route, which is the hydrophilic fluid path, thus accelerating the flow rate. When two layers are used to fully enclose the hydrophilic zone, the flow is confined, creating a rectangular hydrophilic duct surrounded by hydrophobic barriers (top, bottom and sides). Hence, the phenomenon becomes more intense and movement along the hydrophilic path is greatly enhanced. Importantly, the evaporation of water is minimized, which further contributes to the higher flow rate. A conceptual representation of the potential flow regime on these devices is depicted in Figure S2.

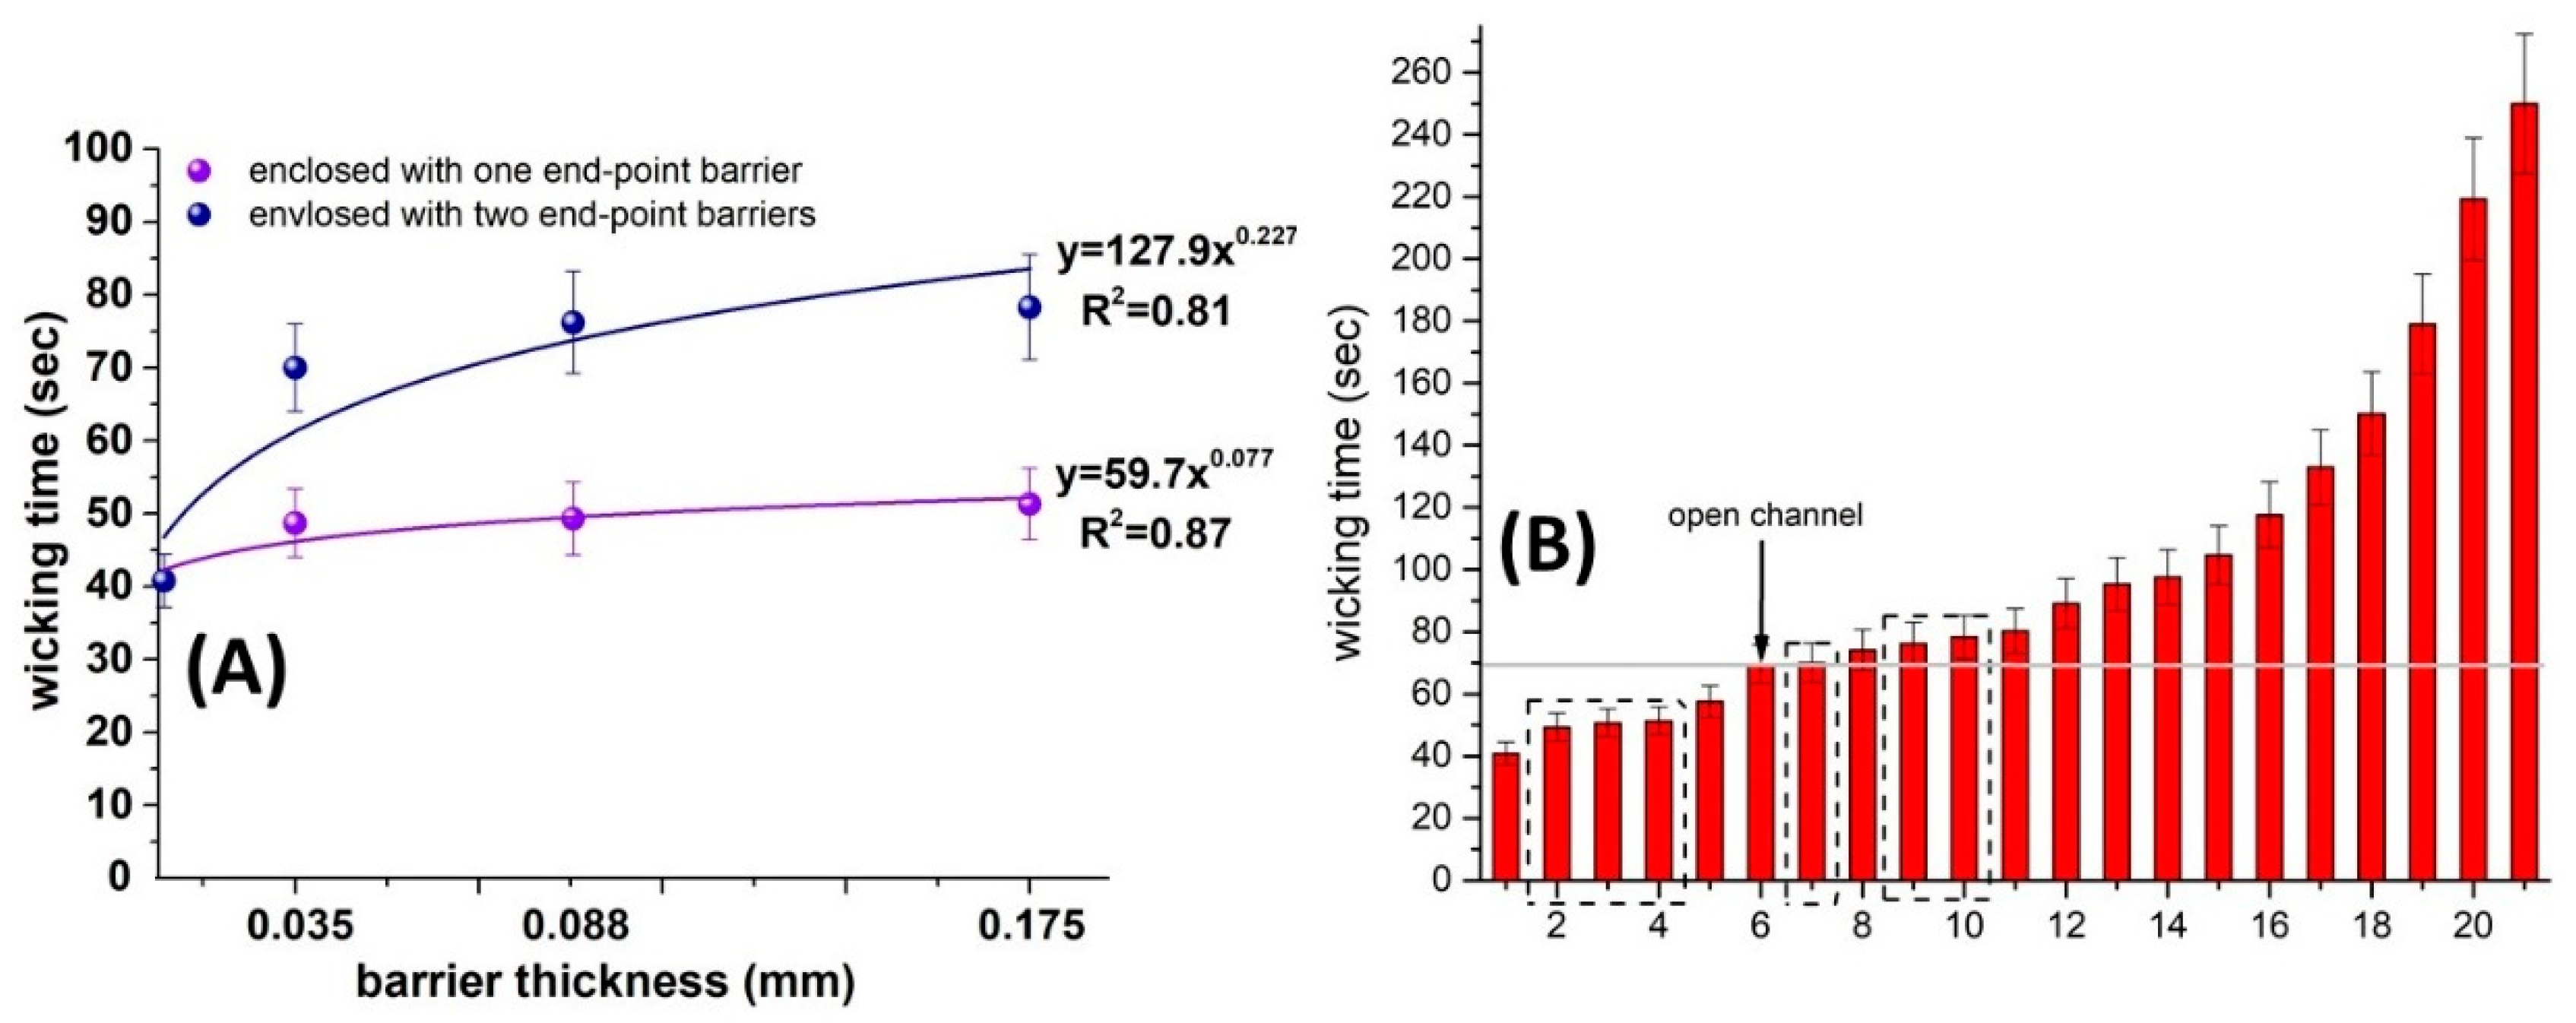
3.3. Combined Use of Fluidic Delays and Accelerators

The combination of fluidic delays (hydrophobic barriers) and accelerators (hydrophobic overlaying sheets) was examined as a tool to manipulate flow rate within narrower time intervals. To this end, the patterns containing one and two end-point hydrophobic barrier delays were fully enclosed within two overlaying hydrophobic layers to create a rectangular duct. The wicking times obtained by combining fluidic delays and accelerators, in comparison to the other fluid regulating patterns examined above, are depicted in Figure 5. From these bar plots, it can be inferred that intermediate wicking times were achieved, lying among the wicking times accomplished with hydrophobic delays without overlaying layers, overlaying layers without barriers, and open channels. Overall, the developed method offers great flexibility in adjusting the wicking rate over a wide temporal range that spans from 41 to 250 s as compared to devices with open channels (~70 s) (Figure 5).

3.4. Comparison with Similar Methods

The developed method is not the first to create hydrophobic barriers or accelerators in μPADs with the use of printing. Martinez and co-workers prepared fluidic time delays by printing wax on the top and bottom of hydrophilic channels to accomplish variable degrees of coverage, but without subsequent heating to avoid melting the wax and penetrating the paper. The same group also prepared paper devices that were fully enclosed by several layers of toner which increased the wicking rate. Τo compare the effect of these methods on wicking time with the results obtained in our study, we normalized for the differences in the design of the devices and their configuration by determining the percentage change in fluid wicking time required for the fluids to wick a distance of 1 mm and compared the results with those obtained without modification. The percentage change in wicking rate for each method is depicted in Figure S3. These bar plots show that wax and toner printing can be used to accomplish the accurate timing of fluid transport rate on paper devices over a wide period. The delay of fluid is more easily accomplished (from +0.6 to +283%), while fluid acceleration can be also achieved over shorter periods ranging from −11.6 to −41%.

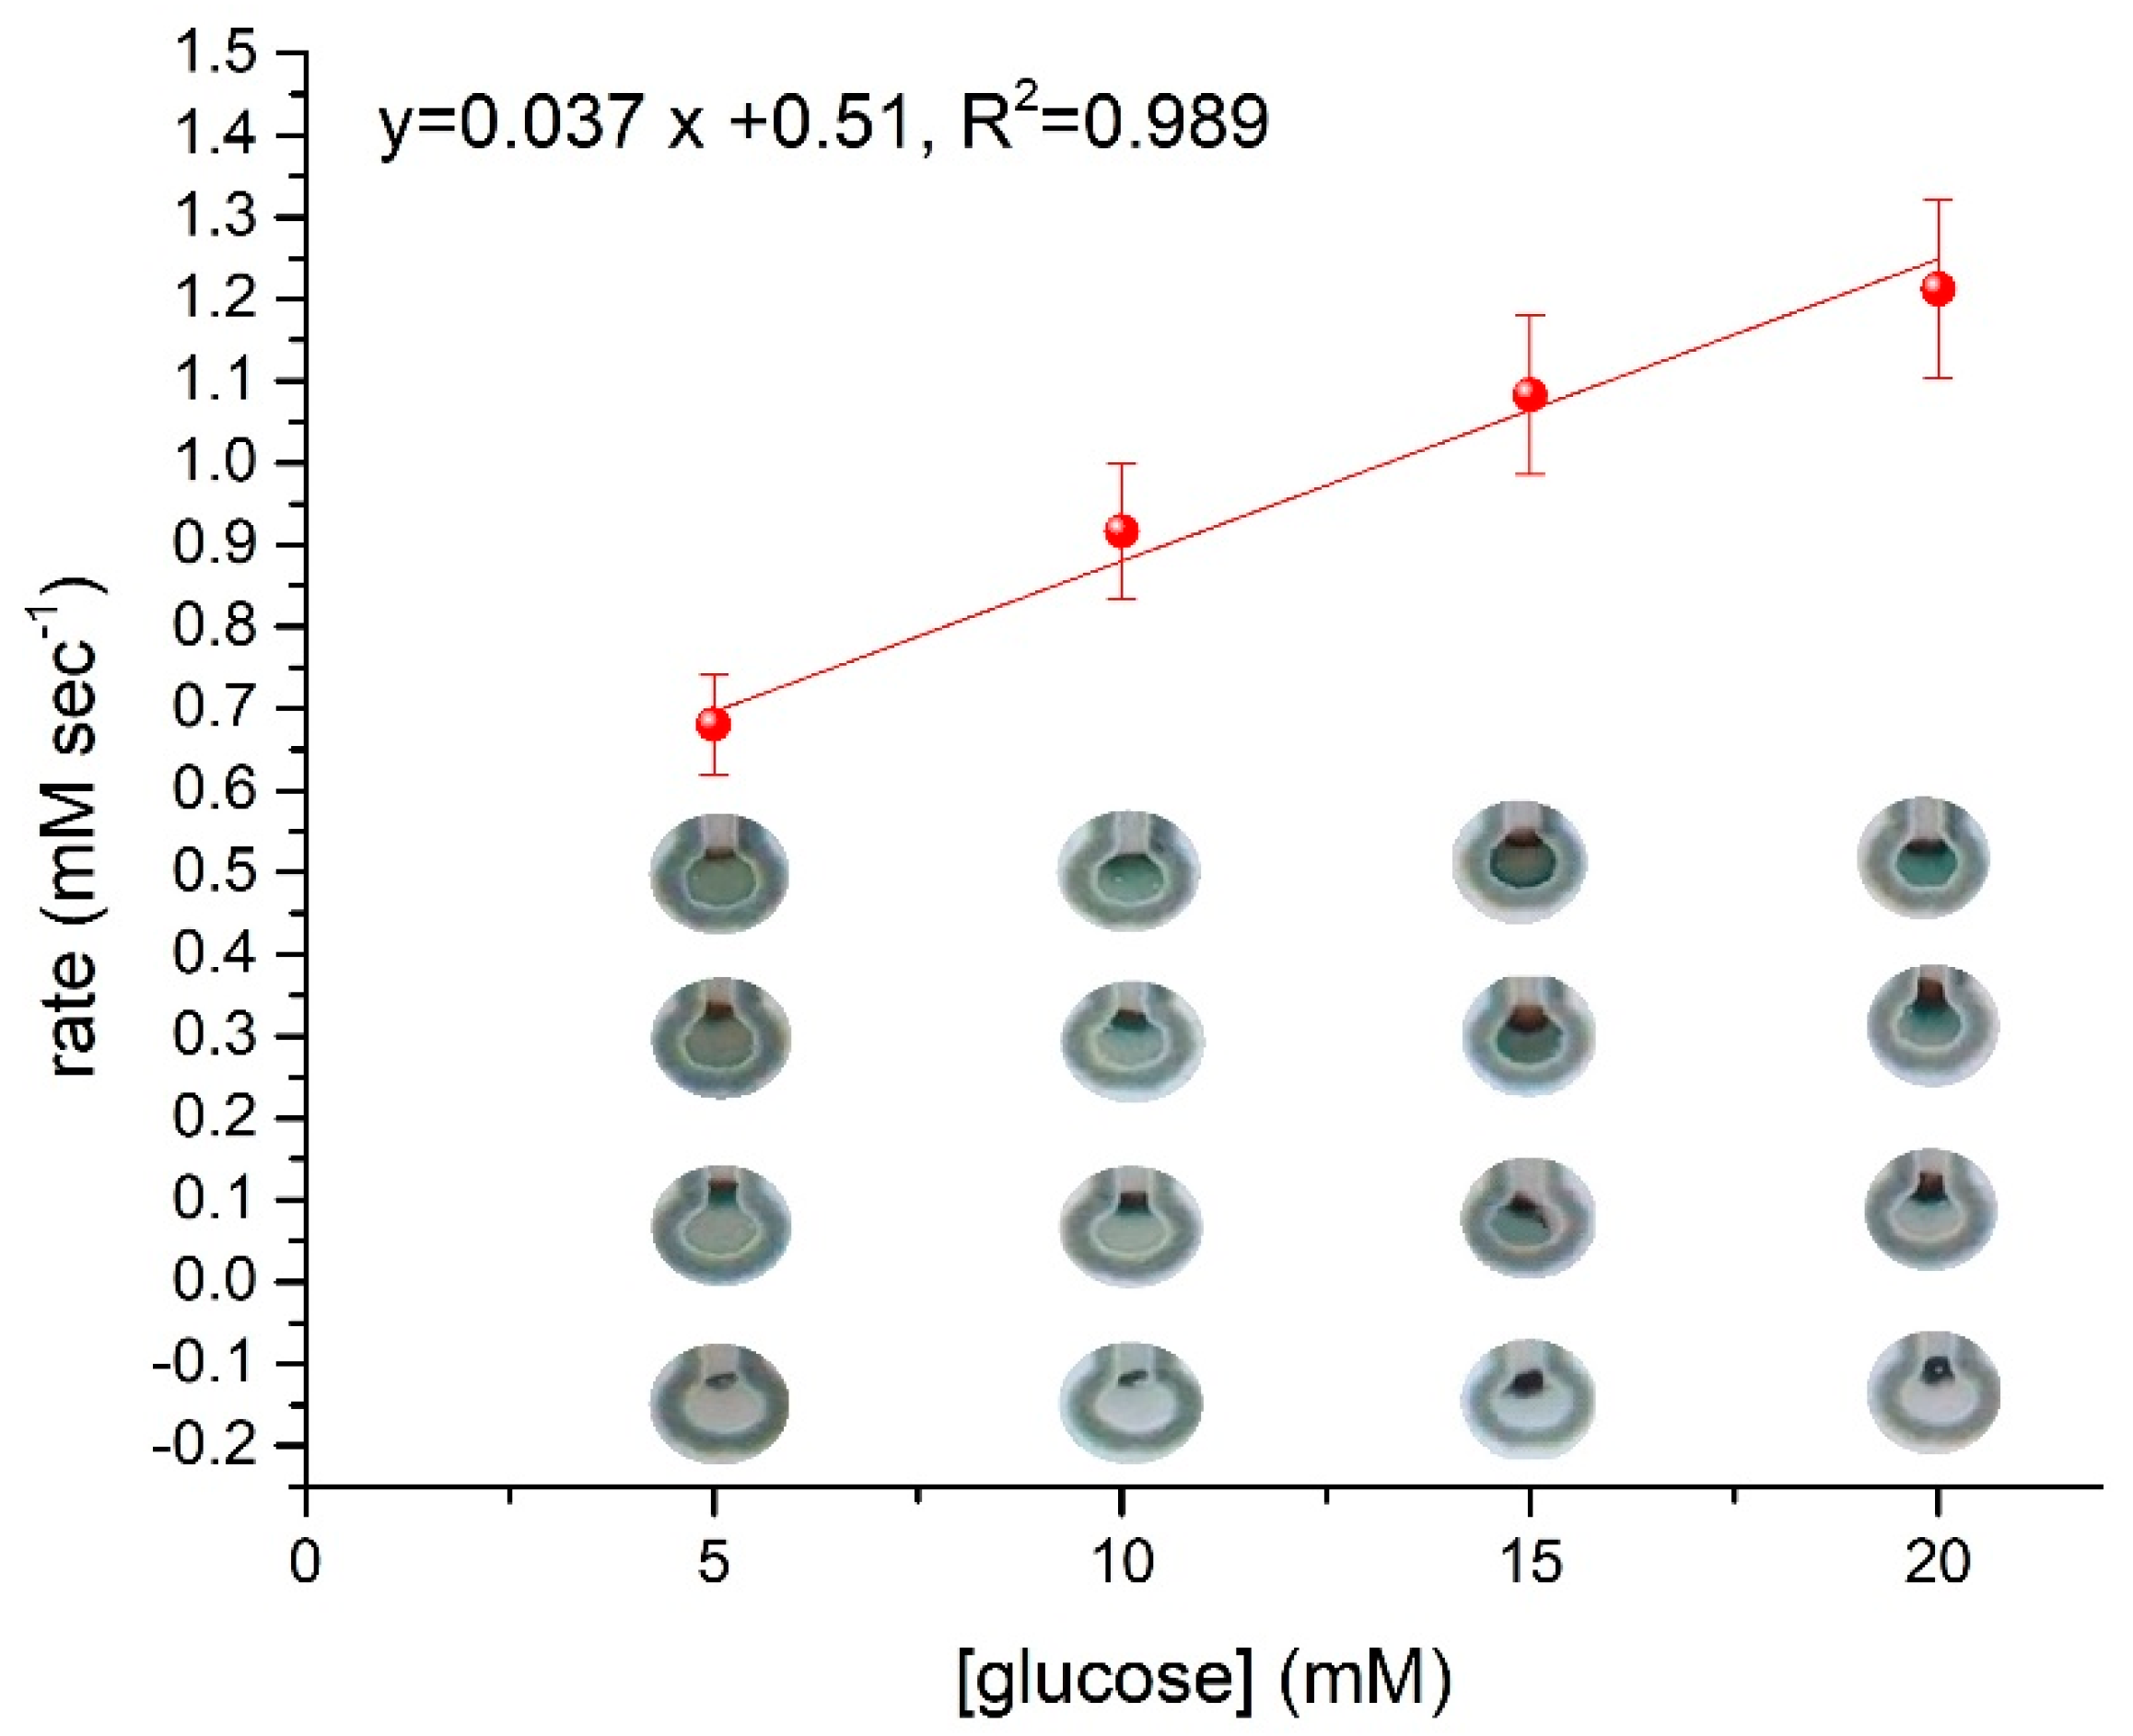
3.5. Paper-Based Kinetic Enzymatic Assay

A proof-of-concept kinetic assay was used to demonstrate the utility of fluidic time delays and accelerators to control the reaction rate on paper devices. Four devices with variable fluid transport rates were used so that in each device the sample is delivered at different time intervals in the detection zone. In this manner, the reaction time with the colorimetric reporter probes (o-dianisidine herein) varies inversely with the fluid transport rate (i.e., the faster the fluid rate, the longer the reaction time in the detection zone) (Table S1). For the analysis, the mean grey area intensity of the sensing areas was recorded for concentrations of glucose from 5 to 20 mM exactly at 138 s after sample deposition for all sensing channels. The plot of Figure 6 shows a linear increase in reaction rate with increasing glucose concentration up to 20 mM. A demonstration of the kinetic paper-based assay for the analysis of a sample containing 7.5 mM of glucose is depicted in Figure S4 and Video S1. The slope of the curve of Figure S4, which is the rate of reaction, was used to calculate the concentration of glucose from the inset equation of Figure 6 and found to be 6.76 mM, corresponding to 90.1% of the true value.

4. Conclusions

In this work, we developed a simple fabrication method that can be used to control fluid transport time on paper-based analytical devices over a wide temporal range that spans from 41 to 256 s. The main advantage of the method is that it uses only wax printing to prepare either fluidic delays or accelerators on the same device; this is accomplished by melting wax within the flow channel or by placing hydrophobic sheets of paper on top or top–bottom of the paper channel, respectively. In this manner, fluid control methods can be incorporated on paper devices in a single procedure without sophisticated materials, specialized apparatuses or advanced skills. Moreover, the described approach can combine both delays and accelerators to accomplish intermediate wicking times, is easily scalable to mass production and can be combined with other fluid control mechanisms (e.g., hollow or open channels, printed fluid control). As a proof of principle, the control of fluid wicking rate was used to develop a simple paper-based kinetic assay based on the enzymatic oxidation of glucose to H2O2 followed by a colorimetric reaction that was monitored over time. Considering the large number of kinetic assays, the present method could provide the basis for further expanding kinetic analytical assays on paper-based devices.

Supplementary Materials

The following supporting information can be downloaded at: https://www.mdpi.com/article/10.3390/chemosensors10050155/s1, Video S1: Demonstration of the kinetic paper-based assay for the analysis of glucose. Figure S1: Schematic illustration of the procedure for preparing the devices. Figure S2: Conceptual diagram of hydrophobic forces on water that is responsible for increasing fluid rate on paper; Figure S3: Change (% compared to open channels) in wicking times obtained by fluidic delays and accelerators (and combinations of them) as compared to fluid delays and accelerators prepared by other methods. The % change is calculated as the wicking time required for the fluid to travel a distance of 1 mm compared to the wicking time required for the fluid to travel a distance of 1 mm obtained in open channels. 1: two overlaying layers, 2: two overlaying layers with one end barrier of 0.035 mm width, 3: two overlaying layers with one end barrier of 0.088 mm width, 4: two overlaying layers with one end barrier of 0.175 mm width, 4T: fully covered channel with 4 layers of toner, 5: one overlaying layer, 6T: fully covered channel with 6 layers of toner, 6: regular (open) channel, 7: two overlaying layers with two end barriers of 0.035 mm width, 8: one end barrier of 0.035 mm width, 9: two overlaying layers with two end barriers of 0.088 mm width, 10: two overlaying layers with two end barriers of 0.175 mm width, 11: two end barriers of 0.035 mm width, 12: one end barrier of 0.088 mm width, 25w: channels with 25% wax covered (not melted), 13: one end barrier of 0.175 mm width, 14: one start barrier of 0.035 mm width, 50w: channels with 50% wax covered (not melted), 15: two end barriers of 0.088 mm width, 75w: channels with 75% wax covered (not melted), 16: two end barriers of 0.175 mm width, 100w: channels with 100% wax covered (not melted), 17: two start barriers of 0.035 mm width, 18: one start barrier of 0.088 mm width, 19: two start barriers of 0.088 mm width, 125w: channels with 125% wax covered (not melted), 20: one end barrier of 0.088 mm width, 150w: channels with 150% wax covered (not melted), 175w: channels with 175% wax covered (not melted), 21: two start barriers of 0.175 mm width, 200w: channels with 200% wax covered (not melted); Figure S4: Kinetic determination of glucose on paper-based devices using programmable fluid delivery time; Table S1: Fluid transport time and reaction time on paper devices used for the glucose assay.

Author Contributions

Conceptualization, G.Z.T. and D.L.G.; methodology, G.Z.T. and D.L.G.; investigation, M.T.; validation, M.T.; data curation, M.T., D.L.G. and G.Z.T.; writing—original draft preparation, D.L.G. and G.Z.T.; writing—review and editing, D.L.G. and G.Z.T. All authors have read and agreed to the published version of the manuscript.

Funding

This research received no external funding.

Institutional Review Board Statement

Not applicable.

Informed Consent Statement

Not applicable.

Data Availability Statement

Not applicable.

Conflicts of Interest

The authors declare no conflict of interest.

References

  1. Ozer, T.; McMahon, C.; Henry, C.S. Advances in paper-based analytical devices. Annu. Rev. Anal. Chem. 2020, 13, 85–109. [Google Scholar] [CrossRef] [Green Version]
  2. Ahmed, S.; Bui, M.-P.N.; Abbas, A. Paper-based chemical and biological sensors: Engineering aspects. Biosens. Bioelectron. 2016, 77, 249–263. [Google Scholar] [CrossRef] [PubMed]
  3. Almeida, M.I.G.S.; Jayawardane, B.M.; Kolev, S.D.; McKelvie, I.D. Developments of microfluidic paper-based analytical devices (μPADs) for water analysis: A review. Talanta 2018, 177, 176–190. [Google Scholar] [CrossRef] [PubMed]
  4. Noviana, E.; Ozer, T.; Carrell, C.S.; Link, J.S.; McMahon, C.; Jang, I.; Henry, C.S. Microfluidic Paper-Based Analytical Devices: From Design to Applications. Chem. Rev. 2021, 121, 11835–11885. [Google Scholar] [CrossRef] [PubMed]
  5. Nishat, S.; Jafry, A.T.; Martinez, A.W.; Awan, F.R. Paper-based microfluidics: Simplified fabrication and assay methods. Sens. Actuators B Chem. 2021, 336, 129681. [Google Scholar] [CrossRef]
  6. Noh, H.; Phillips, S.T. Metering the Capillary-Driven Flow of Fluids in Paper-Based Microfluidic Devices. Anal. Chem. 2010, 82, 4181–4187. [Google Scholar] [CrossRef]
  7. Vella, S.J.; Beattie, P.; Cademartiri, R.; Laromaine, A.; Martinez, A.W.; Phillips, S.T.; Mirica, K.A.; Whitesides, G.M. Measuring Markers of Liver Function Using a Micropatterned Paper Device Designed for Blood from a Fingerstick. Anal. Chem. 2012, 84, 2883–2891. [Google Scholar] [CrossRef] [Green Version]
  8. Lyu, X.; Hamedpour, V.; Sasaki, Y.; Zhang, Z.; Minami, T. 96-Well Microtiter Plate Made of Paper: A Printed Chemosensor Array for Quantitative Detection of Saccharides. Anal. Chem. 2021, 93, 1179–1184. [Google Scholar] [CrossRef]
  9. Kappi, F.A.; Tsogas, G.Z.; Routsi, A.-M.; Christodouleas, D.C.; Giokas, D.L. Paper-based devices for biothiols sensing using the photochemical reduction of silver halides. Anal. Chim. Acta 2018, 1036, 89–96. [Google Scholar] [CrossRef]
  10. Kappi, F.A.; Tsogas, G.Z.; Christodouleas, D.C.; Giokas, D.L. Calibrant-loaded paper-based analytical devices for standard addition quantitative assays. Sens. Actuators B Chem. 2017, 253, 860–867. [Google Scholar] [CrossRef]
  11. Chen, Y.-T.; Yang, J.-T. Detection of an amphiphilic biosample in a paper microchannel based on length. Biomed. Microdevices 2015, 17, 52. [Google Scholar] [CrossRef] [PubMed]
  12. Apilux, A.; Ukita, Y.; Chikae, M.; Chailapakul, O.; Takamura, Y. Development of automated paper-based devices for sequential multistep sandwich enzyme-linked immunosorbent assays using inkjet printing. Lab Chip 2013, 13, 126–135. [Google Scholar] [CrossRef] [PubMed]
  13. Renault, C.; Anderson, M.J.; Crooks, R.M. Electrochemistry in hollow-channel paper analytical devices. J. Am. Chem. Soc. 2014, 136, 4616–4623. [Google Scholar] [CrossRef]
  14. Kokkinos, C.T.; Giokas, D.L.; Economou, A.S.; Petrou, P.S.; Kakabakos, S.E. Paper-based microfluidic device with integrated sputtered electrodes for stripping voltammetric determination of DNA via quantum dot labeling. Anal. Chem. 2018, 90, 1092–1097. [Google Scholar] [CrossRef] [PubMed]
  15. Fu, E.; Downs, C. Progress in the development and integration of fluid flow control tools in paper microfluidics. Lab Chip 2017, 17, 614–628. [Google Scholar] [CrossRef]
  16. Akyazi, T.; Basabe-Desmonts, L.; Benito-Lopez, F. Review on microfluidic paper-based analytical devices towards commercialisation. Anal. Chim. Acta 2018, 1001, 1–17. [Google Scholar] [CrossRef]
  17. Giokas, D.L.; Tsogas, G.Z.; Vlessidis, A.G. Programming fluid transport in paper-based microfluidic devices using razor-crafted open channels. Anal. Chem. 2014, 86, 6202–6207. [Google Scholar] [CrossRef]
  18. Lim, H.; Jafry, A.T.; Lee, J. Fabrication, Flow Control, and Applications of Microfluidic Paper-Based Analytical Devices. Molecules 2019, 24, 2869. [Google Scholar] [CrossRef] [Green Version]
  19. Kumar, S.; Bhushan, P.; Bhattacharya, S. Fluid transport mechanisms in paper-based microfluidic devices. In Paper Microfluidics-Theory and Applications, 1st ed.; Bhattacharya, S., Kumar, S., Agarwal, K.A., Eds.; Springer: Singapore, 2019; pp. 7–28. [Google Scholar]
  20. Fu, E.; Ramsey, S.A.; Kauffman, P.; Lutz, B.; Yager, P. Transport in two-dimensional paper networks. Microfluid. Nanofluidics 2011, 10, 29–35. [Google Scholar] [CrossRef] [Green Version]
  21. Jang, I.; Song, S. Facile and precise flow control for a paper-based microfluidic device through varying paper permeability. Lab Chip 2015, 15, 3405–3412. [Google Scholar] [CrossRef]
  22. Noh, H.; Phillips, S.T. Fluidic timers for time-dependent, point-of-care assays on paper. Anal. Chem. 2010, 82, 8071–8078. [Google Scholar] [CrossRef] [PubMed]
  23. Weng, C.-H.; Chen, M.-Y.; Shen, C.-H.; Yang, R.-J. Colored wax-printed timers for two-dimensional and three-dimensional assays on paper-based devices. Biomicrofluidics 2014, 8, 066502. [Google Scholar] [CrossRef] [PubMed] [Green Version]
  24. Hong, S.; Kim, W. Dynamics of water imbibition through paper channels with wax boundaries. Microfluid. Nanofluidics 2015, 19, 845–853. [Google Scholar] [CrossRef]
Figure 1. Paper channels with wax-printed fluid delays and accelerators. (A) Top view diagrams (left side) and cross-section (right side) displaying regular channels as well as wax-printed linear line delays at the end and the beginning of the fluid flow path. The printed width of the linear delays (before heating) varied from 0.035 to 0.175 mm. (B) Top view diagrams (upper) and cross-section (bottom) displaying wax-printed layers placed on top or top–bottom of the regular channels. (C) Top view diagrams of (upper) and cross-section (bottom) displaying wax-printed layers placed on top or top–bottom of the channels containing linear wax-printed linear line delays at the end of the fluid flow path. The printed width of the linear delays (before heating) varied from 0.035 to 0.175 mm.
Chemosensors 10 00155 g001
Figure 2. Top view of paper channels incorporating various fluidic delays and accelerators for performing a kinetic glucose enzymatic assay.
Chemosensors 10 00155 g002
Figure 3. (A) Graph of wicking time as a function of linear line barrier width at the end and start of fluid flow. (B) Percentage increase in wicking time induced by each barrier compared to a regular (open) channel.
Chemosensors 10 00155 g003
Figure 4. Decrease in wicking time induced by 1 and 2 overlaying wax-printed (fully hydrophobic) layers and percentage decrease in wicking time compared to regular (open) channels.
Chemosensors 10 00155 g004
Figure 5. (A) Graph of wicking time as a function of linear line barrier width at the end of fluid flow enclosed between two hydrophobic layers. (B) Wicking times obtained by combining fluidic delays and accelerators (combined designs indicated by a dashed box) as compared to fluid delays and accelerators (without dashed box). 1: two overlaying layers, 2: two overlaying layers with one end barrier of 0.035 mm width, 3: two overlaying layers with one end barrier of 0.088 mm width, 4: two overlaying layers with one end barrier of 0.175 mm width, 5: one overlaying layer, 6: regular (open) channel, 7: two overlaying layers with two end barriers of 0.035 mm width, 8: one end barrier of 0.035 mm width, 9: two overlaying layers with two end barriers of 0.088 mm width, 10: two overlaying layers with two end barriers of 0.175 mm width, 11: two end barriers of 0.035 mm width, 12: one end barrier of 0.088 mm width, 13: one end barrier of 0.175 mm width, 14: one start barrier of 0.035 mm width, 15: two end barriers of 0.088 mm width, 16: two end barriers of 0.175 mm width, 17: two start barriers of 0.035 mm width, 18: one start barrier of 0.088 mm width, 19: two start barriers of 0.088 mm width, 20: one end barrier of 0.088 mm width, 21: two start barriers of 0.175 mm width.
Chemosensors 10 00155 g005
Figure 6. Kinetic plot of glucose reaction rate with o-dianisidine.
Chemosensors 10 00155 g006
Publisher’s Note: MDPI stays neutral with regard to jurisdictional claims in published maps and institutional affiliations.

