Article

Real-Time Fluorescence Imaging of His-Tag-Driven Conjugation of mCherry Proteins to Silver Nanowires

by
Martyna Jankowska
1,
Karolina Sulowska
1,
Kamil Wiwatowski
1,
Joanna Niedziółka-Jönsson
2 and
Sebastian Mackowski
1,*
1
Nanophotonics Group, Institute of Physics, Faculty of Physics, Astronomy and Informatics, Nicolaus Copernicus University in Torun, Grudziadzka 5, 87-100 Torun, Poland
2
Institute of Physical Chemistry Polish Academy of Sciences, ul. Kasprzaka 44/52, 01-224 Warsaw, Poland
*
Author to whom correspondence should be addressed.
Chemosensors 2022, 10(4), 149; https://doi.org/10.3390/chemosensors10040149
Submission received: 31 January 2022 / Revised: 30 March 2022 / Accepted: 12 April 2022 / Published: 18 April 2022
(This article belongs to the Special Issue Nanomaterials-Based Sensors)

Abstract

:
In this work, we aimed to apply fluorescence microscopy to image protein conjugation to Ni-NTA modified silver nanowires in real time via the His-tag attachment. First, a set of experiments was designed and performed for the mixtures of proteins and silver nanowires in order to demonstrate plasmon enhancement of mCherry protein fluorescence as well as the ability to image fluorescence of single molecules. The results indicated strong enhancement of single-protein fluorescence emission upon coupling with silver nanowires. This conclusion was supported by a decrease in the fluorescence decay time of mCherry proteins. Real-time imaging was carried out for a structure created by dropping protein solution onto a glass substrate with functionalized silver nanowires. We observed specific attachment of mCherry proteins to the nanowires, with the recognition time being much longer than in the case of streptavidin–biotin conjugation. This result indicated that it is possible to design a universal and efficient real-time sensing platform with plasmonically active functionalized silver nanowires.

1. Introduction

In recent years, research focused on applying nanomaterials as building blocks of functional devices has gained an important role in the development of biosensors [1,2]. In particular, metallic nanoparticles have been widely used for detecting proteins, molecules, and viruses [3,4,5,6] because of their unique physical and chemical properties, such as high thermal and chemical stability as well as the presence of a plasmon resonance [7,8]. The plasmon resonance can be utilized to enhance the optical response of analytes, should the geometry of the structure be properly designed. Among metallic nanoparticles, silver nanowires (AgNWs) are particularly interesting in the context of sensing because their plasmon resonance covers the whole visible range. At the same time, the nanowires feature lengths of up to hundreds of micrometers, which helps to localize them on a substrate. In addition, the nanowires provide relatively large surfaces suitable for proper surface modification and sensing [9,10].
The effect of fluorescence enhancement associated with the plasmon resonance in metallic nanoparticles can be advantageous for fast, efficient, and cheap detection of fluorescence [5,11]. In addition to increasing fluorescence intensity, the interaction between emitting analyte and metallic nanoparticles leads to shortening of fluorescence decay time [12,13,14]. The strength of this interaction strongly depends on the distance between emitters and the metallic nanoparticle, with the optimal values for maximizing fluorescence enhancement being 10–30 nm [15,16,17]. On the other hand, for shorter distances, the emission is frequently quenched [15,17].
In order to ensure proper distance and the required biorecognition, the surface of metallic nanoparticles should be properly functionalized. Conjugation with emitters typically involves binding via streptavidin–biotin [18,19], His–tag with Ni-NTA [20,21], or virus–antibody [22,23]. Streptavidin–biotin is one of the strongest conjugation pairs, and the conjugation is fast, occurring typically within a few seconds [24,25]. It was demonstrated that such a conjugation scheme allows observing the fluorescence of single proteins attached to silver nanowires in real time [26]. Conjugation via His-tag is more universal in the case of proteins, because the His-tag is a widely used linker for purification that consists of at least six histidine residues. These residues can easily coordinate with metal ions such as cooper or nickel [27,28]. In previous research [29] the proper conjugation of His–tag with Ni-NTA in solution was achieved after 60 min. This long conjugation time may indicate low practicality of this linker as a real-time sensing platform.
The aim of this work was to apply fluorescence microscopy to image protein conjugation to Ni-NTA-modified silver nanowires in real time via the His-tag attachment. With initial experiments carried out on mixtures of proteins and silver nanowires, we demonstrated plasmon enhancement of mCherry protein fluorescence as well as the ability to image the fluorescence of individual emitters. In addition, enhancement of single-protein fluorescence emission was also observed. The results obtained for a structure created by dropping a protein solution onto a glass substrate with functionalized silver nanowires indicated that mCherry indeed attached specifically to the nanowires in real time. Furthermore, as evidenced by time-resolved fluorescence measurement, which yielded strong shortening of the decay time, the emission of the mCherry protein could be enhanced through coupling with plasmon resonances in silver nanowires. We found that the recognition time was much longer than in the case of streptavidin–biotin conjugation. This result indicates that it is possible to design a universal and efficient real-time sensing platform with plasmonically active silver nanowires.

2. Materials and Methods

The mCherry protein was derived from DsRed, which in nature is isolated from the sea anemone Discosoma [29]. It is a monomeric, red, fluorescent protein expressed in Escherichia coli (E. coli) bacteria. The protein used herein was purchased from OriGene Technologies Inc., (Rockville, MD, USA), with stock concentration of 50 µg/mL. The structure of mCherry consists of three alpha-helices and a beta-sheet, as shown in Figure 1A [30]. In this work, we used purified mCherry proteins with an N-terminal His-tag. The weight of the protein is 26.5 kDa, and the fluorescence quantum yield is around 0.22.
The hybrid nanostructures studied in this work were assembled using mCherry proteins and silver nanowires (AgNWs). The polyol method was used to obtain AgNWs, and the synthesis was described in detail previously [10,31]. The diameters of AgNWs were in the range of 60–150 nm, and their lengths were up to 60 μm. As-synthesized AgNWs are coated with polyvinylpyrrolidone (PVP), and for the experiments, we used both as-synthesized nanowires and nanowires functionalized for proper conjugation with the mCherry protein. To achieve surface functionalization of AgNWs, several steps were taken to exchange PVP polymers for 6-amino-2-[bis(carboxymethyl)amino] hexanoic acid, which is able to complex nickel (II) ions (Ni-NTA). The whole procedure took place at room temperature and ambient atmosphere [32]. First, 250 µL of AgNW suspension was dispersed in distilled water and then centrifuged (2000 rpm, 20 min). The supernatant was removed, and the precipitate was collected and resuspended in 250 µL of dimethyl sulfoxide (DMSO) (POCH, HPLC). Then 1 mg/mL of [2-(2,5-dioxopyrrolidin-1-yl)propanoyloxydisulfanyl] 2-(2,5-dioxopyrrolidin-1-yl)propanoate (DTSP) (Sigma-Aldrich, Saint Louis, MO, USA) in DMSO was added to the AgNWs for 1 h-long incubation. Afterwards, the mixture was centrifuged and rinsed twice with 250 µL potassium carbonate (K2CO3) (0.5 mM) (Chempur, AR quality), and DTSP-modified AgNWs were resuspended in K2CO3. In the next step, the K2CO3 solution of 150 mM 6-amino-2-[bis(carboxymethyl)amino] hexanoic acid (Sigma-Aldrich, 97.00%) was added and incubated for 90 min. The resulting suspension of NTA-terminated AgNWs was once more centrifuged and rinsed. Then, AgNWs-NTA were dispersed in 250 µL of 5 mM nickel(2+); sulfate (NiSO4) (Sigma-Aldrich, 99.99%). In the final step, the AgNWs-Ni-NTA were extracted by centrifugation and rinsed in 250 µL high-purity water (for HPCE, Sigma-Aldrich) twice.
The optical properties of aqueous suspensions of mCherry protein and AgNWs were characterized by absorption and emission spectroscopy. A Varian-Cary 50 spectrophotometer (Agilent Technologies, Santa Clara, CA, USA) was used to measure extinction and absorption spectra. Emission spectra of mCherry protein were measured with a FluoroLog 3 spectrofluorometer (Horiba Jobin Yvon, Longjumeau, France). The excitation wavelength was 540 nm, and the emission spectra were taken from 560 nm to 700 nm with 1 nm increments.
The experiments were performed for four different sample configurations: (I) mixture of unmodified AgNWs and concentrated mCherry in a polymer matrix; (II) mixture of unmodified AgNWs and diluted mCherry in a polymer matrix; (III) mCherry conjugated with AgNWs modified with Ni-NTA in polymer matrix; and (IV) real-time conjugation of mCherry to Ni-NTA-modified AgNWs As a polymer matrix, 0.4% poly(vinyl alcohol) (PVA) solution in water was used (Sigma Aldrich, Moviol 20-96). The final concentrations of mCherry in the PVA matrix were 0.5 µg/mL and 5 ng/mL for the concentrated and diluted samples, respectively. Then, the suspensions were spin coated on a glass coverslip, which resulted in a thin layer of mCherry with silver nanowires in the PVA matrix. The polymer provided protection for the protein and allowed obtaining a uniform, homogeneous layer. Glass coverslips were washed in an ultrasonic cleaner in 2% Hellmanex solution at 35 °C for 30 min and then rinsed in distilled water for 15 min at the same temperature.
A third sample was prepared by mixing 5 µL of 5 µg/mL mCherry aqueous solution and 10 μL of Ni-NTA-modified AgNWs. The mixture was incubated for 1 h for conjugation. After that, the conjugate was purified in water to remove unattached protein by centrifugation (2000 rpm, 20 min). Finally, the precipitate was dispersed in 15 μL of high-purity water, and 15 μL of 0.4% PVA polymer solution was added. The solution was dropped and spin coated (17 rps) onto a microscope glass coverslip.
The final experimental configuration was a real-time conjugation. In this case, we deposited 3 μL of functionalized silver nanowires (AgNWs-Ni-NTA) on a glass coverslip. After 10 min, during which the nanowires dried, 5 μL of mCherry solution (0.5 µg/mL) was dropped onto the surface. The dynamics of fluorescence were continuously monitored.
The wide-field fluorescence microscopy used in our experiments enabled measurements of transmission maps for localizing silver nanowires and fluorescence intensity maps, including acquisition of films. The microscope was based on a Nikon Ti-U inverted body. The light source used for the excitation of fluorescence was an LED illuminator (Mic LED, Prizmatix Ltd., Givat-Shmuel, Israel) at a wavelength of 535 nm and power equal to 100 µW. The excitation beam from the LED illuminator was reflected from a dichroic mirror (D580) to an oil-immersion objective (Nikon Plan Apo 100×, NA 1.4). Fluorescence emission of mCherry was filtered using a bandpass filter 610/40 (Chroma, Bellows Falls, VT, USA) and edge filters FEL550 and FELH550 (Thorlabs, Newton, NJ, USA), and the signal was registered using a detector. This system was equipped with a sensitive EMCCD camera (iXon3, Andor, Abingdon, UK), which allowed improving the signal-to-noise ratio with electron multiplication gain (EM gain). In this way, the fluorescence of individual emitters could be measured. The following parameters were used to study the fluorescence properties of each type of structure: (1) for mCherry mixed with AgNWs, the EM gain was 700, the acquisition time was 1 s, and the excitation power was 370 µW; (2) for the highly diluted mCherry mixture with AgNWs, the EM gain was increased to 1000, while the acquisition time was 2 s; (3) for mCherry conjugated with AgNWs, the EM gain was 10, the acquisition time was 1 s, and the excitation power was 100 µW. Finally, in order to monitor real-time conjugation of mCherry to silver nanowires, films were recorded for 15 min with acquisition times of 0.5 s with 0.5 s breaks and EM gain of 10.
Time-resolved fluorescence measurements were performed using a home-built confocal fluorescence microscope based on a Nikon Eclipse Ti-S body. This microscope was capable of collecting confocal fluorescence intensity maps, emission spectra, and decay curves. The excitation of a 485 nm laser (BDL-SMN-485, Becker&Hickl, Berlin, Germany) was focused using a high NA-oil-immersion objective (Plan Apo VC, 60x, Nikon). The high-NA objective provided a high resolution of approximately 210 nm for our setup. The same objective was used for fluorescence signal collection. The fluorescence signal was guided through a 50/50 beam splitter and a long pass filter (FEL600, Newton, Thorlabs, Newton, NJ, USA) to the detection section of our microscope. Fluorescence spectra were measured with a CCD camera (DV 420A-BV-CCD, Andor iDus, Abingdon, GB) coupled with an Amici prism. For fluorescence intensity decay curve measurements, we used a time-correlated single photon counting module (SPC-150, Becker&Hickl, Berlin, Germany) with a fast avalanche photodiode (ID100-50, ID Quantique, Geneva, Switzerland) as a detector. Fluorescence intensity maps were acquired by correlating piezoelectric stage movement with avalanche photodiode readout (SPCM-AQRH-16, PerkinElmer, Boston, MA, USA). For measurements using both avalanche photodiodes, we used an additional bandpass filter (FB610/40, Newton, Thorlabs, Newton, NJ, USA).

3. Results and Discussion

Absorption and emission spectra of the mCherry protein solution, as well as the extinction spectrum of the AgNW suspension, are shown in Figure 1B. The absorption spectrum consisted of a broad band between 500 and 610 nm, with a noticeable shoulder at 540 nm and one distinct maximum band at 589 nm, and the emission spectrum featured a maximum at 610 nm, in accord with previous reports [33]. The extinction spectrum of AgNWs was broad, covering the whole visible range, and presented a broad peak with a maximum at 390 nm [34]. The extinction spectrum of the AgNWs overlapped with the mCherry absorption spectrum.

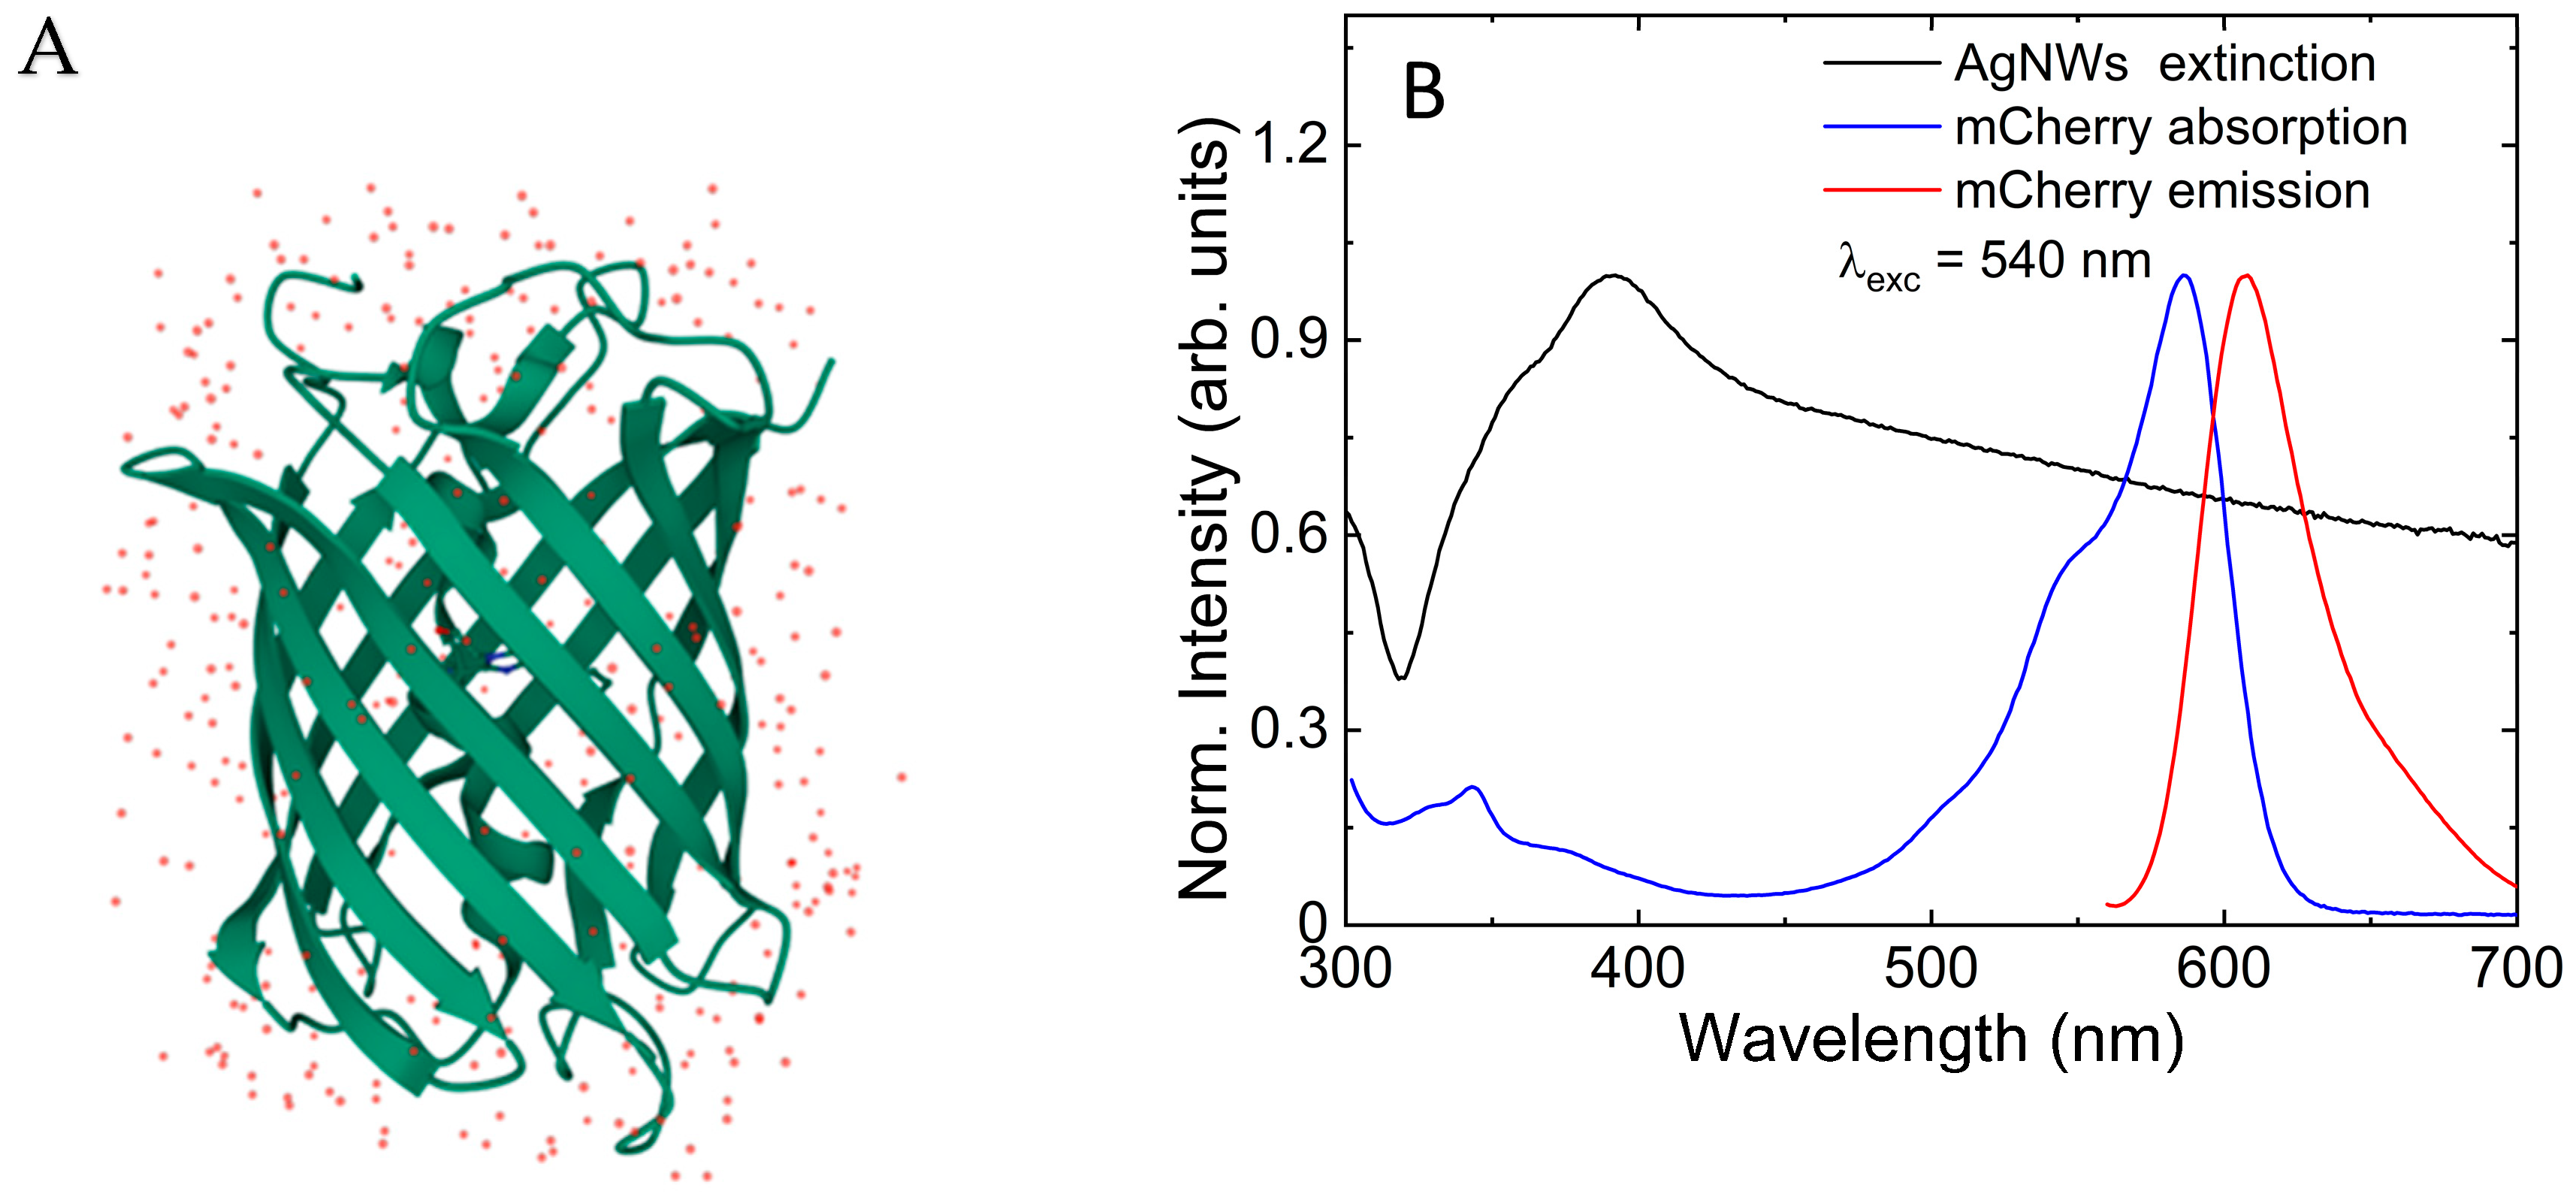
3.1. Fluorescence of mCherry Proteins Mixed with AgNWs

In order to study the optical properties of hybrid nanostructures composed of mCherry protein and silver nanowires, we applied wide-field fluorescence microscopy imaging to collect series of fluorescence intensity maps for the excitation wavelength of 535 nm. Typical maps acquired for the mixture of mCherry with AgNWs for two protein concentrations (0.5 µg/mL and 5 ng/mL) are shown in Figure 2. In addition to the fluorescence maps, we also compared cross-sections of fluorescence intensity extracted along selected silver nanowires together with corresponding cross-sections obtained for the same shapes off the nanowire. First, for the mixture of mCherry protein in ensemble concentration (0.5 ug/mL) with AgNWs (Figure 2A), the image featured elongated shapes of high fluorescence intensity. These were attributed to the emission of mCherry protein located in the vicinity of silver nanowires. The rather homogenous background originated from the uniformly distributed proteins in the PVA polymer matrix. Importantly, very few agglomerates were found in the sample. Qualitatively similar images were observed recently for other photoactive protein-containing hybrid nanostructures [34], including considerably stronger emission at the ends of the nanowire. The emission intensity measured along the nanowire for mCherry placed in the vicinity of silver nanowires was approximately three times higher than that for mCherry on the glass (3000 vs. 1000 counts (Figure 2B)). We attributed this increase to plasmon-enhanced fluorescence of the mCherry protein [34].
One of the direct consequences of the plasmon enhancement of fluorescence emission is the possibility to observe the fluorescence of individual proteins [26], even if they have moderate quantum yields. A fluorescence image obtained for a structure in which the concentration of mCherry was highly diluted to reach the conditions in which emission of individual proteins could be observed is shown in Figure 2C. The observation of the fluorescence of individual mCherry proteins was evidenced by detection of blinking and photobleaching effects (see Video S1 in Supplementary Materials). The image displayed in Figure 2C included many diffraction-limited spots, which to a large extent could be ascribed to the fluorescence of single mCherry proteins. Some of these spots were located close to the nanowire, while there was also a considerable number of spots in the background. This was expected, as the sample was prepared using spin coating, in which the distribution of proteins in the PVA layer is random. The cross-section along the nanowire featured very narrow, high-intensity peaks, which could be assigned to the fluorescence of single mCherry proteins (Figure 2D). While some of these proteins may have been located close to the nanowire, there was also a finite probability that they were further apart, since the thickness of the PVA layer was about 100 nm. The maximum intensity of these sharp peaks was about 4000 counts. Exemplary cross-sections taken through the emission spots located off the nanowire are presented in Supplementary Figure S2, where narrow peaks due to emission of single mCherry proteins were also observed. The fluorescence intensity of single mCherry proteins placed in the vicinity of AgNWs was higher than that of single mCherry proteins on glass.
In order to visualize the influence of plasmon excitations in silver nanowires on the optical properties of mCherry protein, in particular the fluorescence intensity, we selected approximately 60 emission spots located on and off of the AgNWs. The histograms shown in Figure 3 were obtained by calculating the intensity of fluorescence intensity by integrating 5 × 5 pixel areas containing emission spots. In the selection process, we rejected agglomerates characterized by unusually high emission intensity. This procedure was applied for single mCherry proteins located in vicinity of AgNWs and compared with the emission intensity extracted for single mCherry proteins on glass. For proteins on glass, the distribution was rather narrow, centered around 1500 counts. On the other hand, the intensity distribution for mCherry imaged in the vicinity of silver nanowires was much broader and extended towards higher intensity values. Indeed, the average intensity measured in this case was approximately 3000 counts, i.e., twofold higher than in the case of mCherry on glass substrate. This behavior pointed towards the complexity of the structure, with a highly diluted protein layer, and may suggest that although the emission of mCherry proteins was optically located on the nanowire, in reality, the separation between mCherry and the nanowire was larger, perhaps significantly exceeding the 10–20 nm range, where strong plasmonic enhancement of fluorescence intensity is expected. This interpretation is supported first by the method of sample fabrication and second by the fact that a considerable number of single mCherry proteins imaged on silver nanowires featured emission intensities that fell within the range measured for mCherry on glass. We conclude that the high-intensity tail can be ascribed to the emission of mCherry proteins that were closer to the silver nanowires, thus experiencing a stronger plasmon enhancement effect. Therefore, based on this fluorescence imaging experiment, which nevertheless suggested the emergence of plasmonic enhancement of fluorescence, it was not possible to estimate the scale of the enhancement. This would require developing ways of controlling the morphology of the structure.

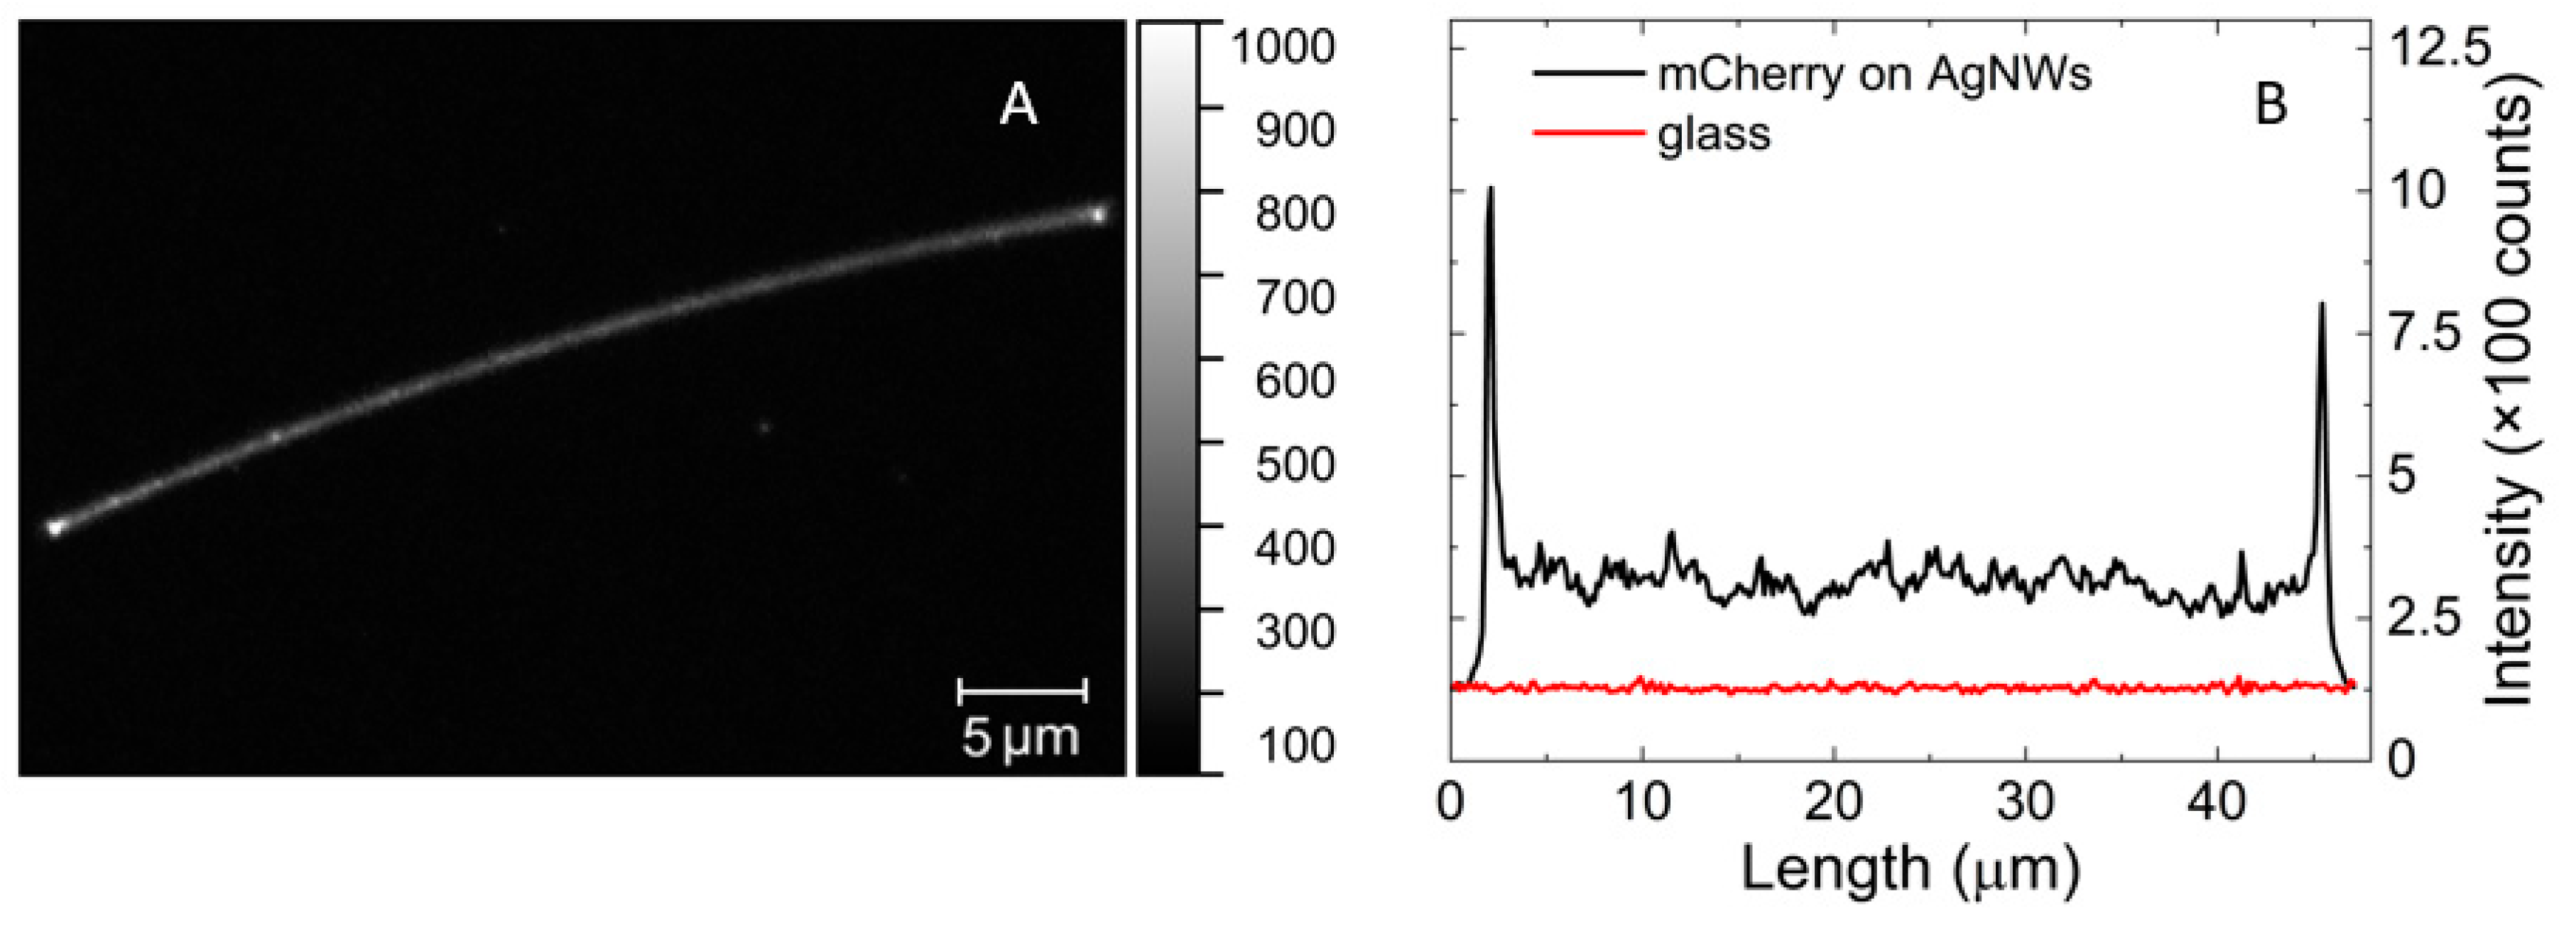
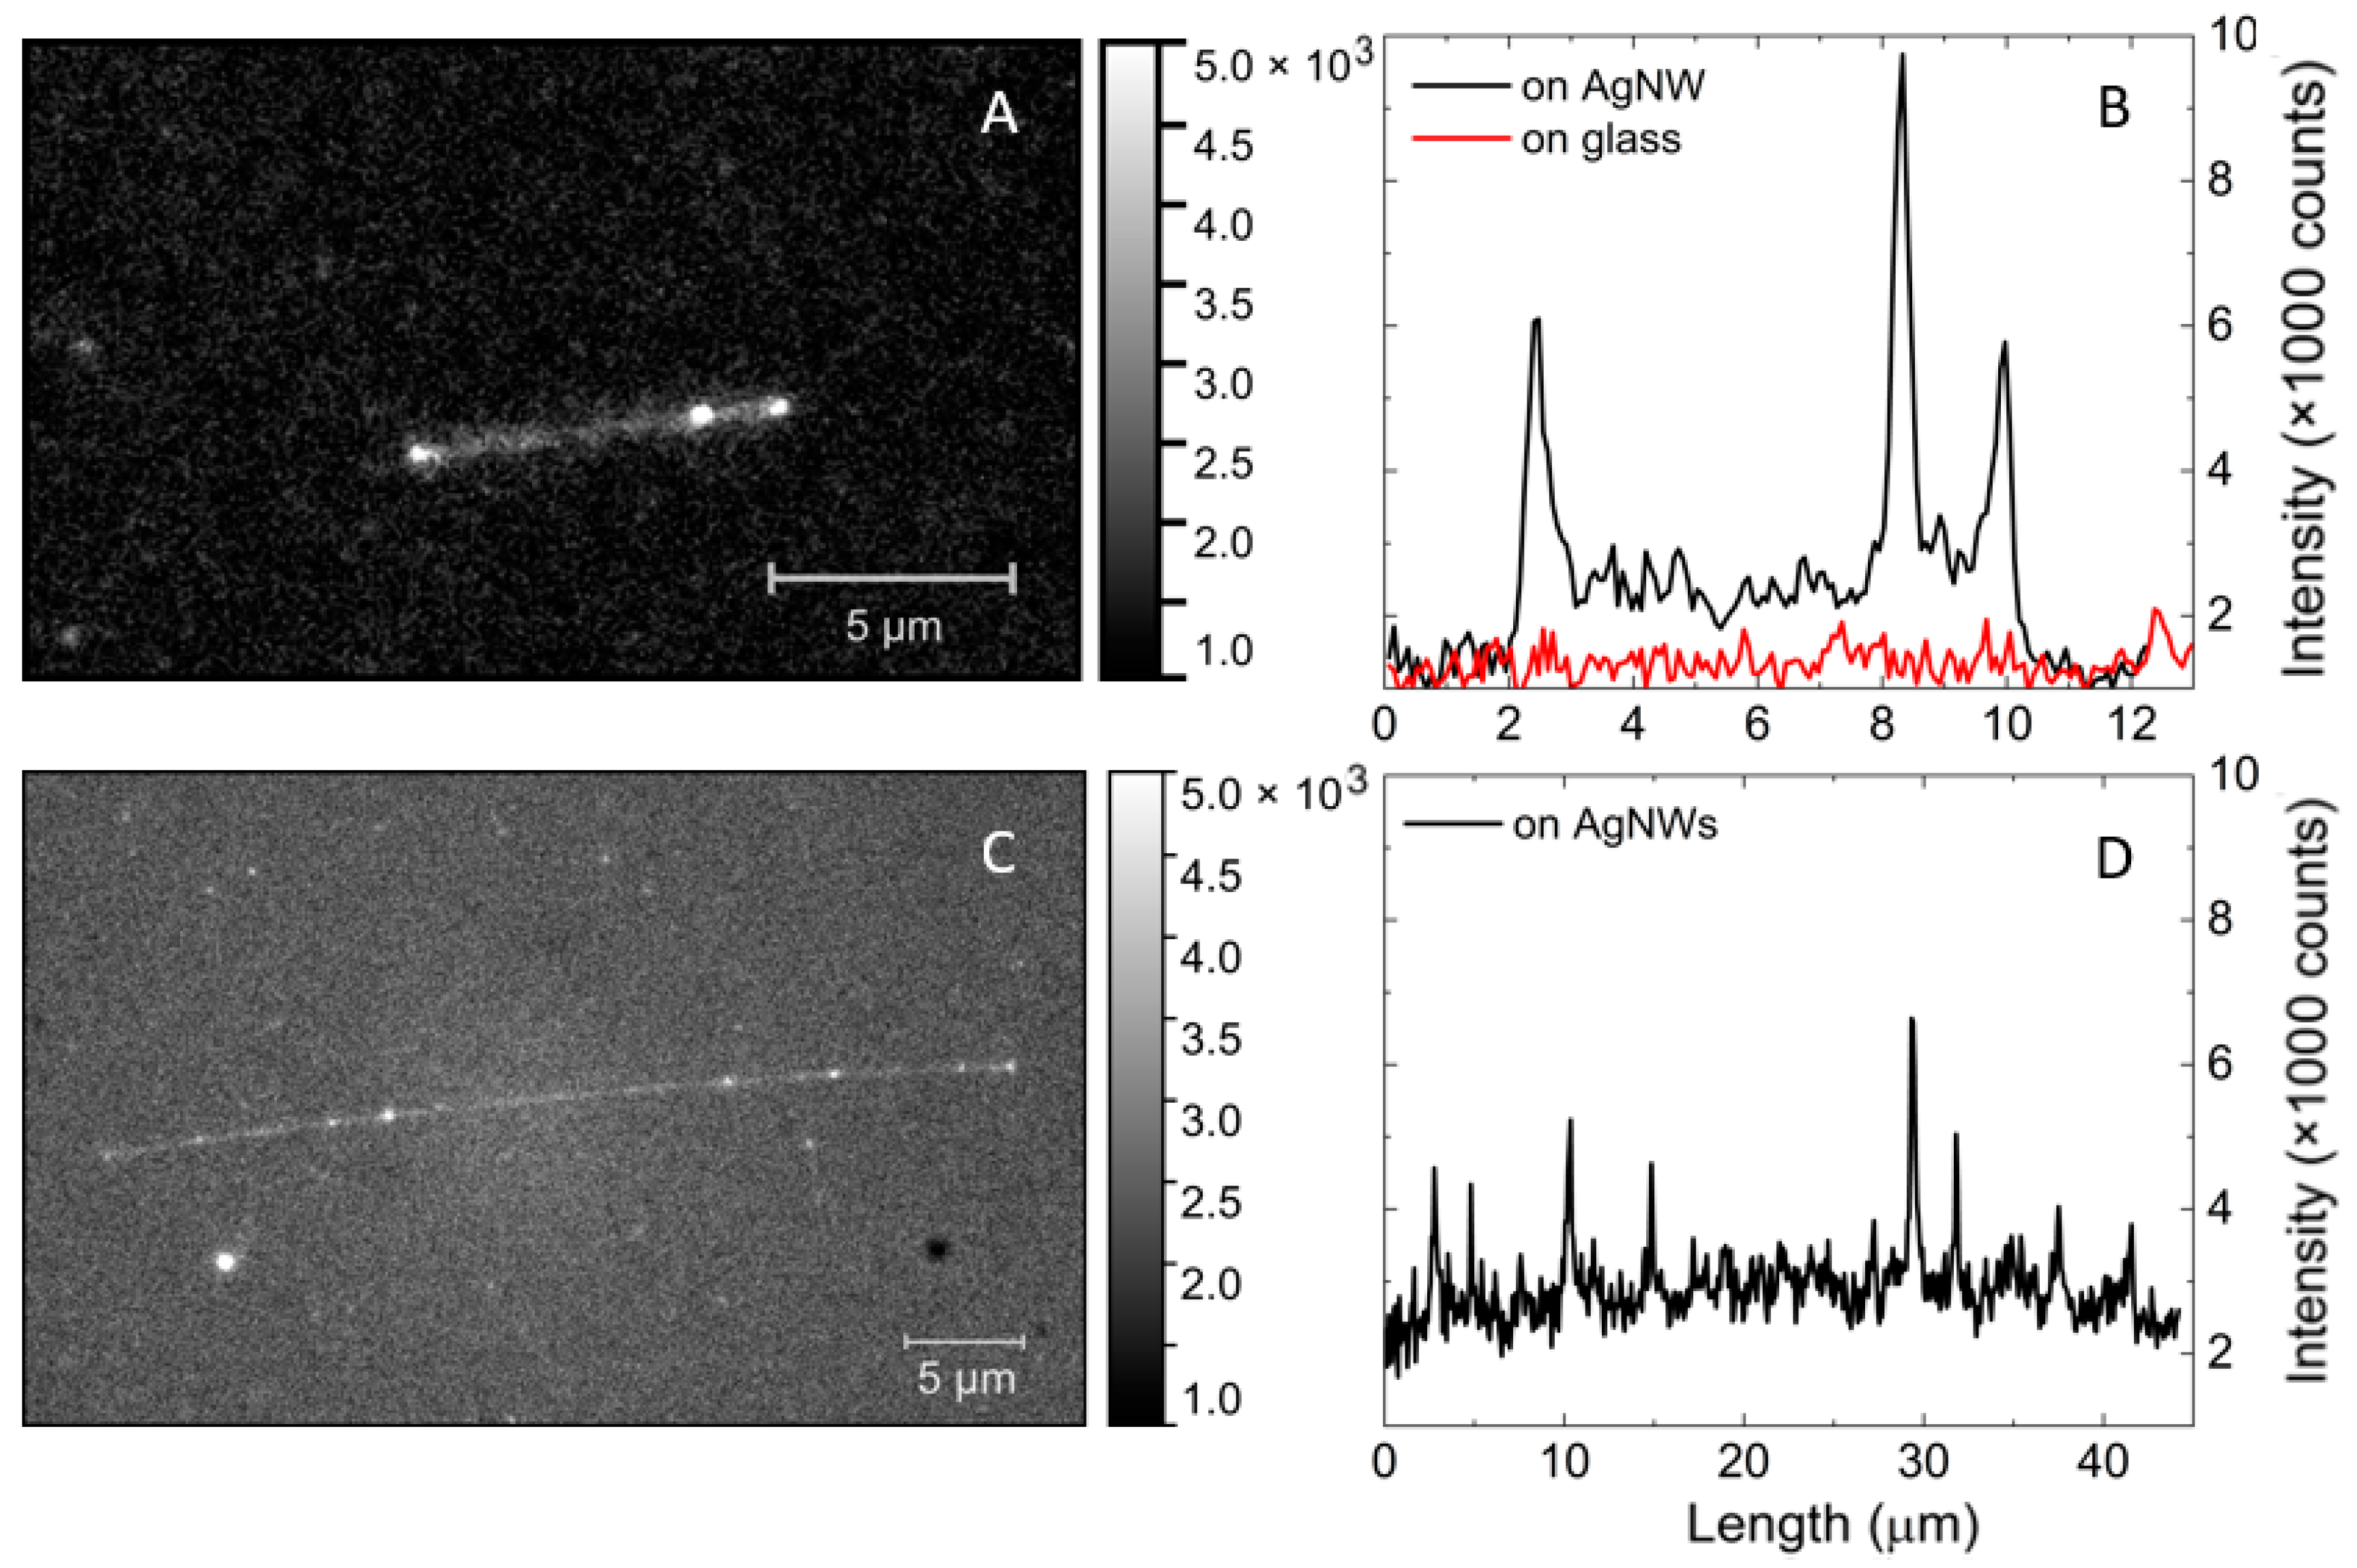
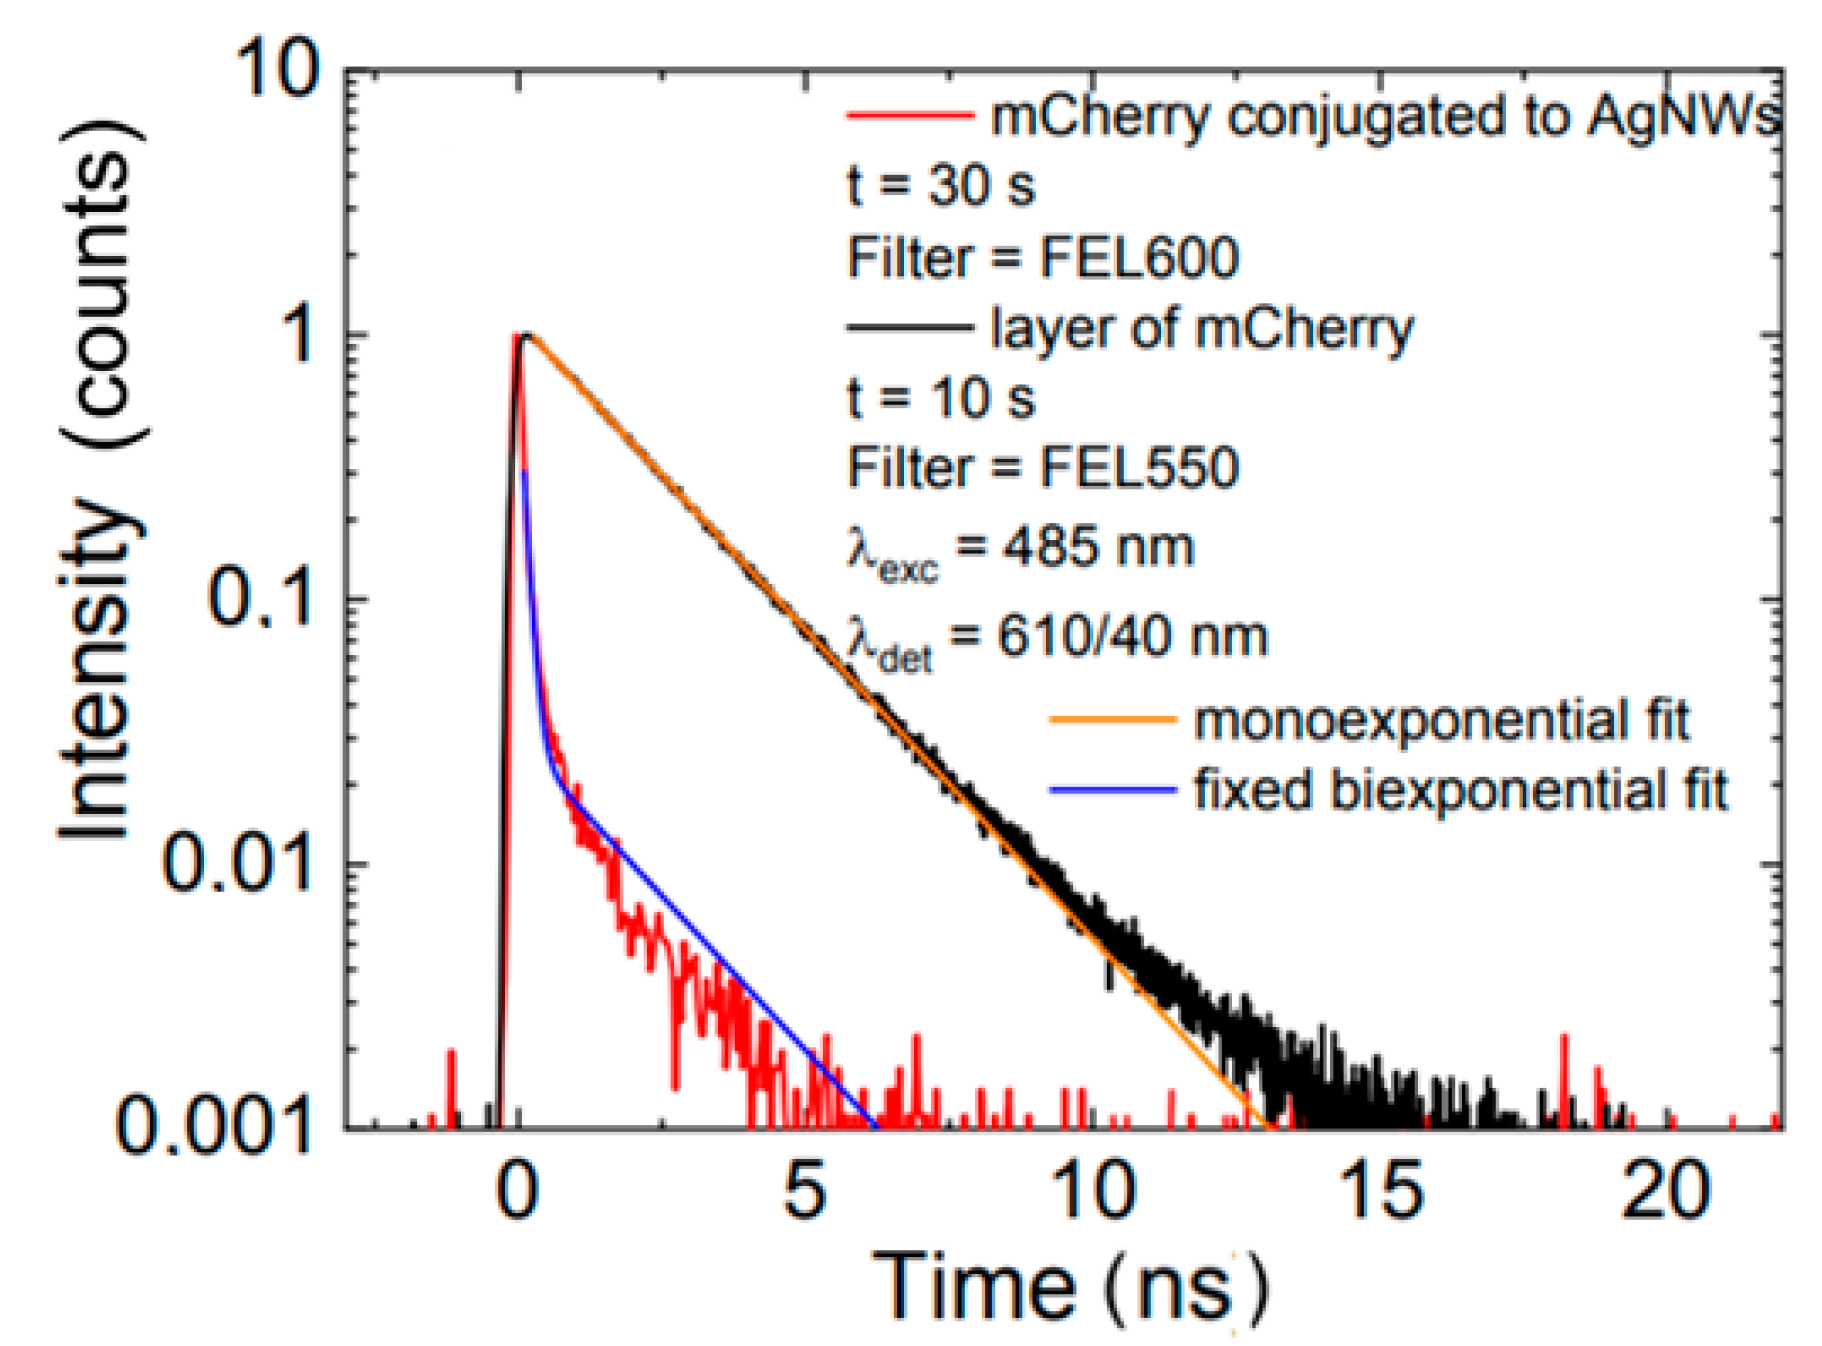
3.2. Fluorescence of mCherry/AgNWs Conjugates

Control of morphology can be achieved by surface functionalization of silver nanowires [26,32] aimed at conjugation with the protein. This is also vital from the point of view of using silver nanowires as sensing platforms. Conjugation was carried out using Ni-NTA-based chemistry [32]. Upon mixing properly functionalized silver nanowires with mCherry protein in solution, the optical properties of the hybrid structures were analyzed using wide-field fluorescence microscopy. In Figure 4A, we display a typical image obtained for this sample, which features strong and homogenous emission of mCherry protein conjugated to silver nanowires. There were a few emission spots off the nanowire, most probably originating from incomplete sample purification. The uniform emission of the protein conjugated with nanowire indicated properly designed and efficient functionalization of AgNWs. This is shown in Figure 4B, where a cross-section along the nanowire is displayed. The fluorescence intensity of mCherry on AgNWs was about three times stronger than that of the background, but it is important to note that there was only a monolayer of proteins coating the nanowire. At the ends of the nanowire, we observed a sharp increase in fluorescence intensity, which was due to the larger numbers of proteins attached to the tips of nanowire as well as increased scattering of light at the nanowire ends. Importantly, the functionalization and conjugation scheme applied for assembling mCherry on AgNWs resulted in measurable emission of the protein. This indicates that the conjugation was efficient and that the emission of the mCherry was not quenched by the energy transfer to the metallic structure. This type of transfer becomes dominant typically for distances less than 5 nm [15].
The influence of plasmon excitations in silver nanowires on the optical properties of mCherry protein was unambiguously demonstrated using fluorescence decay time measurement. The fluorescence transients obtained for mCherry conjugated to AgNW and for mCherry on a glass substrate are displayed in Figure 5. In the case of protein conjugated with AgNW, we observed significant shortening of the fluorescence decay time compared with the result for mCherry on glass, which showed monoexponential behavior with a decay constant equal to 1.86 ns. Indeed, for mCherry conjugated with AgNW, biexponential decay was measured with two time components: 0.1 ns (comparable to the temporal resolution of the experimental setup) and 1.86 ns, which was fixed. The fits are included in Figure 5. This strong reduction in the fluorescence decay time indicated strong interaction between mCherry and plasmon excitations in the nanowire.

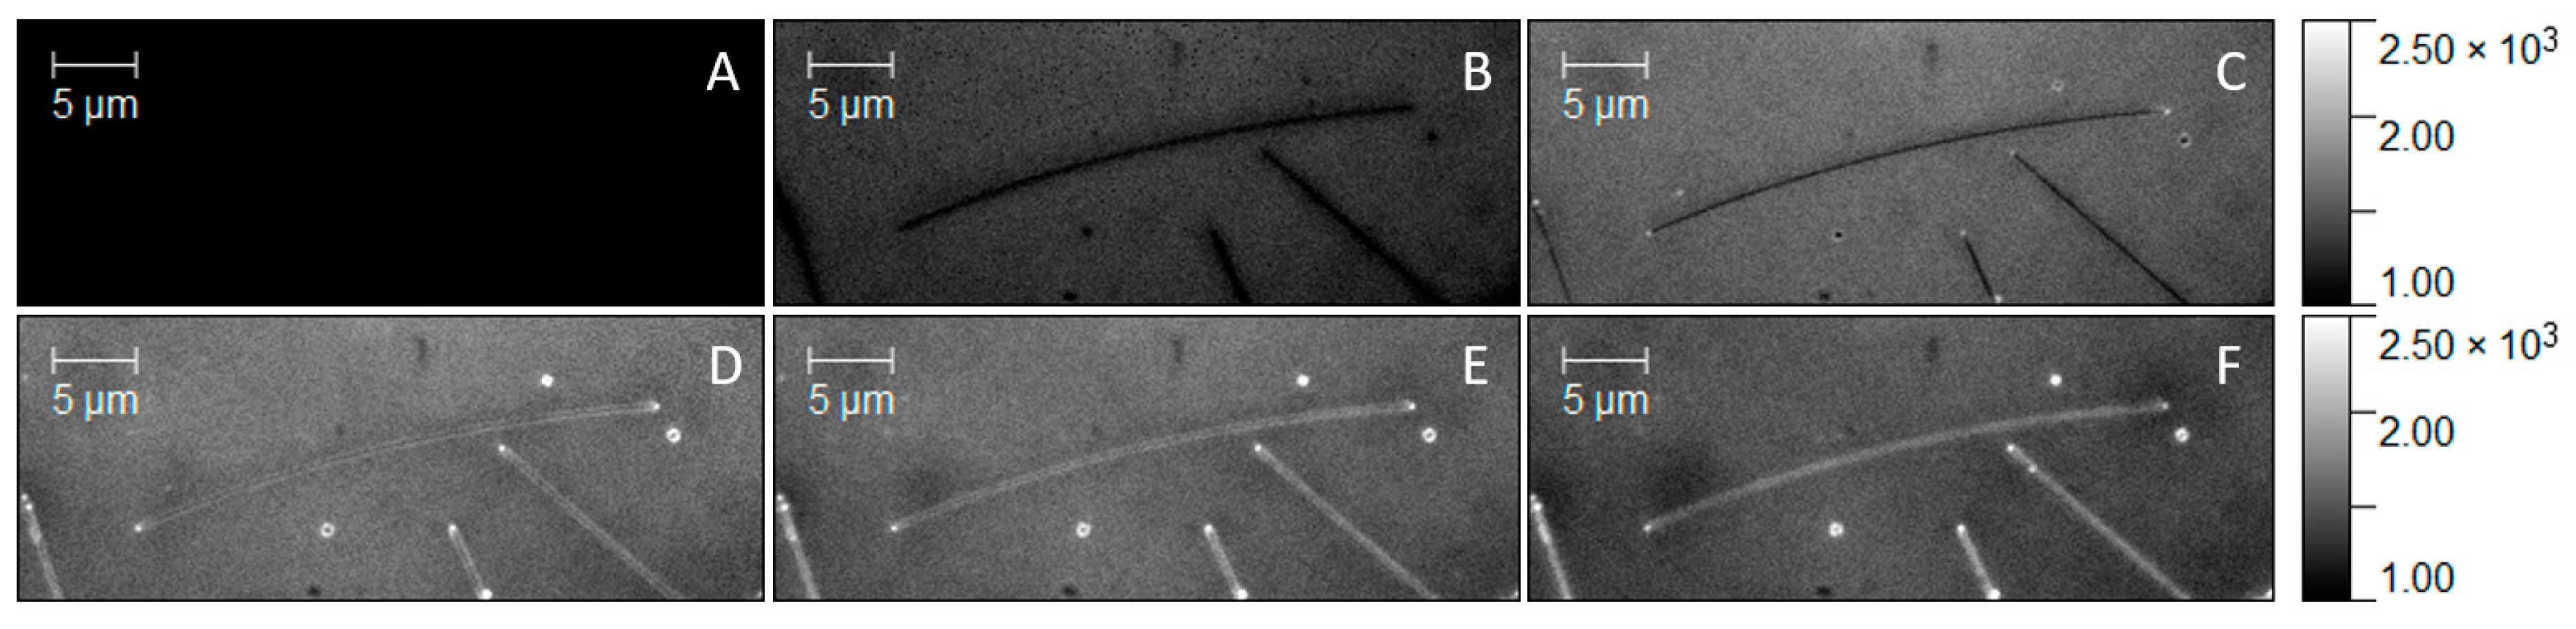
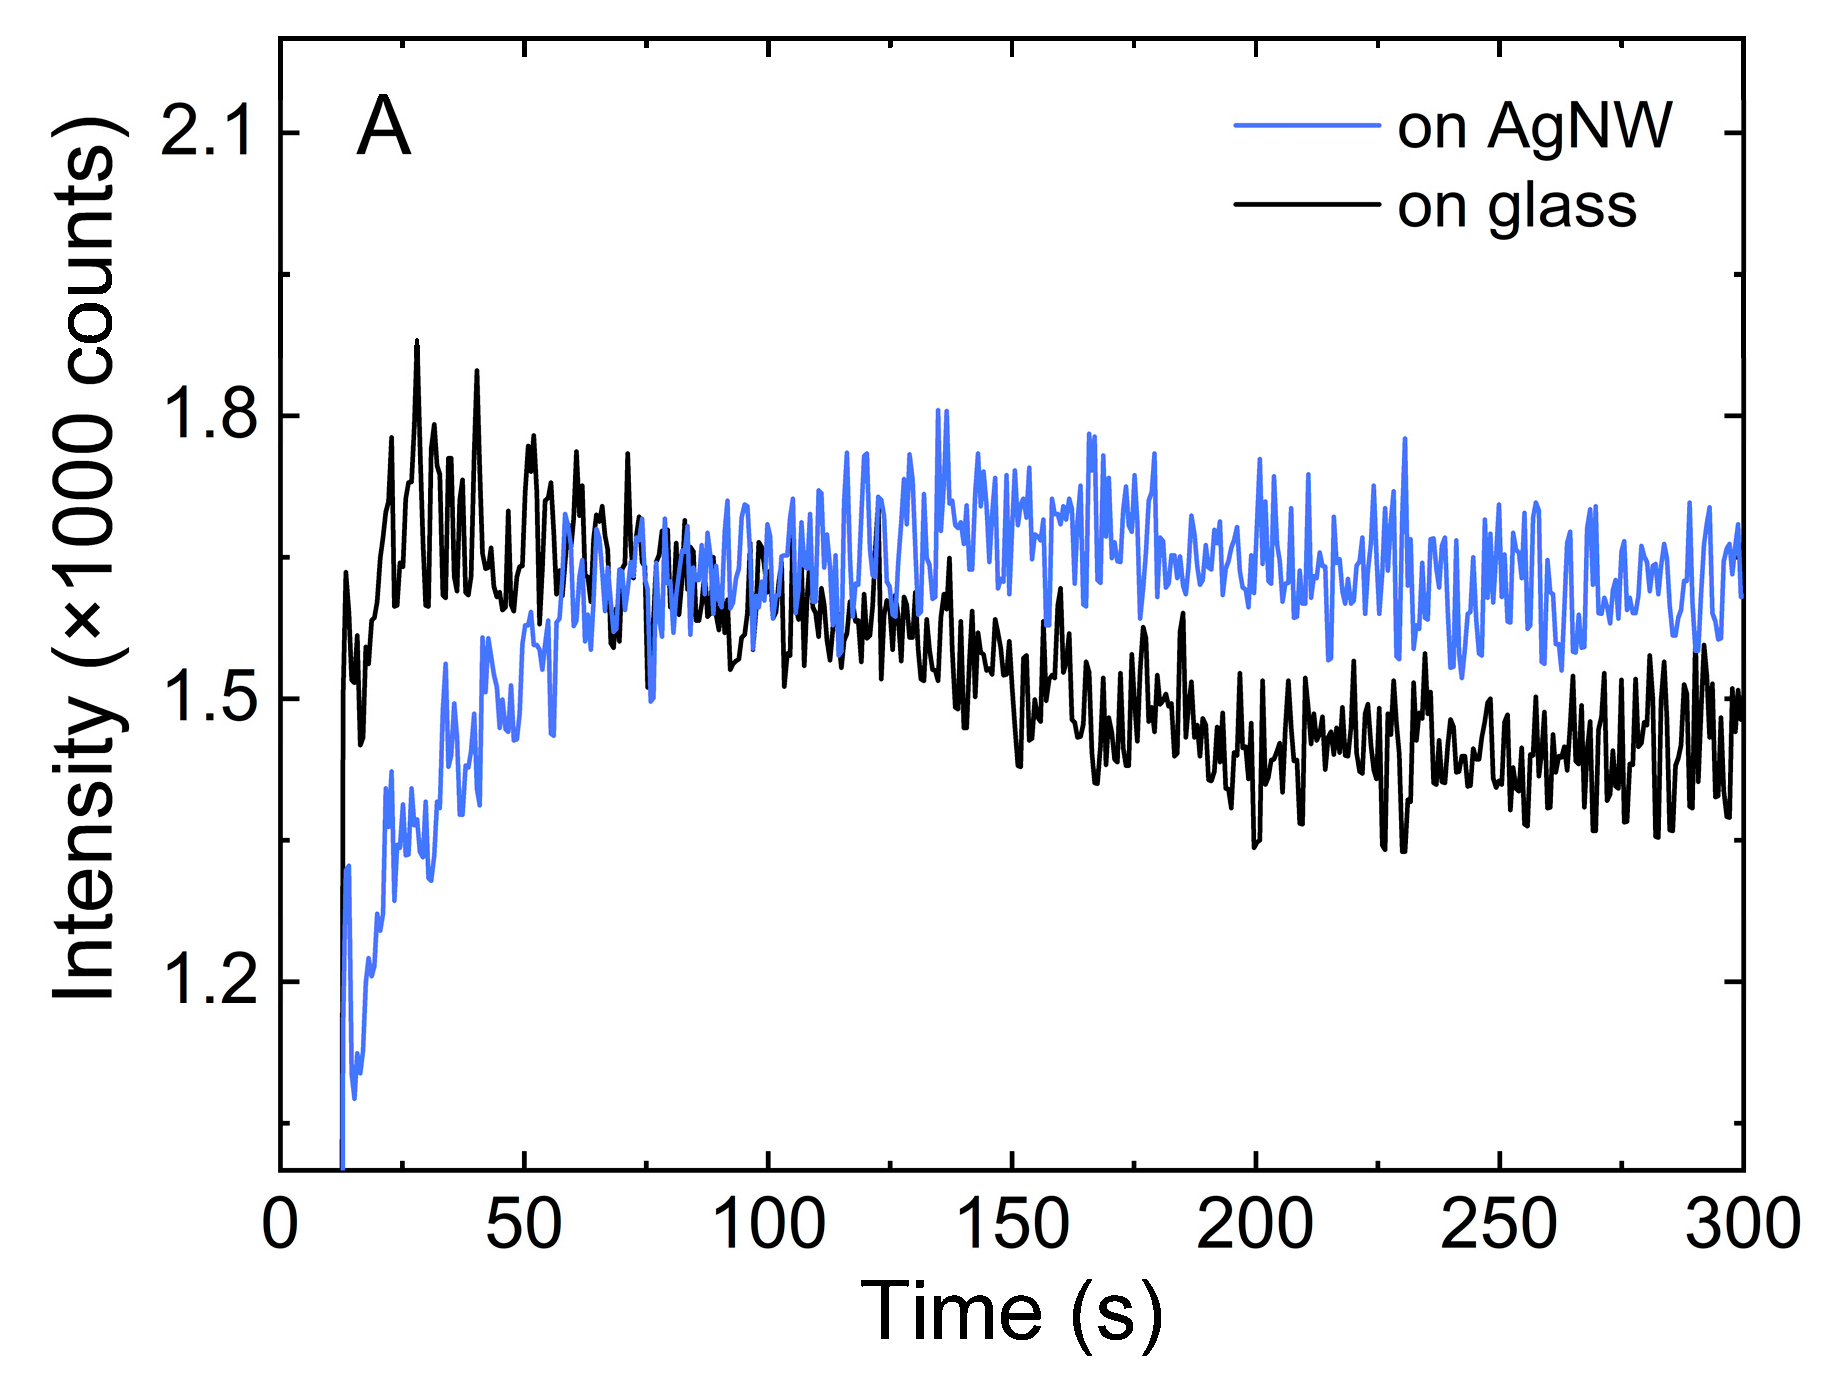
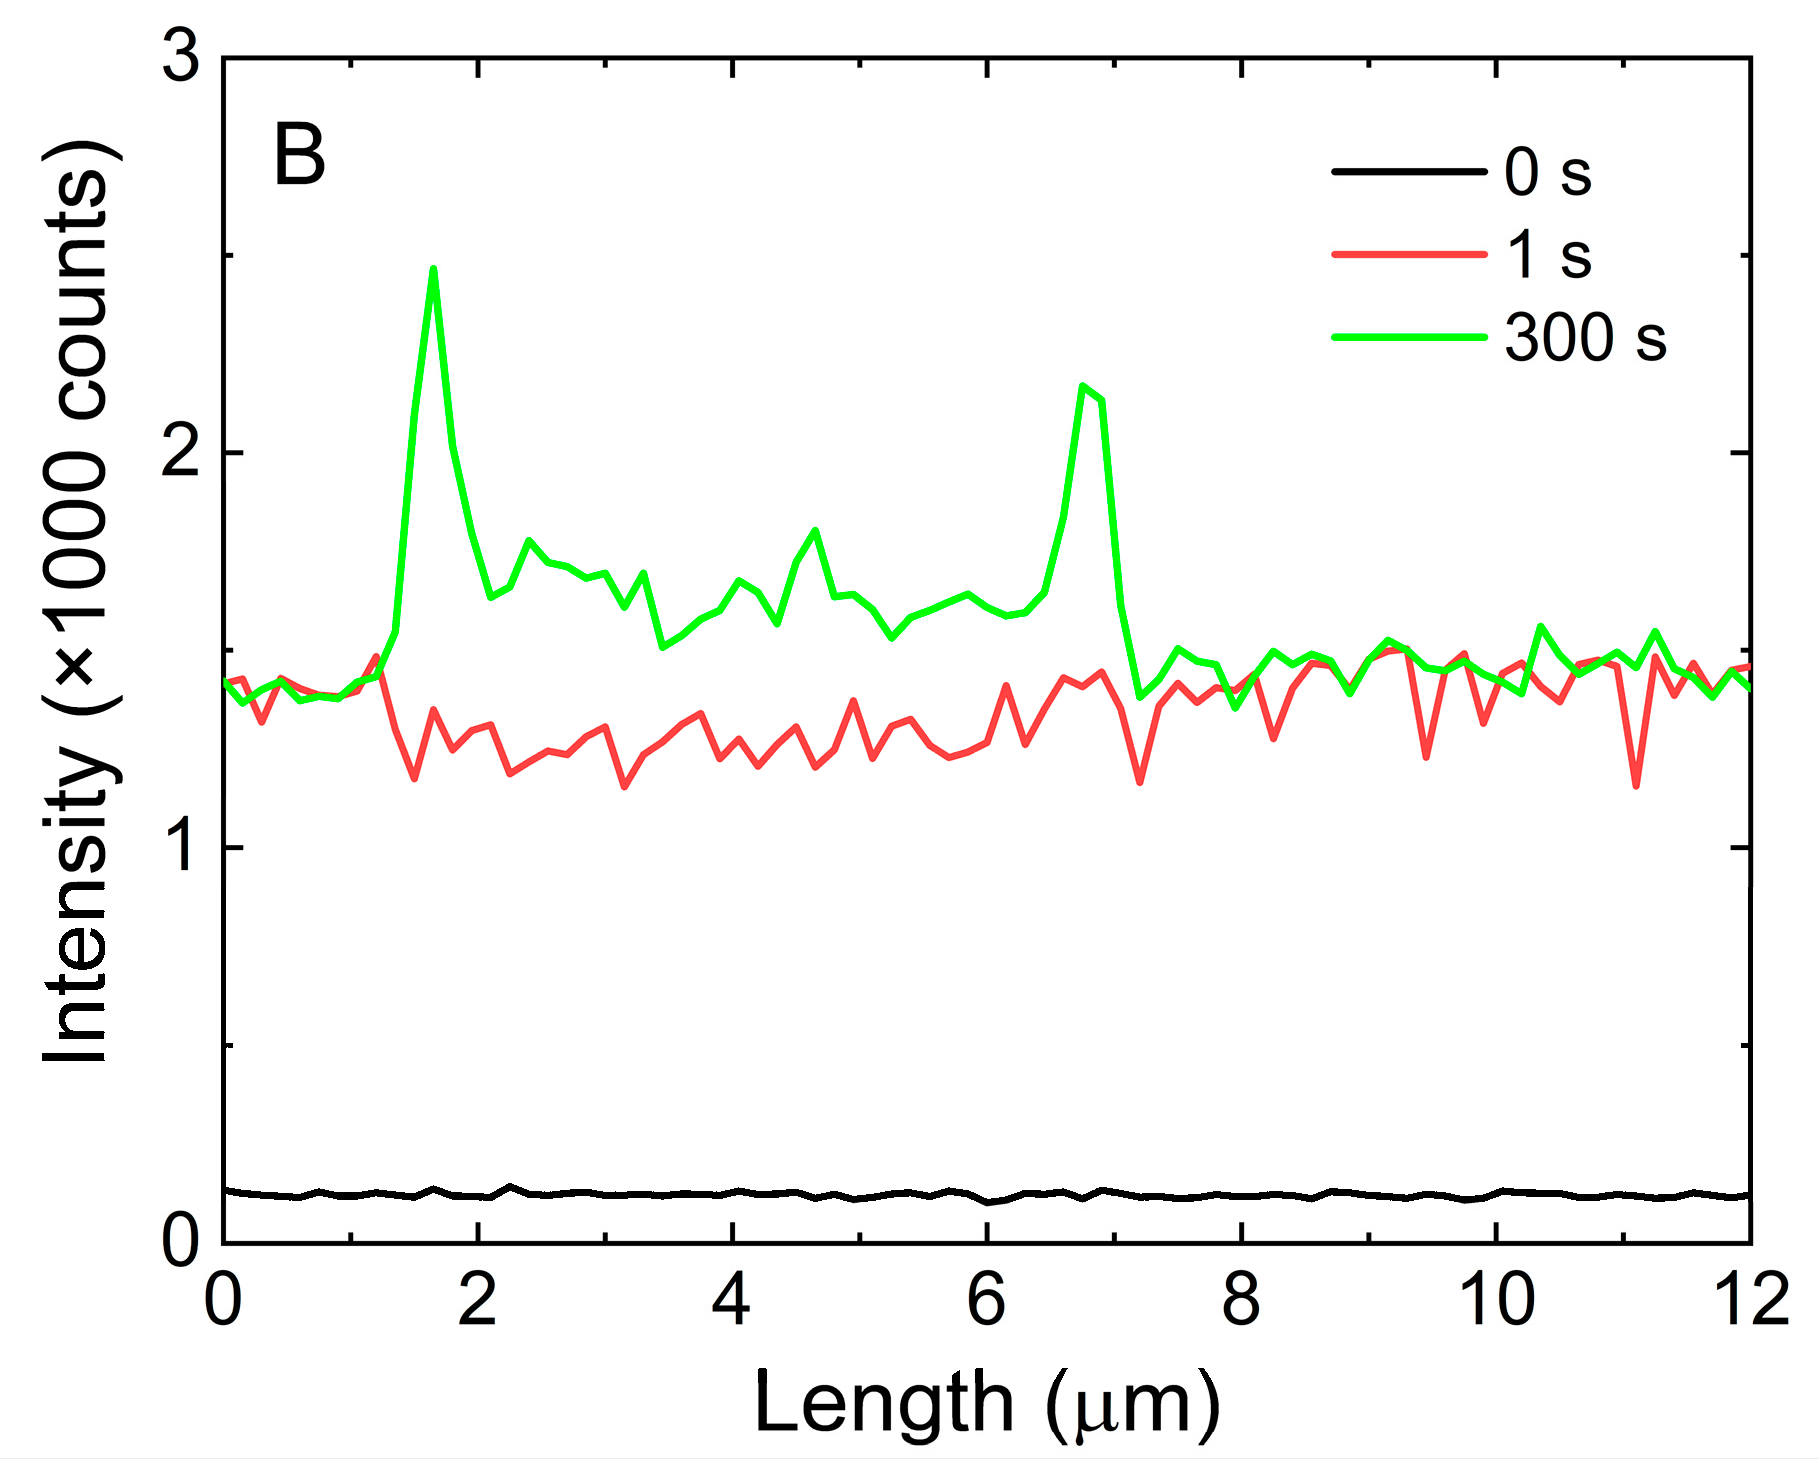
3.3. Real-Time Fluorescence Imaging of His-Tag-Driven Conjugation

The ability to enhance the optical response of the mCherry protein upon conjugation with silver nanowire prompted us to apply this scheme to monitor conjugation in real time using wide-field fluorescence imaging. First, a droplet of silver nanowires was deposited on a glass coverslip, and the positions of the nanowires were determined using the transmission mode of the microscope (Figure S3, Supplementary Materials). Then, acquisition of a film started; the snapshots taken at increased time intervals are shown in Figure 6. The first image proved that functionalized AgNWs themselves were nonemitting (Figure 6A), while upon depositing a 5 µL droplet of mCherry solution onto the sample surface, fluorescence emerged. The moment of deposition is presented in Figure 6B. We observed a rapid increase in fluorescence in the background, but the AgNWs remained dark. After 15 s (Figure 6C), the ends of the nanowires became brighter because of the specific attachment of mCherry protein. After approximately 80 s, the intensity along AgNWs rapidly built up over time until all the nanowires were homogeneously covered by the protein (Figure 6D–F). The time to start the conjugation process by His-tag attachment to Ni-NTA-modified AgNWs was about 20 s, slower than conjugation by the streptavidin–biotin linker, which was described recently and is expected to be faster because of the extraordinarily high affinity between the ligand and the protein [26]. However, the time of conjugation seemed to be much faster than measured previously [33]. We emphasize that the observation of protein attachment to silver nanowire was significantly helped by the effect of plasmon–enhanced fluorescence.
The temporal behavior of fluorescence intensity upon depositing a droplet of mCherry onto a substrate with silver nanowires was visualized by extracting single-pixel intensity of emission as a function of time. The result of this procedure is shown in Figure 7A, where the intensity of a single pixel on (blue) and off (black) the nanowire is plotted as a function of time. The emission of fluorescence at the nanowire increased over time and reached saturation after approximately 150 s, with some minimal decrease perhaps due to the photobleaching effect. On the other hand, the fluorescence signal from mCherry in the background was highest at the beginning of the sequence, with a subsequent gradual decrease probably caused by the attachment of mCherry protein to the AgNWs and the photobleaching effect. The variation in the fluorescence intensity on and off the nanowire with time is also clearly visible on the temporal map shown in Figure S4 of the Supplementary Materials.
Cross-sections along a selected silver nanowire, which are shown in Figure 7B, present the temporal fluorescence intensity change over the whole nanowire. The presented cross-section was extracted from the map shown in Figure S4. For the specific times of 0 s, 1 s, and 300 s the intensity along the nanowire was taken and compared. The black line corresponds to the signal before dropping the mCherry protein on the silver nanowires; it is flat and structureless. In the first second, after adding the protein solution the fluorescence of mCherry exhibited a strong increase (red line). However, the increase in emission intensity was the same for the nanowire and elsewhere. From that time, the process of conjugation started, and after 300 s (green line), the intensity was high, and the profile of the nanowire became visible. Overall, the results of fluorescence imaging indicated that the mCherry proteins attached specifically to the silver nanowires in real time and that the emission of the proteins was strongly enhanced as a result of plasmonic enhancement. Both these effects could form a platform for using silver nanowires, and the scheme described in this work could be a building block of a biosensing device.

4. Conclusions

In this work, we created a hybrid nanostructure composed of modified silver nanowires and mCherry protein. We were able to observe single proteins, and we show the differences in fluorescence intensity of mCherry observed on glass and in the vicinity of AgNWs. The observation of protein was more convenient because of the effect of plasmon- enhancement fluorescence. We performed surface modification of nanowires by adding a functional group to conduce the conjugation process between the mCherry protein and the AgNWs. On such conjugated proteins, we measured the influence of plasmon resonance as demonstrated using fluorescence decay time measurements. For the mCherry conjugated with AgNWs, we obtained shortening of fluorescence decay time in comparison with that of mCherry on glass. Finally, we applied real-time fluorescence imaging to monitor the conjugation process of the mCherry protein with functionalized silver nanowires by His-tag attachment. We visualized the process, which was initiated after about 20 s. The presented method of using AgNWs with Ni-NTA to conjugate His-tag can be applied as a real-time sensing platform, including more advanced applications in which mCherry would play the role of an optically enhanced fluorescence marker.

Supplementary Materials

The following supporting information can be downloaded at: https://www.mdpi.com/article/10.3390/chemosensors10040149/s1, Figure S1: Fluorescence intensity maps of single mCherry for 10 s and 185 s; Figure S2: Cross-section of fluorescence intensity of single mCherry on glass; Figure S3: Transmission map for real-time imaging experiment featuring isolated silver nanowires; Figure S4: Transient behavior of fluorescence intensity of mCherry measured for a single AgNW. Video S1: Fluorescence of individual mCherry proteins conjugated with silver nanowires.

Author Contributions

Conceptualization, S.M. and J.N.-J.; formal analysis, M.J., K.S. and K.W.; investigation, M.J., K.S. and K.W.; writing—original draft preparation, M.J., K.S.; writing—review and editing, S.M.; supervision, S.M. and J.N.-J. All authors have read and agreed to the published version of the manuscript.

Funding

Research was partially financed by the National Science Centre (Poland) with grants no. 2018/31/G/ST3/03596, 2017/27/B/ST3/02457, and 2021/41/N/ST7/03528. KS acknowledges support from the project POWR.03.05.00-00-Z302/17 Universitas Copernicana Thoruniensis in Futuro-IDS “Academia Copernicana”.

Institutional Review Board Statement

Not applicable.

Informed Consent Statement

Not applicable.

Data Availability Statement

The data that support the findings of this study are available from the corresponding author upon reasonable request.

Conflicts of Interest

The authors declare no conflict of interest.

References

  1. Arregui, F.; Andreu, T. Sensors Based on Nanostructured Materials; Springer: New York, NY, USA, 2009; Chapter 15; pp. 79–129. [Google Scholar]
  2. Choi, I.; Choi, Y. Plasmonic Nanosensors: Review and Prospect. IEE J. Sel. Top. Quantum Electron. 2012, 18, 1110–1121. [Google Scholar] [CrossRef]
  3. Bauch, M.; Toma, K.; Toma, M.; Zhang, Q.; Dostalek, J. Plasmon-enhanced fluorescence biosensors: A review. Plasmonics 2014, 9, 781–799. [Google Scholar] [CrossRef] [PubMed] [Green Version]
  4. Amiri, M.; Bezaatpour, A.; Jafari, H.; Boukherroub, R.; Szunerits, S. Electrochemical methodologies for the detection of pathogens. ASC Sens. 2018, 3, 1069–1086. [Google Scholar] [CrossRef] [PubMed]
  5. Anker, J.N.; Hall, W.P.; Lyandres, O.; Shah, N.C.; Zhao, J.; van Duyne, R.P. Biosensing with plasmonic nanosensors. Nat. Mater. 2008, 7, 442–453. [Google Scholar] [CrossRef]
  6. Nasu, Y.; Shen, Y.; Kramer, L.; Campbell, R.E. Structure and mechanism guided design of single fluorescent protein-based biosensors. Nat. Chem. Biol. 2021, 17, 509–518. [Google Scholar] [CrossRef]
  7. Tan, P.; Hesheng, L.; Wang, J.; Gopinath, S.C.B. Sliver nanoparticle in biosensor and bioimaging: Clinical perspectives. Biotechnol. Appl. Biochem. 2020, 68, 1236–1242. [Google Scholar]
  8. McNamara, K.; Tofail, S.A.M. Nanoparticles in biomedical applications. Adv. Phys. X 2017, 2, 54–88. [Google Scholar] [CrossRef]
  9. Joo, Y.; Byun, J.; Seong, N.; Ha, J.; Kim, H.; Kim, S.; Kim, T.; Im, H.; Kim, D.; Hong, Y. Silver nanowire-embedded PDMS with a multiscale structure for highly sensitive and robust flexible pressure sensor. Nanoscale 2015, 7, 6208. [Google Scholar] [CrossRef]
  10. Sun, Y.G.; Yin, Y.D.; Mayers, B.T.; Herricks, T.; Xia, Y.N. Uniform silver nanowires synthesis by reducing AgNO3 with ethylene glycol in the presence of seeds and Poly (Vinyl Pyrrolidone). Chem. Mater. 2002, 14, 4736–4745. [Google Scholar] [CrossRef]
  11. Coronado, E.A.; Encina, E.R.; Stefani, F.D. Optical properties of metallic nanoparticles: Manipulating light, heat and forces at the nanoscale. Nanoscale 2011, 3, 4042. [Google Scholar] [CrossRef]
  12. Reineck, P.; Gómez, D.; Ng, S.H.; Karg, M.; Bell, T.; Mulvaney, P.; Bach, U. Distance and wavelength dependent quenching of molecular fluorescence by Au@SiO2 core-shell nanoparticles. ACS Nano 2013, 7, 6636–6648. [Google Scholar] [CrossRef] [PubMed]
  13. Li, J.; Krasavin, A.V.; Webster, L.; Segovia, P.; Zayats, A.V.; Richards, D. Spectral variation of fluorescence lifetime near single metal nanoparticles. Sci. Rep. 2016, 6, 21349. [Google Scholar] [CrossRef] [PubMed] [Green Version]
  14. Fu, Y.; Zhang, J.; Lakowicz, J.R. Plasmonic enhancement of single-molecule fluorescence near a silver nanoparticle. J. Fluoresc. 2007, 17, 811–816. [Google Scholar] [CrossRef] [PubMed] [Green Version]
  15. Anger, P.; Bharadwaj, P.; Novotny, L. Enhancement and quenching of single-molecule fluorescence. PRL 2006, 96, 113002. [Google Scholar] [CrossRef] [Green Version]
  16. Viste, P.; Plain, J.; Jaffiol, R.; Vial, A.; Adam, P.-M.; Royer, P. Enhancement and quenching regimes in metal-semiconductor hybrid optical nanostructures. ACS Nano 2010, 4, 759–764. [Google Scholar] [CrossRef] [PubMed]
  17. Olejnik, M.; Bujak, Ł.; Maćkowski, S. Plasmonic molecular nanohybrids-spectral dependence of fluorescence quenching. Int. J. Mol. Sci. 2012, 13, 1018–1028. [Google Scholar] [CrossRef]
  18. Focsan, M.; Campu, A.; Craciun, A.-M.; Potara, M.; Leordean, C.; Maniu, D.; Astilean, S. A simple and efficient design to improve the detection of biotin-streptavidin interaction with plasmonic nanobiosensors. Biosens. Bioelectron. 2016, 86, 728–735. [Google Scholar] [CrossRef]
  19. Lv, Q.; Wang, Y.; Su, C.; Lakshmipriya, T.; Gopinath, S.; Pandian, K.; Perumal, V.; Liu, Y. Human papilloma virus DNA-biomarker analysis for cervical cancer: Signal enhancement by gold nanoparticle-coupled tetravalent streptavidin-biotin strategy. Int. J. Biol. Macromol. 2019, 134, 354–360. [Google Scholar] [CrossRef]
  20. Bolduc, O.R.; Lambert-Lanteigne, P.; Colin, D.Y.; Zhao, S.S.; Proulx, C.; Boeglin, D.; Lubell, W.D.; Pelletier, J.N.; Féthière, J.; Ong, H.; et al. Modified peptide monolayer binding His-tagged biomolecules for small ligand screening with SPR biosensors. Analyst 2011, 136, 3142. [Google Scholar] [CrossRef]
  21. Evers, T.H.; Appelhof, M.A.; Meijer, E.; Merkx, M. His-tag as Zn(II) binding motifs in a protein-based fluorescent sensor. PEDS 2008, 21, 529–536. [Google Scholar] [CrossRef] [Green Version]
  22. Zhang, C.; Chen, Y.; Liang, X.; Zhang, G.; Ma, H.; Nie, L.; Wang, Y. Detection of hepatitis B virus M204I mutation by quantum dot-labeled DNA probe. Sensors 2017, 17, 961. [Google Scholar] [CrossRef] [PubMed] [Green Version]
  23. Holford, T.R.; Davis, F.; Higson, S.P. Recent trends in antibody based sensors. Biosens. Bioelectron. 2012, 34, 12–24. [Google Scholar] [CrossRef] [PubMed]
  24. Chivers, C.E.; Koner, A.L.; Lowe, E.D.; Howarth, M. How the biotin-steptavidin interaction was made even stronger: Investigation via crystallography and chimaeric tetramer. Biochem. J. 2011, 435, 55–63. [Google Scholar] [CrossRef] [PubMed] [Green Version]
  25. Szalkowski, M.; Sulowska, K.; Grzelak, J.; Niedziółka-Jönsson, J.; Roźniecka, E.; Kowalska, D.; Mackowski, S. Wide-Field fluorescence microscopy of real-time bioconjugation sensing. Sensors 2018, 18, 290. [Google Scholar] [CrossRef] [Green Version]
  26. Sulowska, K.; Wiwatowski, K.; Ćwierzona, M.; Niedziółka-Jönsson, J.; Maćkowski, S. Real-time fluorescence sensing of single photoactive proteins using silver nanowires. Methods Appl. Fluoresc. 2020, 8, 045004. [Google Scholar] [CrossRef]
  27. Fischer, N.O.; Blanchette, C.D.; Chromy, B.A.; Kuhn, E.A.; Segelke, B.W.; Corzett, M.; Bench, G.; Mason, P.W.; Hoeprich, P.D. Immobilization of his-tagged proteins on nickel-chelating nanolipoprotein particles. Bjoconjug. Chem. 2009, 20, 460–465. [Google Scholar] [CrossRef]
  28. Malhotra, A. Tagging for protein expression. Methods Enzimol. 2009, 463, 239–258. [Google Scholar]
  29. Shu, X.; Shaner, N.C.; Yarbrough, C.A.; Tsien, A.R.Y.; Remington, S.J. Novel chromophores and buried charges control color in mFruits. Biochemistry 2006, 45, 9639–9647. [Google Scholar] [CrossRef]
  30. Borrell, K.L.; Cancglin, C.; Stinger, B.L.; DeFrates, K.G.; Caputo, G.A.; Wu, C.; Vaden, T.D. An experimental and molecular dynamics study of red fluorescent protein mCherry in novel aqueous amino acid ionic liquids. Phys. Chem. B 2017, 12, 4823–4832. [Google Scholar] [CrossRef]
  31. Grzelak, J.; Sulowska, K.; Leśniewski, A.; Roźniecka, E.; Janczuk-Richter, M.; Richter, Ł.; Łoś, M.; Jönsson-Niedziółka, M.; Maćkowski, S.; Niedziółka-Jönsson, J. Capturing fluorescing viruses with silver nanowires. Sens. Actuators B Chem. 2018, 273, 689–695. [Google Scholar] [CrossRef]
  32. Szalkowski, M.; Olmos, J.D.J.; Buczyńska, D.; Maćkowski, S.; Kowalska, D.; Kargul, J. Plasmon-induced absorption of binding chlorophylls in photosynthetic proteins assembled on silver nanowires. Nanoscale 2017, 9, 10475–10486. [Google Scholar] [CrossRef] [PubMed]
  33. Tantama, M.; Hung, Y.P.; Yellen, G. Imaging intracellular pH in live cells a genetically encoded red fluorescent protein sensor. J. Am. Chem. Soc. 2011, 133, 10034–10037. [Google Scholar] [CrossRef] [PubMed] [Green Version]
  34. Olejnik, M.; Krajnik, B.; Kowalska, D.; Twardowska, M.; Czechowski, N.; Hofmann, E.; Mackowski, S. Imaging of fluorescence enhancement in photosynthetic complex coupled to silver nanowires. Appl. Phys. Lett. 2013, 102, 08703. [Google Scholar] [CrossRef]
Figure 1. (A) Crystal structure of mCherry protein (Shu X., Remington S. J., RCSB PDB, 2006); (B) absorption (blue line) and emission (red line) spectra of mCherry protein and extinction spectrum of AgNWs (black line) measured in solution.
Chemosensors 10 00149 g001
Figure 2. Fluorescence intensity maps of mCherry mixed with AgNWs (on the left) and cross-section along the silver nanowire and on glass (on the right). (A,B) sample with mCherry solution 0.5 µg/mL with AgNW, (C,D) sample with solution of single mCherry with AgNW.
Chemosensors 10 00149 g002
Figure 3. Histogram of fluorescence intensities of single mCherry proteins on AgNWs (red) and in the background on glass (black).
Chemosensors 10 00149 g003
Figure 4. Fluorescence intensity maps of mCherry conjugate with AgNWs (on the left (A)) and cross-section along the silver nanowire and on glass (on the right (B)).
Chemosensors 10 00149 g004
Figure 5. Fluorescence intensity decay measured for mCherry on glass (black line) and conjugated to AgNWs (red line).
Chemosensors 10 00149 g005
Figure 6. Fluorescence intensity maps of mCherry solution (A) before deposition and (B) at the time of deposition. (CF) Protein conjugation process over time.
Chemosensors 10 00149 g006
Figure 7. (A). Fluorescence intensity in time measured along the AgNWs (blue) and for background signal level on glass (black), (B). Time profiles of fluorescence intensity of mCherry along a single AgNW.
Chemosensors 10 00149 g007aChemosensors 10 00149 g007b
Publisher’s Note: MDPI stays neutral with regard to jurisdictional claims in published maps and institutional affiliations.

