Article

Composite Electrodes Based on Carbon Materials Decorated with Hg Nanoparticles for the Simultaneous Detection of Cd(II), Pb(II) and Cu(II)

1
GTS Research Group, Department of Chemistry, Faculty of Science, Edifici C-Nord, Universitat Autònoma de Barcelona, Carrer dels Til⋅lers, 08193 Bellaterra, Spain
2
GENOCOV Research Group, Department of Chemistry, Faculty of Science, Edifici C-Nord, Universitat Autònoma de Barcelona, Carrer dels Til⋅lers, 08193 Bellaterra, Spain
3
Grup d’Electroanàlisi, Department of Chemical Engineering and Analytical Chemistry, Universitat de Barcelona, Carrer Martí i Franqués 1-11, 08028 Barcelona, Spain
*
Author to whom correspondence should be addressed.
Chemosensors 2022, 10(4), 148; https://doi.org/10.3390/chemosensors10040148
Submission received: 17 March 2022 / Revised: 10 April 2022 / Accepted: 12 April 2022 / Published: 15 April 2022

Abstract

:
Monitoring water quality has become a goal to prevent issues related to human health and environmental conditions. In this sense, the concentration of metal ions in water sources is screened, as these are considered persistent contaminants. In this work, we describe the implementation of customized graphite electrodes decorated with two types of Hg nanoparticles (Hg-NPs), optimized toward the electrochemical detection of Cd, Pb and Cu. Here, we combine Hg, a well-known property to form alloys with other metals, with the nanoscale features of Hg-NPs, resulting in improved electrochemical sensors towards these analytes with a substantial reduction in the used Hg amount. Hg-NPs were synthesized using poly(diallyldimethylammonium) chloride (PDDA) in a combined role as a reducing and stabilizing agent, and then appropriately characterized by means of Transmission Electron Microscopy (TEM) and Zeta Potential. The surface of composite electrodes with optimized graphite content was modified by the drop-casting of the prepared Hg-NPs. The obtained nanocomposite electrodes were morphologically characterized by Scanning Electron Microscopy (SEM), and electrochemically by Cyclic Voltammetry (CV) and Electrochemical Impedance Spectroscopy (EIS). The results show that the Hg-NP-modified electrodes present better responses towards Cd(II), Pb(II) and Cu(II) detection in comparison with the bare graphite electrode. Analytical performance of sensors was evaluated by square-wave anodic stripping voltammetry (SWASV), obtaining a linear range of 0.005–0.5 mg·L−1 for Cd2+, of 0.028–0.37 mg·L−1 for Pb2+ and of 0.057–1.1 mg·L−1 for Cu2+. Real samples were analyzed using SWASV, showing good agreement with the recovery values of inductively coupled plasma–mass spectrometry (ICP-MS) measurements.

Graphical Abstract

1. Introduction

Water is fundamental for all living forms and a key issue for social and economic development worldwide. High concentration levels of some contaminants in water such as heavy metals can have consequences on human health; copper, cadmium and lead are examples that can be found in aquatic sources. For instance, in low concentrations, Cu is an essential trace element that plays a key role in enzymatic processes. However, at high concentrations, Cu produces oxidative stress resulting in kidney, gastrointestinal tract or liver damage [1,2,3], and therefore, it is classified as Group 3 of recognized carcinogens. Cd is classified as a Group 1 carcinogen since long-term exposure has the potential to affect reproductive organs and induce kidney damage and cardiovascular or nervous system impairment [4]. Pb is an accumulative toxin that affects the central nervous system and can trigger the dysfunction of renal and cardiovascular systems; furthermore, it can also affect brain development [5].
Nowadays, several analytical techniques with low detection limits (DL) are available for the determination of metals with enough sensitivity for most applications [6,7,8,9,10]. In this sense, the most common are atomic absorption spectrometry (AAS), inductively coupled plasma–atomic emission spectrometry (ICP-AES) and inductively coupled plasma–mass spectrometry (ICP-MS), among others. These techniques require time-consuming sample pre-treatment, expensive equipment, a controlled laboratory environment and specialized personnel to perform the metal content analysis. In order to avoid these inconveniences, alternative methodologies can be used for the quantification of metals, e.g., electrochemical techniques such as voltammetry [9,11,12,13,14]. Voltammetric sensors offer some advantages, including a relatively short time analysis by non-specialized personnel and low-cost equipment that can be portable, making them suitable for in situ water monitoring, e.g., in real wastewater. Among the different voltammetric techniques, polarography is one that traditionally uses a working electrode made of mercury [15,16,17] due to the chemical affinity of Hg to interact with other metals to form amalgams, decreasing the reduction potential of the metal cation analyte, which can improve the electrochemical detection. Even though the use of mercury electrodes is not environmentally friendly, some alternatives can be found to exploit its properties while reducing related risks.
(Nano)composite electrodes represent an option for the electroanalytical determination of metals, since they offer cost effectiveness and smaller-sized sensor systems, in addition to portability, reliability and easy-to-use devices. These nano-enabled electrochemical platforms are based on carbon nano-allotropes (e.g., graphite, carbon nanotubes, graphene and related) dispersed in an insulating polymeric matrix (such as epoxy, methacrylate, Teflon, etc.), which have led to important advances in the analytical electrochemistry field, especially in the design of sensors and biosensor devices. The evolution of material science has led to the composite optimal formulation and its customization by diverse functionalization strategies, essential to produce selective and sensitivity sensors [18].
The use of percolation curves is a suitable approach to obtain the most convenient material composition. The electric properties of the electrode depend on the material’s inherent features, the amount used for electrode preparation and their distribution in the final composite electrode. The percolation theory was developed by Broadbent and Hammersley in 1957 [19], but it was used to interpret the conductivity behavior of composite materials years before. A percolation curve has three main regions: low, medium and high composition zones. The low composition zone, at a low percentage of conductive material, acts like a bad conductor or even an insulator, and as the amount of carbon material increases, the resistance decreases in medium and high composition zones. This is because the conductive particles are closer to each other, improving the conductivity. As a result, the percolation curve provides the data to find a compromise between the percentage of conductive material and the relation signal/noise; the larger the signal-to-noise ratio, the smaller the detection limit achieved. These optimal composition sensors can further be customized by matrix functionalization with carbon (nano)allotropes or by the incorporation and dispersion of nanomaterials (e.g., metal nanoparticles) through the matrix [20].
These composites electrodes allow the implementation of different voltammetry techniques such as cyclic voltammetry (CV) or chronoamperometry, among others; Square-Wave Anodic Stripping Voltammetry (SWASV) was chosen in this work. SWASV consists of the application of a potential to preconcentrate by reducing the metal cation analyte on the electrode surface; then, the measurement is performed by applying staircase oxidation potential increase, and the current generated is recorded [21,22,23] (see Table S1 in the Supplementary Materials).
In this work, we present the surface modification of composite electrodes with Hg nanoparticles (Hg-NPs) to increase the sensitivity of the resulting nano-enabled electrochemical system towards the simultaneous detection of metals in water samples. Due to the hazardous properties of the Hg, and in order to reduce its amount used in polarography, the electrode functionalization with Hg-NPs represents an innovative approach that combines the affinity to form amalgams and the nanoscale features [24,25,26,27]. NPs provide enhanced features such as higher relation area/volume, and improvement of the reactivity, in addition to the bulk properties of Hg. The prepared Hg-NPs by different synthetic routes were carried out here to modify the surface of composite electrodes, based on graphite and Epotek resin, by the drop-casting strategy [28].
Two different polymers were used for the NPs’ preparation; one was poly(vinyl alcohol) (PVA), one of the most used reagents in the stabilization and reduction process for nanoparticles synthesis [29,30]. The synthesis of Hg-NPs using this polymer has been reported previously [31]. The other was poly (diallyldimethylammonium chloride) (PDDA), a positive polymer with adhesive and reductive properties [31,32,33]. In this work, PDDA was chosen due to its different properties from the one used previously (PVA) to improve the obtained nanoparticles. Both types of synthetized Hg-NPs, using PDDA (Route A) or PVA (Route B), were extensively characterized in terms of morphology (Electron Microscopy, Zeta Potential) and electroanalytical suitability for the detection and quantification of Cd, Pb and Cu in water.

2. Materials and Methods

2.1. Chemical Reagents and Materials

The metal solutions were prepared from stocks of 37 mg·L−1 Pb(NO3)2 (≥99%, supplied by Sigma-Aldrich, St. Louis, MO, USA), 11.438 mg·L−1 Cu(NO3)2 (99.5%, purchased from Merck, Darmstadt, Germany) and 1000 mg·L−1 Cd(NO3)2 (99%, obtained from Panreac, Castellar del Vallès, Spain). They were prepared in 0.1 M acetic acid (CH3COOH, 99.9% acquired from J.T.Baker, HPLC reagent, Radnor, PA, USA)/0.1 M ammonium acetate (NH4CH3COO, 97% purchased from Panreac, Castellar del Vallès, Spain) buffer with deionized water at pH 4.6 [34]. All solutions were prepared with deionized water for Milli-Q system (Millipore, Billerica, MA, USA). Spiked tap water samples were prepared in 0.1 M acetic acid (99.9% acquired from J.T.Baker, HPLC reagent, Radnor, PA, USA)/0.1 M ammonium acetate (97% purchased from Panreac, Castellar del Vallès, Spain) buffer at pH 4.6. For the interference study, Fe(NO3)3·9H2O (≥98%), FeSO4·7H2O (≥99%) and glucose (C6;H12O6, 99.5%) were used (all from Sigma-Aldrich, St. Louis, MO, USA).

2.2. Apparatus

Impedimetric and voltammetric measurements were performed using a computer-controlled Multi AUTOLAB M101 (Eco Chemie, Utrecht, The Netherlands) with a three-electrode configuration. A platinum electrode 53-671 (Crison Instruments, Alella, Barcelona, Spain), an Ag/AgCl Orion 900 single-junction electrode filled with a reference filling solution Orion 900001 (Thermo Electron Corporation, Beverly, MA, USA) and the fabricated composite electrodes were used as a counter, reference and working electrodes, respectively. In addition, for the electrochemical characterization, a homemade Ag/AgCl electrode were used. Zeta Potential (ζ) measurements, ζ values for the different Hg-NPs, were obtained using a Malvern Zetasizer® Nano Z with a 10 mW red laser (632.8 nm) (Malvern Panalytical Ltd., Malvern, United Kingdom) and the values for the different Hg-NPs were obtained using 25 µL of Hg-NPs synthesized by two routes that were resuspended in 1 mL of deionized water. Each sample was equilibrated for 1 min at 25 °C before starting the ζ analysis, and three measurements, each consisting of 30 runs, were performed per sample.
Digital Microscope (AM4815ZTL from DinoLite, Almere, The Netherlands), Scanning Electron Microscopy (SEM) MerlinFE-SEM (from Carl Zeiss, Oberkochen, Germany) with EDS Oxford LINCA X-Max detector and Transmission Electron Microscopy (TEM) JEM-2011, 200 kV (from Jeol, Peabody, MA, USA) were used in the morphological characterization. For the X-ray Photoemission Spectroscopy (XPS), the analysis was performed using a hemispherical Phoibos 150 EP MCD analyzer (from SPECS, Berlin, Germany).
The Inductively Coupled Plasma–Mass Spectrometer (ICP) used as a reference technique was the model 7900 from Agilent (Santa Clara, CA, USA).

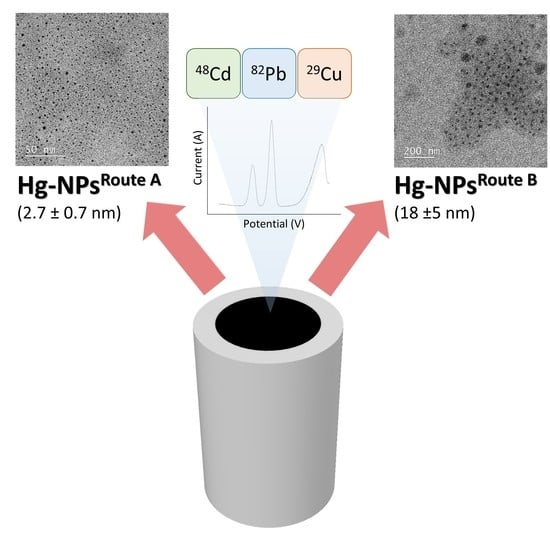
2.3. Synthesis Hg-NPs

Two types of Hg-NPs were synthesized for the electrode surface modification following and adapting the methodology established by G. V. Ramesh et al. [35]: 78.5 mg of Hg2(NO3)2·2H2O (98% from Alfa Aesar by Thermo Fisher Scientific, Kandel, Germany) were weighted, then 1 mL of 0.47 M HNO3 (65% from VWR chemicals, Radnor, PA, USA) was added. Route A required the addition of 0.5 mL of a solution prepared by mixing 3.5 mL of poly(diallyldimethylammonium chloride) (PDDA) (Mw 200,000–350,000, 20 wt % in water solution, purchased from Sigma-Aldrich) in 16 mL of Milli-Q water. Rote B analogously required 0.5 mL of poly(vinyl alcohol) solution (PVA) (Mw13,000–23,000, 87–89% hydrolyzed, purchased from Sigma-Aldrich, St. Louis, MO, USA). This PVA solution was prepared dissolving 3.6 g in 16 mL of Milli-Q water and heating it softly in a water bath until the PVA was dissolved. The new proposed synthesis using PDDA is Route A, and the established one [35] using PVA is Route B.

2.4. Electrode Fabrication

Graphite (particle size 50 µm, Merck Millipore, Darmstadt, Germany) as a conductive phase and Epotek H77A (epoxy) Epotek H77B (hardener) (Epoxy Technology, Billerica, MA, USA) as a polymeric matrix in handmade composite electrode fabrication were used. Electrodes were prepared following the conventional methodology previously established [20]. The electrodes used in this work had 20% of conductor material (graphite) and 80% of the polymeric matrix.

2.5. Drop-Casting Modification of Electrodes

The prepared Hg-NPs were deposited on the surface of the composite electrode by drop-casting 20 µL NP suspension (Hg-NPsRoute A or Hg-NPsRoute B), and then dried in an oven for 2 h at 80 °C. A scheme of this modification procedure is shown in Figure S1 in the Supplementary Materials. Furthermore, one additional type of electrode was prepared by firstly immersing the composite electrode surface in a 10% solution of PDDA (in an ice bath) for 20 min, followed by rinsing with water and letting air dry at room temperature [36]. After that, the drop-casting of the Hg-NPsRoute B preparation ensued.

2.6. Morphological and Chemical Characterization

The obtained Hg-NPs (Routes A and B) were morphologically characterized by means of TEM and by Zeta Potential. To obtain the Zeta Potential (ζ), three measurements, each consisting of 30 runs, were performed per sample. The surface of the electrodes was characterized by SEM. XPS analysis provided information regarding the oxidation state of the Hg-NPs through data treatment with CasaXPS (free version) [37].

2.7. Electrochemical Characterization

Electrochemical characterization was performed by Electrochemical Impedance Spectroscopy (EIS) and Cyclic Voltammetry (CV). EIS and CV measurements were carried out in a quiescent state and with a solution composed of 0.1 M KCl (99.5%, supplied by Sigma-Aldrich, St. Louis, MO, USA), and an equimolar mixture of ferricyanide/ferrocyanide (99.8% purchased from Sigma-Aldrich, St. Louis, MO, USA), 0.01 M [Fe(CN)6]3−/[Fe(CN)6]4−. All the dissolutions were prepared using deionized water from the Milli-Q system (Millipore, Billerica, MA, USA) with a resistivity value of 18.2 MΩ·cm.

2.8. Electroanalytical Measurements

Electroanalytical measurements were carried out with SWASV. In brief, the SWASV technique consists of three different steps. First is the application of a potential (−1.4 V) to preconcentrate by reducing the metal cation analyte on the surface of the electrode; then, the measurement is performed by applying a staircase potential (step: 5 mV; modulation amplitude: 20 mV; frequency: 25 Hz) from −1.4 to 1 V, and the oxidation current generated is recorded. After that, a cleaning step is followed (1 V) to eliminate the possible traces of metals that can remain on the surface of the electrode. The process was completed under nitrogen (N2) bubbling.
Each metal solution concentration was prepared individually by dilution of the concentrated standard, with the acetic acid/ammonium acetate buffer. The analyzed cation metals were measured three times for concentration in the calibration curves.
Interference analysis for organic matter was performed by preparing 125 mg·L−1 O2 solution with glucose, following the stochiometric relation and the posterior addition of standard metal solution. For the Fe(II) and Fe(III) study, a stock solution of each cation was individually prepared (42 mg·L−1 and 30 mg·L−1, respectively) and additions over the buffer were performed.
Sample analysis was performed by standard addition calibration. First, 10 mL of the sample was added to the 90 mL of the buffer and measured by SWASV. The rest of the points were prepared individually, following this first step, then adding the volume of standard solution prepared with the three metal cations of known concentration, and to finish the corresponding volume of buffer.

3. Results

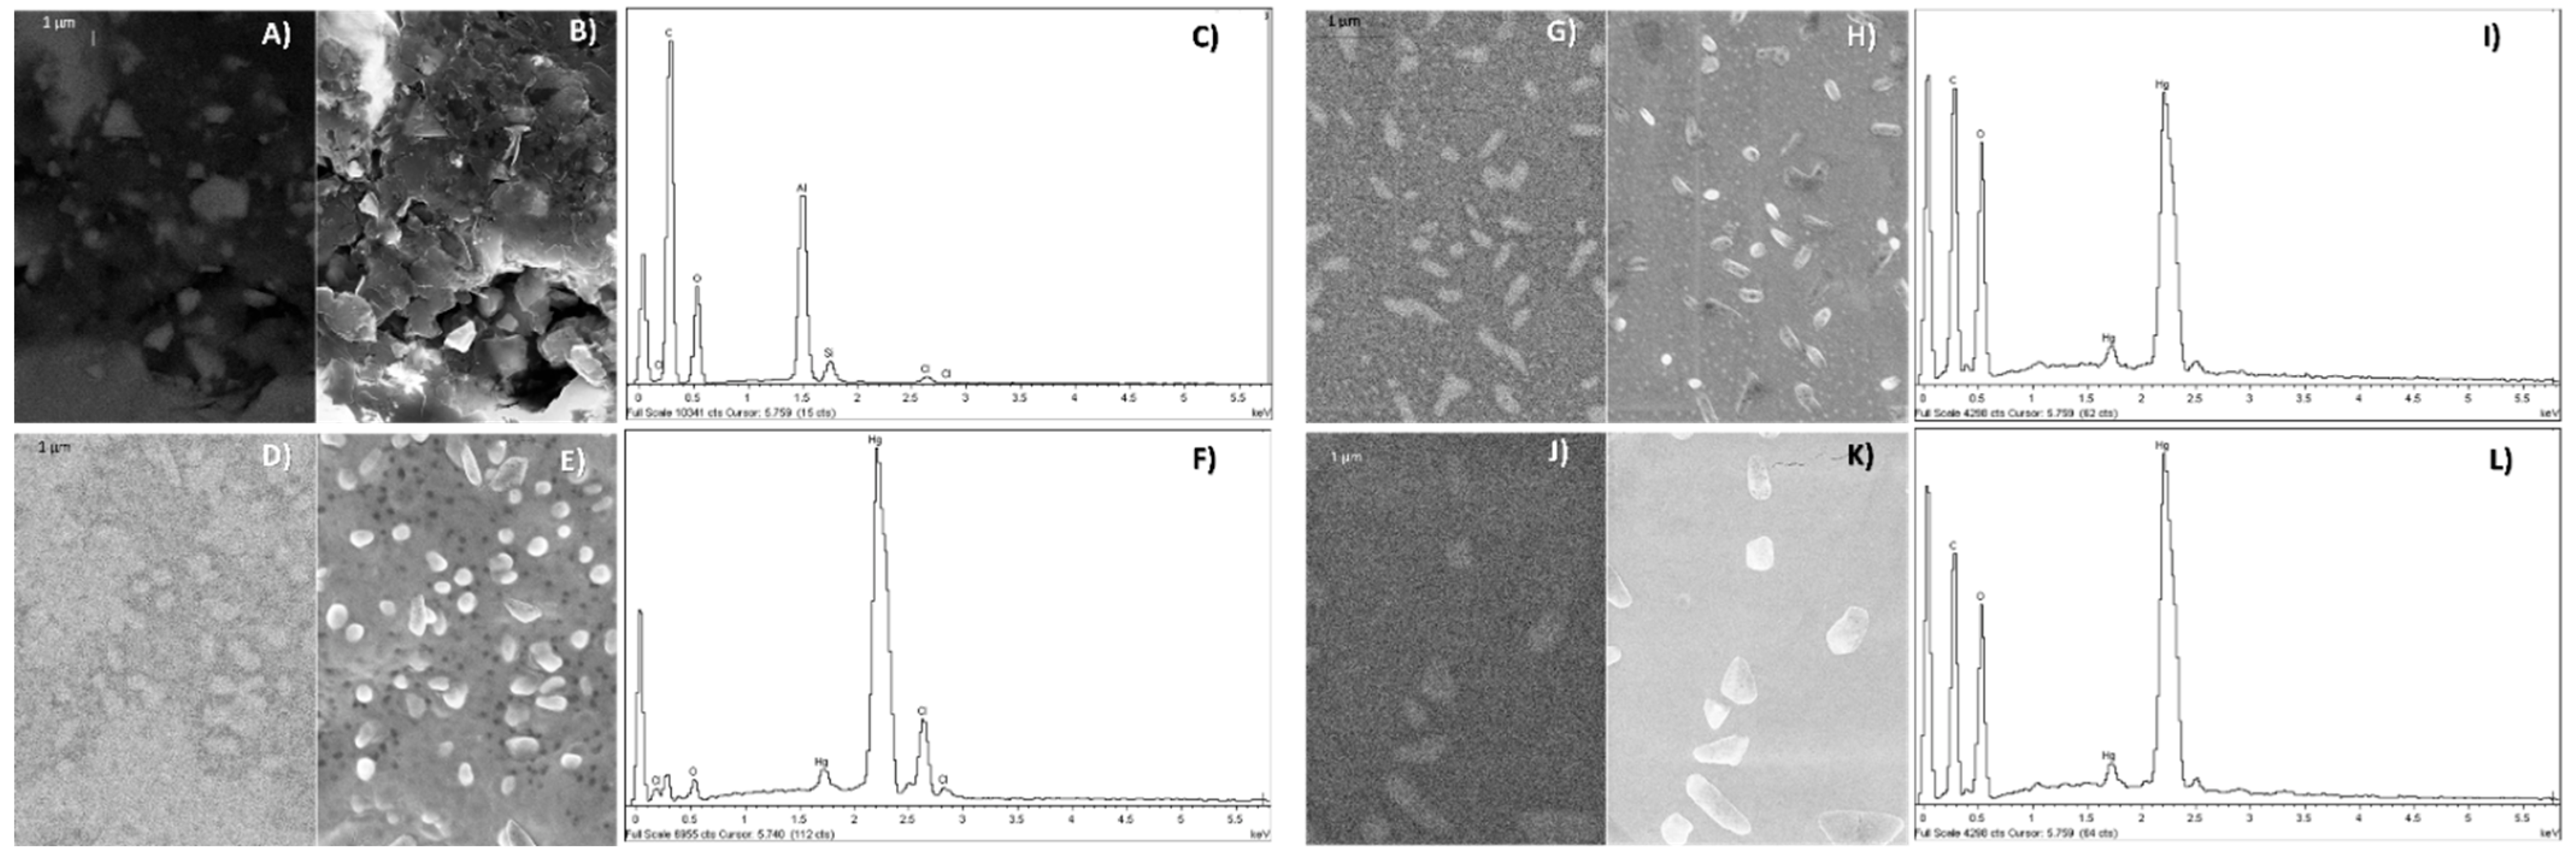
3.1. Morphological and Chemical Characterization of Hg-NPs

The average size of the prepared nanoparticles was obtained by direct measurement of the TEM images and the resulting size distribution histograms. These measurements were performed using the ImageJ Software (1.52 P), and the histograms obtained were adjusted to a three-parameter Gaussian curve Equation (1), where a is a statistical parameter related to this fitting, x0 is the mean diameter (to which most nanoparticles correspond) and w is the standard deviation. Histograms were calculated using data treatment software.
y = a e 0.5 x 0 x w 2
The calculated sizes for both Hg-NPs are presented in Figure 1. As it can be seen, the particle size of Hg-NPsRoute A is 2.7 ± 0.7 nm and that of Hg-NPsRoute B is 18 ± 5 nm.
A ζ value of +51.7 mV was obtained for Hg-NPsRoute A and +13.2 mV for Hg-NPsRoute B. The oxidation state of the Hg in NP precursor is initially Hg(I), but after the addition of PVA in NP preparation, mercury is reduced to Hg(0), leading to the formation and aggregation of nanospheres (as it can be seen in Figure S2A in the Supplementary Materials) [35,38]. In contrast, PDDA (Figure S2B in the Supplementary Materials) is not a reducing agent as strong as PVA, which could explain why the oxidation state of Hg does not change and just facilitates the nucleation and stabilization of nanocrystals [39,40]. These arguments are supported by the XPS results (Table S2 and Figure S3 in the Supplementary Materials). The binding energy for the 4f7/2 (101.31 eV) is analogous to that reported in the NIST database of the Hg2(NO3)2 (101.2 eV) [41]. The difference in terms of energy for the 4f7/2 and the 4f5/2 is 4.01 eV [42], so in this case, the binding energy for the 4f5/2 is 105.32 eV. Consequently, PDDA medium stabilizes the ions Hg22+ and NO3 from the Hg2(NO3)2 instead of promoting the reduction of Hg(I).
The surface of the nano-enabled composite electrodes was characterized by SEM. The information about the composition was given by the retro dispersive images and EDX. In Figure 2, it can be observed that the amount of the observed Hg-NPs changes depending on the type of electrode: the bare electrode with 20% graphite does not present mercury, and the Hg-NPsRoute A electrodes have the highest amount of mercury (Hg ≈ 27%). The Hg-NPsRoute B electrode (Hg ≈ 7%) and Hg-NPsRoute B/PDDA electrode (Hg ≈ 5%) have approximately the same quantity of Hg. Therefore, the highest amount of functionalization with Hg-NPs was obtained with Route A and similar contents of Hg-NPs were obtained by Route B.

3.2. Electrochemical Characterization of Hg-NP-Modified Composite Electrodes

Electrochemical electrode characterization by CV and EIS was carried out. As it is shown in Figure 3A, different peaks can be observed in all electrode types. Oxidation and reduction peaks to ferrocyanide/ferricyanide and peaks related to all oxidation states of mercury can be observed. For the bare electrode (20% graphite), the Fe2+ oxidation appears at 0.250 V vs. Ag/AgCl and the Fe3+ reduction appears at around 0.100 V vs. Ag/AgCl. On the other hand, ferrocyanide/ferricyanide peaks for all modified electrodes shift to lower potentials. The Fe2+ oxidation peak appears at 0.125 V vs. the Ag/AgCl and Fe3+ reduction peak around 0 V vs. Ag/AgCl. This shift to lower oxidation potentials is due to the simultaneous oxidations of Fe2+ and Hg(I) to Hg(II) or Hg(0) to Hg(II) according to the electrode (see Figure S4 in Supplementary Materials). Modified electrodes in Figure 3A show the oxidation wave of Hg(I) to Hg(II) around 0.125 V vs. Ag/AgCl for PDDA electrodes (Hg-NPsRoute A), while in PVA, there is one signal (Hg-NPsRoute B) mostly corresponding to Hg(0) towards Hg(II) oxidations, found at 0.125 V vs. Ag/AgCl. As for the reduction peaks, the one for Hg(II) to Hg(I) appears around 0 V vs. Ag/AgCl and the one belonging to Hg(II) turning into Hg(0) appears at −0.5 V vs. Ag/AgCl independently of either electrode. The Hg-NPsRoute B/PDDA electrode shows a similar response to Hg-NPsRoute B but a minor potential shift for anodic and cathodic waves regarding the bare electrode. The oxidation peak, Fe2+ and Hg(0) to Hg(II) (0.180 V vs. Ag/AgCl), and the reduction peaks, Fe3+ and Hg(0) to Hg(I) (around 0 V vs. Ag/AgCl), were obtained. The existence of a PDDA layer between the graphite surface and the Hg-NPsRoute B modifies the electronic transfer at the electrode surface.
The electroactive area (A) can be estimated from Ip using the Randles–Sevčik equation [43]:
I p =   3.01 × 10 5   ·   n 3 2 · α v D r e d 1 2 · A · C r e d
which is appropriate for the electron-transfer controlled process. In this equation, n is the number of electrons involved in the redox process (n = 1 for ferrocyanide/ferricyanide); α corresponds to the transfer coefficient, which was considered to be approximately 0.5; and Dred is 6.32 × 10⁻⁶ cm2 s−1 and corresponds to the diffusion coefficient of the reduced species. v is 0.01 V·s−1 and represents the scan rate area. C*red is equal to 0.01 M in this case, because it is the bulk concentration of the electroactive species. The electroactive surface of all the electrodes was calculated using Equation (2) and considering the first cycle of the CV and the cathodic intensity. The Fe3+ reduction peak was used since the Hg(II) to Hg(I) reduction peak is negligible in the first reduction wave. The first cycle allows the approximation of the electroactive because the signals are overlapped (see Figure S4 in Supplementary Materials). The electroactive surface for the bare electrode was 0.55 cm2; for the HgNPsRoute A, it was 0.27 cm2; and for HgNPsRoute B and HgNPsRoute B/PDDA, they were 0.20 cm2 and 0.19 cm2, respectively. In Figure 3B, EIS of Hg-NPsRoute A (RΩ: 57.4 Ω and RCT: 508 Ω) presents the smallest resistance to the electron flows, followed by the combination of Hg-NPsRoute B (RΩ: 106 Ω and RCT: 5771 Ω) and Hg-NPsRoute B/PDDA (RΩ: 95.7 Ω and RCT: 4837 Ω). The electrical equivalent circuits adjusted for each electrode kind are included in Figure S5 of the Supplementary Materials. The resistance of Hg-NPsRoute A electrode is closer to the bare electrode (20% graphite). The effect of the polymers on each NP synthetic route is evidenced in the electroactive area of the electrodes, the charge transference resistance, NP size and NP ζ potential values. PDDA is a quaternary amine polymer with formal positive charges that could form a network that allows charge migration that may enhance electronic transference. This can lead to higher electroactive surface, lower charge transference resistance and higher ζ potential (+51.7 mV), which means higher stability and less aggregation for Hg-NPsRoute A.

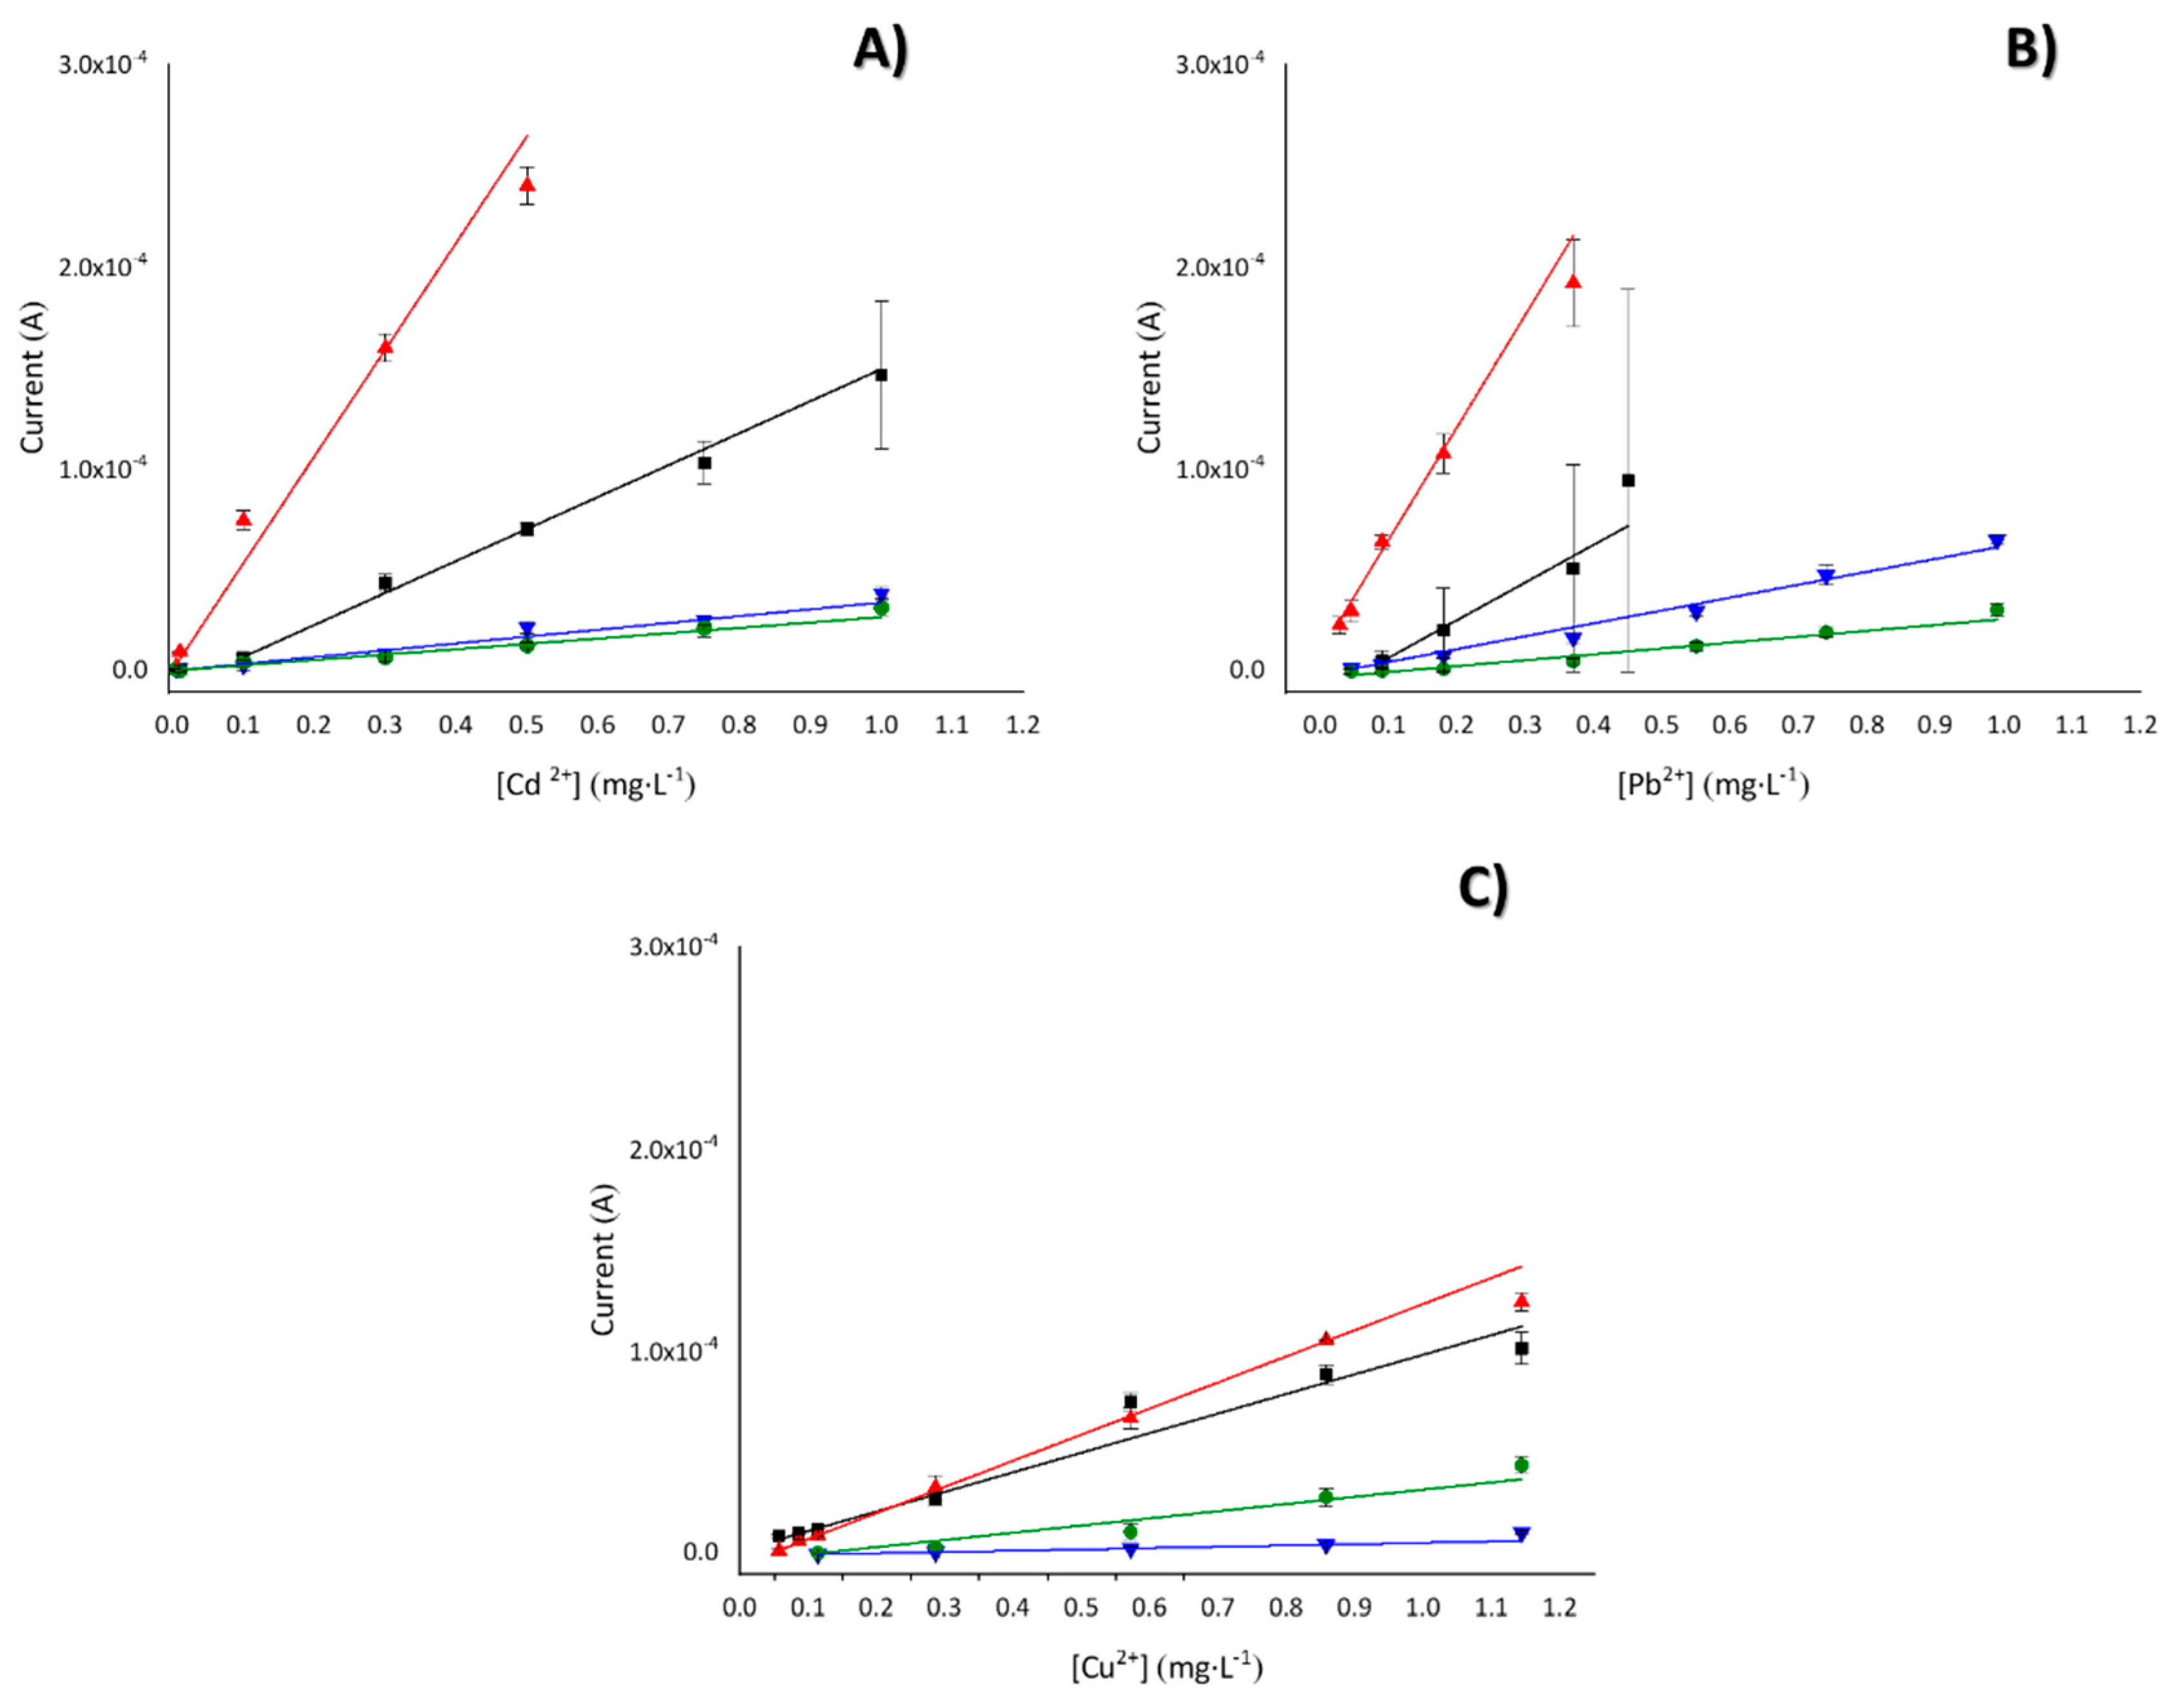
3.3. Analytical Characterization: Cation Metal Detection

The metal cation analyses using all sensors were performed by the SWASV technique. Different concentrations of each studied metal cation were analyzed individually to obtain the corresponding calibration curves (see Figure 4). Table 1 summarizes the analytical parameters found for each metal (Cd2+, Pb2+ and Cu2+).
The linear response range of the bare electrode (20% graphite) has an improvement with the electrode Hg-NP modification, especially for Cd2+ and Pb2+. The response range shifts to lower concentrations, except for Cu2+, because the linear range does not change; instead, using Hg-NPsRoute A, increased sensitivity was obtained. In general, higher sensitivity and wider linear range shifted to smaller concentrations were obtained for the modification with Hg-NPsRoute A. Thus, the results clearly indicate that this modification is the best for a suitable multi-metal sensor. Moreover, detection limits (DL) were calculated as the sum of the mean blank signal ( S ¯ B l a n k ) plus 3 times the standard deviation of the blank ( s B l a n k ) (Equation (3)). The results obtained are 0.0015 mg·L−1 for Cd2+and 0.020 mg·L−1 for Pb2+. Due to its proximity to the Hg peak (which appears at 0 V), the statistic calculus cannot be used in the case of Cu2+ to establish the detection limit; instead, it was established experimentally, measuring concentrations from 0.0010 to 0.057 mg·L−1, the largest concentration being the first to give a positive current.
S m = S ¯ B l a n k + 3 s B l a n k
Using the Hg-NPsRoute A sensor, a multi-metal cation calibration was developed (all the elements were simultaneously detected), obtaining a decrease in the linear range and an improved detection limit; the results are shown in Table 2.
The reproducibility of these sensors was established by the comparison of the sensitivity of full calibration curves made on different days with the same sensor and the same drop-casting modification for 3 days, with one calibration curve per day, and for the concentrations of Cd2+, 0.0050–0.30 mg·L−1; Pb2+, 0.046–0.37 mg·L−1; and Cu2+, 0.086–0.57 mg·L−1 (45 total measurements using the Hg-NPsRoute A electrode and only one drop-casting). The repeatability of the sensor modification process was measured by the comparison of the sensitivity of two different drop-casting modifications of Hg-NPsRoute A on the surface of the same electrode. The evaluated linear range response was the previous one, as can be seen in Table 3.

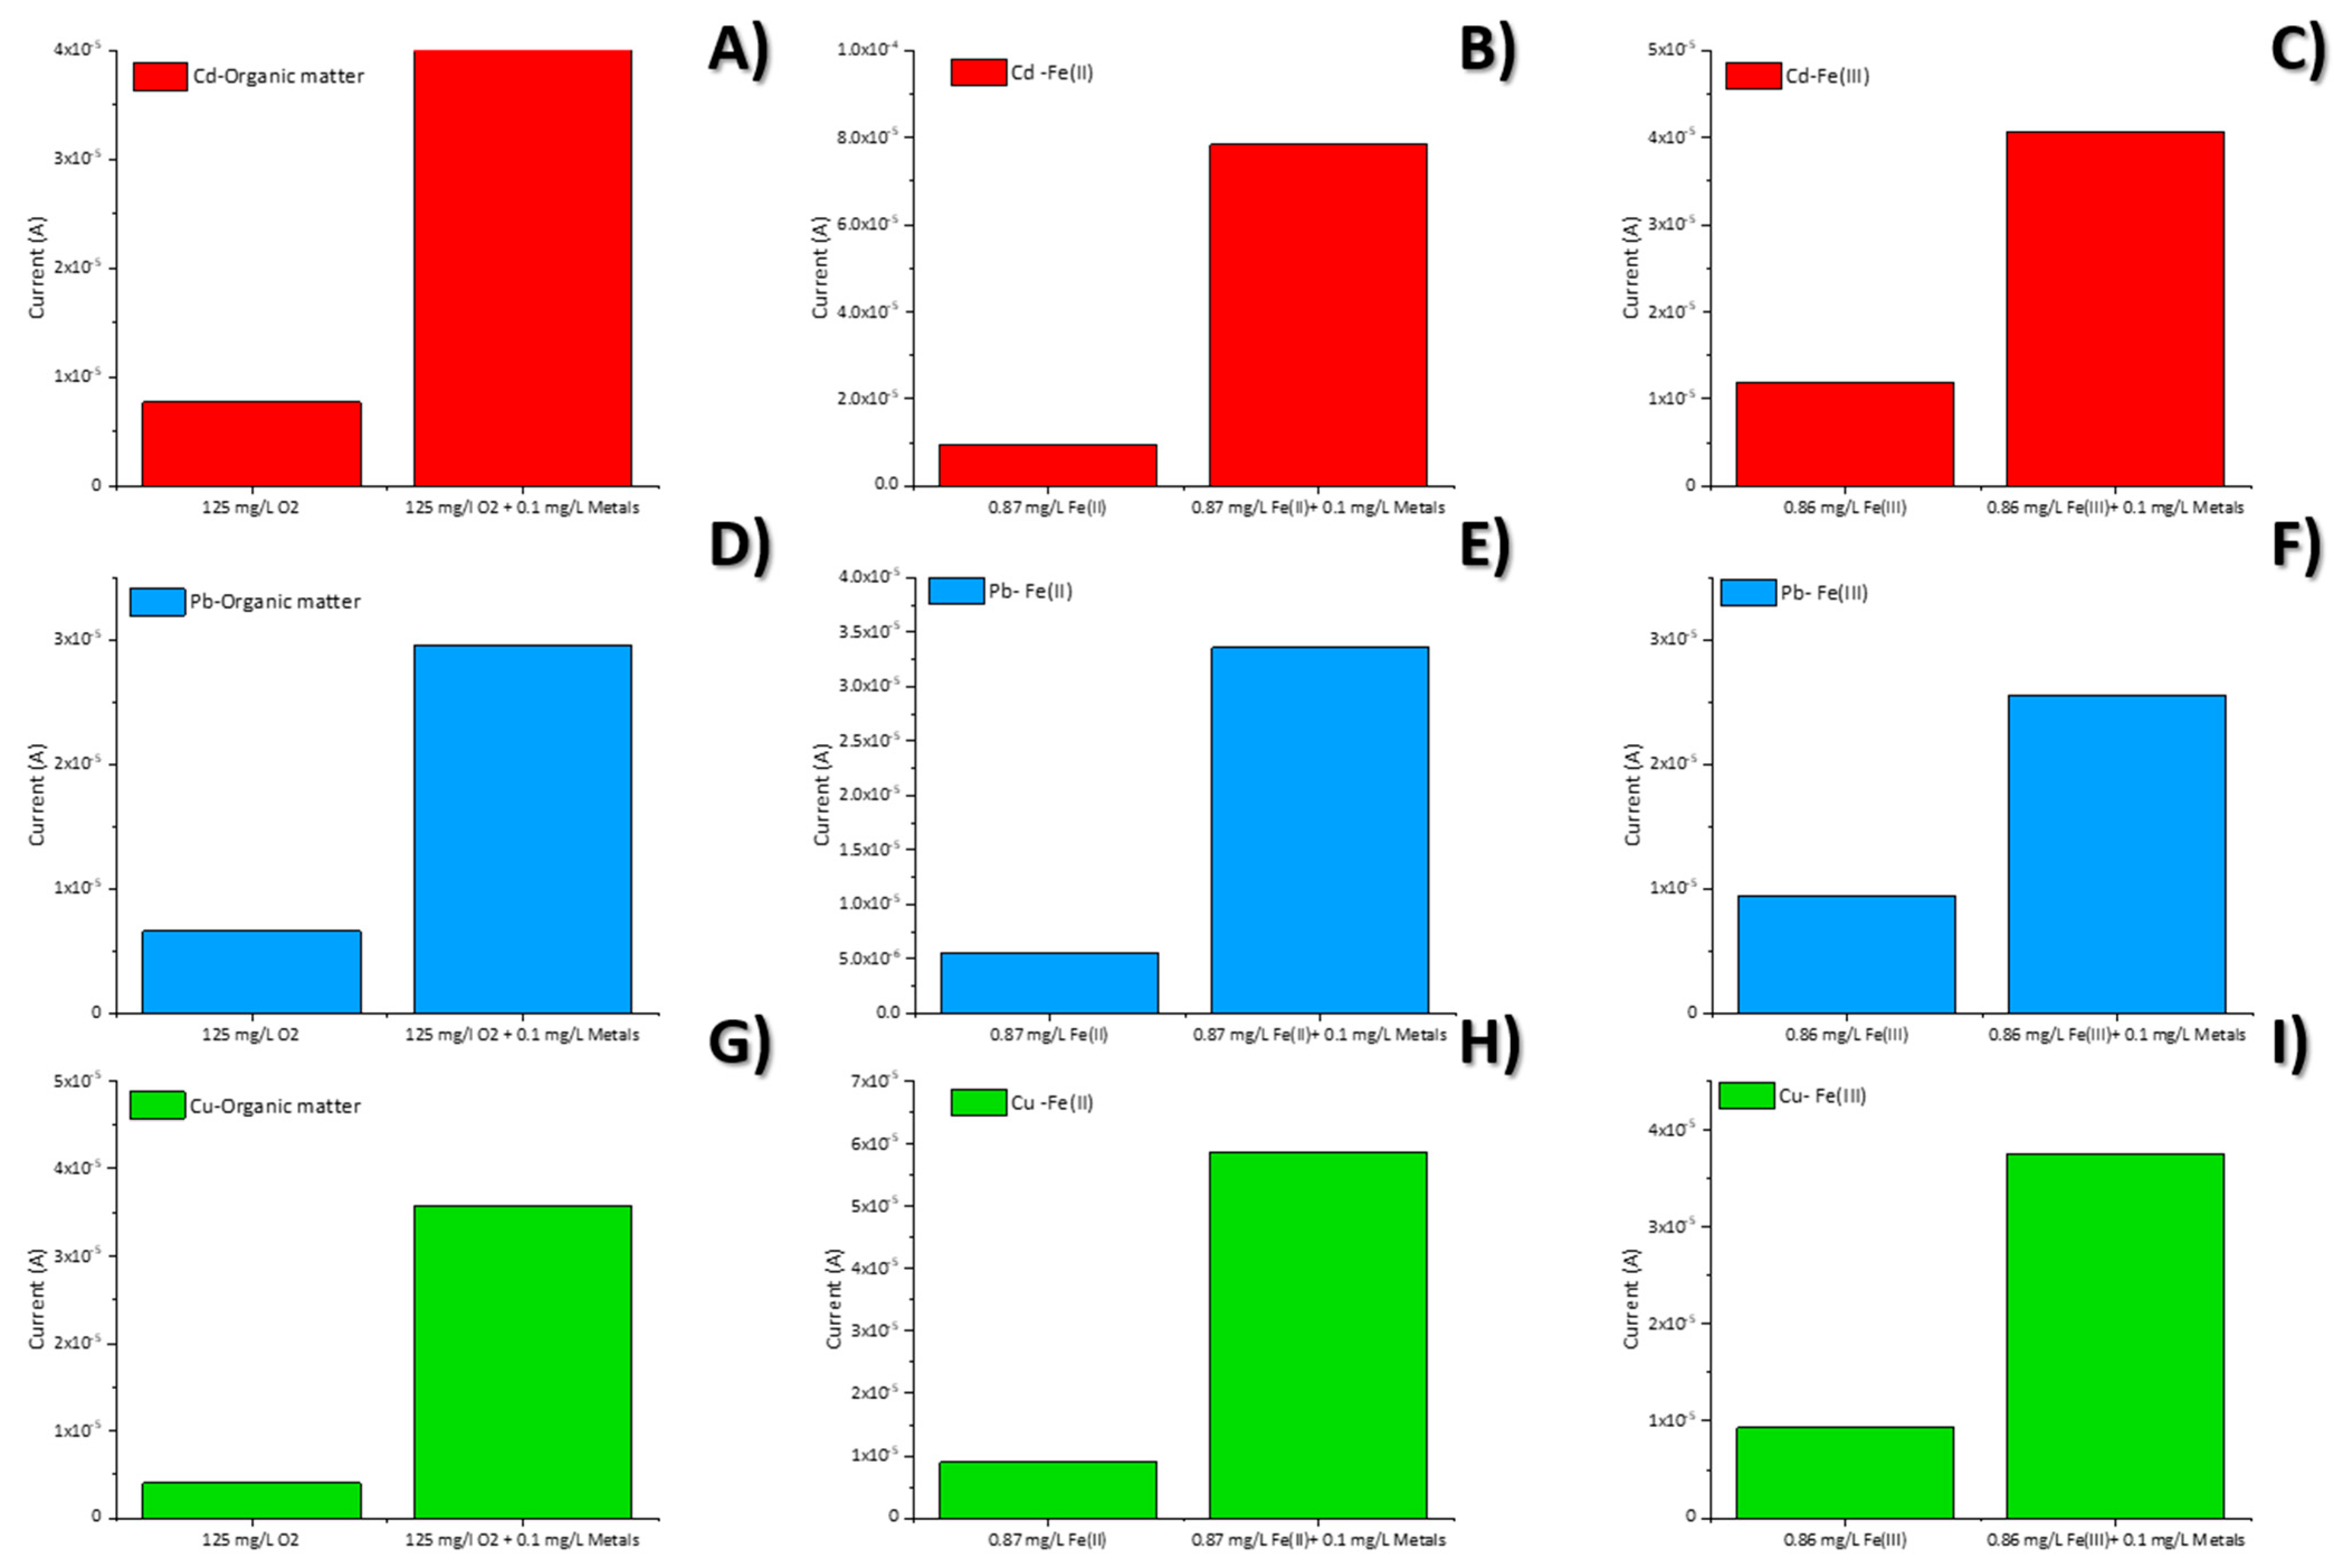
3.4. Interference Study

The selectivity of this sensing method for Cd2+, Pb2+ and Cu2+ was evaluated by SWASV using the Hg-NPs Route Amodified sensor. Anti-interference property is also a key factor for real sensors’ application. Furthermore, due to the response of the electrodes to the redox marker solution, which contains [Fe(CN)6]3−/4−, an interference study was performed. Accordingly, effects of potential co-existing ions such as Fe2+, Fe3+ and dissolved organic matter presence in environmental water samples were evaluated. The interference experiments were carried out analyzing seven concentrations of the interfering species between 0.07 and 0.87 mg·L−1 of Fe(II) or Fe(III), and 0.11 mg·L−1 of Cd2+, 0.09 mg·L−1 of Pb2+ and 0.08 mg·L−1 of Cu2+. For dissolved organic matter, the maximum discharge concentration allowed in treated urban wastewater was considered (125 mg L−1). Figure 5 is the summary of the current obtained to the maximum concentration of each interference species in the presence of the metal cation at a concentration ≈10% lower compared to interference. In Figure S6 of the Supplementary Materials, the voltammograms obtained for different interference concentrations and after metallic cation addition can be found. In Figure 5, all interferents studied show non-significant responses compared to metal cation responses. These results reflect the superior behavior of the Hg-NPsRoute A sensor in metal concentration analysis to concentrations inside the linear response range for each metal, a fact that motivated us to explore its applicability in various real samples.

3.5. Suitability for Real Samples Analysis

Hg-NPsRoute A-modified electrode was tested with spiked samples prepared from tap water from the area of Barcelona (Spain). The concentrations of the metals of interest were analyzed simultaneously by standard addition calibration. The results are shown in Figure 6 and the calibration curves were obtained for Cd2+: y = (2.9 ± 0.3)·10−4x + (2.4 ± 0.2)·10−5, R2 = 0.98; for Pb2+: y = (2.9 ± 0.1)·10−4x + (1.8 ± 0.1)·10−5, R2 = 0.99; and for Cu2+: y = (3.0 ± 0.6)·10−4x + (1.9 ± 0.5)·10−5, R2 = 0.93. The results are summarized in Table 4 and compared with a reference method (ICP-MS).

4. Discussion

Evaluating the properties of the Hg-NPs prepared by the different above-mentioned approaches, Hg-NPsRoute A show better characteristics in terms of electroanalytical performance. Hg-NPsRoute A present a 2.7 ± 0.7 nm particle size and +51.7 mV ζ potential value, compared with Hg-NPsRoute B, which present 18 ± 5 nm particle size and +13.2 mV ζ potential value. Using PVA, the oxidation state of the Hg-NPsRoute B has been reported to be 0 [35], which can lead to lower stability and larger size, probably related to the aggregation trend of mercury particles. On the other hand, the oxidation state of Hg-NPsRoute A has been determined by XPS analysis, and the binding energy found is analogue to the one reported for the compound Hg2(NO3)2 [41], which belongs to Hg(I)’s oxidation state. These arguments are supported by XPS results. PDDA medium stabilizes the ions Hg22+ and NO3 from the Hg2(NO3)2 instead of causing the reduction of Hg(I).
The bare electrodes were modified by drop-casting directly on the electrode surface of the different Hg-NPs (Route A; Route B), and the third type of electrode was tested by placing a PDDA layer and then drop-casting the Hg-NPsRoute B/PDDA. Comparing the information obtained from CV and EIS, the Hg-NPsRoute B-modified electrodes presented smaller peaks of oxidation/reduction currents for the Fe(II)/Fe(III) ionic pair and higher charge transference resistance, which means that the reaction on the surface of the electrode is not favored.
For all Hg-NP-modified electrodes, a small shift in the Fe2+ oxidation potential towards lower potential is observed. The oxidation peaks of Hg-NPs (Hg(0) to Hg (I) or Hg (II), or Hg(I) to Hg (II)) overlap with the oxidation of Fe2+ and cannot be differentiated. Thus, the electroactive surface should be evaluated using the cathodic peak of Fe3+ reduction because the anodic current of Fe2+ overlaps with the oxidation peak of Hg. For this reason, the Fe3+ reduction peak has been used since the Hg(II) to Hg(I) reduction peak is negligible in the first reduction wave.
In the interference study, the measurements were made in the presence of dissolved organic matter (125 mg·L−1 O2) without and with 0.11 mg L−1 of Cd2+, 0.09 mg L−1 of Pb2+ and 0.08 mg L−1 of Cu2+, and no significant response at the potentials studied for the metal cations was obtained. In the case of Fe(II) and Fe(III), seven additions of these cations were performed, and no peak was observed. In addition, when the concentration of the potential interference was ≈10 times bigger that the analyte, no differences were obtained.
Then, the four types of electrodes were tested by analyzing the metal cations individually, and the one with the best response is the Hg-NPsRoute A electrode. The sensitivities obtained using this electrode for each metal independently were (5.3 ± 0.7) × 10−4 [A·L·mg−1] for Cd2+, (5.6 ± 0.5) × 10−4 [A·L·mg−1] for Pb2+ and (1.29 ± 0.02) × 10−4 [A·L·mg−1] for Cu2+, which are higher compared to the other electrodes tested here. Moreover, the linear range for this electrode is from 0.0050 to 0.50 mg·L−1 for Cd2+, 0.028 to 0.37 mg·L−1 for Pb2+ and for Cu2+ from 0.057 to 1.1 mg·L−1; the detection limits for Cd2+, Pb2+ and Cu2+ metals are 0.0015 mg·L−1, 0.02 mg·L −1 and 0.057 mg·L−1, respectively.
The oxidation state of the mercury in the Hg-NPsRoute A electrode could be a key point in the mechanism of interaction with the metals. Initially, the Hg-NPs are Hg(I), but after applying the reduction potential of −1.4 V from the preconcentration step of the SWASV for the reduction of the metals, the mercury can be reduced to Hg(0). This may lead to the formation of the amalgam with the analytes. However, in the electrodes modified with Hg-NPsRoute B, at the beginning, there is Hg(0), so they can detect lower concentrations than the bare electrode. Cu2+ behaves differently because this metal has low solubility in Hg at room temperature [44], so the mechanism could be related to the active area available on the electrode surface. When the metals were analyzed simultaneously, a linear range shift towards higher concentrations could be related to the competition of the metals and its special sensitivity (if they form amalgam or not) to the active area of the electrode. If the active spot is occupied by one metal cation, another cannot be placed in it. Furthermore, the analysis of real samples demonstrated that the Hg-NPsRoute A sensor can be suitable to simultaneously detect three heavy metals in complex aqueous matrixes.

5. Conclusions

Mercury nanoparticles constitute a suitable strategy to modify bare 20% graphite electrodes based on composite materials for metal detection. Due to the PDDA properties, Hg-NPsRoute A behavior seems to be more accurate to be used in heavy metal (Cd2+, Pb2+ and Cu2+) analysis. These nanoparticles are smaller than the ones obtained in Route B, and the ζ potential values indicate that they have less tendency to aggregate. Furthermore, comparing the EDX data, the Hg amount on the surface of the electrode using Route A is higher than the other ones. Using the preconcentration step of the SWASV with Hg-NPsRoute A can lead to higher sensitivity and lower detection limits in comparison to the other modified electrodes. Moreover, this opens the possibility for the synthesis of different oxidation states of Hg-NPs as well as their modification over the electrode surface. Finally, these newly designed sensors may allow for the implementation of faster, cheaper and more reliable methods of measuring metal-contaminated water systems.

Supplementary Materials

The following supporting information can be downloaded at: https://www.mdpi.com/article/10.3390/chemosensors10040148/s1, Figure S1: Scheme of the three types of electrodes; Figure S2: Using Dino-Lite Digital Microscope at 1:120 augments (A) Hg-NPsRoute B @graphite electrode surface, and (B) Hg-NPsRoute A@graphite electrode surface; Figure S3: XPS analysis: adjustment for Hg 4f with two components: (green) for Hg 4f5/2 and (red) for Hg 4f7/2; Figure S4: (A) CV using 0.01 M [Fe(CN)6]3−/[Fe(CN)6]4−, 0.1 M KCl with a 20% graphite electrode and 20% graphite electrode/PDDA. Comparison of the response in CV and in 0.01 M [Fe(CN)6]3−/[Fe(CN)6]4−, 0.1 M KCl and just 0.1 M KCl for (B) Hg-NPsRouteA@graphite electrode; (C) Hg-NPsRoute B@graphite electrode; (D) Hg-NPsRouteB/PDDA@graphite electrode; Figure S5: EIS adjusted circuits for: Hg-NPsRoute A@graphite electrode (A); Hg-NPsRoute B@graphite electrode (B); Hg-NPsRoute B/PDDA@graphite electrode (C). Where RΩ is the ohmic resistance; RCT is the charge transference resistance and D is the diffusion element chosen (G: Gerischer, W: Warburg); Figure S6: SWASV results of the addition for the interferences study: (A) dissolved organic matter; (B) Fe(II) and (C) Fe(III); Table S1: Response of some modified electrodes and other analytical techniques; Table S2: Data obtained from the adjustment of two components in the XPS analysis. Calibration made by using C at 284.8 eV.

Author Contributions

Funding acquisition, M.B.; investigation, L.L.F. and J.B.-A.; project administration, M.B.; supervision, C.P., J.B.-A. and M.B.; writing—original draft, L.L.F., C.P., J.B.-A. and M.B.; writing—review and editing, L.L.F., C.P., J.B.-A. and M.B. All authors have read and agreed to the published version of the manuscript.

Funding

This research was funded by the RTI2018-099362-B-C21 research project from the Spanish Ministerio de Economía y Competitividad y Fondo Europeo de Desarrollo Regional (MINECO/FEDER, UE).

Data Availability Statement

The data presented in this study are available on request from the corresponding author. The data are not publicly available because the repository that is used to keep the data is a private one provided by the University.

Acknowledgments

Laia, L. Fernández acknowledges Universitat Autónoma de Barcelona (UAB) for the PIF grant and the authors acknowledge Servei de Microscopia of UAB for the SEM, TEM and EDX analysis; to Roberto Boada and Konrad Eiler for their help with the XPS data; and to Franc Paré for his help in electrochemical analysis.

Conflicts of Interest

The authors declare no conflict of interest.

References

  1. Chubaka, C.E.; Whiley, H.; Edwards, J.W.; Ross, K.E. Lead, Zinc, Copper, and Cadmium Content of Water from South Australian Rainwater Tanks. Int. J. Environ. Res. Public Health 2018, 15, 1551. [Google Scholar] [CrossRef] [PubMed] [Green Version]
  2. Gaetke, L.M.; Chow, C.K. Copper toxicity, oxidative stress, and antioxidant nutrients. Toxicology 2003, 189, 147–163. [Google Scholar] [CrossRef]
  3. Gaetke, L.M.; Chow-Johnson, H.S.; Chow, C.K. Copper: Toxicological relevance and mechanisms. Arch. Toxicol. 2014, 88, 1929–1938. [Google Scholar] [CrossRef] [PubMed]
  4. Godt, J.; Scheidig, F.; Grosse-Siestrup, C.; Esche, V.; Brandenburg, P.; Reich, A.; A Groneberg, D. The toxicity of cadmium and resulting hazards for human health. J. Occup. Med. Toxicol. 2006, 1, 22. [Google Scholar] [CrossRef] [PubMed] [Green Version]
  5. Wani, A.L.; Ara, A.; Usmani, J.A. Lead toxicity: A review. Interdiscip. Toxicol. 2015, 8, 55–64. [Google Scholar] [CrossRef] [Green Version]
  6. Bocca, B.; Caimi, S.; Senofonte, O.; Alimonti, A.; Petrucci, F. ICP-MS based methods to characterize nanoparticles of TiO2 and ZnO in sunscreens with focus on regulatory and safety issues. Sci. Total Environ. 2018, 630, 922–930. [Google Scholar] [CrossRef]
  7. Lim, J.Y.; Mubarak, N.; Abdullah, E.C.; Nizamuddin, S.; Khalid, M. Inamuddin Recent trends in the synthesis of graphene and graphene oxide based nanomaterials for removal of heavy metals—A review. J. Ind. Eng. Chem. 2018, 66, 29–44. [Google Scholar] [CrossRef]
  8. Tseng, W.-C.; Hsu, K.-C.; Shiea, C.S.; Huang, Y.-L. Recent trends in nanomaterial-based microanalytical systems for the speciation of trace elements: A critical review. Anal. Chim. Acta 2015, 884, 1–18. [Google Scholar] [CrossRef]
  9. Bansod, B.K.; Kumar, T.; Thakur, R.; Rana, S.; Singh, I. A review on various electrochemical techniques for heavy metal ions detection with different sensing platforms. Biosens. Bioelectron. 2017, 94, 443–455. [Google Scholar] [CrossRef]
  10. Skoog, D.A.; James Holler, F.; Nieman, T.A. (Eds.) Principios de Análisis Instrumental, 5th ed.; McGrawHill: New York, NY, USA, 2001; 856p. [Google Scholar]
  11. Yao, Y.; Wu, H.; Ping, J. Simultaneous determination of Cd(II) and Pb(II) ions in honey and milk samples using a single-walled carbon nanohorns modified screen-printed electrochemical sensor. Food Chem. 2019, 274, 8–15. [Google Scholar] [CrossRef]
  12. Armstrong, K.C.; Tatum, C.E.; Dansby-Sparks, R.N.; Chambers, J.Q.; Xue, Z.-L. Individual and simultaneous determination of lead, cadmium, and zinc by anodic stripping voltammetry at a bismuth bulk electrode. Talanta 2010, 82, 675–680. [Google Scholar] [CrossRef] [PubMed] [Green Version]
  13. Dutta, S.; Strack, G.; Kurup, P. Gold nanostar electrodes for heavy metal detection. Sens. Actuators B Chem. 2019, 281, 383–391. [Google Scholar] [CrossRef]
  14. Niu, P.; Fernández-Sánchez, C.; Gich, M.; Navarro-Hernández, C.; Fanjul-Bolado, P.; Roig, A. Screen-printed electrodes made of a bismuth nanoparticle porous carbon nanocomposite applied to the determination of heavy metal ions. Mikrochim. Acta 2016, 183, 617–623. [Google Scholar] [CrossRef]
  15. Ross, J.W.; DeMars, R.D.; Shain, I. Analytical Applications of Hanging Mercury Drop Electrode. Anal. Chem. 1956, 28, 1768–1771. [Google Scholar] [CrossRef]
  16. Pujol, L.; Evrard, D.; Serrano, K.G.; Freyssinier, M.; Ruffien-Cizsak, A.; Gros, P. Electrochemical sensors and devices for heavy metals assay in water: The French groups’ contribution. Front. Chem. 2014, 2, 19. [Google Scholar] [CrossRef] [Green Version]
  17. Ariño, C.; Serrano, N.; Díaz-Cruz, J.M.; Esteban, M. Voltammetric determination of metal ions beyond mercury electrodes. A review. Anal. Chim. Acta 2017, 990, 11–53. [Google Scholar] [CrossRef] [Green Version]
  18. Muñoz, J.; Montes, R.; Baeza, M. Trends in electrochemical impedance spectroscopy involving nanocomposite transducers: Characterization, architecture surface and bio-sensing. TrAC Trends Anal. Chem. 2017, 97, 201–215. [Google Scholar] [CrossRef]
  19. King, W.I. The Annals of Mathematical Statistics. Ann. Math. Stat. 1930, 1, 1–2. [Google Scholar] [CrossRef]
  20. Montes, R.; Bartrolí, J.; Céspedes, F.; Baeza, M. Towards to the improvement of the analytical response in voltammetric sensors based on rigid composites. J. Electroanal. Chem. 2014, 733, 69–76. [Google Scholar] [CrossRef]
  21. Chaiyo, S.; Mehmeti, E.; Žagar, K.; Siangproh, W.; Chailapakul, O.; Kalcher, K. Electrochemical sensors for the simultaneous determination of zinc, cadmium and lead using a Nafion/ionic liquid/graphene composite modified screen-printed carbon electrode. Anal. Chim. Acta 2016, 918, 26–34. [Google Scholar] [CrossRef]
  22. Truzzi, C.; Lambertucci, L.; Gambini, G.; Scarponi, G. Optimization of square wave anodic stripping voltammetry (SWASV) for the simultaneous determination of Cd, Pb, and Cu in seawater and comparison with differential pulse anodic stripping voltammetry (DPASV). Ann. Chim. 2002, 92, 313–326. [Google Scholar] [PubMed]
  23. Muñoz, C.; Zuñiga, M.; Arancibia, V. Stripping voltammetric determination of cadmium in sea water using a carbon paste electrode modified with alginic acid from brown algae. J. Braz. Chem. Soc. 2010, 21, 1688–1691. [Google Scholar] [CrossRef] [Green Version]
  24. Englich, F.V.; Foo, T.C.; Richardson, A.C.; Ebendorff-Heidepriem, H.; Sumby, C.J.; Monro, T.M. Photoinduced Electron Transfer Based Ion Sensing within an Optical Fiber. Sensors 2011, 11, 9560–9572. [Google Scholar] [CrossRef] [PubMed] [Green Version]
  25. Aragay, G.; Pons, J.; Merkoçi, A. Recent Trends in Macro-, Micro-, and Nanomaterial-Based Tools and Strategies for Heavy-Metal Detection. Chem. Rev. 2011, 111, 3433–3458. [Google Scholar] [CrossRef] [PubMed]
  26. Abdel-Karim, R.; Reda, Y.; Abdel-Fattah, A. Review—Nanostructured Materials-Based Nanosensors. J. Electrochem. Soc. 2020, 167, 037554. [Google Scholar] [CrossRef]
  27. Hong, N.H. Introduction to Nanomaterials: Basic Properties, Synthesis, and Characterization; Elsevier Inc.: Amsterdam, The Netherlands, 2018. [Google Scholar] [CrossRef]
  28. Bastos-Arrieta, J.; Montes, R.; Ocaña, C.; Espinoza, M.; Muñoz, M.; Baeza, M. In situ characterization of size, spatial distribution, chemical composition, and electroanalytical response of hybrid nanocomposite materials. In In-Situ Characterization Techniques for Nanomaterials; Springer: Berlin/Heidelberg, Germany, 2018. [Google Scholar] [CrossRef]
  29. Ajitha, B.; Reddy, Y.A.K.; Reddy, P.S.; Jeon, H.-J.; Ahn, C.W. Role of capping agents in controlling silver nanoparticles size, antibacterial activity and potential application as optical hydrogen peroxide sensor. RSC Adv. 2016, 6, 36171–36179. [Google Scholar] [CrossRef]
  30. Regnery, S.; Ehrhart, P.; Szot, K.; Waser, R.; Ding, Y.; Jia, C.L.; Schumacher, M.; Mcentee, T. MOCVD of (Ba,Sr)TiO3: Nucleation and Growth. Integr. Ferroelectr. 2003, 57, 1175–1184. [Google Scholar] [CrossRef]
  31. Ramesh, G.V.; Prasad, M.D.; Radhakrishnan, T.P. Mercury Nanodrops and Nanocrystals. Chem. Mater. 2011, 23, 5231–5236. [Google Scholar] [CrossRef]
  32. Dong, L.; Zhang, X.; Ren, S.; Lei, T.; Sun, X.; Qi, Y.; Wu, Q. Poly(diallyldimethylammonium chloride)-cellulose nanocrystals supported Au nanoparticles for nonenzymatic glucose sensing. RSC Adv. 2016, 6, 6436–6442. [Google Scholar] [CrossRef]
  33. Wang, S.; Wang, X.; Jiang, S.P. Self-assembly of mixed Pt and Au nanoparticles on PDDA-functionalized graphene as effective electrocatalysts for formic acid oxidation of fuel cells. Phys. Chem. Chem. Phys. 2011, 13, 6883–6891. [Google Scholar] [CrossRef]
  34. Torres-Rivero, K.; Torralba-Cadena, L.; Espriu-Gascon, A.; Casas, I.; Bastos-Arrieta, J.; Florido, A. Strategies for Surface Modification with Ag-Shaped Nanoparticles: Electrocatalytic Enhancement of Screen-Printed Electrodes for the Detection of Heavy Metals. Sensors 2019, 19, 4249. [Google Scholar] [CrossRef] [PubMed] [Green Version]
  35. Ref, L. Determinación de Cobre en Agua. Available online: https://www.dropsens.com/pdfs_productos/new_brochures/pl1_pl2_pl3_pl4_pl5_pl6_pl7.pdf (accessed on 13 September 2020).
  36. Landon, P.B.; Mo, A.H.; Zhang, C.; Emerson, C.D.; Printz, A.; Gomez, A.F.; Delatorre, C.J.; Colburn, D.A.M.; Anzenberg, P.; Eliceiri, M.; et al. Designing Hollow Nano Gold Golf Balls. ACS Appl. Mater. Interfaces 2014, 6, 9937–9941. [Google Scholar] [CrossRef] [PubMed] [Green Version]
  37. Zhang, Z.; Shen, W.; Xue, J.; Liu, Y.; Liu, Y.; Yan, P.; Liu, J.; Tang, J. Recent advances in synthetic methods and applications of silver nanostructures. Nanoscale Res. Lett. 2018, 13, 54. [Google Scholar] [CrossRef] [PubMed] [Green Version]
  38. Borowiec, J.; Yan, K.; Tin, C.-C.; Zhang, J. Synthesis of PDDA Functionalized Reduced Graphene Oxide Decorated with Gold Nanoparticles and Its Electrochemical Response toward Levofloxacin. J. Electrochem. Soc. 2014, 162, H164–H169. [Google Scholar] [CrossRef]
  39. Yu, C.-J.; Lin, C.-Y.; Liu, C.-H.; Cheng, T.-L.; Tseng, W.-L. Synthesis of poly(diallyldimethylammonium chloride)-coated Fe3O4 nanoparticles for colorimetric sensing of glucose and selective extraction of thiol. Biosens. Bioelectron. 2010, 26, 913–917. [Google Scholar] [CrossRef]
  40. Fairley, N.; Fernandez, V.; Richard-Plouet, M.; Guillot-Deudon, C.; Walton, J.; Smith, E.; Flahaut, D.; Greiner, M.; Biesinger, M.; Tougaard, S.; et al. Systematic and collaborative approach to problem solving using X-ray photoelectron spectroscopy. Appl. Surf. Sci. Adv. 2021, 5, 100112. [Google Scholar] [CrossRef]
  41. National Institute of Standards and Technology. NIST X-ray Photoelectron Spectroscopy Database. In NIST Standard Reference Database Number 20; National Institute of Standards and Technology: Gaithersburg, MD, USA, 2000; 20899. Available online: https://srdata.nist.gov/xps/Default.aspx (accessed on 27 February 2022).
  42. Briggs, D. X-ray photoelectron spectroscopy (XPS). In Handbook of Adhesion, 2nd ed.; Springer: Berlin/Heidelberg, Germany, 2005; pp. 621–622. [Google Scholar] [CrossRef]
  43. Rudnicki, K.; Brycht, M.; Leniart, A.; Domagała, S.; Kaczmarek, K.; Kalcher, K.; Skrzypek, S. A Sensitive Sensor Based on Single-walled Carbon Nanotubes: Its Preparation, Characterization and Application in the Electrochemical Determination of Drug Clorsulon in Milk Samples. Electroanalysis 2019, 32, 375–383. [Google Scholar] [CrossRef]
  44. Chakrabarti, D.J.; Laughlin, D.E. The Cu-Hg (Copper-Mercury) system. Bull. Alloy Phase Diagr. 1985, 6, 522–527. [Google Scholar] [CrossRef]
Figure 1. TEM images for (A) Hg-NPsRoute A and (B) Hg-NPsRoute B. Inset histograms related.
Chemosensors 10 00148 g001
Figure 2. Retrodispersive (A), secondary electron SEM image (B) and EDX graphs (C) for 20% graphite. Retrodispersive (D), secondary electron SEM image (E) and EDX graphs (F) for Hg-NPsRoute A @graphite electrode. Retrodispersive (G), secondary electron SEM image (H) and EDX graphs (I) for Hg-NPsRoute B @graphite electrode. Retrodispersive (J), secondary electron SEM image (K) and EDX graphs (L) for Hg-NPsRoute B/PDDA @graphite electrode. Both retrodispersive and secondary electron SEM images have the same scale: 1 µm.
Chemosensors 10 00148 g002
Figure 3. Electrochemical electrode characterization. (A) Superposition of the cyclic voltammograms obtained for each type of electrode: bare (20% graphite), Hg-NPsRoute A, Hg-NPsRoute B, Hg-NPsRoute B/PDDA. Scan rate: 10 mV·s−1. (B) Electrochemical impedance spectroscopy obtained for each type of electrode: bare (20% graphite), Hg-NPsRoute A, Hg-NPsRoute B, Hg-NPsRoute B/PDDA.
Chemosensors 10 00148 g003
Figure 4. Calibration curves of Cd2+ (A), Pb2+ (B) and Cu2+ (C) using the four different electrodes under study ■ 20% graphite; ▲ Hg-NPsRoute A; ▼Hg-NPsRoute B; ● Hg-NPsRoute B/PDDA. The experimental error was estimated as the standard deviation (n = 3).
Chemosensors 10 00148 g004
Figure 5. Summary of the currents obtained for the maximum concentrations of interference evaluated in the presence or not of the analyte: (A) 0.11 mg·L−1 Cd2+-125 mg·L−1 O2; (B) 0.11 mg·L−1 Cd2+-0.87 mg·L−1 Fe(II); (C) 0.11 mg·L−1 Cd2+-0.86 mg·L−1 Fe(III); (D) 0.09 mg·L−1 Pb2+-125 mg·L−1 O2; (E) 0.09 mg·L−1 Pb2+-0.87 mg·L−1 Fe(II); (F) 0.09 mg·L−1 Pb2+-0.86 mg·L−1 Fe(III); (G) 0.08 mg·L−1 Cu2+-125 mg·L−1 O2; (H) 0.08 mg·L−1 Cu2+-0.87 mg·L−1 Fe(II); (I) 0.08 mg·L−1 Cu2+-0.86 mg·L−1 Fe(III).
Chemosensors 10 00148 g005
Figure 6. SWASV results obtained for tap water sample spiked with Hg-NPsRoute A-modified electrodes obtaining the peaks of Cd2+ (−0.68 V), Pb2+ (−0.5 V) and Cu2+ (−0.25 V) for each addition. In the inset are the addition standard curves for each metal.
Chemosensors 10 00148 g006
Table 1. Electroanalytical performance by SWASV of the electrodes for all metal cations analyzed independently.
Cd2+
ElectrodeSensitivity [A·L·mg−1]R2 (n = 5)Linear Range [mg·L−1]
Bare(1.6 ± 0.1) × 10−40.9950.10–1.0
Hg-NPsRoute A(5.3 ± 0.7) × 10−40.930.0050–0.50
Hg-NPsRoute B(3.4 ± 0.2) × 10−50.980.050–1.0
Hg-NPsRoute B/PDDA(2.6 ± 0.3) × 10−50.940.050–1.0
Pb2+
ElectrodeSensitivity [A·L·mg−1]R2 (n = 5)Linear Range [mg·L−1]
Bare(1.9 ± 0.2) × 10−40.950.090–0.45
Hg-NPsRoute A(5.6 ± 0.5) × 10−40.960.028–0.37
Hg-NPsRoute B(6.4 ± 0.3) × 10−50.980.045–1.0
Hg-NPsRoute B/PDDA(2.9 ± 0.3) × 10−50.930.045–1.0
Cu2+
ElectrodeSensitivity [A·L·mg−1]R2 (n = 5)Linear Range [mg·L−1]
Bare(9.7 ± 0.9) × 10−50.950.057–1.1
Hg-NPsRoute A(1.29 ± 0.02) × 10−40.9990.057–1.1
Hg-NPsRoute B(7 ± 1) × 10−60.900.11–1.1
Hg-NPsRoute B/PDDA(3.6 ± 0.6) × 10−50.900.11–1.1
Table 2. The sensitivity, linear response range and DL of each metal cation simultaneously measured by SWASV with the Hg-NPsRoute A sensor.
MetalSensitivity [A·L·mg−1]R2Linear Range [mg·L−1]DL [mg·L−1]
Cd2+(8.4 ± 0.6) × 10−40.99 (n = 4)0.0050–0.300.0015
Pb2+(8 ± 1) × 10−40.95 (n = 4)0.046–0.370.02
Cu2+(2.1 ± 0.3) × 10−40.95 (n = 4)0.086–0.570.057
Table 3. Reproducibility and repeatability of multiparametric detection of metal cation detected by the Hg-NPsRoute A sensor. The experimental error of these measurements is calculated as the standard deviation for their respective n.
MetalReproducibility [A·L·mg−1] (n = 3)Repeatability
[A·L·mg−1] (n = 2)
Cd2+(5 ± 1) × 10−4(4 ± 1) × 10−4
Pb2+(6 ± 1) × 10−4(4 ± 1) × 10−4
Cu2+(2 ± 1) × 10−4(8 ± 1) × 10−5
Table 4. Results of the standard addition of the sample, comparison with a reference method (ICP-MS) and the recovery values. The recovery values were calculated from the quotient between the result of our sensor and the ICP-MS result.
MetalHg-NPsRoute A Electrode [mg·L−1]ICP-MS [mg·L−1]Recovery (%)
Cd2+2.061.9108%
Pb2+1.511.694%
Cu2+1.561.5104%
Publisher’s Note: MDPI stays neutral with regard to jurisdictional claims in published maps and institutional affiliations.

