Abstract
This work describes the complete elaboration of an immunosensor for the detection of the fungal B1 aflatoxin (AFB1). In a first step, a system made of three screen-printed electrodes (SPEs) was manufactured using gold, silver/silver chloride, and carbon pastes. Raman spectroscopy showed that the thermal treatment applied to the electrodes enabled a strong decrease in the amount of undesirable organic molecules for each paste. Atomic Force Microscopy was also used to reveal the morphology of the electrode surfaces. In a second step, an autonomous and cheap electronic system was designed for the control of the sensor and electrochemical measurements, showing current variations significantly higher than those observed with a commercial system. In a last step, the gold working electrode of this system was functionalized by a simple self-assembly method, optimized in a previous work, with a molecular architecture including an antibody recognizing specifically AFB1. The complete device was finally realized by combining the SPEs and the electronic platform. The resulting setup was able to detect AFB1 toxin in a buffer with an LOD of about 50 fg/mL. It was then applied to the detection of AFB1 in rice milk, a more realistic medium comparable with those met in an agrifood context. The electrochemical detection of AFB1 was possible in a range of concentration between 0.5 pg/mL and 2.5 pg/mL, with the sensor behaving linearly in this range.
1. Introduction
Over the past three decades, many electrochemical sensors have been developed for the sensing, the identification, and the monitoring of different biological objects ranging from molecules to microorganisms [1,2,3,4,5,6,7,8].
Traditional electrochemical cells are bulky and expensive and require real known-how to be handled. Moreover, some of them include films or drop electrodes made of mercury, a highly toxic metal, which necessitates laborious cleaning processes. The limitations imply both to consider other materials and to miniaturize the whole system to obtain an easy-to-use microsensor [9,10]. This miniaturized laboratory approach combined to “in-the-field” experiments [9] also reduces sample volumes and costs [9,10] and makes multidetection possible [11]. Miniaturized set-ups include lab-on-chip and point-of-care devices [7,12], which are successfully applied to the detection of multiple biomarkers. They are often based on measurements using single strip three-electrode systems, ultramicroelectrodes, electrode arrays, ring and paper-based electrodes [13,14], printed batch injection analysis cells [15], and multiple-label or multielectrode approaches [16]. Thus, a large number of platforms and devices have been recently commercialized in the context of various environmental, agricultural, food, pharmaceutical, or biomedical challenges [17,18,19,20].
These notable developments call on complementary disciplines such as biophysics, chemistry, microelectromechanical systems (MEMS) modeling, signal processing, and machine learning [21]. Revolutionary technological advances in microfabrication techniques were also necessary: printing circuits [22,23], photolithography [24,25,26], 3D printing [27], chemical or physical vapor deposition, electron beam technology, and screen printing [28,29,30]. These methods allow a good reproducibility of electrode shapes and sizes [31] and can be easily coupled to microfluidic systems [32,33]. The screen printing method is one of the most efficient techniques for the manufacturing of sensors, producing films of different compositions, and geometries and thicknesses on rigid or flexible substrates [11,34,35] depending on the final application. In the context of electrochemical sensors, the combination of a wide range of materials and alloys, such as nanomaterials, synthetized organic compounds, and new polymers, favored the emergence of new electroactive surfaces [18,36,37,38]. Simultaneously, the development of microcomputers and electronic platforms made possible the development of portable analyzers [39].
The food industry is a major domain of applications, where it is essential to be able to detect and to quantify the presence of pathogenic microorganism species or toxins [40,41,42]. In this context, aflatoxins (AF) are metabolites produced by filamentous fungi such as Aspergillus flavus and Aspergillus parasiticus, commonly found as contaminants in a large variety of daily life products, such as peanuts and maize [43]. This group of 18 structurally related compounds causes both acute and chronic adverse effects on human health [44,45]. In this group, AFB1 and AFB2 are the most commonly encountered in food. In this work, we are interested in AFB1, which is regarded as the most harmful AF since it is classified as a carcinogen molecule of group 1 by the International Cancer Research Institute [46,47,48]. In particular, its detection in the body is strongly linked to the development of hepatocellular carcinoma.
It is thus essential to detect this toxin in food products. However, conventional methods such as liquid chromatography/mass spectrometry (LC–MS) and enzyme-linked immunosorbent assay (ELISA) require a high level of expertise. They are also expensive, laborious, and time-consuming [49,50]. This explains why more appropriate approaches, such as biosensing, have been developed for many years. In this context, we have previously shown the advantages and performances of a homemade sensor based on screen-printed electrodes (SPEs), where one of them was functionalized by an antibody recognizing AFB1 [51]. In this work, the main challenge was to build a molecular architecture on the electrode’s surface (i) to preserve the antibody structure and its capability to recognize the toxin and to be (ii) compatible with the toxin’s quantification by electrochemical measurements. Three different protocols were studied. They were all based on the self-assembly technique and the use of a biotinylated anti-AFB1 antibody grafted on the electrode through a biotin–streptavidin complex. One of these protocols was finally chosen, combining simplicity and reproducibility in terms of electrode’s functionalization and detection/quantification of the toxin.
We present here a complementary work dealing with the different fabrication steps of the entire electrochemical platform, from SPEs to the electronic system necessary for the electrochemical quantification of AFB1. We describe first the design of SPEs, their composition, and the deposition process, this process being morphologically and chemically characterized by Atomic Force Microscopy (AFM) and Raman spectroscopy. The electronic system of the biosensor and the assessment of the electrochemical performances of the whole platform are then reported. Finally, the entire setup is evaluated for AFB1 detection and more specifically in a complex medium. Our data show that our homemade device is efficient for AFB1 detection in buffer, with, in particular, a low limit of detection as compared to other biosensors already described. It is also able to detect AFB1 under more realistic conditions potentially met in an agrifood context.
2. Materials and Methods
2.1. Chemicals
Gold, silver/silver chloride (Ag/AgCl), and carbon pastes (references 8836, 1902, and RS12111, respectively) were purchased from E.S.L. ElectroScience (King of Prussia, PA, USA). Alumina sheets (Al2O3 96%, dimensions 48.6 mm × 47.4 mm × 0.5 mm) were purchased from ELMITECH (Rungis, France). Tris buffer saline (TBS, 20 mM Tris, 0.9% NaCl, pH approximately 7.4), AFB1 from Aspergillus flavus, potassium hexacyanoferrate III (K3Fe(CN)6), potassium hexacyanoferrate II trihydrate (K4Fe(CN)6.3H2O), streptavidin (SA) from Streptomyces avidinii, and bovine serum albumin (BSA) were purchased from Sigma-Aldrich (Saint-Quentin-Fallavier, France).
2.2. Materials
A screen printer from AUREL SPA (Modigliana, Italy) was used for screen printing. Before their functionalization, electrodes were stored protected from dust and kept at a constant temperature of 20 °C. Functionalized ones were kept in a TBS solution including KCl (2 mM) and used rapidly. NI-USB 6009 data acquisition card (DAQ) and TL081 and TL084 operational amplifiers (AO) used for the conception of our homemade electronic system were purchased from National Instruments France (Colombes, France) and RS Components SAS (Beauvais, France), respectively. Two commercial electrochemical sensor platforms (Mini PSAT 910 from MetrOhm, Villebon-sur-Yvette, France; reference KS510 from Kanichi, Warrington, UK) were used for comparison.
2.3. Methods
AFM measurements were carried out with a Bioscope II setup (Veeco-Bruker, Santa Barbara, CA, USA) equipped with an IX71 Olympus inverted optical microscope coupled to a Nanoscope V controller. Images were obtained in tapping mode, using silicon cantilevers with a spring constant around 40 N/m and NCLV tips from Bruker, at a resolution of 512 × 512 pixels and with a scan rate between 0.5 and 1.0 Hz. Data presented below are typical from measurements obtained with 12 samples (6 samples before cleaning and 6 samples after treatment). It is noteworthy that before fritting, imaging was impossible since the pastes were viscous with a thick texture.
Raman spectra were obtained with a DXR setup from Thermo Scientific (Illkirch-Graffenstaden, France), running with the Omnic 8.2 software. Spectra were recorded between 3500 and 100 cm−1 using a laser diode emitting at a wavelength of 790 nm, focused on the sample by a ×50 objective. Raman spectra shown below were typically obtained from the addition of 10 spectra (a few seconds each).
Electrochemical measurements were achieved using the PalmSens 4 potentiostat from PalmSens (Houten, The Netherlands). Cyclic voltammetry scans were obtained in the presence of the K4[Fe(CN)6]3−/K3[Fe(CN)6]4− redox couple (10 mM in TBS), used as electrochemical probe for signal amplification, at a scan rate of 100 mV/s. The potential interval was adapted to the redox couple, from −0.4 V to +0.6 V. Measurements were performed using our sensors and screen-printed sensors purchased from MetrOhm (Villebon-sur-Yvette, France). Electrodes were similar to ours for an easy comparison.
3. Results
3.1. Design and Printing Process of Electrodes and Chemical and Morphological Analysis
3.1.1. Design and Printing Process of Electrodes
The first step of SPE design was to define the most convenient geometry for further amperometric measurements. We used the Inkscape software (version 0.92.1) using scalable vector graphics (SVG) image coding.
As shown in Figure 1a, the working electrode has the geometry of a microdisk, similar to a previous system developed in the same context [52], characterized by a radius r () and a thickness z. Thus, it can diffuse current only in both (Or) and (Oz) directions, depending on the ohmic drop of the whole sensor and the response time of the electron transfer between all the electrodes [53,54]. The diffusion equation with time t of this geometry is as follows:
where C is the concentration (mol·cm−3) of the electroactive species in contact with the electrode, r (cm) is the distance from the center O of the disk, and D is the diffusion coefficient (cm2·s−1) of the electroactive species.
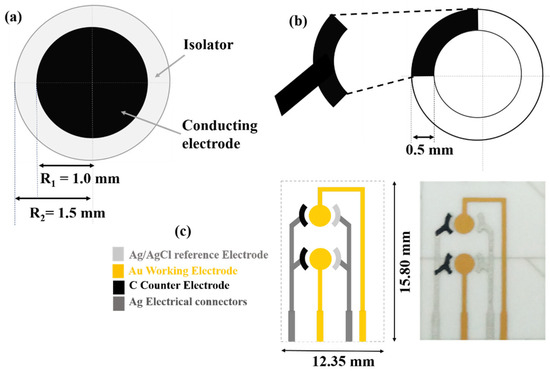
Figure 1.
Geometries of (a) the working electrode (gold) and (b) the reference (Ag/AgCl) and counter (carbon) ones for the electrochemical homemade sensor. (c) Scheme and dimensions of the microelectrochemical chip and image of the manufactured microsensor.
The shape of the reference and counter electrodes (Figure 1b) is a quarter of ring, with R1 and R2 as internal and external radii, respectively. This architecture makes it possible to quickly reach the electrochemical stabilization state. In such conditions, the current can be described by the following equation:
where n is the mol number of electrons exchanged in the electrochemical reaction, and F is the Faraday constant (96,485 C·mol−1).
Concerning the counter electrode, its surface must be larger than the surface of the reference one in order to minimize the current density at the level of this electrode. Therefore, we chose to double the surface of the counter electrode as compared to the reference one.
Microelectrodes were also integrated on the same chip to minimize the hysteresis (signal/noise) in the electrochemical system. This consequently made it possible to increase the sensitivity of the sensor and to lower its detection limit. Such systems have also other advantages over macro and conventional systems, such as an increased mass transport, a faster response time, and a decreased resistance of the solution. In addition, multi-integrated microelectrodes have the ability to increase the current transfer over individual ones while respecting the mass diffusion and the ohmic drop [55,56,57]. Based on these characteristics, we modeled our matrix of microsensors combining two active surfaces, which share the same counter and reference electrodes (Figure 1c).
Regarding the chemical composition of the electrode, gold was chosen for the working one since it keeps a high capacity to conduct current, even when self-assembled layers are added [18,20]. For the reference electrode, we chose a Ag/AgCl paste rather than applying a chlorination process on a silver ink [7,28], which could be responsible for a lack of stability or reproducibility (data not shown). Finally, we chose a carbon ink for the counter electrode as it is inert, not corrosive, cheap, and ecofriendly compared to the mercury bulky electrodes [19,20]. However, instead of applying carbon directly on the substrate’s surface, we first deposited a layer of silver. This layer promotes the charge transfer and ensures the connection with the electronic system, since carbon has a strong ohmic resistivity. Figure 1c shows the scheme of the whole microelectrochemical chip.
Finally, we used a fabrication process detailed elsewhere [9,29,38] and briefly described here, consisting of the successive deposition of pastes. The first step consisted of printing the electrode’s masks and then insulating them on stainless steel screens using negative photo emulsion sheets. The second step was the printing process itself, based on the deposition and spreading of pastes. This process was achieved using a squeegee moving across the screen stencil under an adapted pressure in order to apply pastes homogenously without breaking the metallic mesh. Between two consecutive deposition steps, a thermal treatment was applied to the last deposited paste. This treatment improved spreading and adhesion, prevented the paste from overflowing and finally solidified it. This fritting step is also essential to evaporate unwanted polymeric binders and other additives. The applied temperatures were as follows:
- The first paste (gold one) required the most elevated temperature, above 800 °C, for 30 min, followed by a slower cooling for 150 min until ambient temperature;
- The second paste (Ag/AgCl one) was heated at 150 °C for 15 min, the thermal treatment being followed by a slow cooling for 120 min;
- The third and last one (carbon paste) was heated at 200 °C for 120 min, also followed by a cooling phase until ambient temperature.
The final manufactured product is presented in Figure 1c. Interferometric measurements [57] gave a typical thickness around 17 µm for carbon and gold electrodes and 10 µm for the Ag/AgCl one, indicating an efficient deposition protocol and homogenous layers.
3.1.2. Chemical and Morphological Analysis
Pastes contain polymer binders and solvents that could interfere with the chemicals used to functionalize electrodes or those involved in the detection itself. Their composition (given by the manufacturer) is described in Table 1.

Table 1.
Chemical composition of pastes used for electrodes (data from manufacturers).
Therefore, electrodes must be free of such interfering compounds. Their elimination after heating can be assessed by comparing Raman spectra of pastes before and after the thermal treatment (Figure 2):
- Gold paste (Figure 2a): Before heating, the Raman spectrum reveals the presence of different bands at 2960 cm−1 and in the 1500–900 cm−1 range, which could be assigned, at least partly, to terpineol, an aromatic molecule present in the paste. On the whole, these bands disappear after heating, being replaced by a broad band centered at 1250–1000 cm−1 and another one at 615 cm−1 that could be due to unidentified products coming from terpineol degradation [58];
- Ag/AgCl paste (Figure 2b): Before heating, bands in a spectral range compatible with the presence of organic molecules are observed. In particular, the paste contains butyl di-glycol acetate rich in methylene groups that could be responsible for bands at 2930 cm−1, 1450 cm−1, and 1304 cm−1. Skeletal C–C vibrations could give the band at 1120 cm−1. After heating, bands are still observed but clearly reduced in intensity, suggesting a thermally induced degradation [59];
- Carbon paste (Figure 2c): Before heating, the Raman spectrum shows the presence of two main bands at 1600 cm−1 and 1300 cm−1, assigned to the presence of carbon [60], still observed (but with a lower resolution) after heating. The disappearance of other bands previously observed in the 900–500 cm−1 spectral range is probably a sign of degradation of impurities [61].
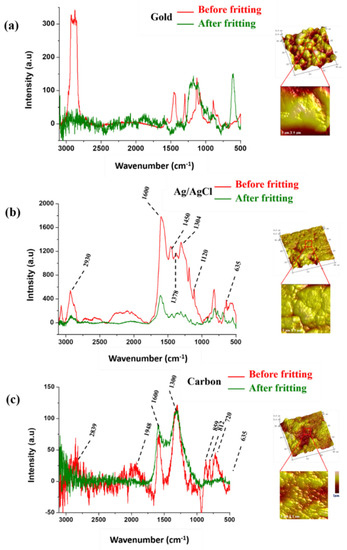
Figure 2.
Raman spectra of pastes used for electrodes before and after fritting: (a) gold paste; (b) Ag/AgCl one; (c) carbon one. Corresponding 3D height AFM images (30 µm × 30 µm) and zoomed images (5 µm × 5 µm) of the gold, Ag/AgCl, and carbon electrodes after fritting (height scale of 1 µm indicated in (c)).
A complementary morphological characterization of the electrode’s surface after heating was carried out using AFM. Figure 2 shows typical images differing according to the nature of electrodes.
- Gold electrode (Figure 2a): The surface is characterized by the presence of aggregates imperfectly merged and a rather large roughness reaching the µm range;
- Ag/AgCl electrode (Figure 2b): The surface is more homogenous than in the previous case, with a reduced roughness estimated at 400 nm in larger images. The zoomed images reveal the presence of small and merged aggregates homogenously distributed;
- Carbon electrode (Figure 2c): Here also images show a grainy structure covering homogenously the surface, similar to the structures observed with glassy carbon substrates [62].
3.2. Design and Assembly of the Homemade Potentiostat
Cyclic voltammetry (CV) and chronoamperometry (CA) were then implemented in our biosensor. In both techniques, a potential is applied between the reference and working electrodes. The resulting current describes qualitatively and quantitatively the electronic behavior of the microchip and the electron transfer due to the biochemical reaction at the surface of the working electrode. The reference electrode must be protected from external noises or chemical reactions, which could modify the surface properties. In addition, a stable potential must be maintained, while the current value must be null. Consequently, a regulation system was added in order to maintain the suitable current distribution all over the system. The overall principle of the electrochemical platform is presented in Figure 3.
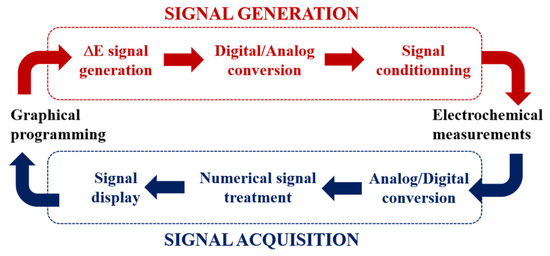
Figure 3.
Overall principle of the homemade electrochemical platform composition.
Like other electronic systems, our homemade potentiostat also includes hardware and software parts:
- The hardware part includes two blocks. Firstly, a NI-USB 6009 platform is used specifically as an interface between the sensor and the computing interface. Secondly, a conditioning card, designed in collaboration with the Electronic Department of LOMA, is used to regulate the signal of the reference electrode and the Input/Output (I/O) signals. Details concerning the card are provided below;
- The software controls the generation and the acquisition of the I/O signals. It is developed using the graphical language LabVIEW, also used for the signal treatment, by integrating and applying numerical filters and amplifiers. The diagrams in Figure 4 illustrate the different steps followed for the potential application in CV and CA measurements. Simplified and numerical equations of Nernst are integrated in LabVIEW for this purpose.
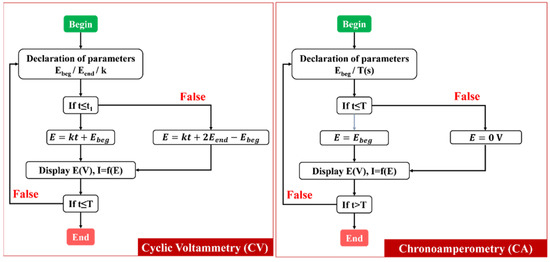 Figure 4. CV and CA processes developed with LabVIEW.
The process is described below in the case of CV measurements. To ensure the generation of a potential alternating between given negative and positive values, we used the differential mode where the output potential E applied on the electrodes is defined as follows:
In this equation, AO0 and AO1 are the analog outputs of the NI-USB 6009 DAQ.
The CV program contains a “for loop” block, necessary to control the workflow statement and to execute the number of cycles required for measurements. Three “while loop” blocks are incorporated in the main loop in order to define the functions applied to the sensor:
- The first block is used to generate a triangular signal between two extreme potential values Ebeg and Eend corresponding to the DAQ outputs AO0 and AO1, respectively. Potential varying linearly and with a triangular shape between these two values it comes:
- The second block corresponds to the response time or the delay necessary to leave the biochemical process taking place on the active surface;
- The third block uses the “DAQ assistant” to acquire the specific signals (current and voltage) to help save data and displaying the required CV waveform. We integrated a “Savitsky–Golay” filter modulus in order to numerically smooth the signal and to disable the noise-to-signal ratio without losing the initial data.
The conditioning card previously mentioned is described in Figure 5. The potential being generated in a differential mode, an AO (TL084) amplifier, referred to the ground, is set to measure this difference. Once the required potential is obtained, a common follower AO (TL081), connected to the reference electrode, maintains a negligible current during measurements in order to keep null the current passing through the reference electrode. The first stage is also connected to a second inverter amplifier, so that the measured potential is calculated as follows:
where Vground is the mass potential, and Vref is the potential passing through the reference electrode.
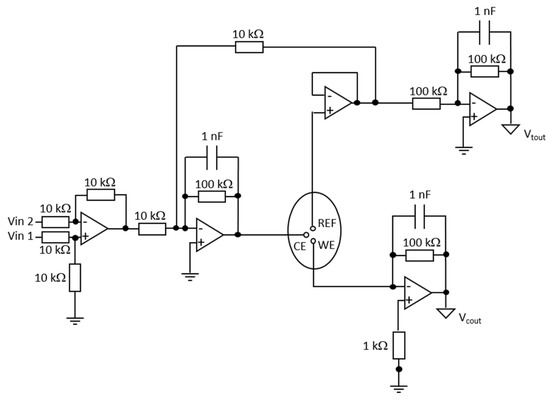
Figure 5.
Schematic organization of components of the conditioning card.
Concerning the amplifier in association with the counter electrode, its fundamental role is to impose a differential fixed and adjustable potential between the working and the counter electrodes. This helps to maintain an electrical equilibrium all over the sensor and to protect it against an over potential. The last amplifier, a current-to-voltage converter, is connected to the working electrode (NI-USB 6009 DAQ being unable to acquire current data).
Validation of the electronic system was finally carried out using the dummy cell circuitry commercialized with the PalmSens potentiostat. As shown in Figure 6, the application of a linear potential between −0.4 V and +0.6 V reveals a linear and reversible current behavior. The application of Ohm’s law makes it possible to obtain a resistance of 10 kΩ, corresponding to the value of the manufacturer and confirming the calibration of our system.
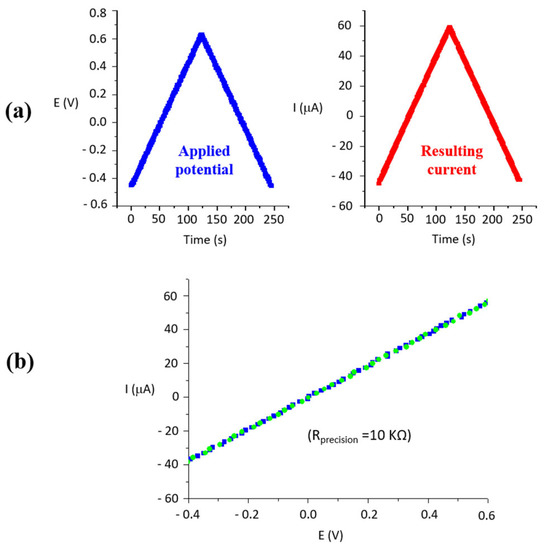
Figure 6.
Test of our electronic system using a calibrated resistance of 10 kΩ. (a) Triangular E(t) applied potential and resulting I(t) current using the dummy cell; (b) Linear I = f(E) relationship in agreement with the Ohm’s law and the value of the resistance.
3.3. Electrochemical Interrogation of the Platform Performance
The first validation of our homemade electrochemical platform was carried out by comparing its voltammetric response to the response of a commercial SPE system. As shown in Figure 7a, both responses have the typical “duck” shape with two extrema characterized each by potential and current values (Epa, Ipa) and (Epc, Ipc) for oxidation and reduction, respectively. In addition, the electrochemical response of the homemade sensor stabilizes rapidly when applying potential current cycles (Figure 7b).
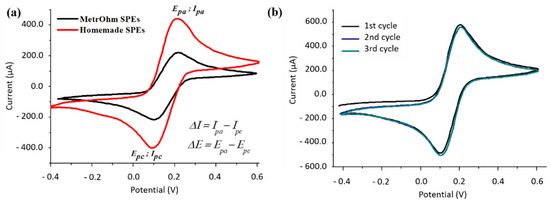
Figure 7.
(a) CV diagrams of homemade and commercial microsensors; (b) 3 consecutive CV curves recorded during the stabilization of the sensor response; measurements were made in the [−0.4 V; +0.6 V] range at a scan rate of 100 mV/s and using a solution of 10 mM of Fe3+/Fe2+ redox couple in TBS.
The peak-to-peak separations ΔE = Epa − Epc are similar in both cases, estimated to 104 ± 6 mV and 102 ± 16 mV in the case of the commercial system and the homemade sensor, respectively, (average of three independent measurements). Both values are clearly above the theoretical value of 57 mV at 25 °C expected in the case of chemically and electrochemically stable reactions. The larger value of ΔE suggests that, in both cases, electron transfer reactions are slower than those theoretically expected, due to a higher barrier of charge transfer [7,53].
If ΔE values are similar, the amplitude of the current variation ΔI = Ipa − Ipc is, however, significantly higher in the case of the homemade sensor. In order to better understand this higher amplitude, we determined the electroactive areas AR − S of the working electrodes from CV diagrams shown in Figure 7, using the Randles–Sevčik equation:
where Ip is the extremal current, n is the number of electrons involved in the redox reaction, D is the coefficient of diffusion of electroactive species, C is the concentration of the redox probe, and ν is the scan rate. It is then possible to determine electroactive areas AR−S from voltammetric responses and to compare them to the geometric areas Ageo of the electrodes determined from their dimensions [63,64]. The higher AR−S/Ageo ratio is displayed by our homemade microsensor: the electroactive area corresponds to 87% of the geometric surface, whereas it is in the range of 8–70% for commercial systems. This is likely due to the high ΔI values obtained with our sensor.
Another crucial point is the scan rate. Figure 8 shows CV diagrams obtained with the homemade and the commercial sensors at scan rates ranging from 20 to 100 mV/s. For both sensors, Ipa and Ipc currents increase linearly with the square root of the scan rate, in agreement with the Randles–Sevčik equation (Equation 7), showing that redox species are diffusing freely. However, our homemade sensor is characterized by a higher slope (~18 µA/(V/s)1/2) than the commercial one (~3 µA/(V/s)1/2) (Figure 8c). Faster scan rates decrease the size of the diffusion layer (area close to the electrode where concentrations of species are different from their bulk concentration [63,65]), the electrochemical system becomes more reversible, and the current increases [65]. This suggests that the diffusion layer is thinner in our homemade sensor. Varying the scan rate has also an effect on the ΔE peak-to-peak separation (Figure 8d). In both cases, a decrease in the ΔE value is on the whole observed at increasing square root of the scan rate. However, the homemade sensor reaches, at a scan rate of 20 mV/s, a value of 58 mV, thus approaching the theoretical value of 57 mV mentioned above, contrary to the commercial one. Consequently, our sensor reaches almost the perfect electrochemical reversibility at 20 mV/s. However, it is not possible to use this value during measurements since it does not make it possible to rapidly obtain a stable response from the sensor (data not shown).
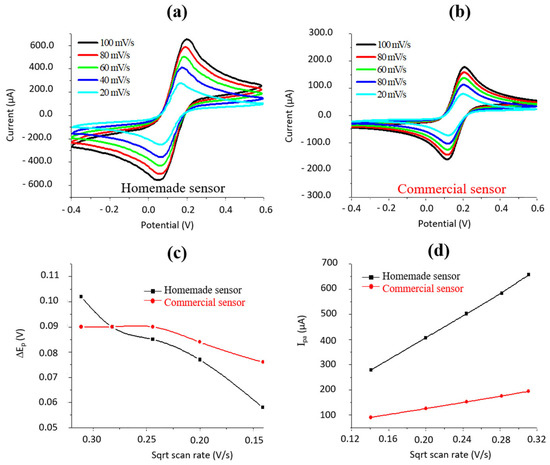
Figure 8.
(a,b) Typical CV diagrams (using the Fe3+/Fe2+ redox couple) as a function of the scan rate for (a) the homemade sensor and (b) the commercial one; (c) oxidation current; and (d) ΔEp value versus the square root of the scan rate for both sensors.
3.4. Application of the Homemade Sensor to the Detection of the AFB1 Fungal Toxin
We first applied to the homemade sensor different concentrations of the Fe3+/Fe2+ redox couple in the absence of functionalization on the working electrode. Three concentrations ranging from 1 mM to 10 mM were studied at a scan rate of 100 mV/s: the amplitude of the CV diagrams decreases proportionally to the concentration of the probe (data not shown), in agreement with the Randles–Sevčik equation (Equation (7)).
The second logical step consisted of the specific detection and quantification of AFB1, by the functionalized working electrode. As mentioned in the introduction, three different functionalization protocols were compared; all were based on the self-assembly technique (chosen for its simplicity) and included a biotinylated antibody recognizing AFB1. The most relevant in terms of reproducibility and efficiency consisted of the direct adsorption of the streptavidin–biotin couple on the gold surface previously cleaned, followed by the immobilization of the biotinylated antibody as show schematically in the Figure 9a [51]. Changes in CV diagrams at each step confirm the functionalization (Figure 9b): Adding SA at the surface of the electrode decreases the current’s peak intensity by forming a layer limiting the access of the electrolyte to the surface. The following functionalization by biotin and antibody slightly modify the molecular architecture in terms of organization/orientation leading here to a better access of the electrolyte. A last step consists of the adsorption of BSA to block unbound sites, limiting once more the access to the surface.
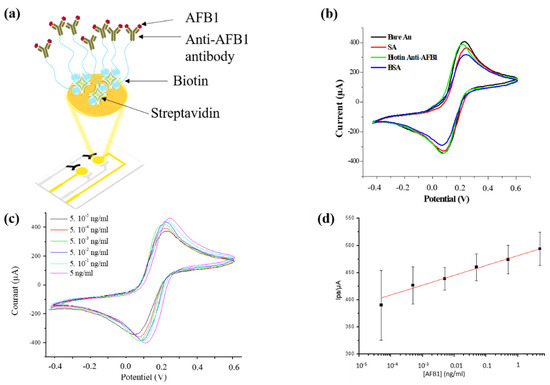
Figure 9.
(a) Best functionalization protocol of the working electrode; (b) CV diagrams at each functionalization step (using the Fe3+/Fe2+ redox couple and a scan rate of 100 mV/s); (c) CV diagrams, with the same redox couple, obtained at increasing AFB1 concentrations within a concentration range between 50 fg/mL and 5 ng/mL (scan rate of 100 mV/s); (d) Linear response of the sensor in terms of Ipa values in this range of concentrations [51].
Such an architecture was able to detect and to quantify the presence of AFB1 injected through a hydrostatic system. The results shown in Figure 9c,d were obtained with an incubation time of 30 min. The successive increase of AFB1 concentration induces an increase in the oxidation current and the absolute value of the reduction one. Such variations are likely due to the direct toxin–antibody interaction, changing the organization of the molecular architecture at the electrode’s surface. Figure 9d also shows a linear relationship between the oxidation current and the AFB1 concentration in a range between 50 fg/mL and 10 ng/mL in chloroform. The limit of detection and the sensitivity are estimated to 50 fg/mL and 18 µA/(ng·mL−1), respectively [51].
Finally, AFB1 was detected in more realistic samples: rice milk samples were centrifuged (5000 rpm, 10 min, 22 °C). AFB1 was then injected in the liquid part resulting from the centrifugation and diluted using the liquid phase obtained from the centrifugation of an untreated milk sample. The electrochemical detection of AFB1 was possible in a range of concentration between 0.5 pg/mL and 2.5 pg/mL, with the sensor behaving linearly in this range.
4. Discussion
The aim of this work was to elaborate on a complete electrochemical immunosensor, including the electronic platform, for the detection of the fungal B1 aflatoxin (AFB1). The first part of this work was devoted to the design of a system made of three SPEs. The choice of their geometry and their composition was based on required electric properties and manufacturing ease. Since the pastes contain molecules, which could interfere with the detection, the electrodes were heated. The amount of undesirable organic molecules clearly decreased significantly for each paste as shown by Raman spectroscopy. AFM was also used to reveal the morphology of the electrode surfaces, which were all rough, with roughness dimensions depending on the nature of the electrode. In the case of the Ag/AgCl electrode, the low roughness suggests an overall homogenous surface. This point is important since it has been shown that the less porous the surface, the greater and more stable the charge transfer [66,67].
The next step of the work consisted of the design of an autonomous and cheap electronic system for the control of the sensor and electrochemical measurements. This system was first validated by the application of a potential in a range adapted to the redox couple used later for the electrochemical detection. Measurements showed a linear and reversible current behavior, in agreement with the Ohm’s law.
Our homemade system was also compared to a commercial one, showing current variations significantly higher likely due to a higher AR−S/Ageom ratio. This is clearly an advantage for further detections. Moreover, a comparison of CV diagrams suggested that the diffusion layer is thinner in our homemade sensor, which consequently reaches equilibrium faster than the commercial one. Finally, the homemade sensor was able to reach almost the perfect electrochemical reversibility at a scan rate of 0.02 V/s, contrary to the commercial system. Unfortunately, this scan rate did not ultimately make it possible to rapidly obtain a stable response from the sensor. In conclusion, our homemade sensor is competitive with the commercial one being characterized by an amplified response, which may lead to an ultrasensitive response during toxin detection.
The last step was the detection of the AFB1 toxin. The gold electrode was functionalized by a molecular architecture previously described and including an antibody recognizing specifically the toxin. The limit of detection and the sensitivity were estimated to 50 fg/mL and 18 µA/ng.mL−1, respectively, ranking our homemade sensor among the best sensors already developed for the detection of this toxin [51,68,69,70,71]. However, the real efficiency test consisted of detecting AFB1 in a complex medium. AFB1 was injected at different concentrations in rice milk and detected in the liquid phase obtained after centrifugation of these solutions and dilutions. The test was clearly positive: the electrochemical detection of AFB1 was possible at low concentration of the toxin, the sensor behaving linearly in a range of concentration between 0.5 pg/mL and 2.5 pg/mL.
5. Conclusions
In this work, we describe the complete elaboration of an electrochemical immunosensor for the detection of a fungal toxin. The first step consisted in manufacturing appropriate electrodes. We developed and characterized a system made of SPEs connected, in a second step, to a homemade electronic system. The performance of the whole platform was then analyzed and compared to a commercial one. Our approach highlighted the importance of each step of the process that can affect the reliability of the final sensor. Finally, after a simple but efficient functionalization of the working electrode, our setup allowed us to detect the toxin in a complex medium, showing the pertinence of the whole process and the possibility to apply this sensor in an agrifood context. Such a system has different advantages: the simple method used to functionalize the working electrode can be simply adapted for the detection of other toxins or biological molecules. The sensor is also rather cheap taking into account the possibility of printing a high number of electrodes at the same time and the low number of molecules required for the functionalization. In an ecological approach, an improvement of the sensor could now be to reuse the active surface, either by gently removing AF from the functionalized surface or removing the entire molecular architecture without destroying electrodes.
Author Contributions
Conceptualization, H.S. and T.C.-B.; methodology, I.G. and T.C.-B.; software, Z.B.A., H.S. and S.C.; validation, I.G., L.B., C.G.-H. and T.C.-B.; formal analysis, Z.B.A.; investigation, Z.B.A., F.M., S.C. and L.R.; writing—original draft preparation, C.G.-H.; writing—review and editing, L.B., C.G.-H. and T.C.-B.; supervision, H.S. and T.C.-B.; funding acquisition, T.C.-B. All authors have read and agreed to the published version of the manuscript.
Funding
This research was funded by LOMA and its technology transfer center Nanophynov.
Institutional Review Board Statement
Not applicable.
Informed Consent Statement
Not applicable.
Data Availability Statement
Not applicable here. Details on the detection of AFB1 can be found in [51].
Acknowledgments
Authors thank Ali Othmane and Hafedh Ben Ouada, both specialists of electrochemistry, from the Laboratory of Biophysics (Faculty of Medicine of Monastir, Tunisia) and the Laboratory of Physics and Chemistry of Interfaces (Faculty of Sciences of Monastir, Tunisia), respectively. They also thank Rodolphe Boisgard for helpful discussions and Jean-Michel Rampnoux for the interferometric measurements, both from LOMA (University of Bordeaux, France). They also thank Eddie Maillard (Mechanical Department of LOMA) for the manufacturing of mechanical pieces of the setup.
Conflicts of Interest
The authors declare no conflict of interest.
References
- Sohrabi, H.; Kordasht, H.K.; Pashazadeh-Panahi, P.; Nezhad-Mokhtari, P.; Hashemzaei, M.; Majidi, M.R.; Mosafer, J.; Oroojalian, F.; Mokhtarzadeh, A.; de la Guardia, M. Recent advances of electrochemical and optical biosensors for detection of C-reactive protein as a major inflammatory biomarker. Microchem. J. 2020, 158, 105287. [Google Scholar] [CrossRef]
- Jamei, H.R.; Rezaei, B.; Ensafi, A.A. Ultra-sensitive and selective electrochemical biosensor with aptamer recognition surface based on polymer quantum dots and C60/MWCNTs-polyethylenimine nanocomposites for analysis of thrombin protein. Bioelectrochemistry 2021, 138, 107701. [Google Scholar] [CrossRef] [PubMed]
- Cheng, A.K.; Sen, D.; Yu, H.-Z. Design and testing of aptamer-based electrochemical biosensors for proteins and small molecules. Bioelectrochemistry 2009, 77, 1–12. [Google Scholar] [CrossRef] [PubMed]
- Hassan, R.Y.; El-Attar, R.O.; Hassan, H.N.; Ahmed, M.A.; Khaled, E. Carbon nanotube-based electrochemical biosensors for determination of Candida albicans’s quorum sensing molecule. Sens. Actuators B Chem. 2017, 244, 565–570. [Google Scholar] [CrossRef]
- Adeel, M.; Rahman, M.; Caligiuri, I.; Canzonieri, V.; Rizzolio, F.; Daniele, S. Recent advances of electrochemical and optical enzyme-free glucose sensors operating at physiological conditions. Biosens. Bioelectron. 2020, 165, 112331. [Google Scholar] [CrossRef]
- Singh, A.P.; Balayan, S.; Hooda, V.; Sarin, R.; Chauhan, N. Nano-interface driven electrochemical sensor for pesticides detection based on the acetylcholinesterase enzyme inhibition. Int. J. Biol. Macromol. 2020, 164, 3943–3952. [Google Scholar] [CrossRef]
- Taleat, Z.; Khoshroo, A.; Mazloum-Ardakani, M. Screen-printed electrodes for biosensing: A review (2008–2013). Mikrochim. Acta 2014, 181, 865–891. [Google Scholar] [CrossRef]
- Seo, G.; Lee, G.; Kim, M.J.; Baek, S.-H.; Choi, M.; Ku, K.B.; Lee, C.-S.; Jun, S.; Park, D.; Kim, H.G.; et al. Rapid Detection of COVID-19 Causative Virus (SARS-CoV-2) in Human Nasopharyngeal Swab Specimens Using Field-Effect Transistor-Based Biosensor. ACS Nano 2020, 14, 5135–5142, Corrigendum in ACS Nano 2020, 14, 12257–12258. [Google Scholar] [CrossRef] [Green Version]
- Li, M.; Li, Y.-T.; Li, D.-W.; Long, Y.-T. Recent developments and applications of screen-printed electrodes in environmental assays—A review. Anal. Chim. Acta 2012, 734, 31–44. [Google Scholar] [CrossRef]
- Thiyagarajan, N.; Chang, J.-L.; Senthilkumar, K.; Zen, J.-M. Disposable electrochemical sensors: A mini review. Electrochem. Commun. 2014, 38, 86–90. [Google Scholar] [CrossRef]
- Cagnani, G.R.; Ibáñez-Redín, G.; Tirich, B.; Gonçalves, D.; Balogh, D.T.; Oliveira, O.N. Fully-printed electrochemical sensors made with flexible screen-printed electrodes modified by roll-to-roll slot-die coating. Biosens. Bioelectron. 2020, 165, 112428. [Google Scholar] [CrossRef] [PubMed]
- Agostini, M.; Amato, F.; Vieri, M.; Greco, G.; Tonazzini, I.; Baroncelli, L.; Caleo, M.; Vannini, E.; Santi, M.; Signore, G.; et al. Glial-fibrillary-acidic-protein (GFAP) biomarker detection in serum-matrix: Functionalization strategies and detection by an ultra-high-frequency surface-acoustic-wave (UHF-SAW) lab-on-chip. Biosens. Bioelectron. 2021, 172, 112774. [Google Scholar] [CrossRef] [PubMed]
- Liu, H.; Crooks, R.M. Paper-Based Electrochemical Sensing Platform with Integral Battery and Electrochromic Read-Out. Anal. Chem. 2012, 84, 2528–2532. [Google Scholar] [CrossRef] [PubMed]
- Kotru, S.; Klimuntowski, M.; Ridha, H.; Uddin, Z.; Askhar, A.A.; Singh, G.; Howlader, M.M. Electrochemical sensing: A prognostic tool in the fight against COVID-19. TrAC Trends Anal. Chem. 2021, 136, 116198. [Google Scholar] [CrossRef] [PubMed]
- Tormin, T.F.; Cunha, R.R.; da Silva, R.A.B.; Munoz, R.A.A.; Richter, E.M. Combination of screen-printed electrodes and batch injection analysis: A simple, robust, high-throughput, and portable electrochemical system. Sens. Actuators B Chem. 2014, 202, 93–98. [Google Scholar] [CrossRef]
- Pakchin, P.S.; Nakhjavani, S.A.; Saber, R.; Ghanbari, H.; Omidi, Y. Recent advances in simultaneous electrochemical multi-analyte sensing platforms. TrAC Trends Anal. Chem. 2017, 92, 32–41. [Google Scholar] [CrossRef]
- Chen, J.; Wen, J.; Zhuang, L.; Zhou, S. An enzyme-free catalytic DNA circuit for amplified detection of aflatoxin B1 using gold nanoparticles as colorimetric indicators. Nanoscale 2016, 8, 9791–9797. [Google Scholar] [CrossRef]
- Govindhan, M.; Liu, Z.; Chen, A. Design and Electrochemical Study of Platinum-Based Nanomaterials for Sensitive Detection of Nitric Oxide in Biomedical Applications. Nanomaterials 2016, 6, 211. [Google Scholar] [CrossRef] [Green Version]
- Li, J.; Liu, J.; Tan, G.; Jiang, J.; Peng, S.; Deng, M.; Qian, D.; Feng, Y.; Liu, Y. High-sensitivity paracetamol sensor based on Pd/graphene oxide nanocomposite as an enhanced electrochemical sensing platform. Biosens. Bioelectron. 2014, 54, 468–475. [Google Scholar] [CrossRef]
- Shinwari, M.W.; Zhitomirsky, D.; Deen, I.; Selvaganapathy, P.R.; Deen, M.J.; Landheer, D. Microfabricated Reference Electrodes and their Biosensing Applications. Sensors 2010, 10, 1679–1715. [Google Scholar] [CrossRef]
- Pal, A.; Biswas, S.; Kare, S.P.O.; Biswas, P.; Jana, S.K.; Das, S.; Chaudhury, K. Development of an impedimetric immunosensor for machine learning-based detection of endometriosis: A proof of concept. Sens. Actuators B Chem. 2021, 346, 130460. [Google Scholar] [CrossRef]
- Güth, F.; Arki, P.; Löher, T.; Ostmann, A.; Joseph, Y. Electrochemical Sensors Based on Printed Circuit Board Technologies. Procedia Eng. 2016, 168, 452–455. [Google Scholar] [CrossRef]
- Trachioti, M.G.; Prodromidis, M.I. Humidity impedimetric sensor based on vanadium pentoxide xerogel modified screen−printed graphite electrochemical cell. Talanta 2020, 216, 121003. [Google Scholar] [CrossRef] [PubMed]
- Tolouei, N.E.; Ghamari, S.; Shavezipur, M. Development of circuit models for electrochemical impedance spectroscopy (EIS) responses of interdigitated MEMS biochemical sensors. J. Electroanal. Chem. 2020, 878, 114598. [Google Scholar] [CrossRef]
- Ke, X. Micro-fabricated electrochemical chloride ion sensors: From the present to the future. Talanta 2020, 211, 120734. [Google Scholar] [CrossRef]
- Xi, S.; Shi, T.; Liu, D.; Xu, L.; Long, H.; Lai, W.; Tang, Z. Integration of carbon nanotubes to three-dimensional C-MEMS for glucose sensors. Sens. Actuators A Phys. 2013, 198, 15–20. [Google Scholar] [CrossRef]
- Cardoso, R.M.; Mendonça, D.M.; Silva, W.P.; Silva, M.N.; Nossol, E.; da Silva, R.A.; Richter, E.M.; Muñoz, R.A. 3D printing for electroanalysis: From multiuse electrochemical cells to sensors. Anal. Chim. Acta 2018, 1033, 49–57. [Google Scholar] [CrossRef]
- Honeychurch, K.C. Screen-printed Electrochemical Sensors and Biosensors for Monitoring Metal Pollutants. Insciences J. 2012, 2, 1–51. [Google Scholar] [CrossRef]
- Barton, J.; García, M.B.G.; Santos, D.H.; Fanjul-Bolado, P.; Ribotti, A.; McCaul, M.; Diamond, D.; Magni, P. Screen-printed electrodes for environmental monitoring of heavy metal ions: A review. Mikrochim. Acta 2016, 183, 503–517. [Google Scholar] [CrossRef]
- Hussain, N.; Pu, H.; Sun, D.-W. Core size optimized silver coated gold nanoparticles for rapid screening of tricyclazole and thiram residues in pear extracts using SERS. Food Chem. 2021, 350, 129025. [Google Scholar] [CrossRef]
- Martínez-Cisneros, C.S.; Ibáñez-García, N.; Valdés, A.F.; Alonso, J. Miniaturized Total Analysis Systems: Integration of Electronics and Fluidics Using Low-Temperature Co-Fired Ceramics. Anal. Chem. 2007, 79, 8376–8380. [Google Scholar] [CrossRef] [PubMed]
- Dempsey, E.; Diamond, D.; Smyth, M.R.; Urban, G.; Jobst, G.; Moser, I.; Verpoorte, E.M.; Manz, A.; Widmer, H.M.; Rabenstein, K.; et al. Design and development of a miniaturised total chemical analysis system for on-line lactate and glucose monitoring in biological samples. Anal. Chim. Acta 1997, 346, 341–349. [Google Scholar] [CrossRef]
- Schultze, J.; Tsakova, V. Electrochemical microsystem technologies: From fundamental research to technical systems. Electrochim. Acta 1999, 44, 3605–3627. [Google Scholar] [CrossRef]
- Molinero-Abad, B.; Izquierdo, D.; Perez, L.; Escudero, I.; Arcos-Martínez, J. Comparison of backing materials of screen printed electrochemical sensors for direct determination of the sub-nanomolar concentration of lead in seawater. Talanta 2018, 182, 549–557. [Google Scholar] [CrossRef]
- Zhang, D.; Pu, H.; Huang, L.; Sun, D.-W. Advances in flexible surface-enhanced Raman scattering (SERS) substrates for nondestructive food detection: Fundamentals and recent applications. Trends Food Sci. Technol. 2021, 109, 690–701. [Google Scholar] [CrossRef]
- Zhang, M.; Gorski, W. Electrochemical Sensing Platform Based on the Carbon Nanotubes/Redox Mediators-Biopolymer System. J. Am. Chem. Soc. 2005, 127, 2058–2059. [Google Scholar] [CrossRef]
- Baltzer, N.; Copponnex, T. Precious Metals for Biomedical Applications, 1st ed.; Woodhead Publishing: Sawston, UK, 2014. [Google Scholar]
- Li, J.-G.; Tsai, C.-Y.; Kuo, S.-W. Fabrication and Characterization of Inorganic Silver and Palladium Nanostructures within Hexagonal Cylindrical Channels of Mesoporous Carbon. Polymers 2014, 6, 1794–1809. [Google Scholar] [CrossRef] [Green Version]
- Castillo-León, J.; Svendsen, W.E. Lab-on-a-Chip Devices and Micro-Total Analysis Systems; Springer International Publishing: New York, NY, USA, 2015. [Google Scholar]
- Shah, A. A Novel Electrochemical Nanosensor for the Simultaneous Sensing of Two Toxic Food Dyes. ACS Omega 2020, 5, 6187–6193. [Google Scholar] [CrossRef]
- Wang, Q.; Yang, Q.; Wu, W. Graphene-Based Steganographic Aptasensor for Information Computing and Monitoring Toxins of Biofilm in Food. Front. Microbiol. 2020, 10, 3139. [Google Scholar] [CrossRef] [Green Version]
- Majdinasab, M.; Ben Aissa, S.; Marty, J.L. Advances in Colorimetric Strategies for Mycotoxins Detection: Toward Rapid Industrial Monitoring. Toxins 2020, 13, 13. [Google Scholar] [CrossRef]
- Lee, K.-M.; Herrman, T.J.; Bisrat, Y.; Murray, S.C. Feasibility of Surface-Enhanced Raman Spectroscopy for Rapid Detection of Aflatoxins in Maize. J. Agric. Food Chem. 2014, 62, 4466–4474. [Google Scholar] [CrossRef] [PubMed]
- Do, J.H.; Choi, D.-K. Aflatoxins: Detection, toxicity, and biosynthesis. Biotechnol. Bioprocess Eng. 2007, 12, 585–593. [Google Scholar] [CrossRef]
- Gacem, M.A.; El Hadj-Khelil, A.O. Toxicology, biosynthesis, bio-control of aflatoxin and new methods of detection. Asian Pac. J. Trop. Biomed. 2016, 6, 808–814. [Google Scholar] [CrossRef] [Green Version]
- Castillo, G.; Spinella, K.; Poturnayová, A.; Šnejdárková, M.; Mosiello, L.; Hianik, T. Detection of aflatoxin B1 by aptamer-based biosensor using PAMAM dendrimers as immobilization platform. Food Control 2015, 52, 9–18. [Google Scholar] [CrossRef]
- Muhammad, I.; Sun, X.; Wang, H.; Li, W.; Wang, X.; Cheng, P.; Li, S.; Zhang, X.; Hamid, S. Curcumin Successfully Inhibited the Computationally Identified CYP2A6 Enzyme-Mediated Bioactivation of Aflatoxin B1 in Arbor Acres broiler. Front. Pharmacol. 2017, 8, 143. [Google Scholar] [CrossRef] [Green Version]
- Jiao, T.; Ahmad, W.; Zhu, J.; Hassan, M.; Wang, J.; Rong, Y.; Guo, Z.; Li, H.; Ding, Z.; Lv, C.; et al. Aggregation triggered aflatoxin B1 determination in foodstuff employing 5-aminotetramethylrhodamine decorated gold–silver core–shell nanoparticles in surface enhanced Raman scattering. Sens. Actuators B Chem. 2021, 331, 129424. [Google Scholar] [CrossRef]
- Hua, Z.; Yu, T.; Liu, D.; Xianyu, Y. Recent advances in gold nanoparticles-based biosensors for food safety detection. Biosens. Bioelectron. 2021, 179, 113076. [Google Scholar] [CrossRef]
- AlFaris, N.A.; Altamimi, J.Z.; Alothman, Z.; Al Qahtani, S.F.; Wabaidur, S.M.; Ghfar, A.A.; Aldayel, T.S. Analysis of aflatoxins in foods retailed in Saudi Arabia using immunoaffinity column cleanup and high-performance liquid chromatography-fluorescence detection. J. King Saud Univ. Sci. 2019, 32, 1437–1443. [Google Scholar] [CrossRef]
- Ben Abdallah, Z.; Grauby-Heywang, C.; Beven, L.; Cassagnere, S.; Moroté, F.; Maillard, E.; Sghaier, H.; Cohen-Bouhacina, T. Development of an ultrasensitive label-free immunosensor for fungal aflatoxin B1 detection. Biochem. Eng. J. 2019, 150, 107262. [Google Scholar] [CrossRef]
- Castillo, G.; Poturnayova, A.; Šnejdárková, M.; Hianik, T.; Spinella, K.; Mosiello, L. Development of electrochemical aptasensor using dendrimers as an immobilization platform for detection of Aflatoxin B1 in food samples. In Proceedings of the 2015 XVIII AISEM Annual Conference, Trento, Italy, 3–5 February 2015; pp. 1–4. [Google Scholar] [CrossRef]
- Banks, C.E.; Foster, C.W.; Kadara, R.O. Screen-Printing Electrochemical Architectures; Springer International Publishing: New York, NY, USA, 2016. [Google Scholar]
- Moretto, L.M.; Kalcher, K. Environmental Analysis by Electrochemical Sensors and Biosensors: Fundamentals; Springer: New York, NY, USA, 2014; pp. 373–401. [Google Scholar]
- Morf, W.E.; de Rooij, N.F. Performance of amperometric sensors based on multiple microelectrode arrays. Sens. Actuators B Chem. 1997, 44, 538–541. [Google Scholar] [CrossRef]
- Yang, H.; Rahman, T.; Du, D.; Panat, R.; Lin, Y. 3-D printed adjustable microelectrode arrays for electrochemical sensing and biosensing. Sens. Actuators B Chem. 2016, 230, 600–606. [Google Scholar] [CrossRef] [PubMed] [Green Version]
- Harasaki, A.; Schmit, J.; Wyant, J.C. Improved vertical-scanning interferometry. Appl. Opt. 2000, 39, 2107–2115. [Google Scholar] [CrossRef] [PubMed] [Green Version]
- Laurent, G.; Félidj, N.; Grand, J.; Aubard, J.; Lévi, G.; Hohenau, A.; Aussenegg, F.R.; Krenn, J.R. Raman scattering images and spectra of gold ring arrays. Phys. Rev. B 2006, 73, 245417. [Google Scholar] [CrossRef]
- Martina, I.; Wiesinger, R.; Schreiner, M. Micro-Raman investigations of early stage silver corrosion products occurring in sulfur containing atmospheres. J. Raman Spectrosc. 2013, 44, 770–775. [Google Scholar] [CrossRef]
- Cinti, S.; Arduini, F.; Carbone, M.; Sansone, L.; Cacciotti, I.; Moscone, D.; Palleschi, G. Screen-Printed Electrodes Modified with Carbon Nanomaterials: A Comparison among Carbon Black, Carbon Nanotubes and Graphene. Electroanalysis 2015, 27, 2230–2238. [Google Scholar] [CrossRef]
- Steiner, H.; Eisenmenger-Sittner, C.; Schwarz, B. Temperature induced recrystallization of copper coatings deposited on adhesion promoting molybdenum interlayers. J. Phys. Conf. Ser. 2008, 100, 082032. [Google Scholar] [CrossRef]
- Huang, Z.; Liu, X.; Li, K.; Li, D.; Luo, Y.; Li, H.; Song, W.; Chen, L.; Meng, Q. Application of carbon materials as counter electrodes of dye-sensitized solar cells. Electrochem. Commun. 2007, 9, 596–598. [Google Scholar] [CrossRef]
- Elgrishi, N.; Rountree, K.; McCarthy, B.D.; Rountree, E.; Eisenhart, T.T.; Dempsey, J.L. A Practical Beginner’s Guide to Cyclic Voltammetry. J. Chem. Educ. 2018, 95, 197–206. [Google Scholar] [CrossRef]
- Kadara, R.O.; Jenkinson, N.; Banks, C.E. Characterisation of commercially available electrochemical sensing platforms. Sens. Actuators B Chem. 2009, 138, 556–562. [Google Scholar] [CrossRef]
- Gosser, D.K. Cyclic Voltammetry: Simulation and Analysis of Reaction Mechanisms; VCH Publishers: New York, NY, USA, 1994; pp. 105–117. [Google Scholar]
- Li, G.; Miao, P. Electrochemical Analysis of Proteins and Cells; Springer: Berlin/Heidelberg, Germany, 2013. [Google Scholar] [CrossRef]
- Arduini, F.; Micheli, L.; Moscone, D.; Palleschi, G.; Piermarini, S.; Ricci, F.; Volpe, G. Electrochemical biosensors based on nanomodified screen-printed electrodes: Recent applications in clinical analysis. TrAC Trends Anal. Chem. 2016, 79, 114–126. [Google Scholar] [CrossRef] [Green Version]
- Zhou, X.; Wu, S.; Liu, H.; Wu, X.; Zhang, Q. Nanomechanical label-free detection of aflatoxin B1 using a microcantilever. Sens. Actuators B Chem. 2016, 226, 24–29. [Google Scholar] [CrossRef]
- Li, A.; Tang, L.; Song, D.; Song, S.; Ma, W.; Xu, L.; Kuang, H.; Wu, X.; Liu, L.; Chen, X.; et al. A SERS-active sensor based on heterogeneous gold nanostar core–silver nanoparticle satellite assemblies for ultrasensitive detection of aflatoxinB1. Nanoscale 2016, 8, 1873–1878. [Google Scholar] [CrossRef] [PubMed]
- Goud, K.Y.; Hayat, A.; Catanante, G.; Moru, S.; Gobi, K.V.; Marty, J.L. An electrochemical aptasensor based on functionalized graphene oxide assisted electrocatalytic signal amplification of methylene blue for aflatoxin B1 detection. Electrochim. Acta 2017, 244, 96–103. [Google Scholar] [CrossRef]
- Abnous, K.; Danesh, N.M.; Alibolandi, M.; Ramezani, M.; Emrani, A.S.; Zolfaghari, R.; Taghdisi, S.M. A new amplified π-shape electrochemical aptasensor for ultrasensitive detection of aflatoxin B1. Biosens. Bioelectron. 2017, 94, 374–379. [Google Scholar] [CrossRef]
Publisher’s Note: MDPI stays neutral with regard to jurisdictional claims in published maps and institutional affiliations. |
© 2022 by the authors. Licensee MDPI, Basel, Switzerland. This article is an open access article distributed under the terms and conditions of the Creative Commons Attribution (CC BY) license (https://creativecommons.org/licenses/by/4.0/).