Article

Assessing over Time Performance of an eNose Composed of 16 Single-Type MOX Gas Sensors Applied to Classify Two Volatiles

Robotics Laboratory, Universitat de Lleida, Jaume II, 69, 25001 Lleida, Spain
*
Author to whom correspondence should be addressed.
Chemosensors 2022, 10(3), 118; https://doi.org/10.3390/chemosensors10030118
Submission received: 22 February 2022 / Revised: 14 March 2022 / Accepted: 16 March 2022 / Published: 19 March 2022
(This article belongs to the Special Issue Advances in Analytical Systems for Gaseous Mixture)

Abstract

:
This paper assesses the over time performance of a custom electronic nose (eNose) composed of an array of commercial low-cost and single-type miniature metal-oxide (MOX) semiconductor gas sensors. The eNose uses 16 BME680 versatile sensor devices, each including an embedded non-selective MOX gas sensor that was originally proposed to measure the total volatile organic compounds (TVOC) in the air. This custom eNose has been used previously to detect ethanol and acetone, obtaining initial promising classification results that worsened over time because of sensor drift. The current paper assesses the over time performance of different classification methods applied to process the information gathered from the eNose. The best classification results have been obtained when applying a linear discriminant analysis (LDA) to the normalized conductance of the sensing layer of the 16 MOX gas sensors available in the eNose. The LDA procedure by itself has reduced the influence of drift in the classification performance of this single-type eNose during an evaluation period of three months.

1. Introduction

An electronic nose or eNose is an electronic sensing device designed to mimic human olfaction to detect odors or aromas by providing different fingerprints [1]. An eNose can be considered as a portable and low-cost alternative to gas chromatography (GC). Instruments performing GC use capillarity columns coupled to very sensitive detection systems such as mass spectrometers (MS) or flame ionization detectors (FID). These instruments can detect and measure many chemicals at concentrations in the order of parts per billion (ppb), but they are bulky and require a high power supply [2]. Alternatively, an eNose is a comparatively smaller device based on the combination of different gas sensors with different sensitivities and/or specificities tailored to provide a characteristic fingerprint of an odor or aroma at concentrations in the order of parts per million (ppm) [3]. Currently, there is a growing interest in the creation of portable GC [4] and in the integration of miniaturized gas preconcentrators which enables a significant enhancement of the sensitivity of portable GC to achieve similar performances to benchtop instruments [2].
The development of affordable metal oxide (MOX) gas sensors [5] has enabled the development of compact and portable eNoses composed mainly of an array of MOX gas sensors [6]. These compact and low-cost eNoses can be used widely for static and dynamic gas detection in home and industrial applications [7,8,9], for quality validation [10], and even for disease detection [11]. However, the application of MOX gas sensors has some disadvantages [12], such as the poor selectivity, the drift in performance and the high internal operating temperature that requires a medium power supply that can prevent its continuous application in battery-powered devices.
The specific disadvantages of low-cost MOX gas sensors used in an eNose application are drift [6,12,13,14] in sensitivity and specificity of the MOX gas sensors, the influence of the ambient and meteorological conditions in the measures [15], and the influence of aging [16]. All these disadvantages are perceived as a sensitivity and baseline drift [17]. These effects are used to provide a time-variant fingerprint of the odor or aroma analyzed that is very difficult to interpret correctly using pattern recognition techniques [18].
Then, the optimized implementation of an eNose using MOX gas sensors [19] can be addressed (1) by the direct application of different signal processing techniques [20,21,22,23,24], which usually offer good results after calibration that worsen over time due to sensor drift, and/or (2) by the application of specific signal processing techniques for removal of baseline drifts in multivariate chemical sensor arrays [25,26,27,28].
Despite the above-cited problems, several new portable eNose applications that use MOX gas sensors are being developed. A recent example is the proposal of Burgués et al. [29], who used a portable eNose for real-time odor monitoring in a wastewater treatment plant. This work used a custom eNose mounted as a payload (~1.8 kg) on a DJI Matrice 600 drone where the principal characteristics are: 6 rotors, 6 × 5.700 mAh batteries, 10 kg weight and 15.5 kg maximum takeoff weight, 2500 m service ceiling, 38 min autonomy with no payload and 18 min with a payload of 5.5 kg. This eNose allowed real-time odor measurements and the development of plant operation strategies tailored to monitor the generation of odors and to minimize their transmission outside the plant. In this special case, the eNose used a pump and a 10 m gas-sampling tube hung with a small weight in the tip to reduce the influence of self-generated air turbulences in the measurements. The compact eNose carried by the drone was composed of an array of 16 MOX gas sensors of four different types and five additional electrochemical gas sensors of two different types that were collectively operated using a pulsed strategy [30], reducing the average power consumption of the eNose to only 1.0 W. In this case, the power consumption of this eNose has been a determinant factor for this drone application, just as size, weight, and power consumption are determining factors for smartphone-operated applications [31].

New Contribution

This paper presents the assessment of different algorithms applied for volatile classification and their performance evolution over time. The dataset used in this paper has been obtained with a custom eNose that we firstly presented in [32]. This eNose is composed of an array of 16 miniature single-type BME680 sensor devices that embed a temperature sensor, a humidity sensor, a pressure sensor, and a MOX gas sensor aimed to measure the presence of nonspecific volatile compounds (TVOC) in the air to estimate the overall air quality. In general, eNoses using MOX gas sensors used to be composed of different sensor-types but, as presented in [32], we demonstrated that an eNose using an array of sixteen single-type miniature MOX gas sensors is capable of distinguishing between evaporated ethanol and acetone, exploiting the small but inherent variability expected in single-type MOX gas sensors to detect volatile diversity directly.
The initial classification performance [32] with this custom eNose design was very promising. However, after two weeks of continuous usage, the drift of the sensors worsened the average classification performance from 97% to 77%, with a slight improvement in the third week. Unfortunately, all early efforts invested in improving the classification performance of this new eNose prototype were unsuccessful.
This paper assesses the over time performance of different classification methods applied to process the information gathered with this eNose. The best classification performance has been obtained when applying a linear discriminant analysis (LDA) to the normalized conductance of the sensing layer of the 16 MOX gas sensors available in the eNose. This LDA procedure by itself has reduced the influence of baseline drift in this single-type eNose by maintaining the classification performance during an evaluation period of three months. These improvements allow the development of future practical applications of this new eNose prototype design.

2. Previous Classification Results Obtained with the eNose

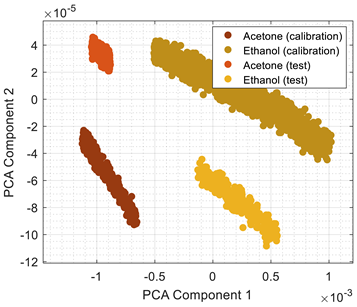
The eNose used in this work was first described in [32] in an application tailored to detect and classify two volatiles: evaporated ethanol and acetone. The volatile classification was based on the application of the principal component analysis (PCA [33]), a technique that has been widely applied to process eNose data [34] due to its ability to reduce data dimensionality while preserving most of their variance. After the initial calibration, the first average classification results obtained with this eNose were very promising, higher than 94%. The classification procedure applied in the eNose presented in [32] was based on (1) an initial calibration of the eNose with the two target volatiles by measuring the resistance of the sensing layers of the MOX sensors in the presence of different volatile concentrations, (2) the application of PCA to the calibration data to obtain a reference projection matrix to reduce the dimensionality of the data produced by the sensor from sixteen dimensions (16D) to only two dimensions (2D), and (3) the registration of the calibration data in this 2D projected PCA space to be used as reference clusters for the classification. Then, the live classification procedure was based on (1) reducing the dimensionality of the raw data gathered by the eNose from 16D to 2D by using the PCA projection obtained during the calibration, and (2) the classification of the projected data by using a k-nearest neighbor (k-NN [35]) and the reference clusters projected in the PCA space registered during the calibration.
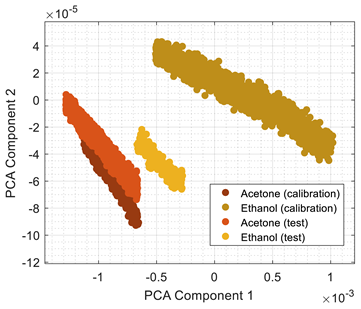
The classification results obtained with this approach were repetitive and consistent during the first week of continuous experimentation with the eNose. However, the classifier performance obtained during the second week of experimentation decreased to 70%. In order to illustrate this effect, Table 1 shows the calibration and test results using the 2D PCA projection obtained from the calibration of the eNose with ethanol and acetone. Table 1 also shows the comparative projection of additional test data obtained one and two weeks after the calibration. The clusters of ethanol and acetone obtained in these tests were still isolated but shifted in the PCA projection because of MOX sensor drift. Therefore, the k-NN classification (comparing the new data samples with the calibration clusters) of the shifted test data were usually wrong. Further attempts to analyze and correct the shift of the clusters in the 2D PCA projected space were unsuccessful and did not yield any remarkable improvement on the classification results.
This current paper assesses the performance over time of different classification strategies applied to the raw data provided by the eNose. One of the alternatives evaluated has shown a significant over time improvement on the classification results achieved with this single-type eNose design.

3. Materials and Methods

The materials used in this paper are the custom eNose presented in [32] composed of 16 single-type miniature MOX gas sensors, a photoionization detector (PID), and two gas targets: evaporated ethanol and acetone. The methods assessed for volatile classification are self-organized maps (SOM), PCA followed by k-nearest neighbors (k-NN), and linear discriminant analysis (LDA).

3.1. eNose

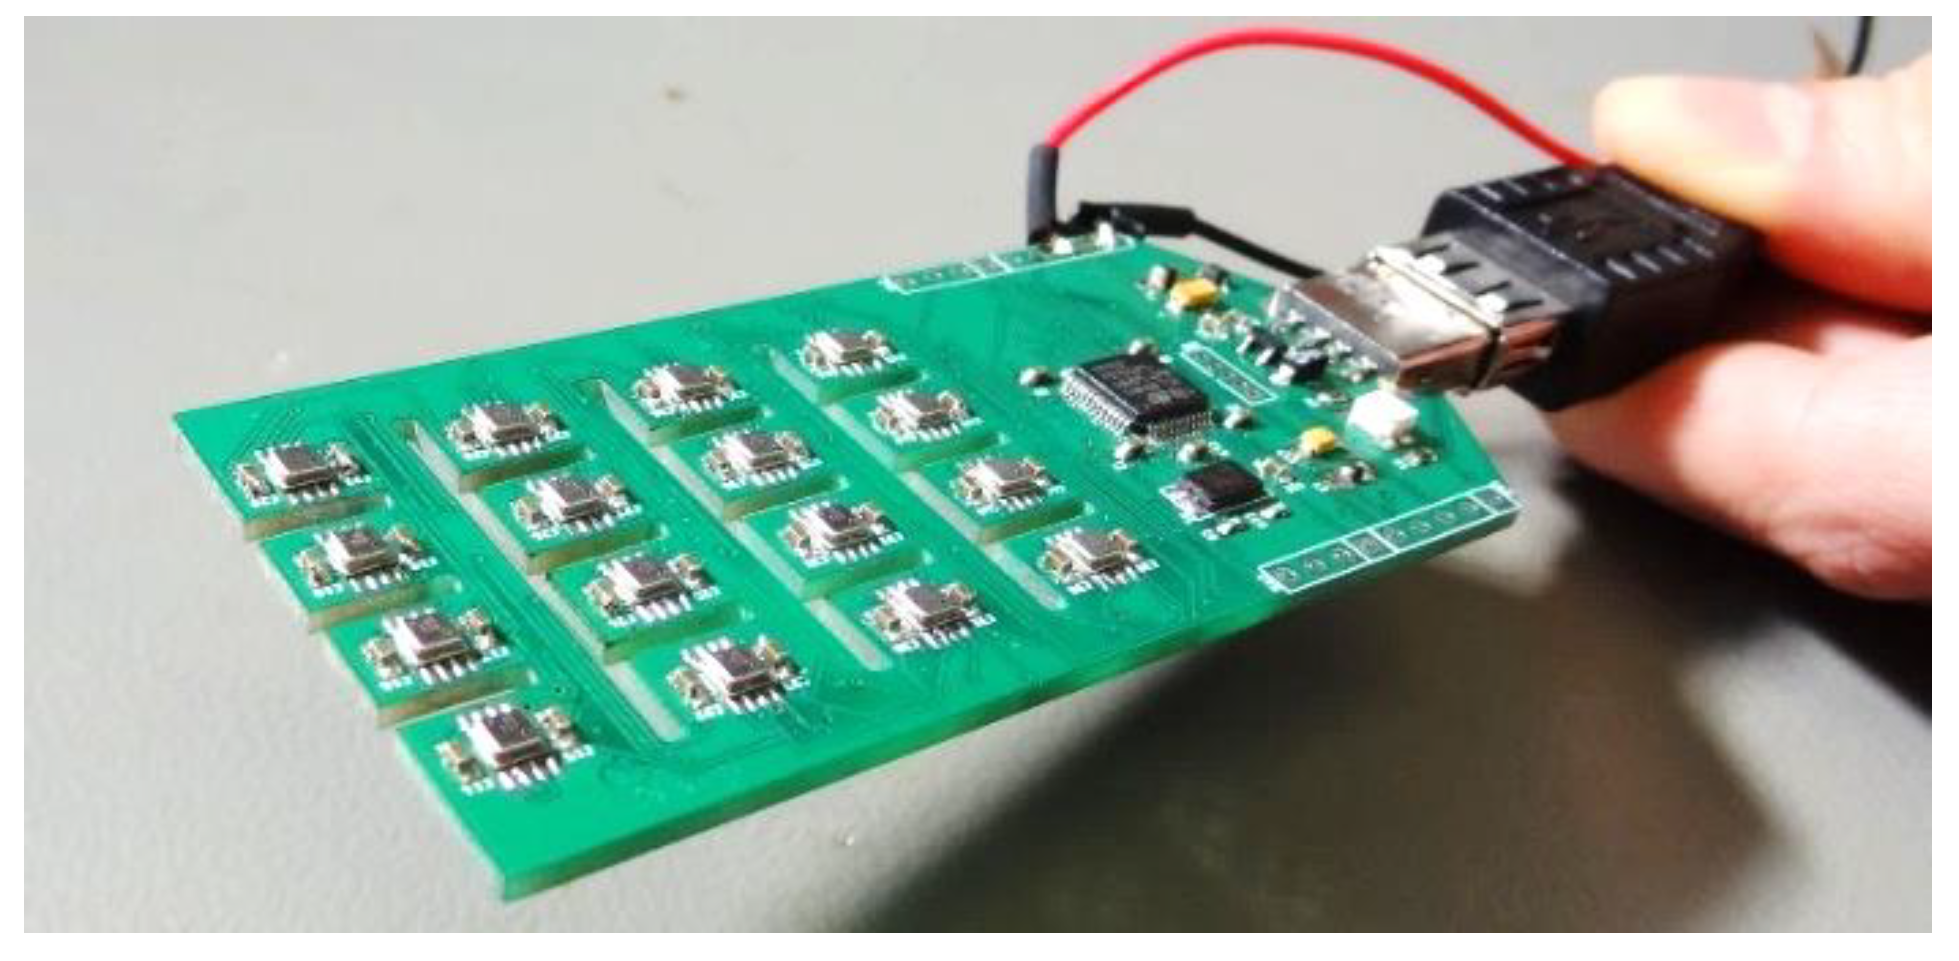
Figure 1 shows an image of the custom eNose used in this paper, which has been technically and operationally described in [32]. This eNose is composed of an array of 16 versatile miniature micro-machined BME680 sensor devices (Bosh Sensortec, Reutlingen, Germany) that include a temperature sensor, a humidity sensor, a pressure sensor, and a miniature MOX gas sensor proposed to measure the total of nonspecific volatile compounds (TVOC) in the air. This eNose uses a compact low-power microcontroller that operates as a slave USB device using the standard USB-CDC serial (RS232) communication protocol, providing access to the 16 BME680 sensors that are individually selected using a dedicated chip select line. In normal operation, this device continuously measures and provides the resistive value of the 16 embedded MOX gas sensors. The sampling time operation of the eNose is only limited by the communication speed of the ICP serial bus used to access the 16 BME680 sensors, with a total power consumption of 0.9 W (5.0 V and 0.18 A) while performing continuous measurements.
The eNose includes a redundant power supply connector which allows it to continue measuring after being disconnected from the USB host. Implementing a continuous operation mode and using an external power source to deliver an uninterrupted power supply to the sensors becomes a fundamental feature to avoid the nonspecific transitory readings provided by MOX sensors during the initial heat-up stage [36]. This ensures that the heater element of each one of the sensing devices remains within the operating temperature range. The BME680 sensor provides access to temperature, humidity, and pressure readings, as well as to the resistive value of the sensing layer of a miniature MOX gas sensor. To obtain reliable gas readings with a MOX sensor, it is required to internally enable the flow of current to its heating resistor. Once enabled, the BME680 powers the heating resistor of its MOX gas sensor until the target heater temperature is reached. This temperature will be maintained during a specific amount of time (heat-up time) before producing a new resistance reading. Both parameters: target heater temperature and heat up time, can be dynamically adjusted before performing a new reading.

3.2. eNose Configuration

Each one of the sixteen BME680 sensors that compose the eNose can be configured individually, allowing the definition of specific values for the target heat up temperature applied to the heating resistance of the MOX gas sensor (in a range from 200 to 400 °C) and the duration of the heat-up stage (in a range from 1 to 4032 ms). Table 2 shows the target heater temperature and the heat-up duration (the same for all MOX gas sensors) used in this paper to configure the eNose.
This eNose configuration is different from the configuration used previously in [32]. In the scientific literature, the common strategy used to configure several units of single-type MOX gas sensors is the application of different power values to the heating resistor (different heating temperature) of each MOX gas sensor [29,36]. For example, in [36] four TGS 2600 sensors were powered with a pulse width modulation (PWM) of 25%, 50%, 62.5%, and 75%, four TGS 2602 with 25%, 50%, 62.5%, and 75%, four TGS 2611 with 25%, 50%, 62.5%, and 75%, and four TGS 2620 with 25%, 50%, 62.5% and 75%. Therefore, in [32], the eNose was configured with different target heater temperatures for each of the sixteen MOX gas sensors used. However, the results of the first validation experiments conducted with this eNose showed that the MOX gas sensors were more sensitive at 350 °C, so this paper evaluated the use of this temperature for the sixteen MOX gas sensors to obtain the maximum sensibility from them. The specific optimization of these individual configuration parameters will be addressed in a future work, probably tailored to a specific application of this custom eNose.

3.3. Target Volatiles

This paper is based on [32] and the target volatiles assessed are the same: ethanol and acetone, which have been widely used in the scientific literature [36,37,38]. A future planned application of the custom eNose assessed is the development of an early gas leak detector carried in a mobile robot [36], and ethanol and acetone are feasible candidates for an accidental leak as they are widely used in its liquid form in many scientific and technical laboratories and industrial plants. Acetone is used extensively as a solvent in the manufacture of plastics. Ethanol is used extensively as a solvent in the manufacture of varnishes and perfumes but also as a preservative for biological specimens; in the preparation of essences and flavorings; in medicines and drugs; as a disinfectant and in tinctures; as an engine fuel; as a fuel additive; and as an active ingredient in many alcoholic drinks.

3.4. Photo Ionization Detector (PID)

A photoionization detector (PID), model ppbRAE 3000 from RAE Systems, is used in this paper as a reference device to measure the concentration of the two target volatiles accurately. The PID is a high-precision sensing device that requires the previous selection of the gas to be measured because it has no classification capabilities.

3.5. Methods for Volatile Classification

The methods assessed in this paper for volatile classification are self-organized maps (SOM), PCA followed by k-nearest neighbors (k-NN), and linear discriminant analysis (LDA).
SOM. The self-organizing map (SOM), proposed by Kohonen [39], can train a net of nodes in order to learn to cluster data based on similarity, with a preference to assign the same number of instances to each cluster. Two in this paper: ethanol and acetone. The net of 1 × 2 dimensions used by this SOM classifier has been created using the Matlab implementation: selforgmap.m, and the net has been trained using the Matlab implementation: train.m, with:
net = selforgmap([1 2]);
net = train(net, eNose_array_calibration);
and the net has been applied to classify the gas samples using:
classification = net(eNose_array_sample);
class_label = vec2ind(classification);
although the class_label result requires an additional step to match the resulting label with the correct calibration class: ethanol or acetone.
k-NN(PCA). The second classification method assessed in this paper is the application of the k-nearest neighbors to a dimensional reduction performed with PCA. The principal component analysis (PCA), proposed by Pearson [33], is an unsupervised method that computes the principal components of a dataset by computing the eigenvectors and the covariance matrix. These principal components can be used to reduce the dimensions of the dataset while maintaining the variability of the clusters included in the dataset [40]. The PCA analysis has been performed using the Matlab implementation of the PCA method: pca.m, by using:
[coeff, score, ~, ~, ~,mu] = pca(eNose_array_calibration);
where eNose_array_calibration is a matrix containing the calibration data, coeff are the coefficients of the principal components, score are the scores of the principal components, and mu the average values of each sensor of the eNose. Then, the transformation applied to reduce the dimension of the information gathered by the eNose from 16 dimensions (16D) to 2 dimensions (2D) is:
eNose_array_sample_2D = (eNose_array_sample − mu) × coeff(:,2);
The k-nearest neighbors algorithm (k-NN) is a nonparametric classification method proposed by Fix and Hodges [35] that sorts the k-closest samples in a labeled reference dataset depending on the class membership of its neighbors. This k-NN classifier has been trained using the Matlab implementation of the k-NN method: fitcknn.m applied to the calibration data projected in the 2D space defined by the PCA:
Mdl = fitcknn (eNose_array_calibration_2D, class_calibration_label, ‘NumNeighbors’, 5);
where Mdl is a k-nearest neighbor classification model based on the calibration classes. Then, the classification of a gas sample has been performed using the Matlab function predict.m, by using:
class_label = predict (Mdl, eNose_array_sample_2D);
LDA. The linear discriminant analysis (LDA), proposed by Fisher [41], is a supervised statistical method that computes the eigenvectors and the covariance matrix of a dataset, assuming that the different data clusters are based on different Gaussian distributions. The discriminant analysis classification model trained with LDA can be used directly to predict the class of a sample [42]. The LDA analysis has been performed using the Matlab implementation of the LDA method: fitcdiscr.m, by using:
Mdl = fitcdiscr (eNose_array_calibration, class_calibration_label);
where eNose_array_calibration is a matrix containing the eNose calibration samples, class_calbiration_label is a vector containing the class of each calibration sample, and Mdl is the fitted discriminant analysis model based on the input variables that will be used to predict the class of a sample data [42]. This classification method has been implemented using the Matlab function predict.m (Equation (6)).
Finally, PCA and LDA have a similar application to reduce the dimensions of the eNose data [40]. The differences are that PCA maximizes the variance of the clusters while LDA makes the clusters as separable as possible.

4. eNose Measurement Procedure

Calibration is a fundamental procedure that will affect the performance of the array of MOX gas sensors operating as an eNose.
This section describes the procedure followed in this paper to measure ethanol and acetone gas samples with the eNose. This procedure was proposed to develop a simple yet reliable systematic procedure to obtain calibration and validation data.
The design of the measurement procedure used in this paper is a simplification of the dynamic calibration procedure presented in [32]. This new simplified proposal aims to obtain static data points showing the relationship between the eNose data and the ground truth gas concentration measured with the PID.
The materials used in the experiments are a polypropylene (PP) plastic box of approximately 270 mm × 140 mm × 70 mm containing a small glass plate, the custom eNose, the PID (ppbRAE 3000) with the tip of its sampling probe located inside the plastic box, and 1 mL liquid samples of ethanol and acetone stored in small syringes. Figure 2 shows an image of the measurement setup. The box has a sealed practicable hole to insert the syringe carrying the liquid samples of ethanol or acetone that will be released inside the glass pate. Some previous exposition experiments have been conducted to verify that the plastic box does not react with the target volatiles.

4.1. Measurement Procedure

The development of the measurement procedure has three stages: mounting, measuring, and cleaning.
Mounting stage. The eNose is placed inside the box. The PID is placed outside the box with the tip of its measuring probe connected to the inside of the box to draw air and measure the gas concentration. The air drawn with the PID could be returned to the box via a return tube, but this possibility has not been applied in this paper because the PID is used to extract polluted air from the box. During this mounting stage, the eNose is disconnected from the USB port, but its power supply remains uninterrupted due to the use of the redundant power connector. This mounting stage ends plugging the eNose to a USB host and setting its configuration to operate in forced mode [32]: continuously reading the resistance of the sensing layer of the 16 MOX gas sensors using the last eNose configuration.
Measurement stage. The measurement stage begins by introducing the syringe containing the liquid form of the volatile substance to be analyzed into the box. This substance is then carefully deposited over the glass plate inside the box. Once the resistive values gathered by the BME680 of the eNose are stable, a set of measuring cycles are performed.
Each measurement cycle is performed every seven minutes to allow the gas concentration to settle uniformly inside the box. During this seven-minute period, the PID remains paused (with its pump disconnected), preventing it from causing any air turbulence inside the box or decreasing the number of airborne particles of the evaporated substance. After seven minutes (time required to get stable readings from the BME680), the PID is switched on to gather 30 samples (one sample per second) to determine the current gas concentration inside the box. The last sample is registered as the true concentration, as it is estimated that at least 20 s of air pumping are needed to remove any previous air samples remaining inside the sampling probe of the PID. After 30 s, the PID is paused again until the next measurement cycle is performed.
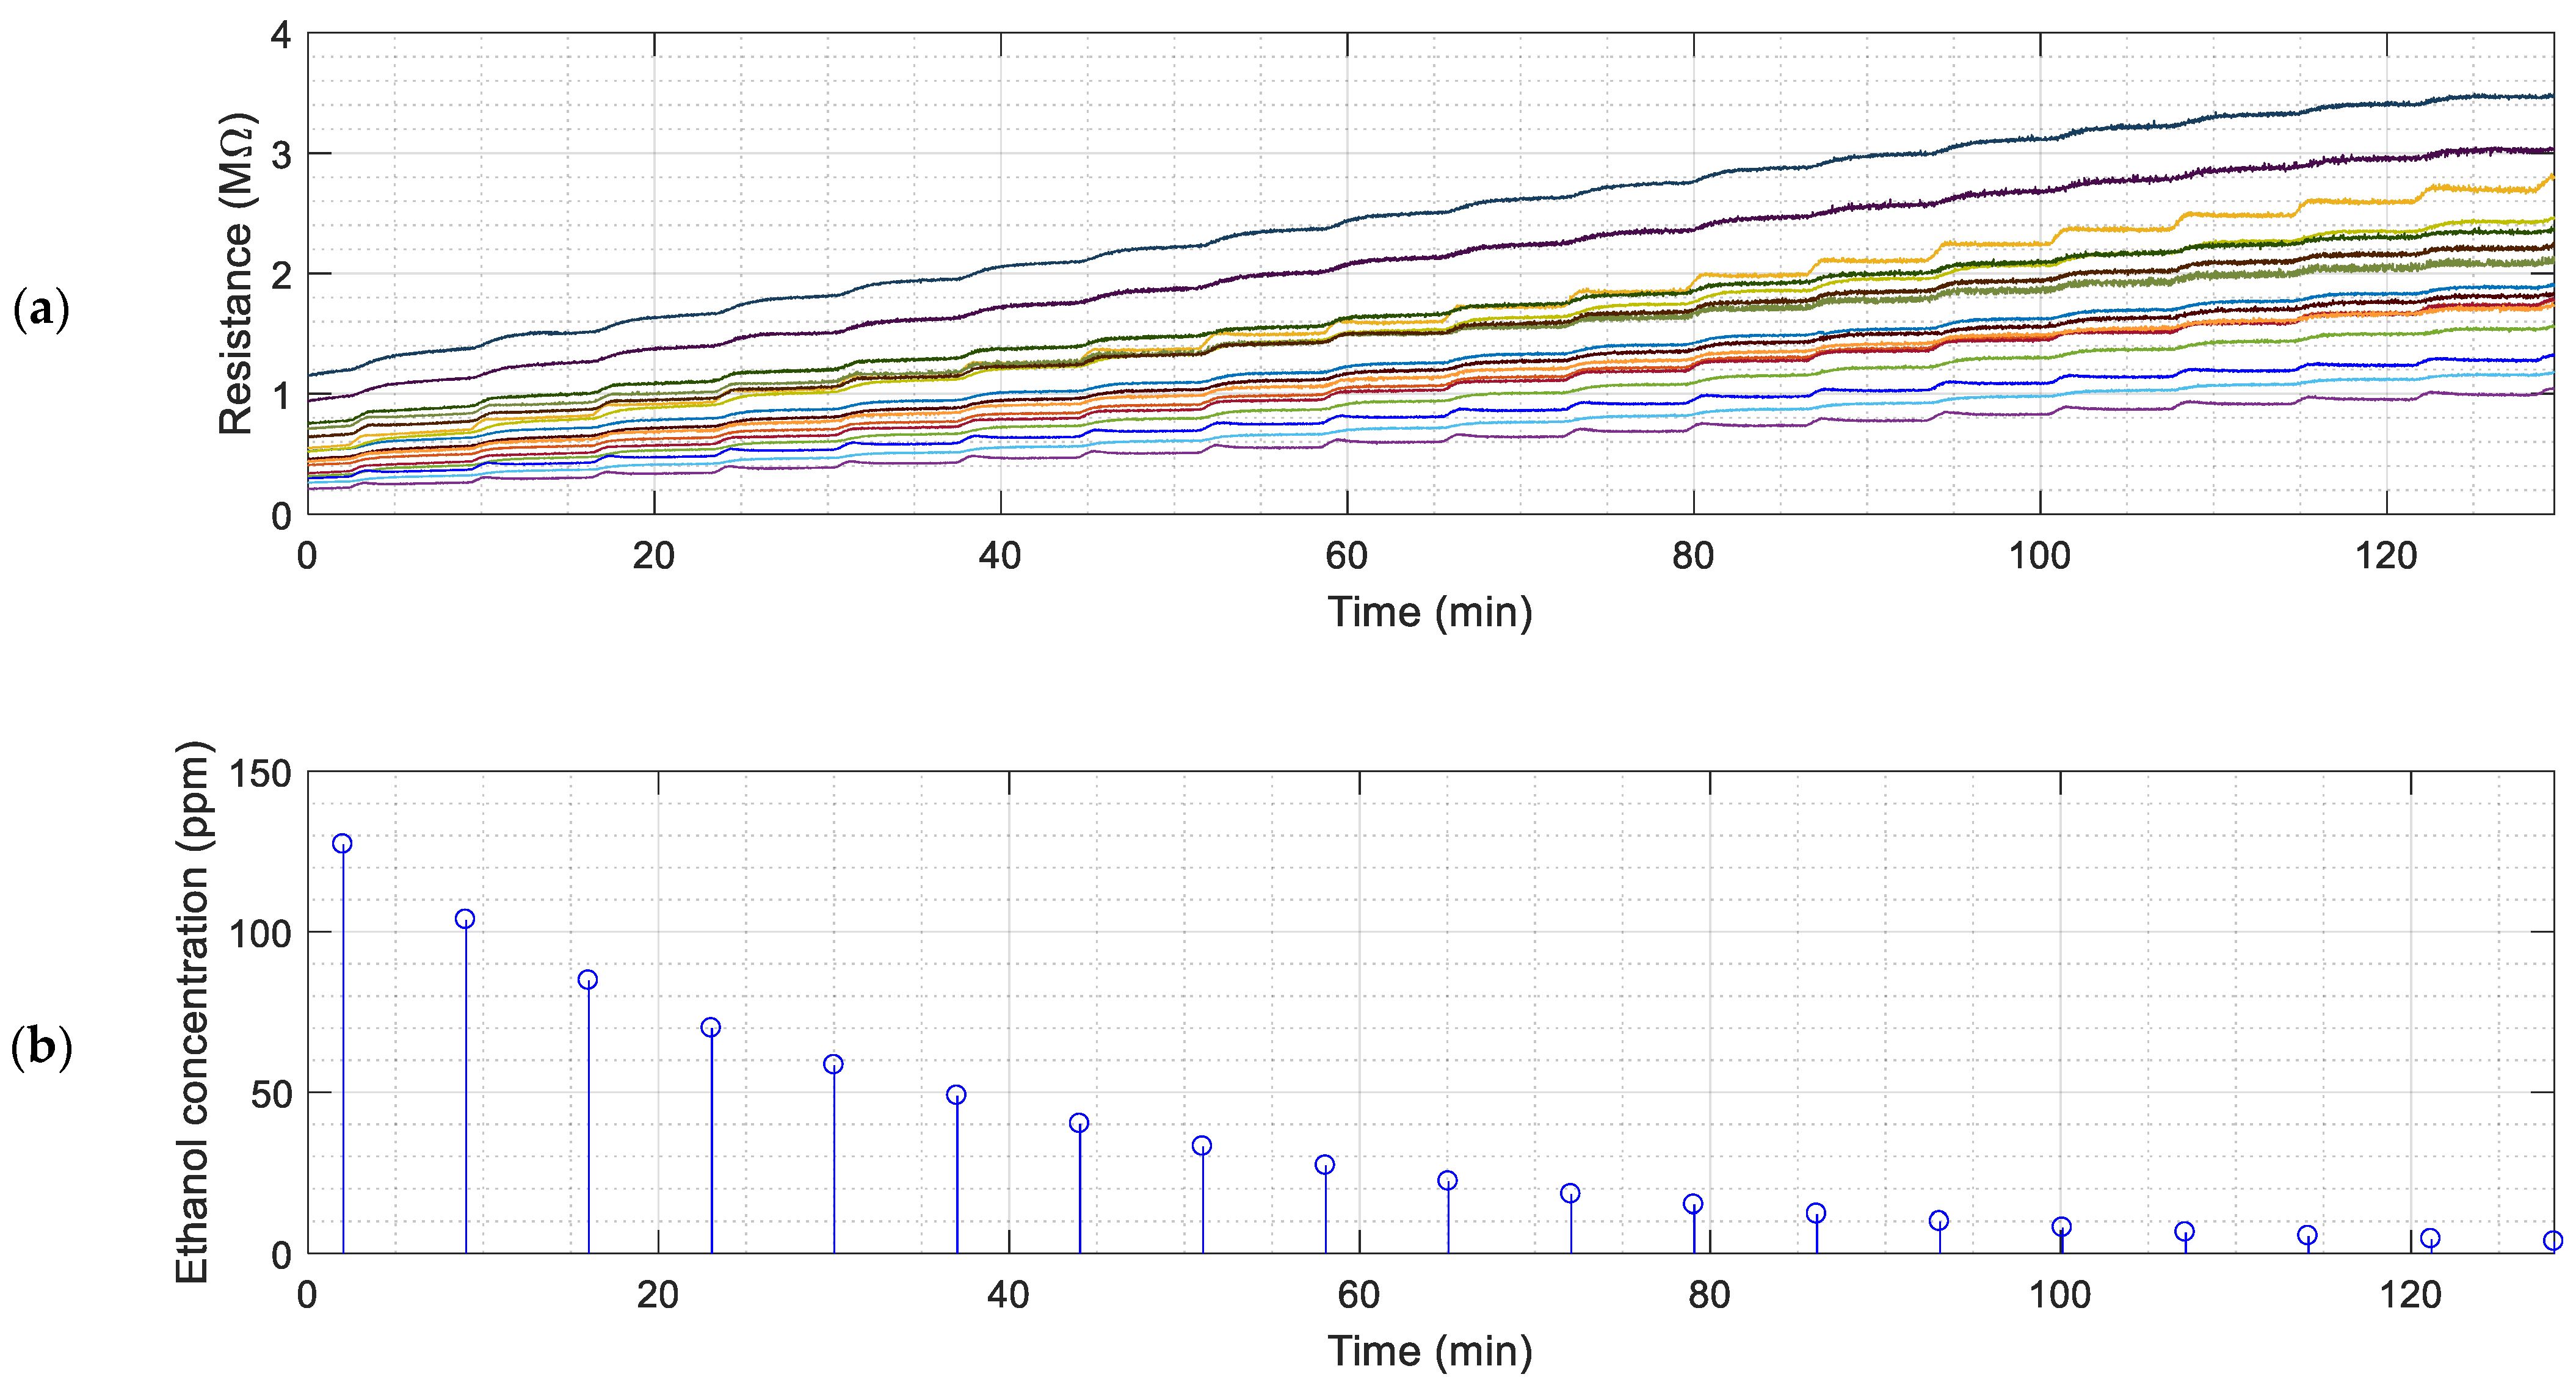
Figure 3 and Figure 4 show the continuous evolution of the resistance of the sensing layers of the 16 MOX gas sensors of the eNose and the instantaneous gas concentration measured with the PID.
The sequential activation of the pump of the PID is used to extract a fixed, constant amount of polluted air from inside the box. This extraction reduces the total amount of polluted gas from inside the chamber and the concentration of the volatile. The activation of the internal pump of the PID originates an instantaneous peak in the resistance of the sensing layers of the MOX gas sensors provided by the eNose as a consequence of the sudden reduction of the gas concentration caused by the extraction of polluted air from inside the box. This peak disappears several seconds after the deactivation of the pump of the PID as a consequence of the homogenization of the concentration of the volatile inside the box.
Cleaning Stage. In this final stage, the box is kept open for at least 60 min between experiments to facilitate the renovation of the air inside the chamber. This stage ends when a new measurement is started. The last step of the cleaning stage is using the PID to verify that no concentration of volatiles remains from the previous experiment, ensuring that the plastic box has been effectively purged.

4.2. eNose Sensitivity to the Target Volatiles

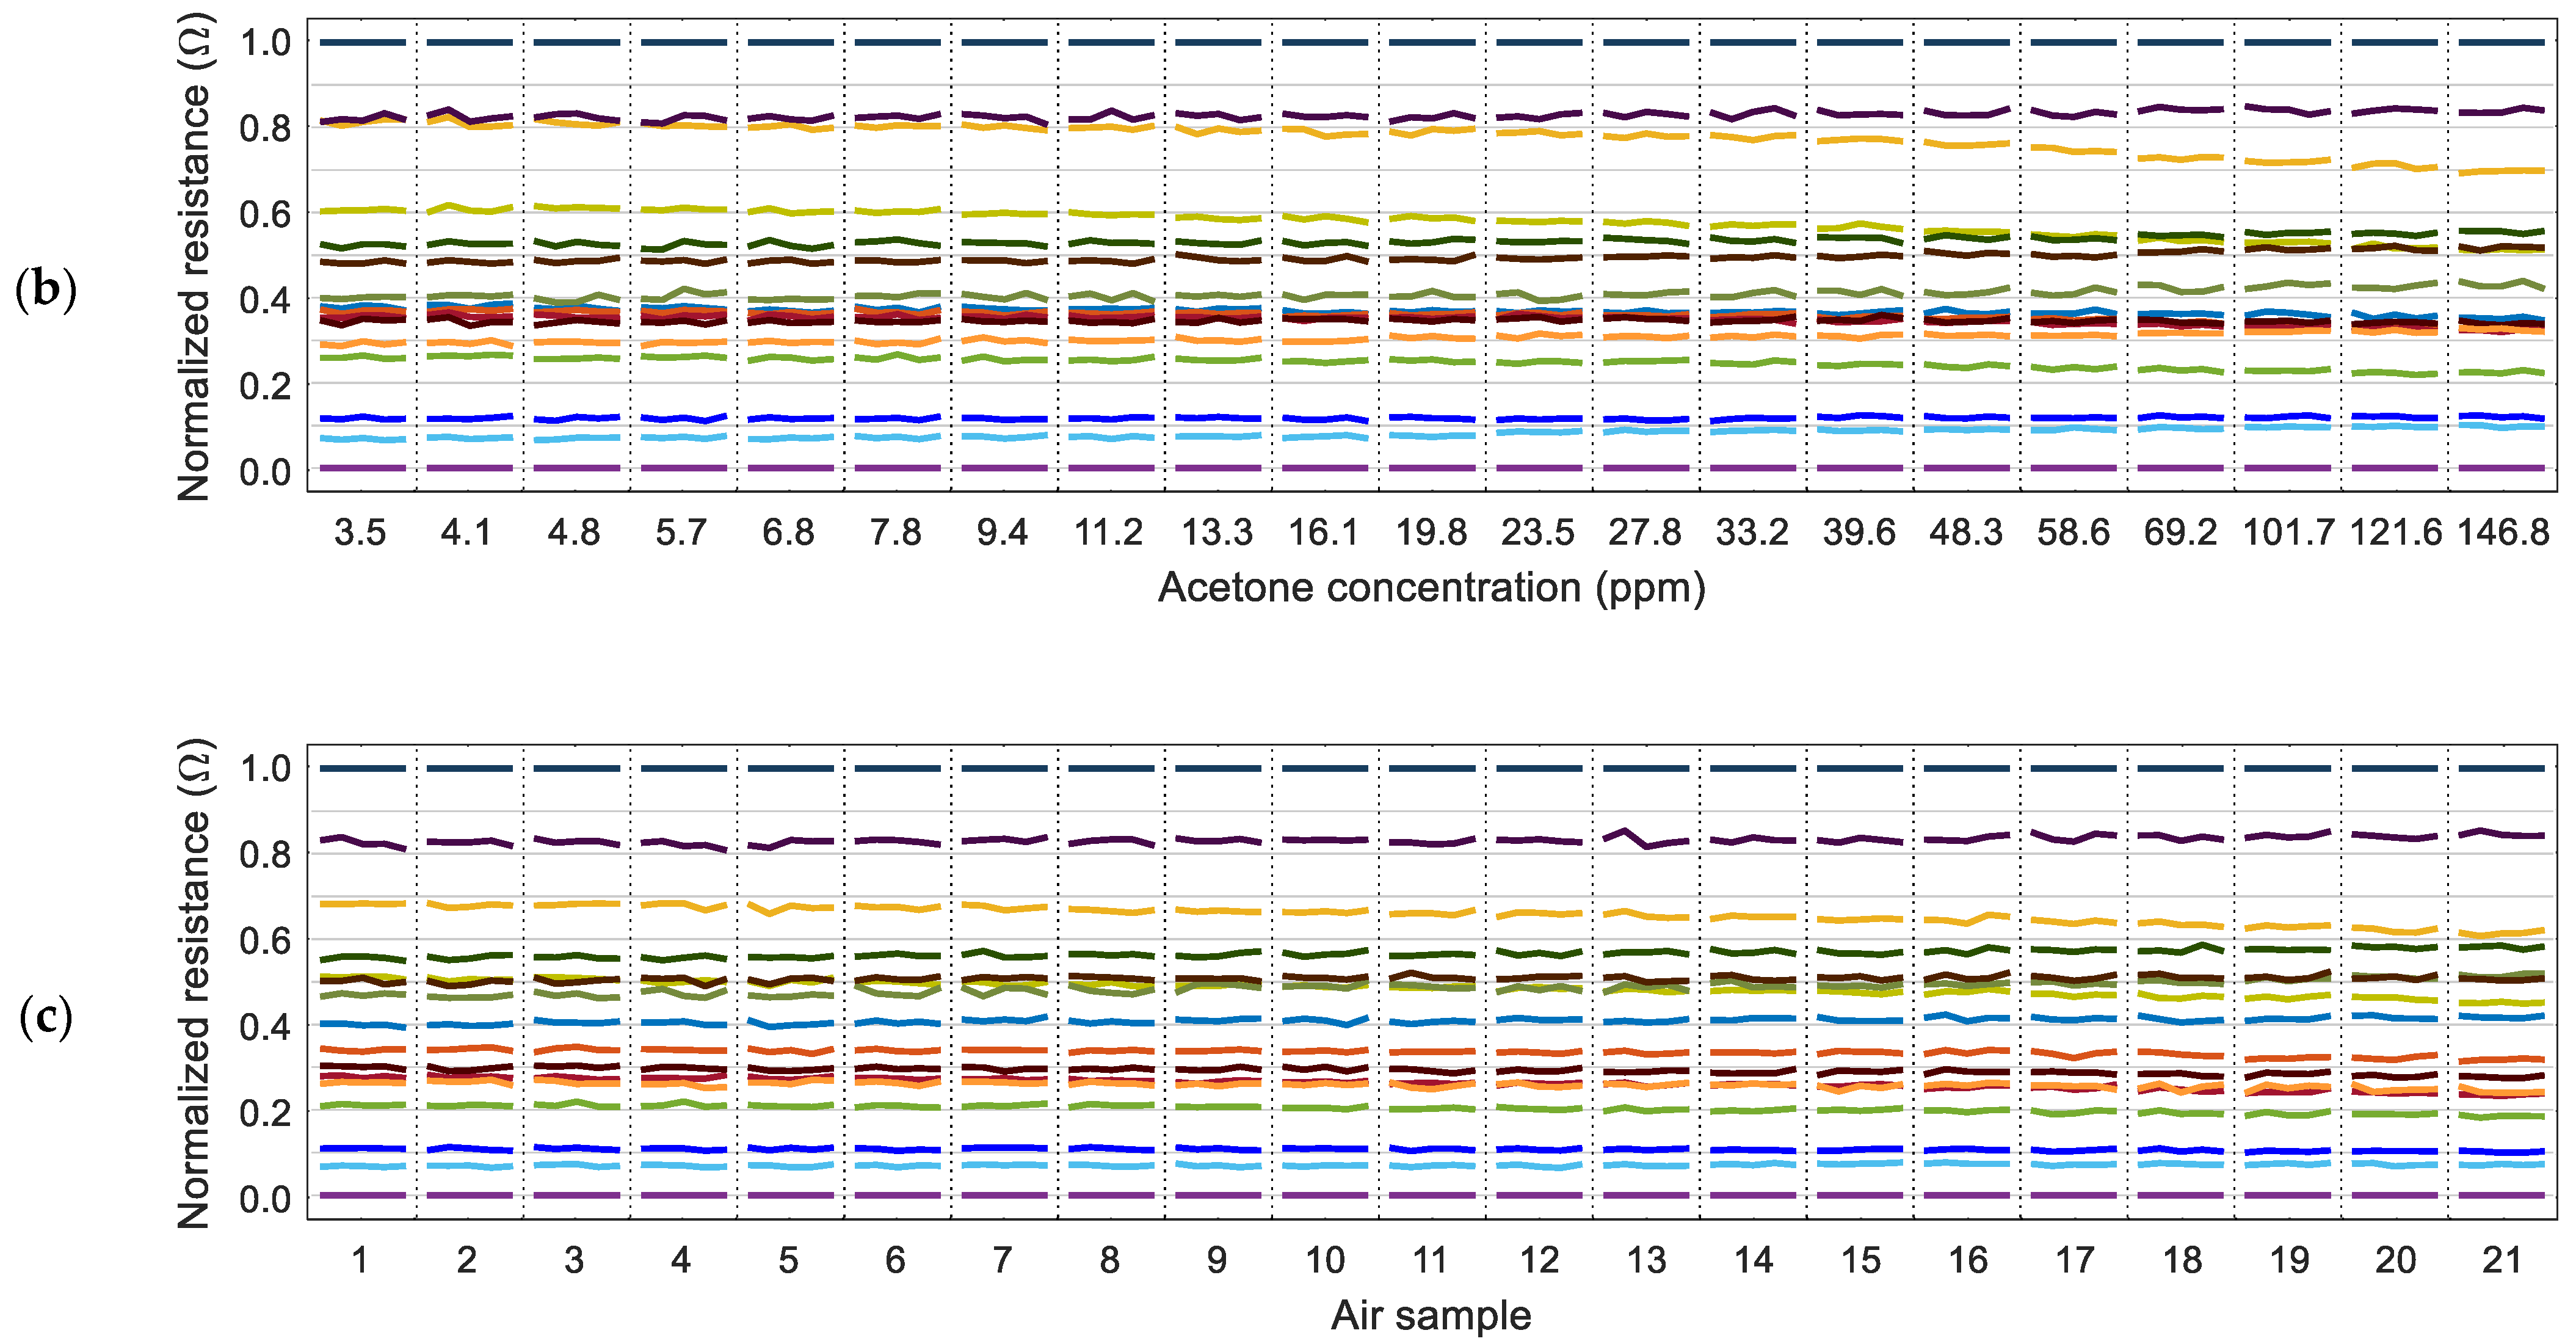
The calibration results that are shown in Figure 3 and Figure 4 evidence slight differences between the responses of the MOX gas sensors to the target volatiles. Figure 5 shows the evolution of the values of the normalized resistance of the sensing layer of the MOX gas sensors (measured just before each PID activation) in relation to the concentration of the volatiles measured by the PID. The normalization process is applied to the 16 instantaneous resistance values of the sensing layers, R k = 1 16 , of the 16 MOX gas sensors composing the eNose relative to the upper and lower resistance values measured:
R k = 1 16 ¯ = R k min ( R k = 1 16 ) max ( R k = 1 16 ) min ( R k = 1 16 )
The relative representation in Figure 5 shows that some MOX gas sensors maintain a similar relative value regardless of the gas concentration. At the same time, there are other sensors whose relative value changes depending on the concentration of the volatile measured. This observation agrees with the variability that can be expected in a MOX gas sensor [12]. For completeness, Figure 5c shows the normalized resistance of the MOX gas sensors obtained in 21 different measures with air. A closer look at the results of Figure 5 reveals that the sensors with the maximum and minimum resistance in the sensing layer are always the same regardless of the presence of ethanol, acetone, or no volatile (air). In the calibration results presented in Figure 3 and Figure 4, the maximum resistance was provided by sensor 13 and the minimum resistance by sensor 4. These reference sensors were the same in all experiments conducted in this paper, so the normalized expression of the resistance can be used to reduce the dimension of the data gathered from the eNose from 16D to 14D by excluding the maximum (1.0) and minimum (0.0) normalized values.
Table 2 summarizes the maximum relative variation of the normalized resistance of the sensing layer of the 16 MOX gas sensors of the eNose in the presence of ethanol and acetone. This relative normalized representation highlights the small differences between the 16 MOX gas sensors. Results show that sensor 3 has the highest relative variability in ethanol (35%) and the highest relative variability in the presence of acetone (12%). Nevertheless, this variability depicts lower sensitivity (minor increase in resistance) due to the presence of ethanol and acetone. Similarly, sensor 9 had the second-highest variability to ethanol (28%) and the second-highest variability to acetone (9%). Sensor 7 had the third-highest variability to ethanol (17%) but the sixth-highest variability to acetone (4%). Sensor 5 had the fourth-highest variability to ethanol (11%) and the fourth-highest variability to acetone (4%), etc. We assume that the most relevant variabilities that allow volatile differentiation are caused by the crossed differences provided by sensors 7 and 5. We also assume that the values of these relative variations also validate the selection of the target heater temperatures used in this paper.
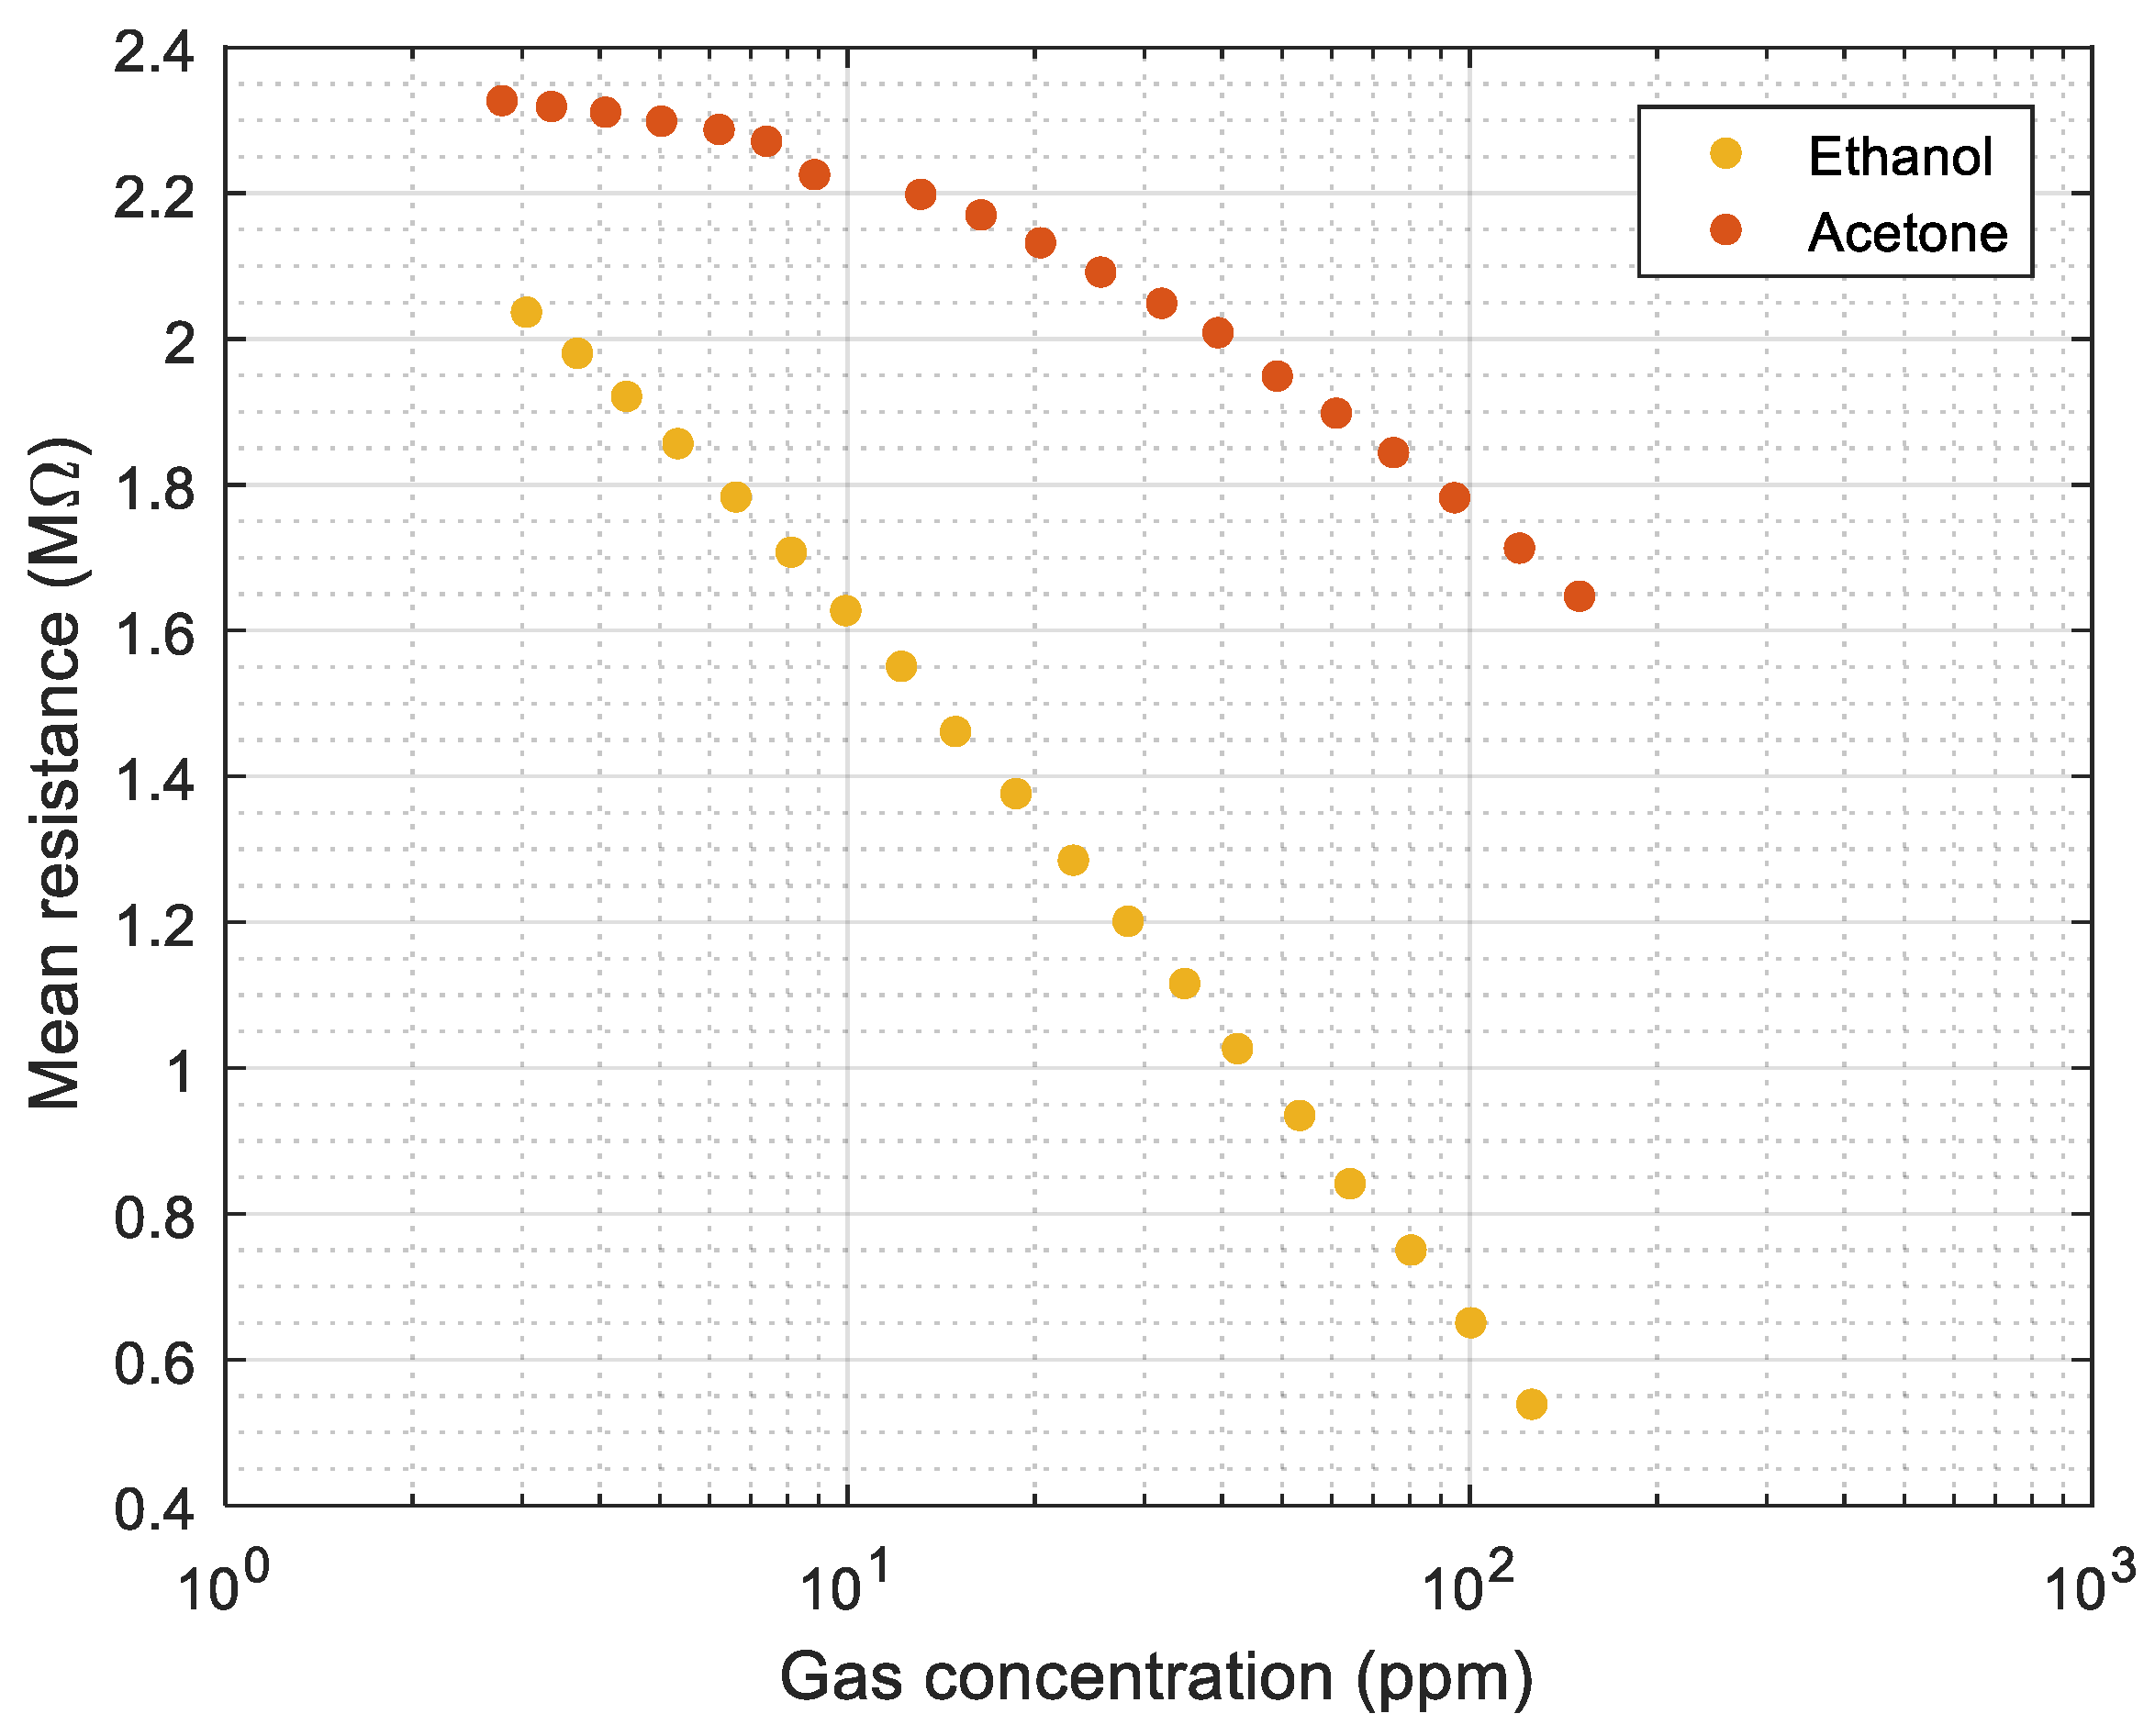
Figure 6 shows the evolution of the average instantaneous resistance of the 16 sensing layers of the MOX gas sensors relative to the volatile concentration (from results of Figure 3a and Figure 4a). These relationships can be used to estimate the possible concentration of ethanol or acetone from the average resistance of the sensing layers of the 16 MOX gas sensors of the eNose. However, an additional classification procedure is needed to determine which volatile (ethanol or acetone) is sampled. Finally, the measurement procedure described in this section will be applied to obtain the eNose calibration dataset (with ethanol and acetone) and all validation datasets with ethanol and acetone. The objective is to apply the same measurement procedure in all datasets used in this paper.

5. Assessment of eNose over Time Classification Performance

Inspired by the scientific literature [10,36,38,43,44,45,46,47], this section proposes assessing the over time performance of different classification methods applied to the custom eNose design: SOM, KNN(PCA), and LDA. We applied a brute-force strategy to determine the best input data format (computed from the raw resistive data provided by the eNose) to maximize the success rate of the classifiers: the raw resistance, the raw conductance, the normalized resistance, and the normalized conductance. We have tested other classification methods without obtaining remarkable results.
The assessment performed in this work is based on repeatedly conducting the same calibration experiment. The result of the first calibration experiment is used as a reference to calibrate the classifiers, and the rest of the calibration experiments are used to validate the proposed classification methods. This procedure is applied to have a similar dynamic evolution in the calibration and validation experiments.
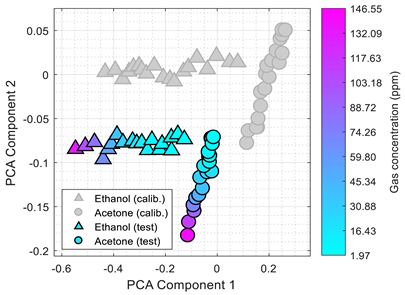
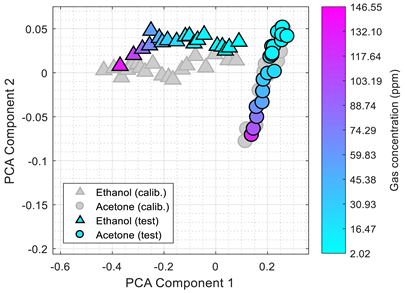
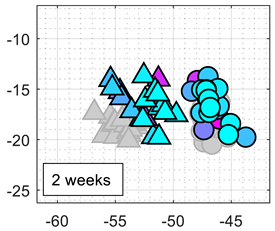
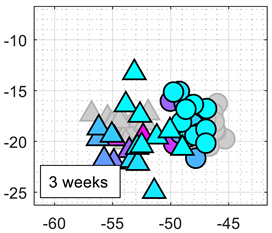
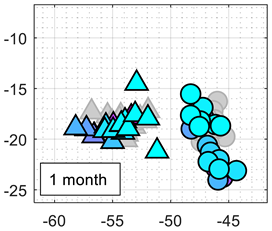
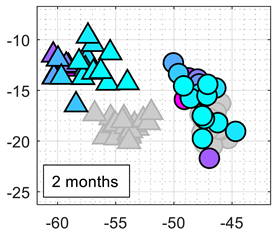
Before presenting the results of this assessment, we want to highlight the reason that motivated the implementation of a classification technique based on KNN(PCA) in the initial development of the eNose presented in [32]. Table 3 shows the experimental results obtained in this paper using the 2D PCA projection obtained during the calibration of the eNose with ethanol (triangle, gray) and acetone (circle, gray). This calibration data (in gray) is plotted just as a comparative reference. Table 3 also shows the projection of eNose test data obtained one week and one month after the calibration. The projection of the test data of ethanol (triangle, colored) and acetone (circle, colored) also depict the absolute concentration simultaneously measured with the PID using a color-map scale. The common characteristic of all clusters represented in Table 3 is the radial distribution of the concentration of the volatiles measured, with a relative origin located in the upper-right part of the 2D PCA space and a relative maximum in the lower-left part of the 2D PCA space. This seemingly radial distribution pointed us to the possibility of estimating the concentration of the volatile directly from this 2D PCA space and to the possibility to directly estimate gas mixtures. However, we have not been successful in this analysis. Similarly to Table 1, Table 3 shows a shift in the clusters of ethanol and acetone represented in the 2D PCA projection space obtained during the calibration, reducing the chances of correctly distinguishing between the two volatile substances.
Table 4 and Table 5 summarize the over time performance of the eNose used in this paper. The methods assessed have been described in the Methods section and are labeled as SOM(X), k-NN(PCA(X)), and LDA(X), where X is the format of the data gathered from the eNose: R is a vector composed of the 16 raw resistance values of the sensing layer of the 16 MOX gas sensors, C is a vector composed of the 16 conductance values computed from the 16 raw resistances of the sensing layers, R ¯ is a vector composed of the 14 normalized resistance values computed from the 16 raw resistance values of the sensing layers, and similarly C ¯ is a vector composed of the 14 normalized conductance values computed from the 16 raw resistances of the sensing layers. In the normalized cases R ¯ and C ¯ , the values corresponding to sensors 13 and 4 are not included in the data vectors because such normalized values (1.0 and 0.0, respectively) do not change during the measurements. At this point, it is important to note that the calibration of the classifiers has been performed by collectively analyzing all data samples obtained during the calibration. In contrast, the validation of the classifiers has been evaluated individually (sample by sample). The statistics of correct ethanol classification, correct acetone classification, and true positives provided in Table 4 and Table 5 have been computed individually, classifying 19–20 eNose measurements obtained with ethanol and 19–20 eNose measurements obtained with acetone. The experimental measurement procedure used in these tests is the same used during the calibration to gather comparative information from the eNose and the PID.
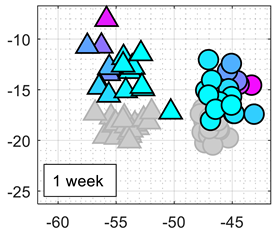
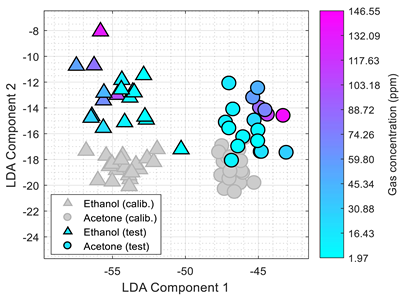
Table 4 summarizes the performance of the classifier obtained after 1, 2, and 3 weeks of the continuous eNose test. The worst classification performances were obtained with SOM, probably because the initial training of the nodes of the net of the SOM cannot correct the drift of the resistance/conductance of the sensing layer of the MOX gas sensors. The best classification results were obtained with LDA applied to the raw resistance R and the normalized conductance C ¯ provided by the eNose. The figures in the first-column of the table present the comparative projection of all the test data C T E S T ¯ (representing the 38 normalized conductance C ¯ vector values individually tested: 19 corresponding to ethanol and 19 to acetone) into the 2D space defined by the two principal components obtained during the LDA analysis of the calibration data C C A L I B R A T I O N ¯ (obtained from 38 calibration samples: 19 obtained with ethanol and 19 obtained with acetone). The color-map scale used in Table 4 is the same as the one used in Table 3. These comparative illustrations show that the LDA projection of the information gathered by the eNose (evaluated as normalized conductance, C ¯ ) is robust against the drift in bias, sensitivity and/or specificity of the MOX gas sensors, so the volatiles classification in this 2D projected space will be less challenging and more accurate. Finally, the performance of the classifiers obtained with the classification method k-NN(PCA(R)) is similar to those obtained in [32] with a different measurement setup.
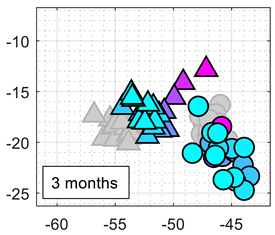
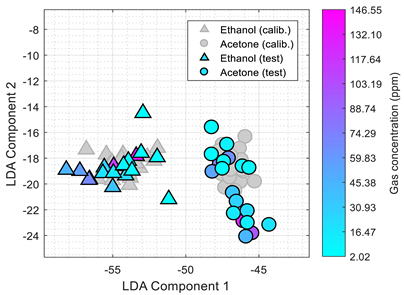
Similarly, Table 5 summarizes the performance of the classifiers obtained after 1, 2, and 3 months relative to the initial calibration. The color-map scale used in Table 5 is the same as the one used in Table 3. It can be expected to obtain worse classification results because of MOX gas sensors drift, but the LDA applied to the normalized conductance still provides the best classification results. The first-column image compares the projection of the normalized conductance of the calibration and test data samples in the 2D LDA space. These images show that the LDA projection can partially compensate for the drift in bias, sensitivity and/or specificity of the MOX gas sensors.
Finally, Table 6 summarizes and ranks the performance of all the classifiers presented in this paper in combination with all data formats assessed. The classification method used previously in [32] was obtained with the application of k-NN to the PCA projection of the eNose data (the 2D projection is defined by the two principal components obtained when applying PCA to the calibration data), and showed an average true positive classification of 84%. Table 6 shows that this average percentage can be improved to up to 90% by evaluating the conductance of the data gathered by the eNose. However, the best classifier performance was obtained when applying LDA to the normalized conductance of the data gathered by the eNose with an average true positive classification percentage of 97%. That represents an improvement of 4% relative to the results obtained when applying LDA to the raw resistance data provided by the eNose. The results obtained during the experimental stage of this work were achieved in laboratory conditions; thus, applying the same classification techniques in real application conditions could worsen the classification results.

6. Discussion

The results presented in Table 4, Table 5 and Table 6 showed the classification results obtained with the classification methods assessed in this paper. The best classification performances were obtained when the raw resistance data provided by the eNose was processed as conductance, normalized (avoiding the normalized values: 1.0 and 0.0, and thus, reducing the dimension of the eNose data from 16D to 14D), and finally classified based on the principal components obtained by applying the LDA method with the initial calibration data (also processed as normalized conductance). This LDA ( C ¯ ) method has proven to be the most robust against drift in MOX gas sensor bias, sensitivity and/or specificity during a three-month evaluation period. The second-best classification method, LDA ( R ), was totally unexpected as it directly processes the raw resistance data from the eNose without any normalization. It is also noticeable that the LDA applied to the (non-normalized) conductance of the sensing resistance of the 16 MOX gas sensors (LDA ( C ) method) has also resulted in the worst method of the 12 classification methods analyzed. These different classification results obtained with LDA pointed out the relevance of selecting the adequate representation of the data and the adequate classification method [10]. The average classification results described in Table 6 agree with the average results available in the scientific literature [10,36,38,43,44,45,46,47].
Marco et al. [43] reported the use of SOM with a classification success of 97% when analyzing the absolute normalized conductance of an eNose composed of 6 different types of MOX gas sensors in time windows of minutes and decay in the classification performances for larger evaluations. Comparatively, Table 4 reports the application of SOM with a success of 84% when analyzing the resistance, 74% when analyzing the relative normalized resistance, 68% when analyzing the conductance, and 53% when analyzing the relative normalized conductance after a time window of 1 week. On average, Table 6 reports average performances in a range from 66% (SOM ( C ) case, based on the classification of the conductance of the 16 MOX gas sensors:) to 81% (SOM ( R ) case, based on the classification of the resistance).
Hidayat et al. [10] evaluated the classification performances of an eNose composed of 8 different MOX gas sensors in a practical classification application; assessing different statistical preprocessing methods applied to the time-dynamic response of each MOX gas sensor for improved feature extraction instead of directly classifying the data gathered from the eNose. Hidayat et al. [10], Tiele et al. [46], and Arroyo et al. [47] used PCA as a tool to visually interpret and discuss the clusters of the data, but no additional techniques were applied to classify these clusters from the PCA projection directly. Instead, Hidayat et al. [10] compared different supervised multivariable classification methods obtaining an accuracy higher than 95% with the LDA method, although in a short time evaluation. Comparatively, Table 4, Table 5 and Table 6 report similar LDA classification performances for a specific preprocessing strategy applied to the data gathered from the eNose in a longer time evaluation. Specifically, Table 6 reports very different LDA classification performances that vary from 97% (LDA ( C ¯ ) case, based on the classification of the normalized conductance of the 16 MOX gas sensors) to 56% (SOM ( R ) case, based on the classification of the raw resistance).
In our previous work with this eNose [32], the volatile classification was based on the combined use of PCA for dimension reduction and k-NN for classification (KNN(PCA ( R )) case) with an average success rate of 97% two days after the evaluation and 77% two weeks after the calibration. This paper used a different measurement setup but with similar classification results (Table 4): 76% after one week from the calibration and 76% after two weeks. Unexpectedly, these classification performances increased up to 84% and higher after three weeks of use. On average, Table 6 reports classification performances of 84% but with a variance that precludes the practical application of this combined classification method for this application.
Table 7 is finally provided to illustrate the differences between the dimensional reduction performed by PCA (Table 3) and LDA (Table 7). Table 3 and Table 7 show the graphical representation of the calibration data and the test data obtained one week after the calibration (Table 4, 1-week case) and one month (Table 5, 1-month case) after the calibration. Table 3 showed that the location of the test data projected in the 2D PCA space shifted but maintained a radial distribution of volatile concentrations. This cluster shift has been avoided in the LDA projection (Table 7), improving the classification success. Still, the LDA projection does not show any radial distribution (or any other observable pattern) of the volatile concentration. However, this factor is not relevant in this application focused on volatile classification.

7. Conclusions and Future Work

This paper has assessed the over time performance of an eNose composed of an array of single-type miniature MOX gas sensors in an application tailored to classify two volatiles. The advantages of using the eNose proposed in this paper instead of a portable gas chromatography instrument are the reduced volume of the eNose and the low power supply requirements, which are as low as 0.9 W in a continuous operation. These two advantages make this eNose suitable for battery-powered applications in the case of expecting volatile concentrations in ppm. However, the advantage of a portable gas chromatography instrument is a lower limit of detection, which can be enhanced in the case of using a preconcentrator that increases the concentration of the substance to be identified before the instrumental analysis. This preconcentrator device concept is not available in an eNose using MOX gas sensors.
The eNose used in this paper was initially evaluated in previous work, concluding that an array of single-type MOX gas sensors can classify two volatiles. However, the promising classification performances worsened in a three-week evaluation. This paper has assessed the over time performance of different classification methods applied to process the information gathered with this eNose. The best over time classification performance has been obtained when applying a linear discrimination analysis (LDA) to the normalized conductance of the sensing layer of the MOX gas sensors. This supervised LDA analysis has avoided the effect of the drift of the MOX gas sensors in a three-month evaluation, probably because of the use of independent Gaussian mixture models to describe the two clusters of calibration data.
Future works will assess the use of this eNose in a real application as a gas leak detector. They will also address the optimization of the individual configuration parameters of the 16 MOX gas sensors to further analyze their classification capabilities and the limit of detection of different substances.
Author Contributions

Investigation, J.P., E.C. and E.R.; Resources, J.P.; Software, E.C.; Writing—original draft, E.C. and E.R.; Writing—review & editing, J.P. All authors have read and agreed to the published version of the manuscript.

Funding

This research received no external funding.

Conflicts of Interest

The authors declare no conflict of interest.

References

  1. Pelosi, P.; Zhu, J.; Knoll, W. From Gas Sensors to Biomimetic Artificial Noses. Chemosensors 2018, 6, 32. [Google Scholar] [CrossRef] [Green Version]
  2. Lara-Ibeas, I.; Rodríguez Cuevas, A.; Le Calvé, S. Recent developments and trends in miniaturized gas preconcentrators for portable gas chromatography systems: A review. Sens. Actuators B Chem. 2021, 346, 130449. [Google Scholar] [CrossRef]
  3. Covington, J.A.; Marco, S.; Persaud, K.C.; Schiffman, S.S.; Nagle, H.T. Artificial Olfaction in the 21st Century. IEEE Sens. J. 2021, 21, 12969–12990. [Google Scholar] [CrossRef]
  4. Khan, S.; Newport, D.; Le Calvé, S. A Sensitive and Portable Deep-UV Absorbance Detector with a Microliter Gas Cell Compatible with Micro GC. Chemosensors 2021, 9, 63. [Google Scholar] [CrossRef]
  5. Meixner, H.; Lampe, U. Metal oxide sensors. Sens. Actuators B Chem. 1996, 33, 198–202. [Google Scholar] [CrossRef]
  6. Liu, H.; Zhang, L.; Li, K.H.H.; Tan, O.K. Microhotplates for Metal Oxide Semiconductor Gas Sensor Applications—Towards the CMOS-MEMS Monolithic Approach. Micromachines 2018, 9, 557. [Google Scholar] [CrossRef] [PubMed] [Green Version]
  7. Gardner, J.W.; Shin, H.W.; Hines, E.L. An electronic nose system to diagnose illness. Sens. Actuators B Chem. 2000, 70, 19–24. [Google Scholar] [CrossRef]
  8. Sarig, Y. Potential applications of artificial olfactory sensing for quality evaluation of fresh produce. J. Agric. Eng. Res. 2000, 77, 239–258. [Google Scholar] [CrossRef]
  9. Ampuero, S.; Bosset, J.O. The electronic nose applied to diary products: A review. Sens. Actuators B Chem. 2003, 94, 1–12. [Google Scholar] [CrossRef]
  10. Hidayat, S.N.; Triyana, K.; Fauzan, I.; Julian, T.; Lelono, D.; Yusuf, Y.; Ngadiman, N.; Veloso, A.C.A.; Peres, A.M. The Electronic Nose Coupled with Chemometric Tools for Discriminating the Quality of Black Tea Samples In Situ. Chemosensors 2019, 7, 29. [Google Scholar] [CrossRef] [Green Version]
  11. Wilson, A.D. Applications of Electronic-Nose Technologies for Noninvasive Early Detection of Plant, Animal and Human Diseases. Chemosensors 2018, 6, 45. [Google Scholar] [CrossRef] [Green Version]
  12. Wang, C.; Yin, L.; Zhang, L.; Xiang, D.; Gao, R. Metal Oxide Gas Sensors: Sensitivity and Influencing Factors. Sensors 2010, 10, 2088–2106. [Google Scholar] [CrossRef] [Green Version]
  13. Chiu, S.-W.; Tang, K.-T. Towards a Chemiresistive Sensor-Integrated Electronic Nose: A Review. Sensors 2013, 13, 14214–14247. [Google Scholar] [CrossRef] [Green Version]
  14. Clements, A.L.; Griswold, W.G.; Rs, A.; Johnston, J.E.; Herting, M.M.; Thorson, J.; Collier-Oxandale, A.; Hannigan, M. Low-cost air quality monitoring tools: From research to practice (A workshop Summary). Sensors 2017, 17, 2478. [Google Scholar] [CrossRef] [PubMed] [Green Version]
  15. Castell, N.; Dauge, F.R.; Schneider, P.; Vogt, M.; Lerner, U.; Fishbain, B.; Broday, D.; Bartonova, A. Can commercial low-cost sensor platforms contribute to air quality monitoring and exposure estimates? Environ. Int. 2017, 99, 293–302. [Google Scholar] [CrossRef]
  16. Matthews, T.; Iqbal, M.; Gonzalez-Velez, H. Non-linear machine learning with active sampling for MOX drift compensation. In Proceedings of the 2018 IEEE/ACM 5th International Conference on Big Data Computing Applications and Technologies (BDCAT), Zurich, Switzerland, 17–20 December 2018; pp. 61–70. [Google Scholar]
  17. Wenzel, M.J.; Mensah-Brown, A.; Josse, F.; Yaz, E.E. Online drift compensation for chemical sensors using estimation theory. IEEE Sens. J. 2011, 11, 225–232. [Google Scholar] [CrossRef]
  18. Marco, S.; Gutierrez-Galvez, A. Signal and data processing for machine olfaction and chemical sensing: A review. IEEE Sens. J. 2012, 12, 3189–3214. [Google Scholar] [CrossRef]
  19. Nimsuk, N.; Nakamoto, T. Study on the odor classification in dynamical concentration robust against humidity and temperature changes. Sens. Actuators B Chem. 2008, 134, 252–257. [Google Scholar] [CrossRef]
  20. De Vito, S.; Massera, E.; Piga, M.; Martinotto, L.; di Francia, G. On field calibration of an electronic nose for benzene estimation in an urban pollution monitoring scenario. Sens. Actuators B Chem. 2008, 129, 750–757. [Google Scholar] [CrossRef]
  21. Vembu, S.; Vergara, A.; Muezzinoglu, M.K.; Huerta, R. On time series features and kernels for machine olfaction. Sens. Actuators B Chem. 2012, 174, 535–546. [Google Scholar] [CrossRef]
  22. Jing, Y.-Q.; Meng, Q.-H.; Qi, P.-F.; Cao, M.-L.; Zeng, M.; Ma, S.-G. A bioinspired neural network for data processing in an electronic nose. IEEE Trans. Instrum. Meas. 2016, 65, 2369–2380. [Google Scholar] [CrossRef]
  23. Phaisangittisagul, E.; Nagle, H.T. Predicting odor mixture’s responses on machine olfaction sensors. Sens. Actuators B Chem. 2011, 155, 473–482. [Google Scholar] [CrossRef]
  24. Burgués, J.; Marco, S. Multivariate estimation of the limit of detection by orthogonal partial least squares in temperature-modulated MOX sensors. Anal. Chim. Acta 2018, 1019, 49–64. [Google Scholar] [CrossRef]
  25. Grover, A.; Lall, B. A Novel Method for Removing Baseline Drifts in Multivariate Chemical Sensor. IEEE Trans. Instr. Meas. 2020, 69, 7306–7316. [Google Scholar] [CrossRef]
  26. Leon-Medina, J.X.; Pineda-Muñoz, W.A.; Burgos, D.A.T. Joint Distribution Adaptation for Drift Correction in Electronic Nose Type Sensor Arrays. IEEE Access 2020, 8, 134413–134421. [Google Scholar] [CrossRef]
  27. Zhang, S.; Tian, F.; Covington, J.A.; Li, H.; Zhao, L.; Liu, R.; Qian, J.; Liu, B. A Universal Calibration Method for Electronic Nose Based on Projection on to Convex Sets. IEEE Trans. Instrum. Meas. 2021, 70, 2516012. [Google Scholar] [CrossRef]
  28. Leon-Medina, J.X.; Parés, N.; Anaya, M.; Tibaduiza, D.A.; Pozo, F. Data Classification Methodology for Electronic Noses Using Uniform Manifold Approximation and Projection and Extreme Learning Machine. Mathematics 2022, 10, 29. [Google Scholar] [CrossRef]
  29. Burgués, J.; Deseada-Esclapez, M.; Doñate, S.; Marco, S. RHINOS: A lightweight portable electronic nose for real-time odor quantification in wastewater treatment plants. IScience 2021, 24, 103371. [Google Scholar] [CrossRef] [PubMed]
  30. Palacio, F.; Fonollosa, J.; Burgués, J.; Gómez, J.M.; Marco, S. Pulsed-temperature metal oxide gas sensors for microwatt power consumption. IEEE Access 2020, 8, 70938–70946. [Google Scholar] [CrossRef]
  31. Chandra Kishore, S.; Samikannu, K.; Atchudan, R.; Perumal, S.; Edison, T.N.J.I.; Alagan, M.; Sundramoorthy, A.K.; Lee, Y.R. Smartphone-Operated Wireless Chemical Sensors: A Review. Chemosensors 2022, 10, 55. [Google Scholar] [CrossRef]
  32. Palacín, J.; Rubies, E.; Clotet, E.; Martínez, D. Classification of Two Volatiles Using an eNose Composed by an Array of 16 Single-Type Miniature Micro-Machined Metal-Oxide Gas Sensors. Sensors 2022, 22, 1120. [Google Scholar] [CrossRef] [PubMed]
  33. Pearson, K. On Lines and Planes of Closest Fit to Systems of Points in Space. Lond. Edinb. Dublin Philos. Mag. J. Sci. 1901, 2, 559–572. [Google Scholar] [CrossRef] [Green Version]
  34. Perera, A.; Papamichail, N.; Barsan, N.; Weimar, U.; Marco, S. Online novelty detection by recursive dynamic principal component analysis and gas sensor arrays under drift conditions. IEEE Sens. J. 2006, 6, 770–783. [Google Scholar] [CrossRef]
  35. Fix, E.; Hodges, J.L. Discriminatory Analysis. Nonparametric Discrimination: Consistency Properties; Technical Report 4; USAF School of Aviation Medicine: Randolph Field, TX, USA, 1951. [Google Scholar]
  36. Palacín, J.; Martínez, D.; Clotet, E.; Pallejà, T.; Burgués, J.; Fonollosa, J.; Pardo, A.; Marco, S. Application of an Array of Metal-Oxide Semiconductor Gas Sensors in an Assistant Personal Robot for Early Gas Leak Detection. Sensors 2019, 19, 1957. [Google Scholar] [CrossRef] [PubMed] [Green Version]
  37. Monroy, J.G.; Gonzalez-Jimenez, J. Gas classification in motion: An experimental analysis. Sens. Actuators B Chem. 2017, 240, 1205–1215. [Google Scholar] [CrossRef]
  38. Fan, H.; Hernandez Bennetts, V.; Schaffernicht, E.; Lilienthal, A.J. Towards Gas Discrimination and Mapping in Emergency Response Scenarios Using a Mobile Robot with an Electronic Nose. Sensors 2019, 19, 685. [Google Scholar] [CrossRef] [PubMed] [Green Version]
  39. Kohonen, T. Self-organized formation of topologically correct feature maps. Biol. Cybern. 1982, 43, 59–69. [Google Scholar] [CrossRef]
  40. Bishop, C.M. Pattern Recognition and Machine Learning (Information Science and Statistics); Springer: Berlin/Heidelberg, Germany, 2006. [Google Scholar]
  41. Fisher, R.A. The Use of Multiple Measurements in Taxonomic Problems. Ann. Eugen. 1936, 7, 179–188. [Google Scholar] [CrossRef]
  42. Guo, Y.; Hastie, T.; Tibshirani, R. Regularized linear discriminant analysis and its application in microarrays. Biostatistics 2007, 8, 86–100. [Google Scholar] [CrossRef] [PubMed] [Green Version]
  43. Marco, S.; Ortega, A.; Pardo, A.; Samitier, J. Gas identification with tin oxide sensor array and self-organizing maps: Adaptive correction of sensor drifts. IEEE Trans. Inst. Meas. 1998, 47, 316–321. [Google Scholar] [CrossRef] [Green Version]
  44. Arnold, C.; Harms, M.; Goschnick, J. Air quality monitoring and fire detection with the Karlsruhe electronic micronose KAMINA. IEEE Sens. J. 2002, 2, 179–188. [Google Scholar] [CrossRef]
  45. Guo, D.; Zhang, D.; Li, N.; Zhang, L.; Yang, J. A Novel Breath Analysis System Based on Electronic Olfaction. IEEE Trans. Biomed. Eng. 2010, 57, 2753–2763. [Google Scholar] [CrossRef]
  46. Tiele, A.; Wicaksono, A.; Ayyala, S.K.; Covington, J.A. Development of a Compact, IoT-Enabled Electronic Nose for Breath Analysis. Electronics 2020, 9, 84. [Google Scholar] [CrossRef] [Green Version]
  47. Arroyo, P.; Meléndez, F.; Suárez, J.I.; Herrero, J.L.; Rodríguez, S.; Lozano, J. Electronic Nose with Digital Gas Sensors Connected via Bluetooth to a Smartphone for Air Quality Measurements. Sensors 2020, 20, 786. [Google Scholar] [CrossRef] [PubMed] [Green Version]
Figure 1. Detail of the custom eNose implementation composed of sixteen single-type MOX gas sensors embedded in sixteen BME680 sensor devices.
Chemosensors 10 00118 g001
Figure 2. Measurement setup composed of a PID, the redundant power supply for the eNose, a transparent box containing the eNose, and a small glass plate to deposit the volatile in liquid form.
Chemosensors 10 00118 g002
Figure 3. Result of an eNose calibration experiment with ethanol: (a) evolution of resistance of the sensing layer of 16 MOX gas sensors embedded in the 16 BME680 sensors, and (b) reference ethanol concentration measured with the PID (assumed as the ground truth concentration).
Chemosensors 10 00118 g003
Figure 4. Results of an eNose calibration experiment with acetone: (a) evolution of resistance of the sensing layer of the 16 MOX gas sensors embedded in the 16 BME680 sensors, and (b) reference acetone concentration measured with the PID (assumed as the ground truth concentration).
Chemosensors 10 00118 g004aChemosensors 10 00118 g004b
Figure 5. Representation of the normalized resistance of the sensing layer of the 16 MOX gas sensors (labeled with different colors) presented in Figure 3 and Figure 4, relative to the gas concentration measured with the PID: (a) calibration with ethanol and (b) calibration with acetone. The alternative case (c) depicts the normalized resistance obtained in 21 consecutive measurements with air (without any volatile).
Chemosensors 10 00118 g005aChemosensors 10 00118 g005b
Figure 6. Representation of the volatile calibration results: mean resistance of the sensing layer of the 16 MOX gas sensors relative to the concentration of ethanol and acetone measured with the PID.
Chemosensors 10 00118 g006
Table 1. Projection of the calibration data of ethanol and acetone using PCA. Comparative projection of new test data of ethanol and acetone obtained one week (left column) and two weeks (right column) after the calibration. Unpublished results from [32].
PCA Projection of the eNose Data
calibration and test results (one week after calibration)calibration and test results (two weeks after calibration)
Chemosensors 10 00118 i001 Chemosensors 10 00118 i002
Table 2. Configuration parameters of the 16 MOX gas sensors used in the eNose and maximum relative variation of the normalized resistance of the sensing layer during the detection of ethanol and acetone.
Sensor IDTarget Heater Temperature (°C)Heat Up Duration (ms)Relative Variation of the
Normalized Resistance:
3–150 ppm of Ethanol
Relative Variation of the
Normalized Resistance:
3–146 ppm of Acetone
13501503.15%4.01%
23501509.51%4.86%
335015035.02%12.07%
43501500.00% (Min. reference)0.00% (Min. reference)
535015011.66%4.23%
63501501.91%2.96%
735015017.66%4.01%
83501502.63%1.29%
935015028.08%9.96%
103501506.77%1.73%
113501506.18%3.56%
1235015010.45%4.42%
133501500.00% (Max. reference)0.00% (Max. reference)
143501505.14%3.83%
153501503.72%3.67%
163501504.40%3.75%
Table 3. Calibration data of ethanol (triangle, gray) and acetone (circle, gray) are represented using the PCA projection obtained from this calibration data. Comparative projection of additional test data of ethanol (triangle, colored) and acetone (circle, colored) obtained one week (left column) and one month (right column) after the calibration. The absolute concentration of the volatiles measured during the tests is depicted with the attached color-map scale.
2D PCA Projection of the eNose Data (Evaluated as Resistance, R)
calibration and test results (one week after calibration)calibration and test results (one month after calibration)
Chemosensors 10 00118 i003 Chemosensors 10 00118 i004
Table 4. Classification results obtained with the different classification methods assessed: comparative projection of the test data into the space defined by the two principal components obtained during the LDA analysis of the calibration data C C A L I B R A T I O N ¯ , classification methods assessed, samples correctly classified as ethanol (triangle) and acetone (circle), and average true positives.
C T E S T ¯     LDA   ( C C A L I B R A T I O N ¯ ) Classification MethodEthanolAcetoneTrue Positives
Chemosensors 10 00118 i005 SOM   ( R ) 68%100%84%
SOM   ( C ) 37%100%68%
SOM   ( R ¯ )100%47%74%
SOM   ( C ¯ )100%5%53%
KNN   ( PCA   ( R ) ) 100%53%76%
KNN   ( PCA   ( C ) ) 100%79%89%
KNN   ( PCA   ( R ¯ ) ) 100%0%50%
KNN   ( PCA   ( C ¯ ) ) 100%0%50%
LDA   ( R ) 100%100%100%
LDA   ( C ) 100%0%50%
LDA   ( R ¯ ) 95%100%97%
LDA   ( C ¯ ) 95%100%97%
Chemosensors 10 00118 i006 SOM   ( R ) 63%100%82%
SOM   ( C ) 32%100%66%
SOM   ( R ¯ ) 95%53%74%
SOM   ( C ¯ ) 95%47%71%
KNN   ( PCA   ( R ) ) 100%53%76%
KNN   ( PCA   ( C ) ) 89%68%79%
KNN   ( PCA   ( R ¯ ) ) 100%0%50%
KNN   ( PCA   ( C ¯ ) ) 100%0%50%
LDA   ( R ) 100%100%100%
LDA   ( C ) 100%47%74%
LDA   ( R ¯ ) 79%100%89%
LDA   ( C ¯ ) 95%100%97%
Chemosensors 10 00118 i007 SOM   ( R ) 63%100%82%
SOM   ( C ) 32%100%66%
SOM   ( R ¯ ) 47%95%71%
SOM   ( C ¯ ) 53%89%71%
KNN   ( PCA   ( R ) ) 84%84%84%
KNN   ( PCA   ( C ) ) 89%95%92%
KNN   ( PCA   ( R ¯ ) ) 74%79%76%
KNN   ( PCA   ( C ¯ ) ) 74%63%68%
LDA   ( R ) 100%100%100%
LDA   ( C ) 0%74%37%
LDA   ( R ¯ ) 95%79%87%
LDA   ( C ¯ ) 89%100%95%
Table 5. Classification results obtained with the different classification methods assessed: comparative projection of the test data in the space defined by the two principal components of the LDA analysis of the calibration data, classification methods assessed, samples correctly classified as ethanol (triangle) and acetone (circle), and average true positives.
C T E S T ¯     LDA   ( C C A L I B R A T I O N ¯ ) Classification MethodEthanolAcetoneTrue Positives
Chemosensors 10 00118 i008 SOM   ( R ) 47%100%74%
SOM   ( C ) 21%100%61%
SOM   ( R ¯ ) 74%100%87%
SOM   ( C ¯ ) 74%100%87%
KNN   ( PCA   ( R ) ) 79%100%89%
KNN   ( PCA   ( C ) ) 74%100%87%
KNN   ( PCA   ( R ¯ ) ) 100%100%100%
KNN   ( PCA   ( C ¯ ) ) 100%100%100%
LDA   ( R ) 100%100%100%
LDA   ( C ) 42%95%68%
LDA   ( R ¯ ) 100%100%100%
LDA   ( C ¯ ) 100%100%100%
Chemosensors 10 00118 i009 SOM   ( R ) 65%100%83%
SOM   ( C ) 35%100%68%
SOM   ( R ¯ ) 100%45%73%
SOM   ( C ¯ ) 100%10%55%
KNN   ( PCA   ( R ) ) 100%80%90%
KNN   ( PCA   ( C ) ) 100%95%98%
KNN   ( PCA   ( R ¯ ) ) 100%0%50%
KNN   ( PCA   ( C ¯ ) ) 100%0%50%
LDA   ( R ) 100%20%60%
LDA   ( C ) 100%0%50%
LDA   ( R ¯ ) 100%50%75%
LDA   ( C ¯ ) 100%100%100%
Chemosensors 10 00118 i010 SOM   ( R ) 70%100%85%
SOM   ( C ) 40%100%71%
SOM   ( R ¯ ) 100%71%85%
SOM   ( C ¯ ) 100%67%83%
KNN   ( PCA   ( R ) ) 100%81%90%
KNN   ( PCA   ( C ) ) 100%86%93%
KNN   ( PCA   ( R ¯ ) ) 100%0%49%
KNN   ( PCA   ( C ¯ ) ) 100%10%54%
LDA   ( R ) 100%100%100%
LDA   ( C ) 100%14%56%
LDA   ( R ¯ ) 100%10%54%
LDA   ( C ¯ ) 85%100%93%
Table 6. Summary of the classifiers performance assessed in this paper.
Classification MethodAverage True Positives
(min)
Average True Positives
(max)
Average True Positives
LDA   ( C ¯ ) 93%100%97%
LDA   ( R ) 60%100%93%
KNN   ( PCA   ( C ) ) 79%98%90%
KNN   ( PCA   ( R ) ) 176%90%84%
LDA   ( R ¯ ) 54%100%84%
SOM   ( R ) 74%85%81%
SOM   ( R ¯ ) 71%87%77%
SOM   ( C ¯ ) 53%87%70%
SOM   ( C ) 61%71%66%
KNN   ( PCA   ( R ¯ ) ) 49%100%63%
KNN   ( PCA   ( C ¯ ) ) 50%100%62%
LDA   ( C ) 37%74%56%
1 Classification method used originally in [32].
Table 7. Calibration data of ethanol (triangle, gray) and acetone (circle, gray) are represented using the LDA projection obtained from this calibration data. Comparative projection of additional test data of ethanol (triangle, colored) and acetone (circle, colored) obtained one week (left column) and one month (right column) after the calibration. The absolute concentration of the volatiles measured during the tests is depicted with the attached color-map scale. The data represented is the same previously shown in Table 3.
2 D   LDA   Projection   of   the   eNose   Data   ( Evaluated   as   Normalized   Conductance ,   C ¯ )
calibration and test results (one week after calibration)calibration and test results (one month after calibration)
Chemosensors 10 00118 i011 Chemosensors 10 00118 i012
Publisher’s Note: MDPI stays neutral with regard to jurisdictional claims in published maps and institutional affiliations.