Article

Patterning Large-Scale Nanostructured Microarrays on Coverslip for Sensitive Plasmonic Detection of Aqueous Gliadin Traces

by
Giuliocesare Casari Bariani
1,2,
Lan Zhou
1,
Simone Poggesi
1,2,
Marisa Manzano
2 and
Rodica Elena Ionescu
1,*
1
Light, Nanomaterials and Nanotechnology (L2n) Laboratory, CNRS EMR 7004, University of Technology of Troyes, 12 Rue Marie Curie, CS 42060, CEDEX, 10004 Troyes, France
2
Dipartimento di Scienze Agroalimentari, Ambientali e Animali (DI4A), Università degli Studi di Udine, Via Sondrio 2/A, 33100 Udine, Italy
*
Author to whom correspondence should be addressed.
Chemosensors 2022, 10(2), 38; https://doi.org/10.3390/chemosensors10020038
Submission received: 28 November 2021 / Revised: 15 January 2022 / Accepted: 18 January 2022 / Published: 20 January 2022
(This article belongs to the Special Issue Nanophotonic Biosensors: Challenges and Development)

Abstract

:
User-friendly devices for detecting low gliadin content in commercial foods are of extreme importance for people with gluten diseases. With this concern, the present work proposes a rapid and sensitive optical nanostructured microarrays platform for the detection of gliadin using specific anti-gliadin IgG antibodies immobilized on annealed gold nanostructures (AuNPs) obtained after the high annealing process (550 °C) of gold thin films evaporated on commercial glass coverslips. Localized Surface Plasmon Resonance (LSPR) immunosensing of gliadin in the range of 0.1 ppm to 1000 ppm is successfully achieved. In addition, the biofunctionalization protocol was used for gluten screening in five food complex products.

1. Introduction

Gluten is a complex mixture of hundreds of proteins, mainly gliadin and glutenin [1]. Unfortunately, some peptides fractions of gluten have shown negative impacts on human health, referring to allergies and intolerances. Nowadays, the regulation (EC) No. 41/2009 of the European Union fixes the limit of gluten at <20 mg/kg (20 ppm) for all foodstuffs labelled as “gluten free”. However, the label “very low gluten” can be used for foods with a gluten content about 20–100 mg/kg (100 ppm) [2,3,4].
There can be distinguished three different gluten related pathologies [5]: (a) gluten allergy, affect about 0.2–0.5% of the population [6], (b) coeliac disease-an autoimmune disorder, the most dangerous and widespread (>1.6% of the population affected) [7], (c) gluten sensitivity-a non-allergy and non-autoimmune pathology recently rediscovered [8,9]. Unfortunately, the number of patients diagnosed with gluten intolerance has been increasing in recent decades imposing a well-defined standard and organic market for gluten-free products [10]. Consequently, the development of rapid and sensitive methods for the detection of gluten in such products is crucial to assure consumer safety [11,12]. For instance, the immunological techniques based on Enzyme Linked Immunosorbent Assays (ELISA) are often used for the optical detection of large variety of (bio)analytes [13,14]. In the case of gluten screening, an official method approved by AOAC (Association of Official Agricultural Chemistry) using anti ω-gliadin antibodies in a sandwich format is reported [15]. Moreover, the Codex Alimentarius Commission has approved it as official method for hydrolyzed gluten assays [16]. On the other hand, a competitive ELISA using employing HRP-labelled G12 antibodies was employed for the detection of the toxic peptide in hydrolyzed food limit of detection of <0.5 ppm of gliadin [17].
In addition to the immunological assays, the classical methods such as mass spectrometry/chromatography techniques [18], western blot [19] and proteomic techniques [20] are often used for the detection of gluten/gliadin. However, there only few studies using PCR methods for the detection of gliadin in food products, mainly due to the degradation of the DNA content after cooking process [21]. Thus, in raw materials, a low limit of quantification of DNA/mg (20 pg of cereal) is reported [22], while the genodetection method using aptamers is considered as an important and robust alternative to antibodies [23,24].
Miniaturized biodetection tools based on biosensor technologies are suitable for the detection of traces of gluten/gliadin in food. Biosensors have two main components: a physical transducer (electrochemical, piezoelectric, calorimetric or optical) and a biological receptor (enzyme, antibody, DNA, cells) [25,26,27,28,29,30]. An important issue in the construction of sensitive and stable biosensors concern the choice of solid substrate that will serve for the specific detection of analyte(s). Metallic gold nanoparticles (AuNPs), are used as stable and biocompatible supports that provide high surface area with relatively low cost and easy production procedures. For instance, the synthesis of AuNPs on glass supports can be easily obtained after high temperature annealing of evaporated thin gold film and specifically used in the preparation of Localized Surface Plasmon Resonance (LSPR) immunosensors for the detection atrazine herbicide [31,32]. LSPR phenomenon occurs when the AuNPs are exposed to an incident light (electromagnetic wave) and it resonates with an intrinsic oscillation of the free electron of the gold. When the frequency of oscillation of these electrons, referred to as surface plasmons, matches the frequency of incident light, i.e., at resonance, the surface plasmons give rise to strong absorption bands, light scattering and enhanced electromagnetic field on the surface of the metal nanoparticle. Due to localization of these effects, this phenomenon is termed localized surface plasmon resonance. Depending on the size of nanoparticles, the interparticle space, the composition and shape, the LSPR properties can be modelled in order to change the sensitivity of the detection system [33,34].
The aim of this study is the robust fabrication of a nanostructured microarray platform on glass coverslip for rapid multiplexing optical detection of gliadin traces in aqueous solutions. In addition, the first preliminary results on the evaluation of gliadin content in commercial food products using the LSPR sensing technique are also reported.

2. Experimental Section

2.1. Chemicals

Ethanol and acetone were obtained from Fluka (Lyon, France). 11-Mercaptoundecanoic acid (11-MUA), gliadin from wheat, polyclonal rabbit anti-Gliadin (wheat) antibodies, monoclonal anti-bovine serum albumin (BSA) antibodies produced in mouse, 1-ethyl-3-[3-dimethylaminopropyl]-carbodiimide hydrochloride (EDC) and N-hydroxysuccinimide (NHS) were purchased from Sigma-Aldrich (Schnelldorf, Germany). Phosphate buffer saline (PBS buffer, pH 7.4) was prepared using sodium chloride, sodium phosphate dibasic, and sodium phosphate monobasic salts received from Sigma (St. Quentin Fallavier, France). The deionized water (18.2 MΩ·cm) was produced by a Millipore Milli Q water purification system (Molsheim, France) and shortly sterilized to obtain ultrapure water named ddwater. All used chemicals were of analytical grade.

2.2. Instruments

The metallic evaporations on rectangular glass coverslips (24 × 60 mm, Carl Roth GmbH + Co.KG, Karlsruhe, Germany). were performed with Plassys MEB 400 (Plassys, Bestek, France), followed by annealing on a hot plate (Thermo Fisher Scientific, Waltham, MA, USA) placed in clean room conditions (ISO 5/6). Commercial transmission electron microscope (TEM) copper grids (Gilder Triple slot grid, 0.54 mm × 0.95 mm slots in a 3.05 mm copper grid, TED Pella, Redding, CA, USA) were fixed on clean glass coverslip and used for the gold evaporation process. The ultrasonic bath cleanings were performed with Elmasonic S30H.
A Tuttnauer Autoclave Steam Sterilizer 2540 mL (Tuttnauer, France) was used for the water sterilization. A VWR DRY-Line oven dry DL 53 oven was used for drying glasses before the biofunctionalization steps performed under the biological hood MSC 1, 2 ADV (Thermo-scientific, Waltham, MA, USA).
A Scanning Electron Microscope (SEM) (FEG-SU8030, Tokyo, Japan) was used for characterization the morphology of nanostructured microarray patterned coverslips.
LSPR spectra were recorded using a transmission UV–vis-NIR spectroscopy based on a white light source (DH-2000-BAC, Ocean Optics, EW Duivan, The Netherlands), one optic fiber and a spectrometer Maya 2000 Pro provided by ocean optics (Amersham, UK). All the plasmonic measurements were repeated three times.

2.3. Preparation of Gliadin and Antibodies Concentrations

Five concentrations of gliadin were optically tested (1) 1000 ppm, (2) 100 ppm, (3) 10 ppm, (4) 1 ppm and (5) 0.1 ppm. A stock solution of gliadin (80 mg/mL gliadin powder suspended in ethanol/ultrapure ddwater 6:4 v/v ratio) was prepared. All gliadin concentrations were freshly prepared before experiments using the stock solution and ddwater for dilutions.
The specific anti-IgG gliadin antibodies (100 ng/μL) and non-specific anti-IgG BSA antibodies (125 ng/μL) concentrations were prepared using ultrapure sterilized water.

2.4. Choice of Commercial Gluten-Free Products

Five commercial foods were purchased from a local supermarket to test their gliadin content: (1) a vegetable powder supplement (labelled gluten-free); (2) a spicy corn snack (labelled gluten-free); (3) a rice snack; (4) rice noodles; (5) chocolate cookies (labelled gluten-free).

2.5. Extraction of Gliadin Traces from Selected Foods

In the case of food products, the extraction of gliadin was made according to Chu et al. protocol [35]. Firstly, one gram of each food was diluted in 10 mL of ultrapure sterilized water and mixed at room temperature for 6 h, then centrifuged to collect the pellet and resuspended in 10 mL of ethanol/water solution (6:4 v/v ratio). Next, the collected pellets were suspended in ethanol for overnight. The day after, the suspensions samples were centrifuged. Next, the supernatant (600 μL) was diluted in ddwater (400 μL) before used for immune-recognition events with different gliadin concentrations.

2.6. Preparation of the Gold Nanostructured TEM-Microarrays on Glass Coverslip

2.6.1. Cleaning Protocol

Rectangular coverslip was cleaned with a ddwater and detergent (Decon 90) solution (2:8, v/v ratio), at 50 °C for 15 min in a ultrasonic bath (Elmasonic S30H). After ddwater washing in ultrasonic bath at 50 °C for 5 min, the coverslip was abundantly rinsed with ddwater dried under nitrogen stream and placed on a hot plate at 100 °C for 10 min.

2.6.2. Gold Patterning through TEM-Grids

One side of the clean coverslip was modified with thin strips of tape for better adhesion of 12 three-slot cooper TEM grids to the glass, then placed on a circular support plate (Ø = 200 mm) in the evaporator. The gold evaporation (4 nm nominative thickness) was made at 1 × 10⁻⁵ Torr pressure and 25 °C with an evaporation rate of 0.03 nm/s. The resulted gold-coated coverslip was annealed on preheated hot plate at 550 °C for 3 h.

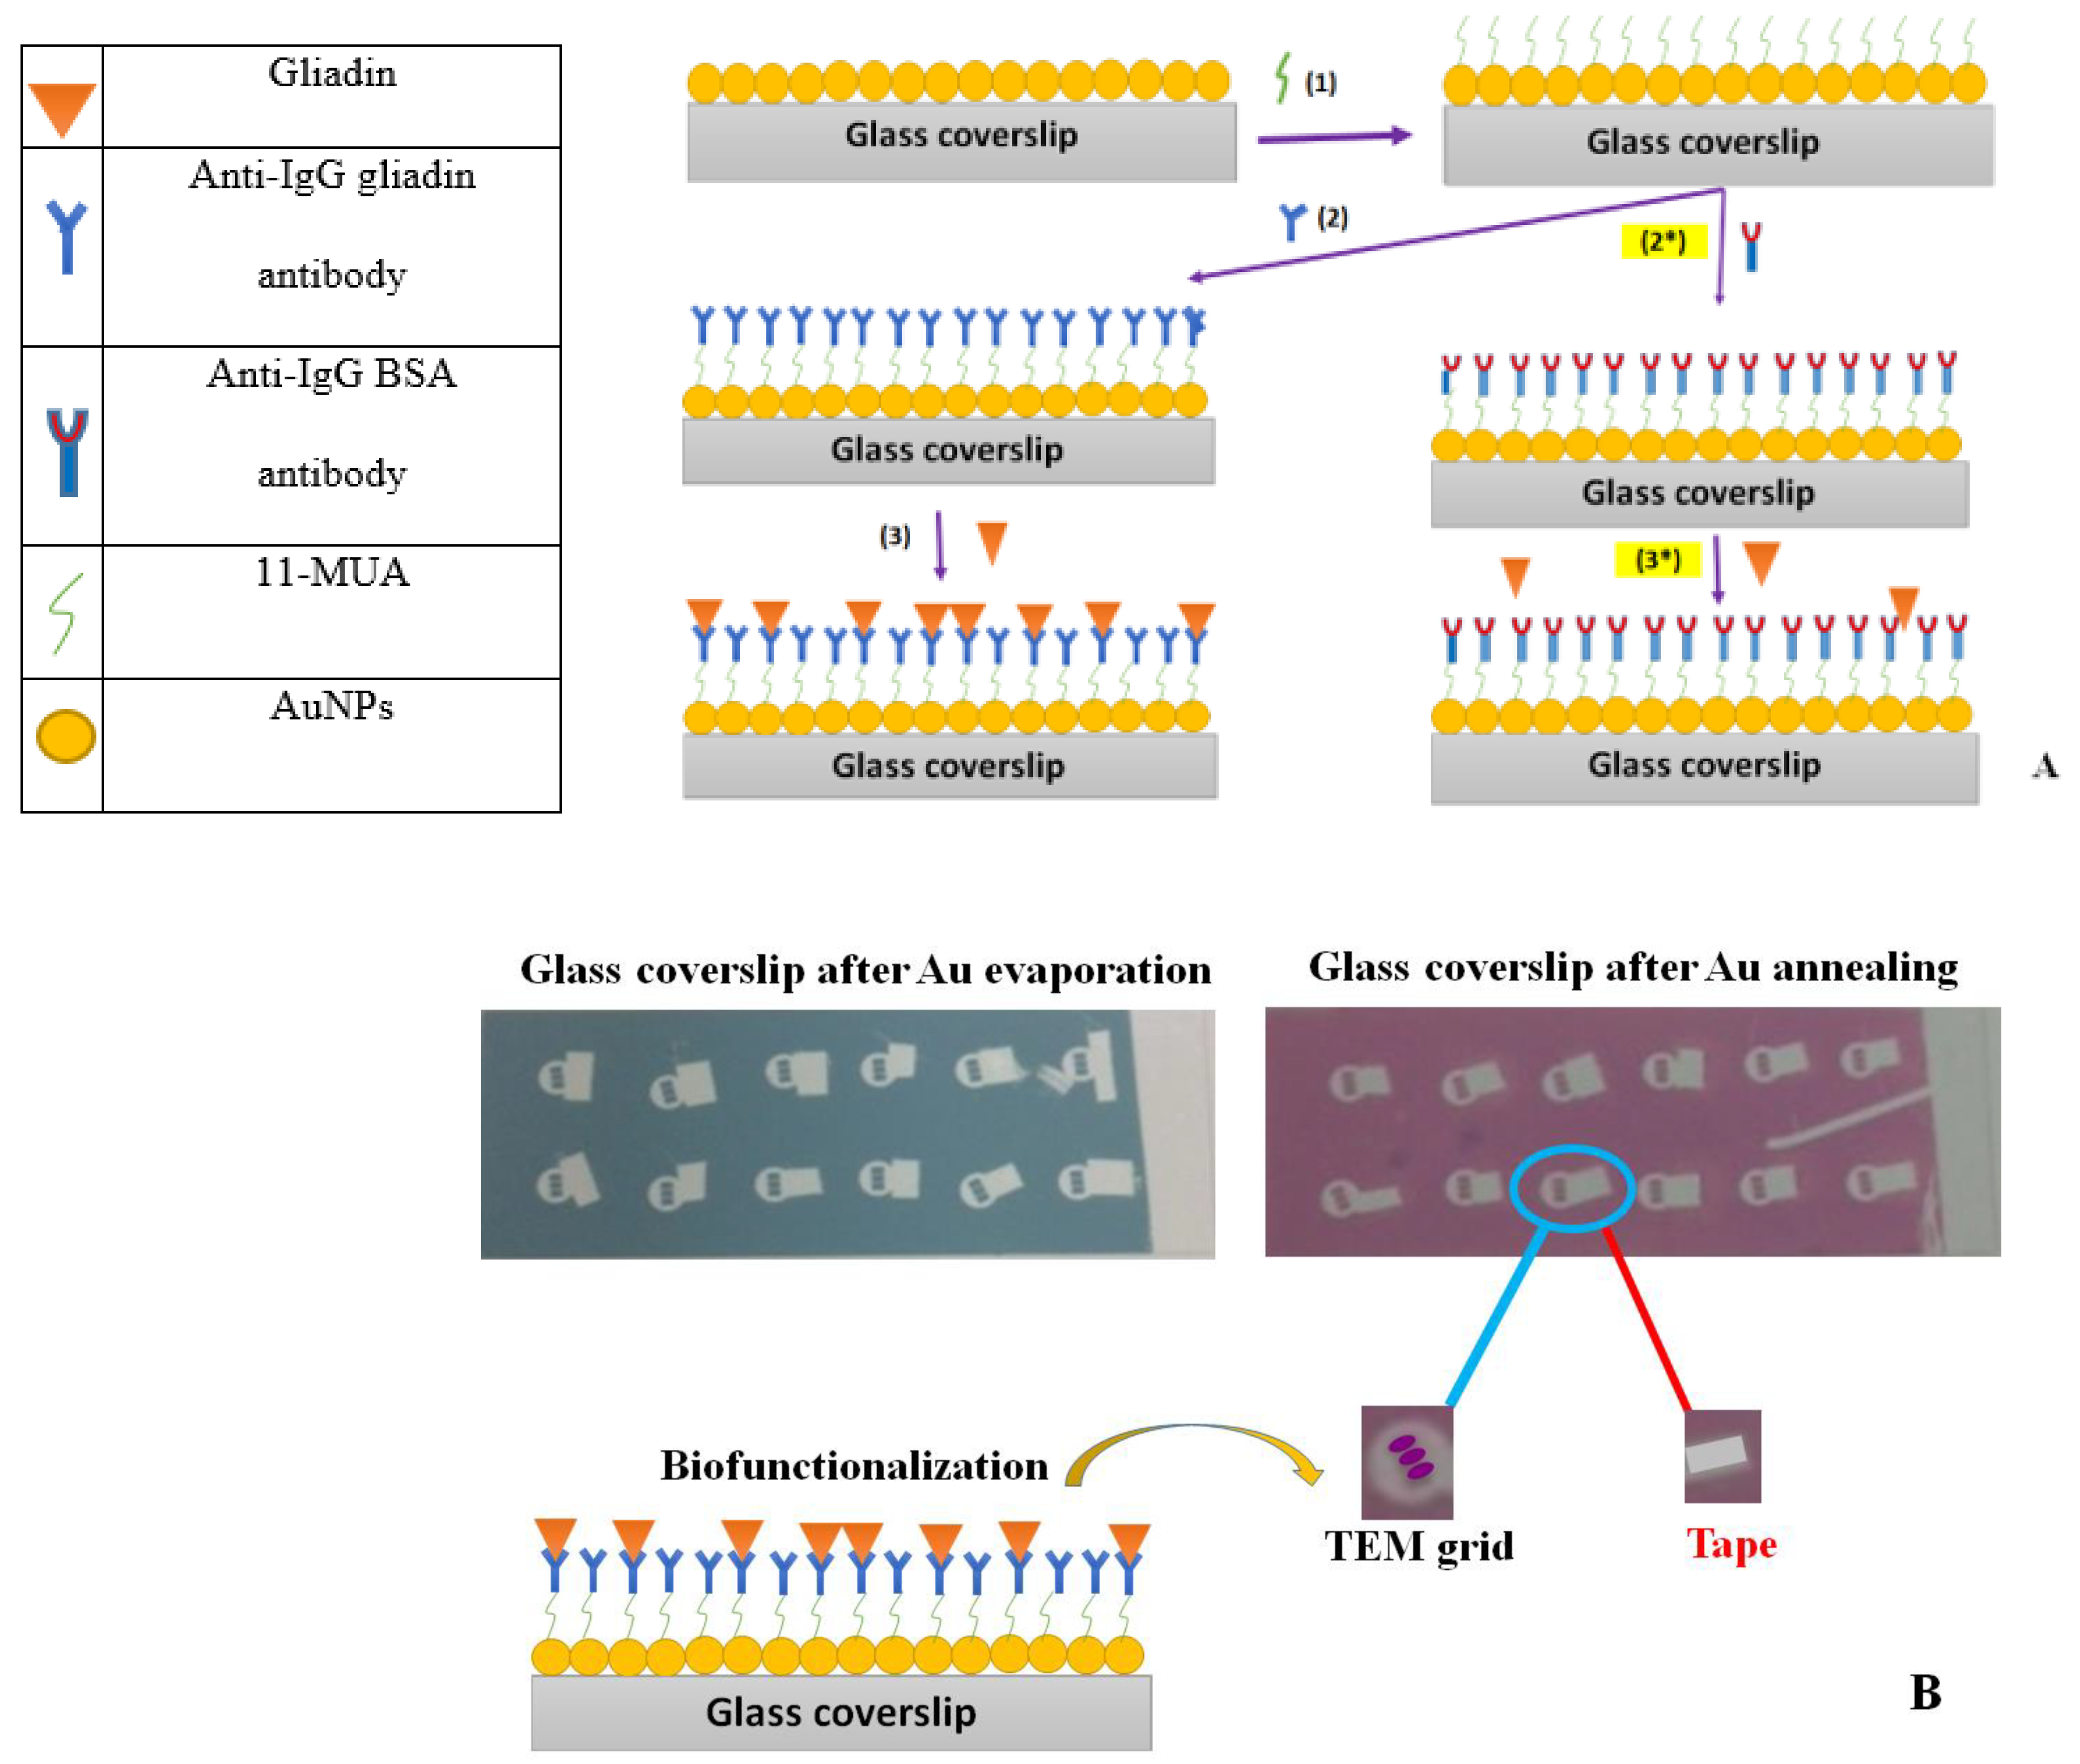
2.6.3. (Bio) Functionalization of Gold Nanostructures and Gliadin Immunosensor

The gold annealed coverslip was dipped in warm ethanol solution (70% v/v, 40 °C) in an ultrasonic bath for 20 min, dried under a biological hood and immersed in 40 mL of 11-MUA solution (10−3 M in ethanol) for 12 h at room temperature. The thiolate glass was rinsed with ethanol/water and immersed in 40 mL aqueous EDC/NHS solution (ration 0.4 mM: 0.1 mM) for 30 min at room temperature. Finally, the activated glass was abundantly rinsed with ddwater and dried under a biological hood. Next, a drop of anti-IgG gliadin antibodies (4 µL) was deposited on each TEM-grid pattern for 12 h at 4 °C. After water rinsing, different gliadin concentrations were dropped (4 µL) on anti-IgG antibo-dies/AuNPs patterns for 3 h at 4 °C, followed by water rinsing, drying and recording of LSPR spectra. The scheme of the gliadin immunosensor is shown in Figure 1.

3. Results and Discussion

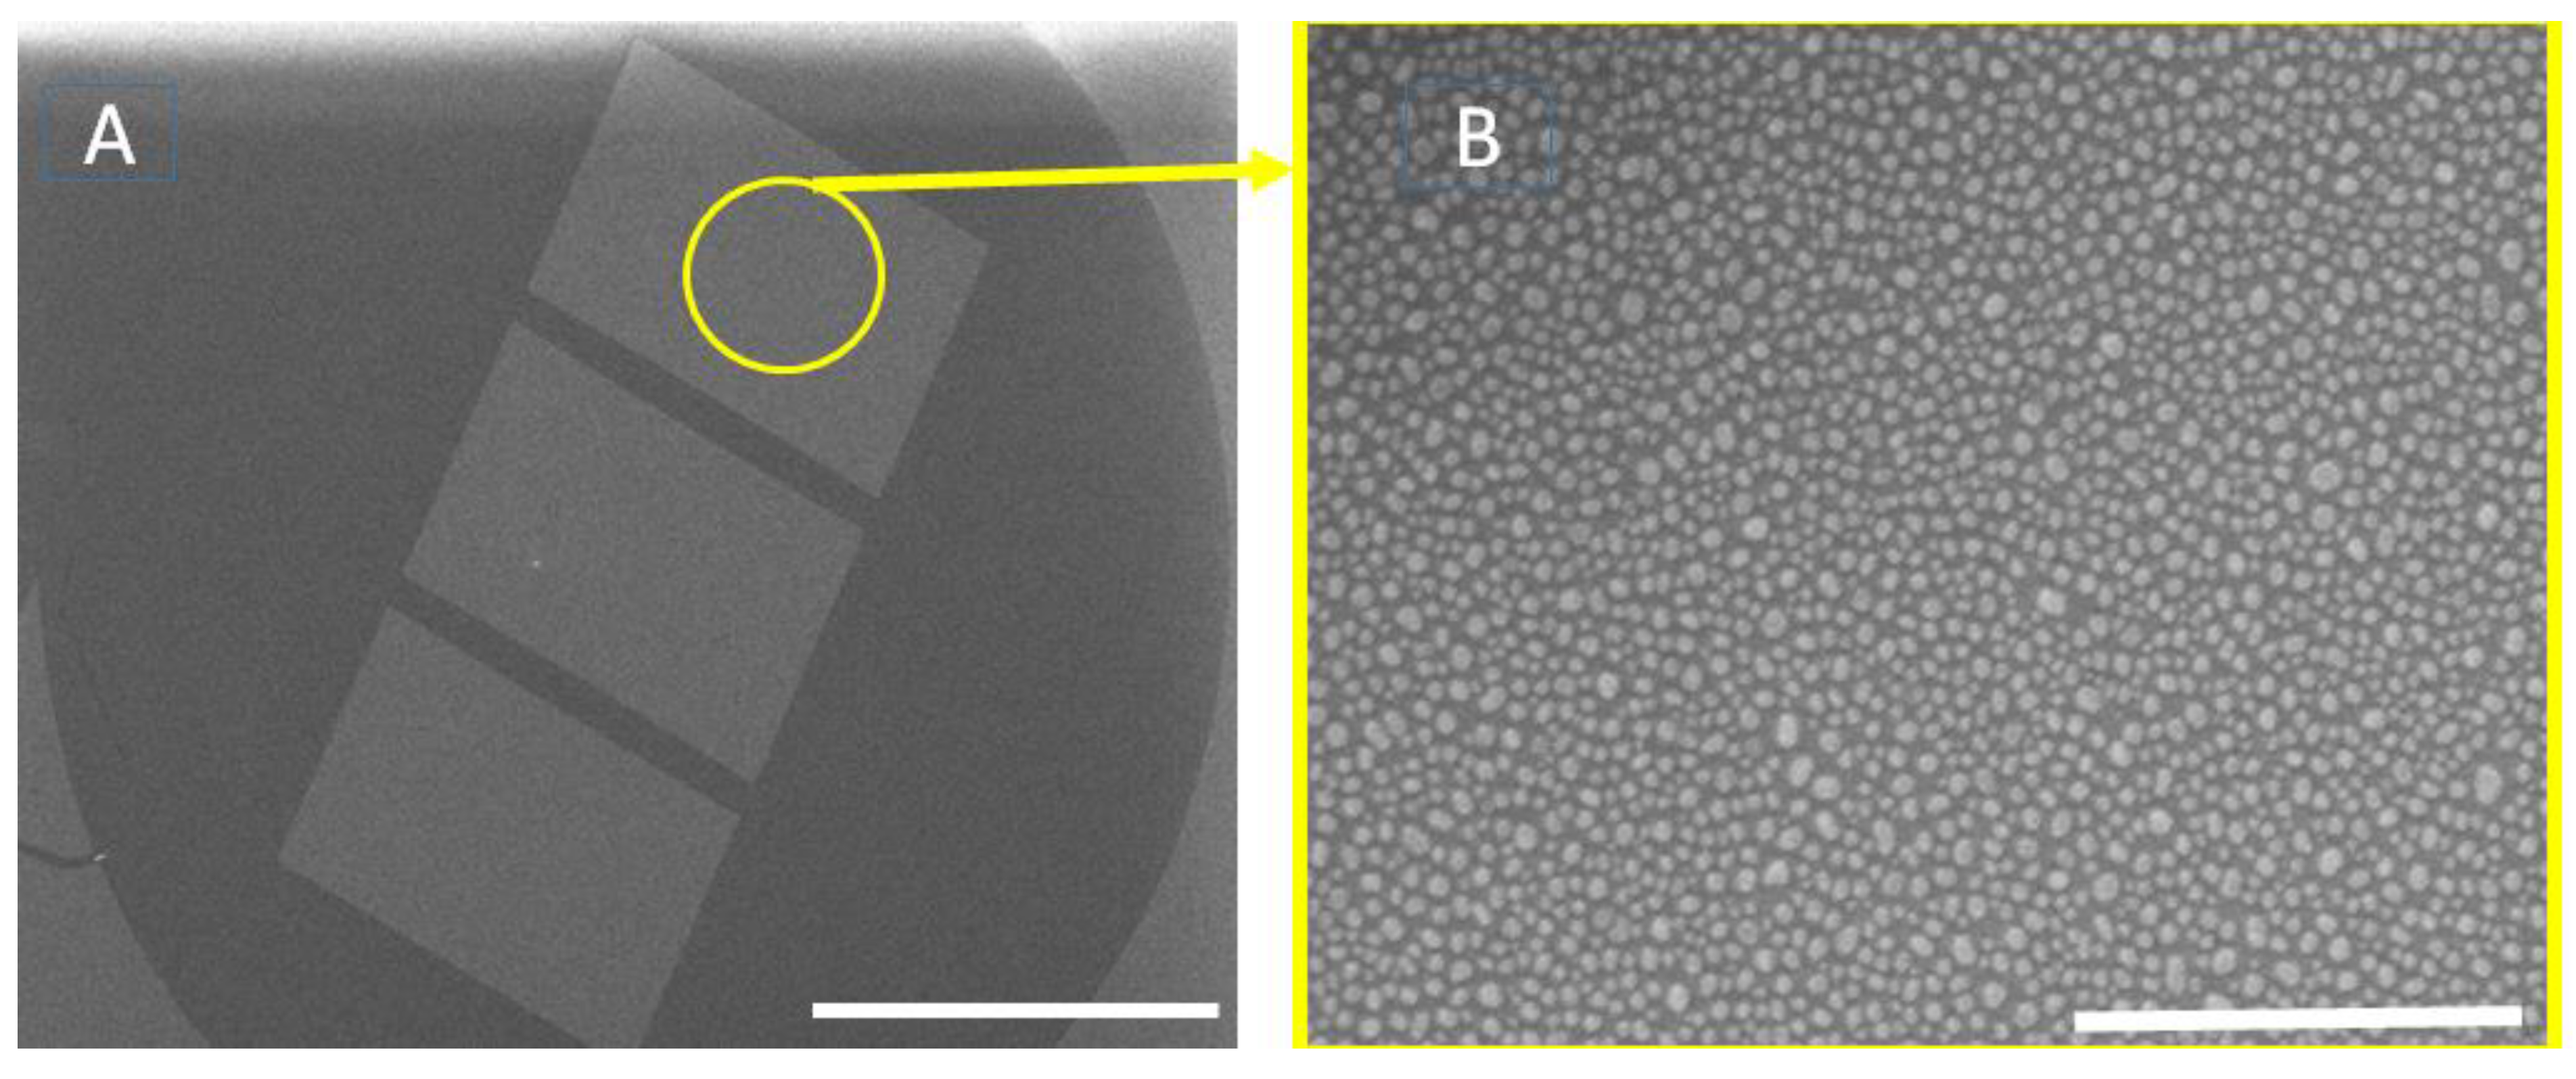
3.1. SEM Characterization of the Gold Nanostructured Microarrays on Coverslip

Figure 2A depicts the gold pattern deposited through the three-slot TEM grid, while the Figure 2B highlights the distribution of AuNPs in each grid slot where individual nanoparticles are evenly distributed over the coverslip surface. It was found that the size of the AuNPs is in the range of 5–30 nm, which is in good agreement with the previous results published by the authors [31].

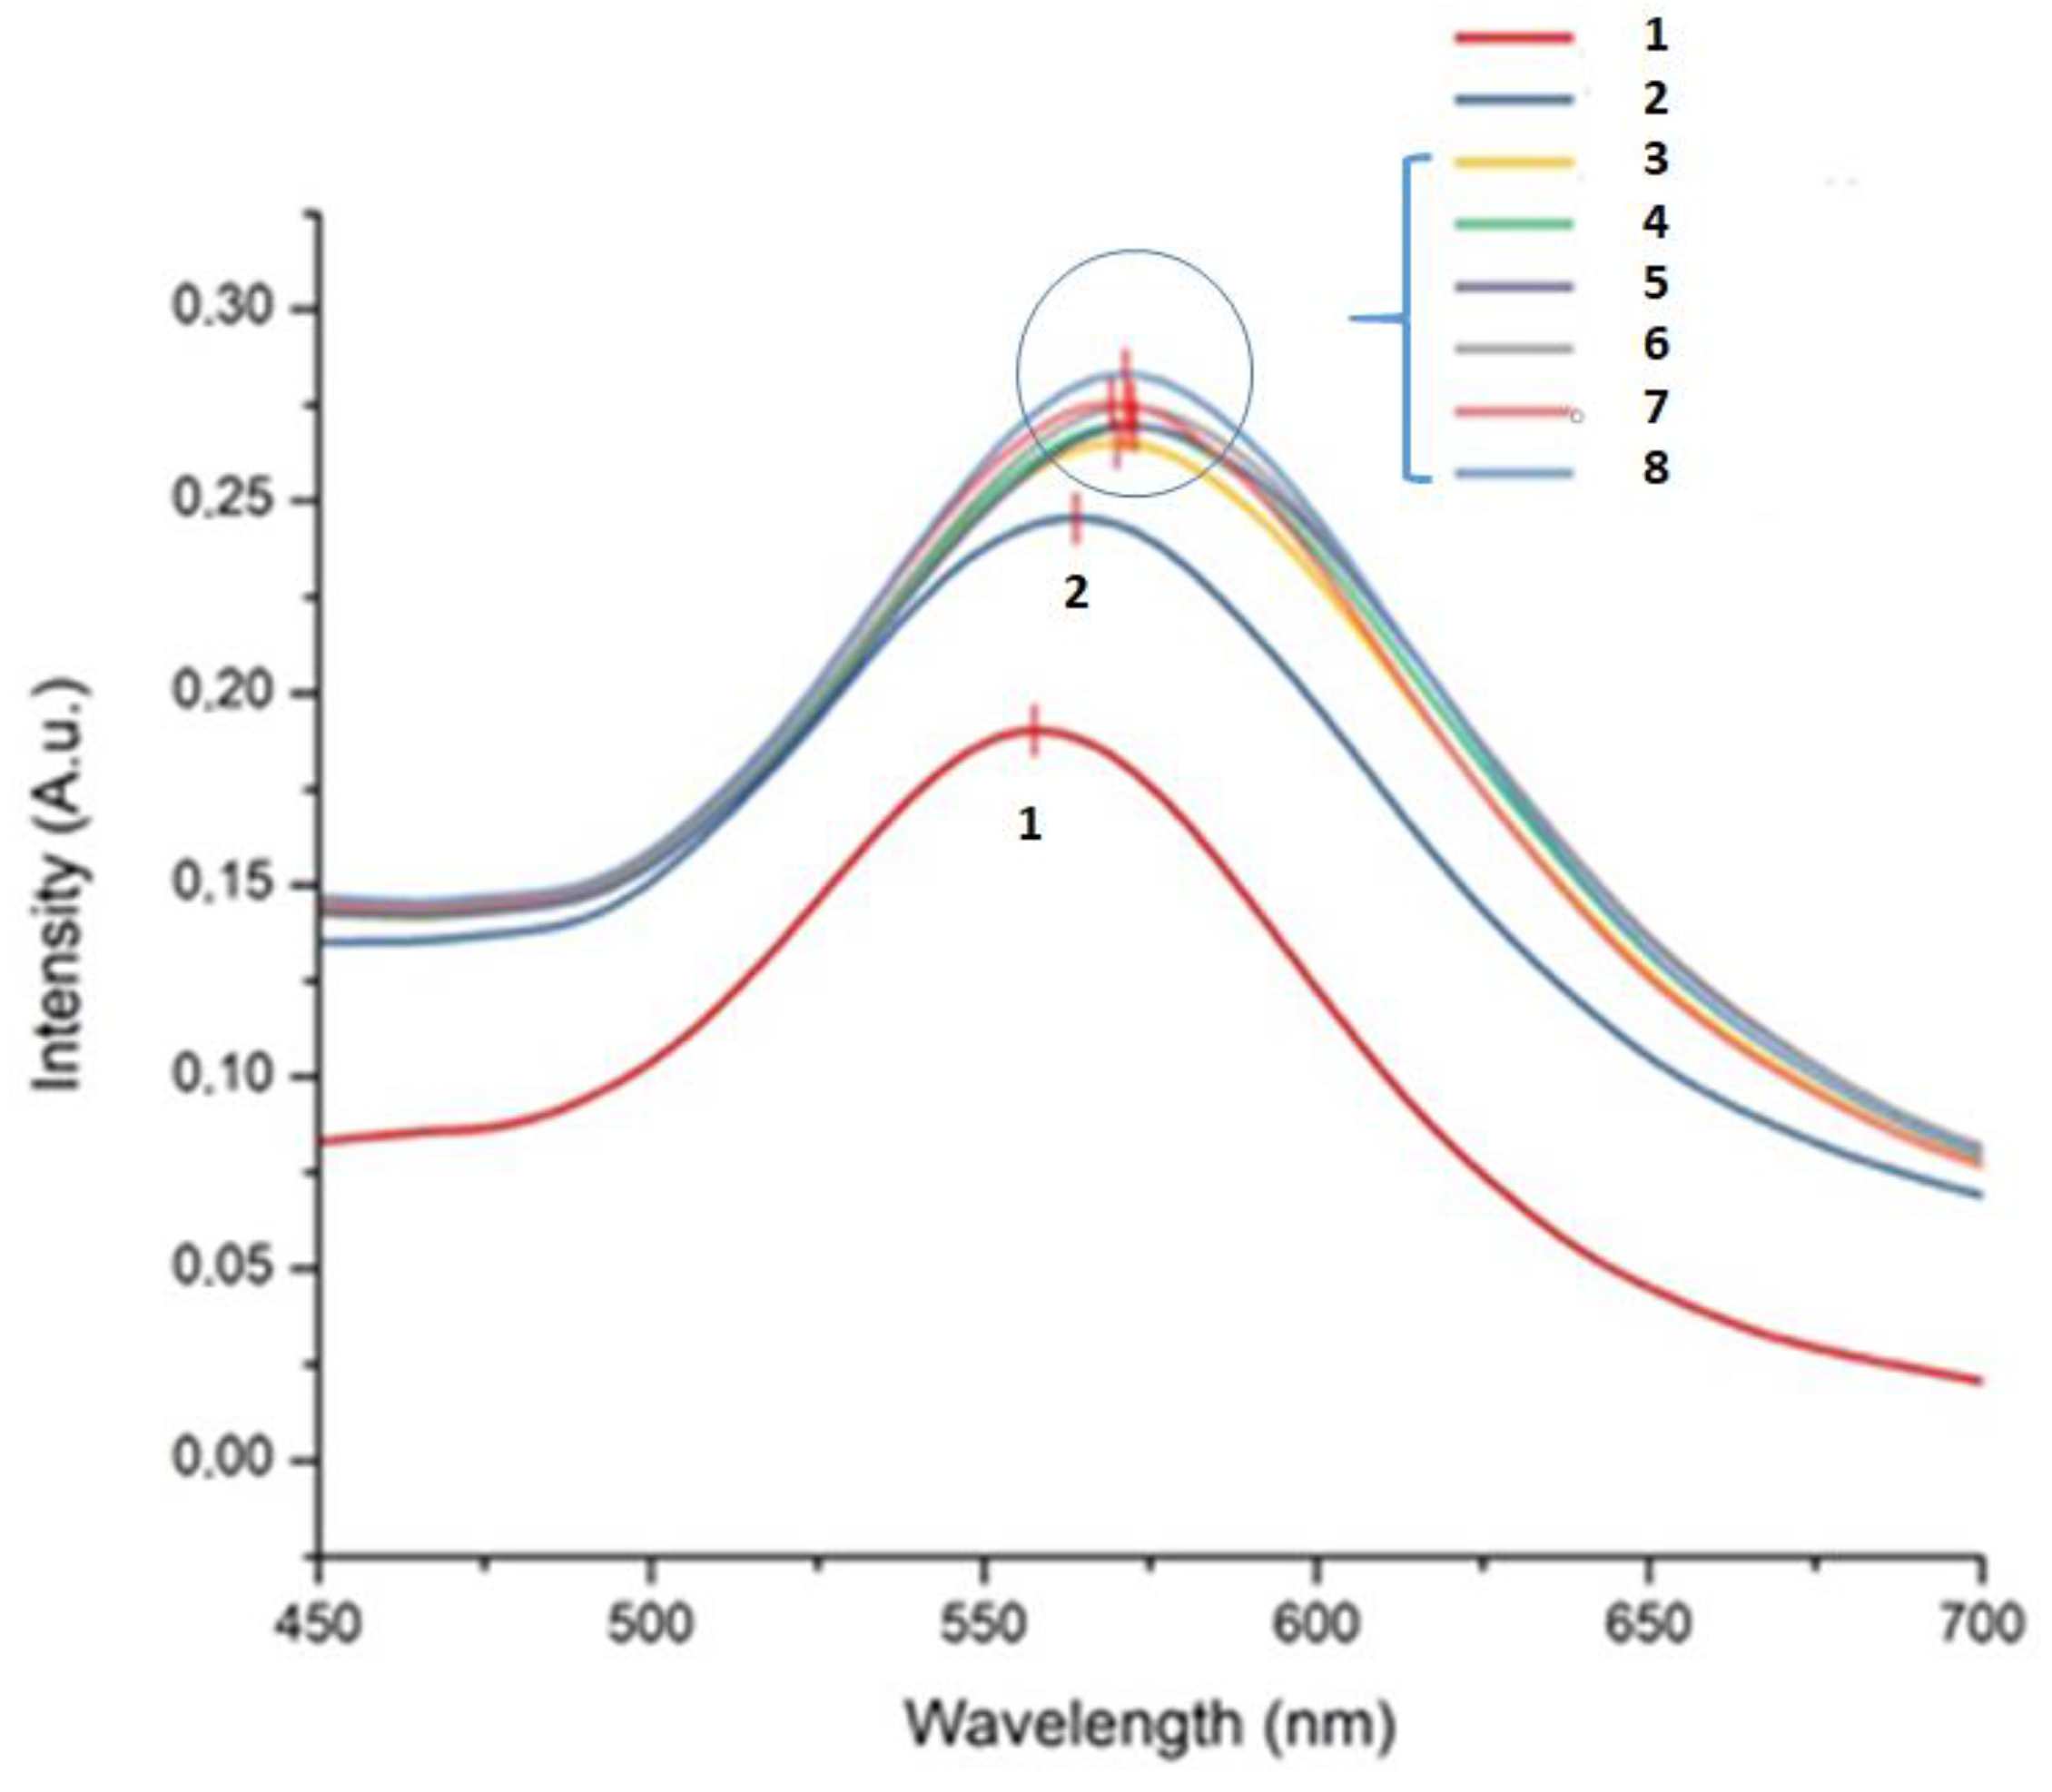
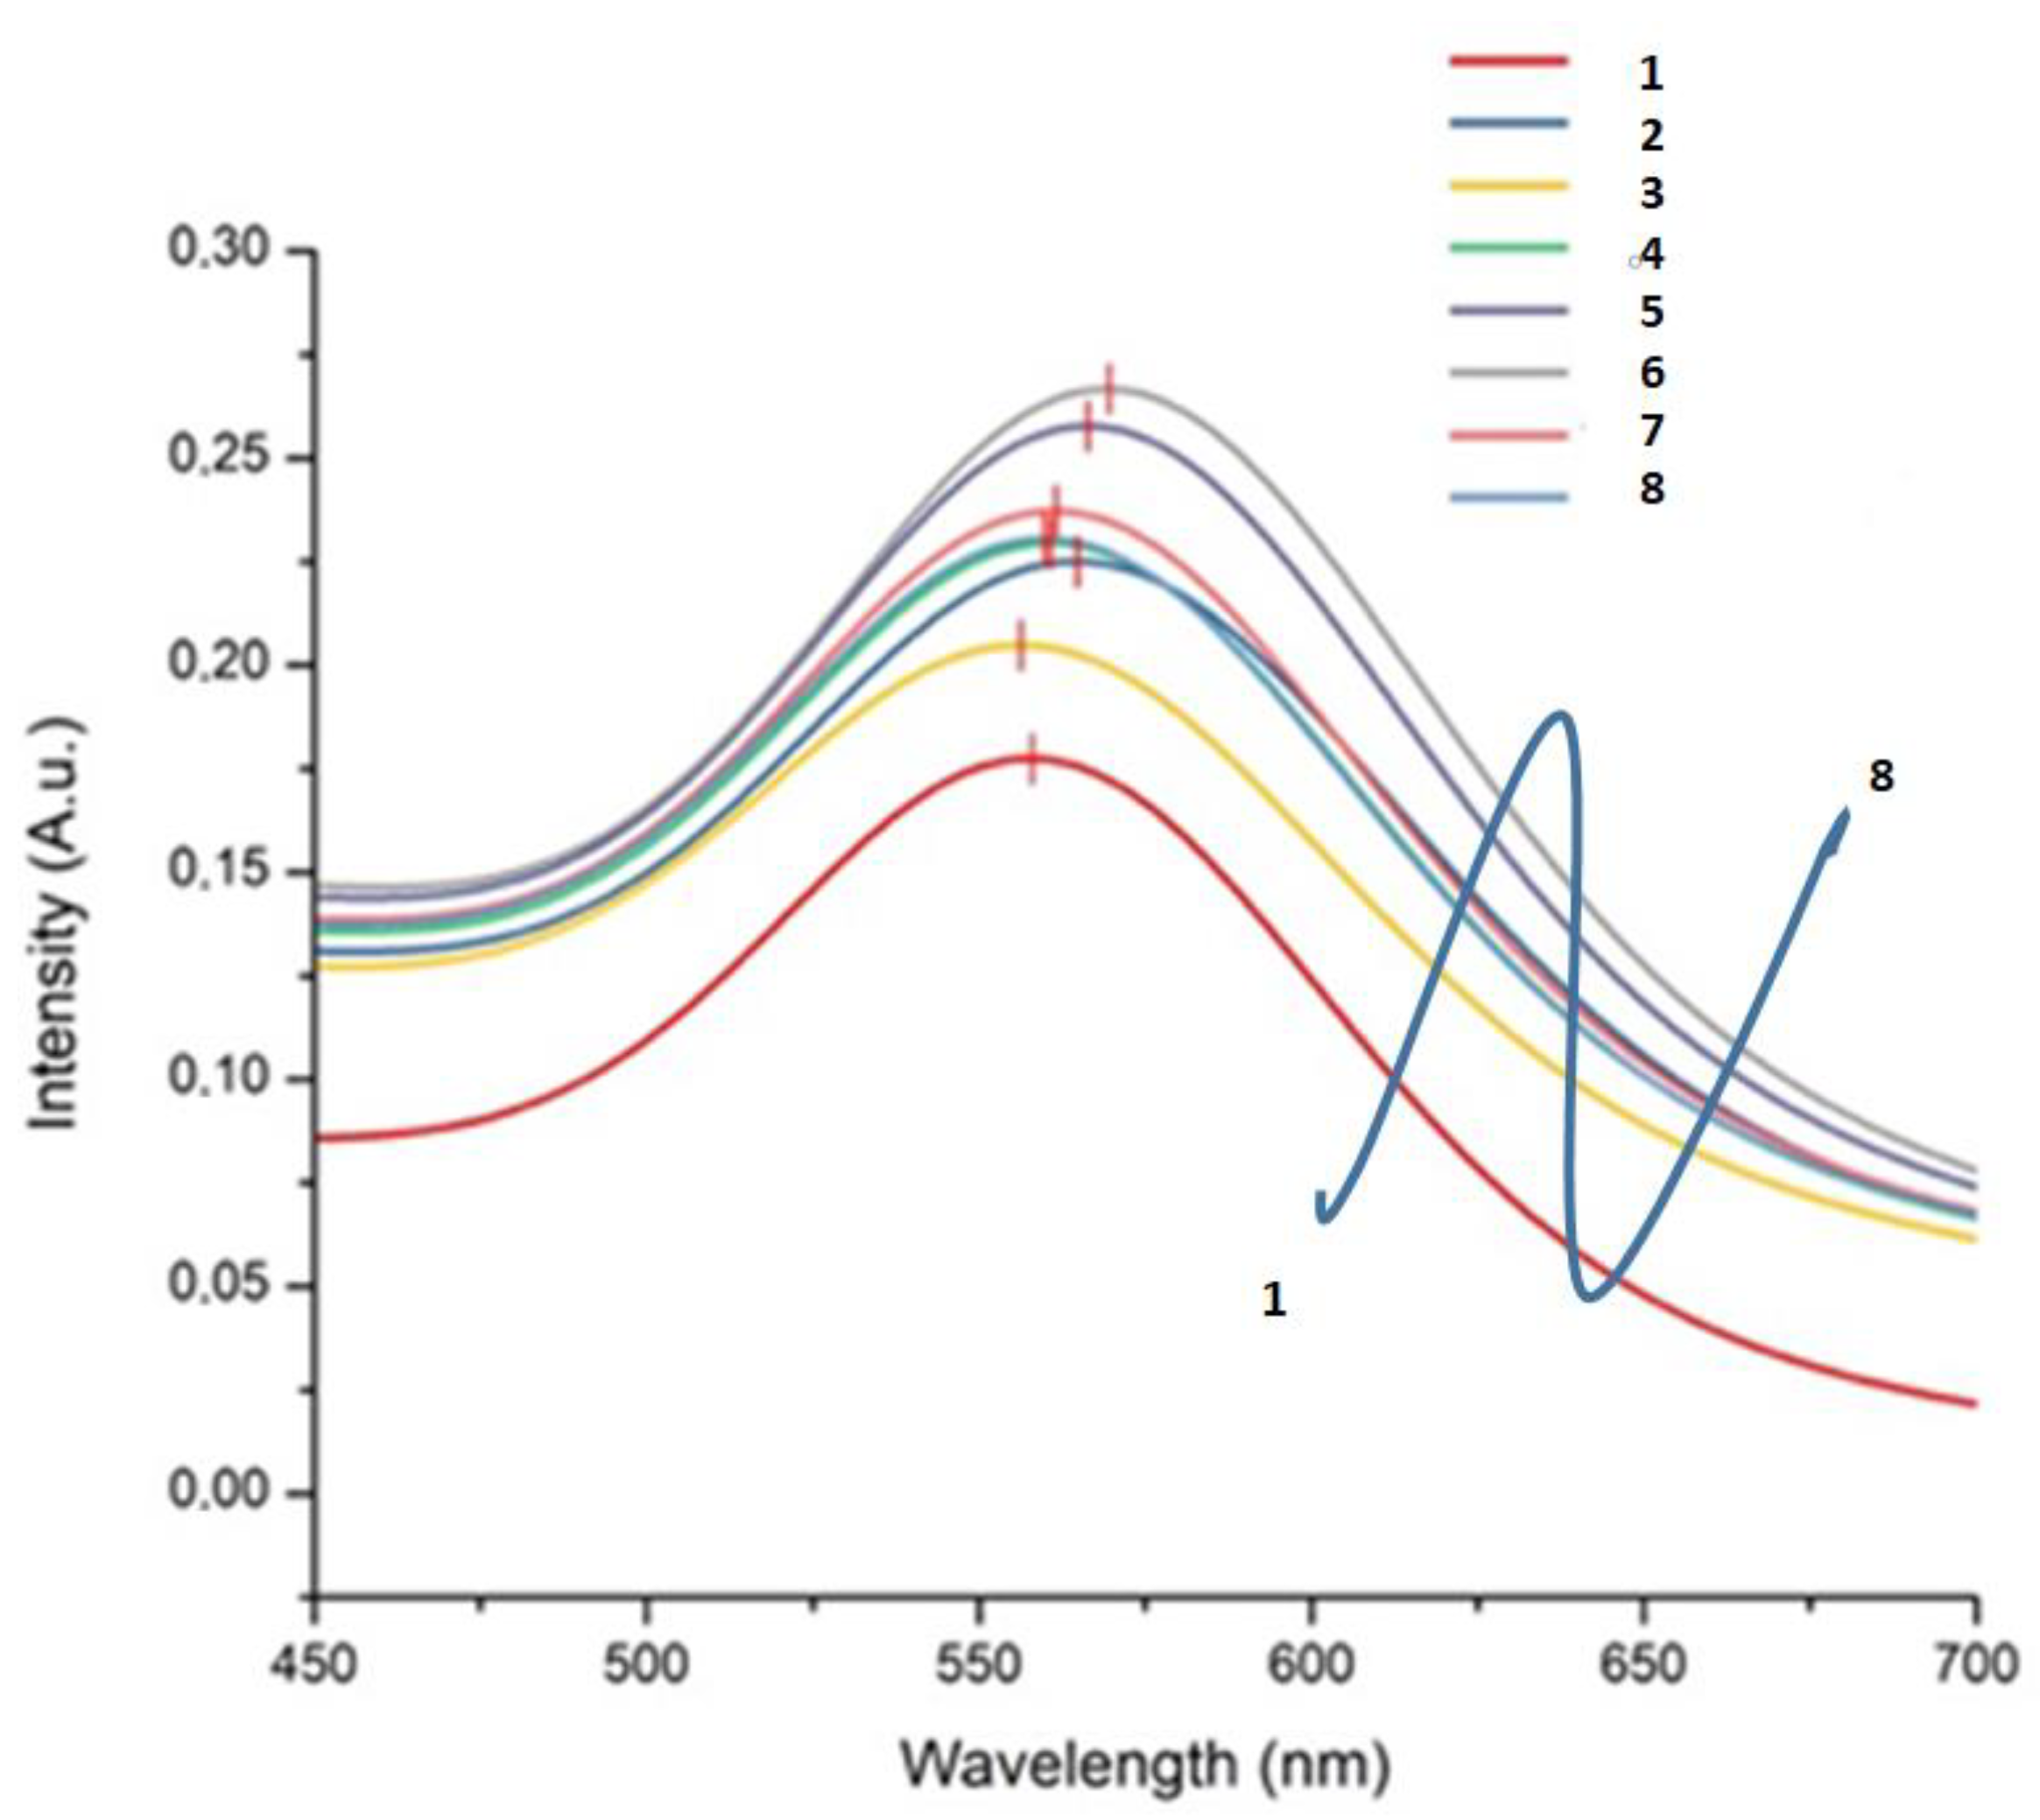
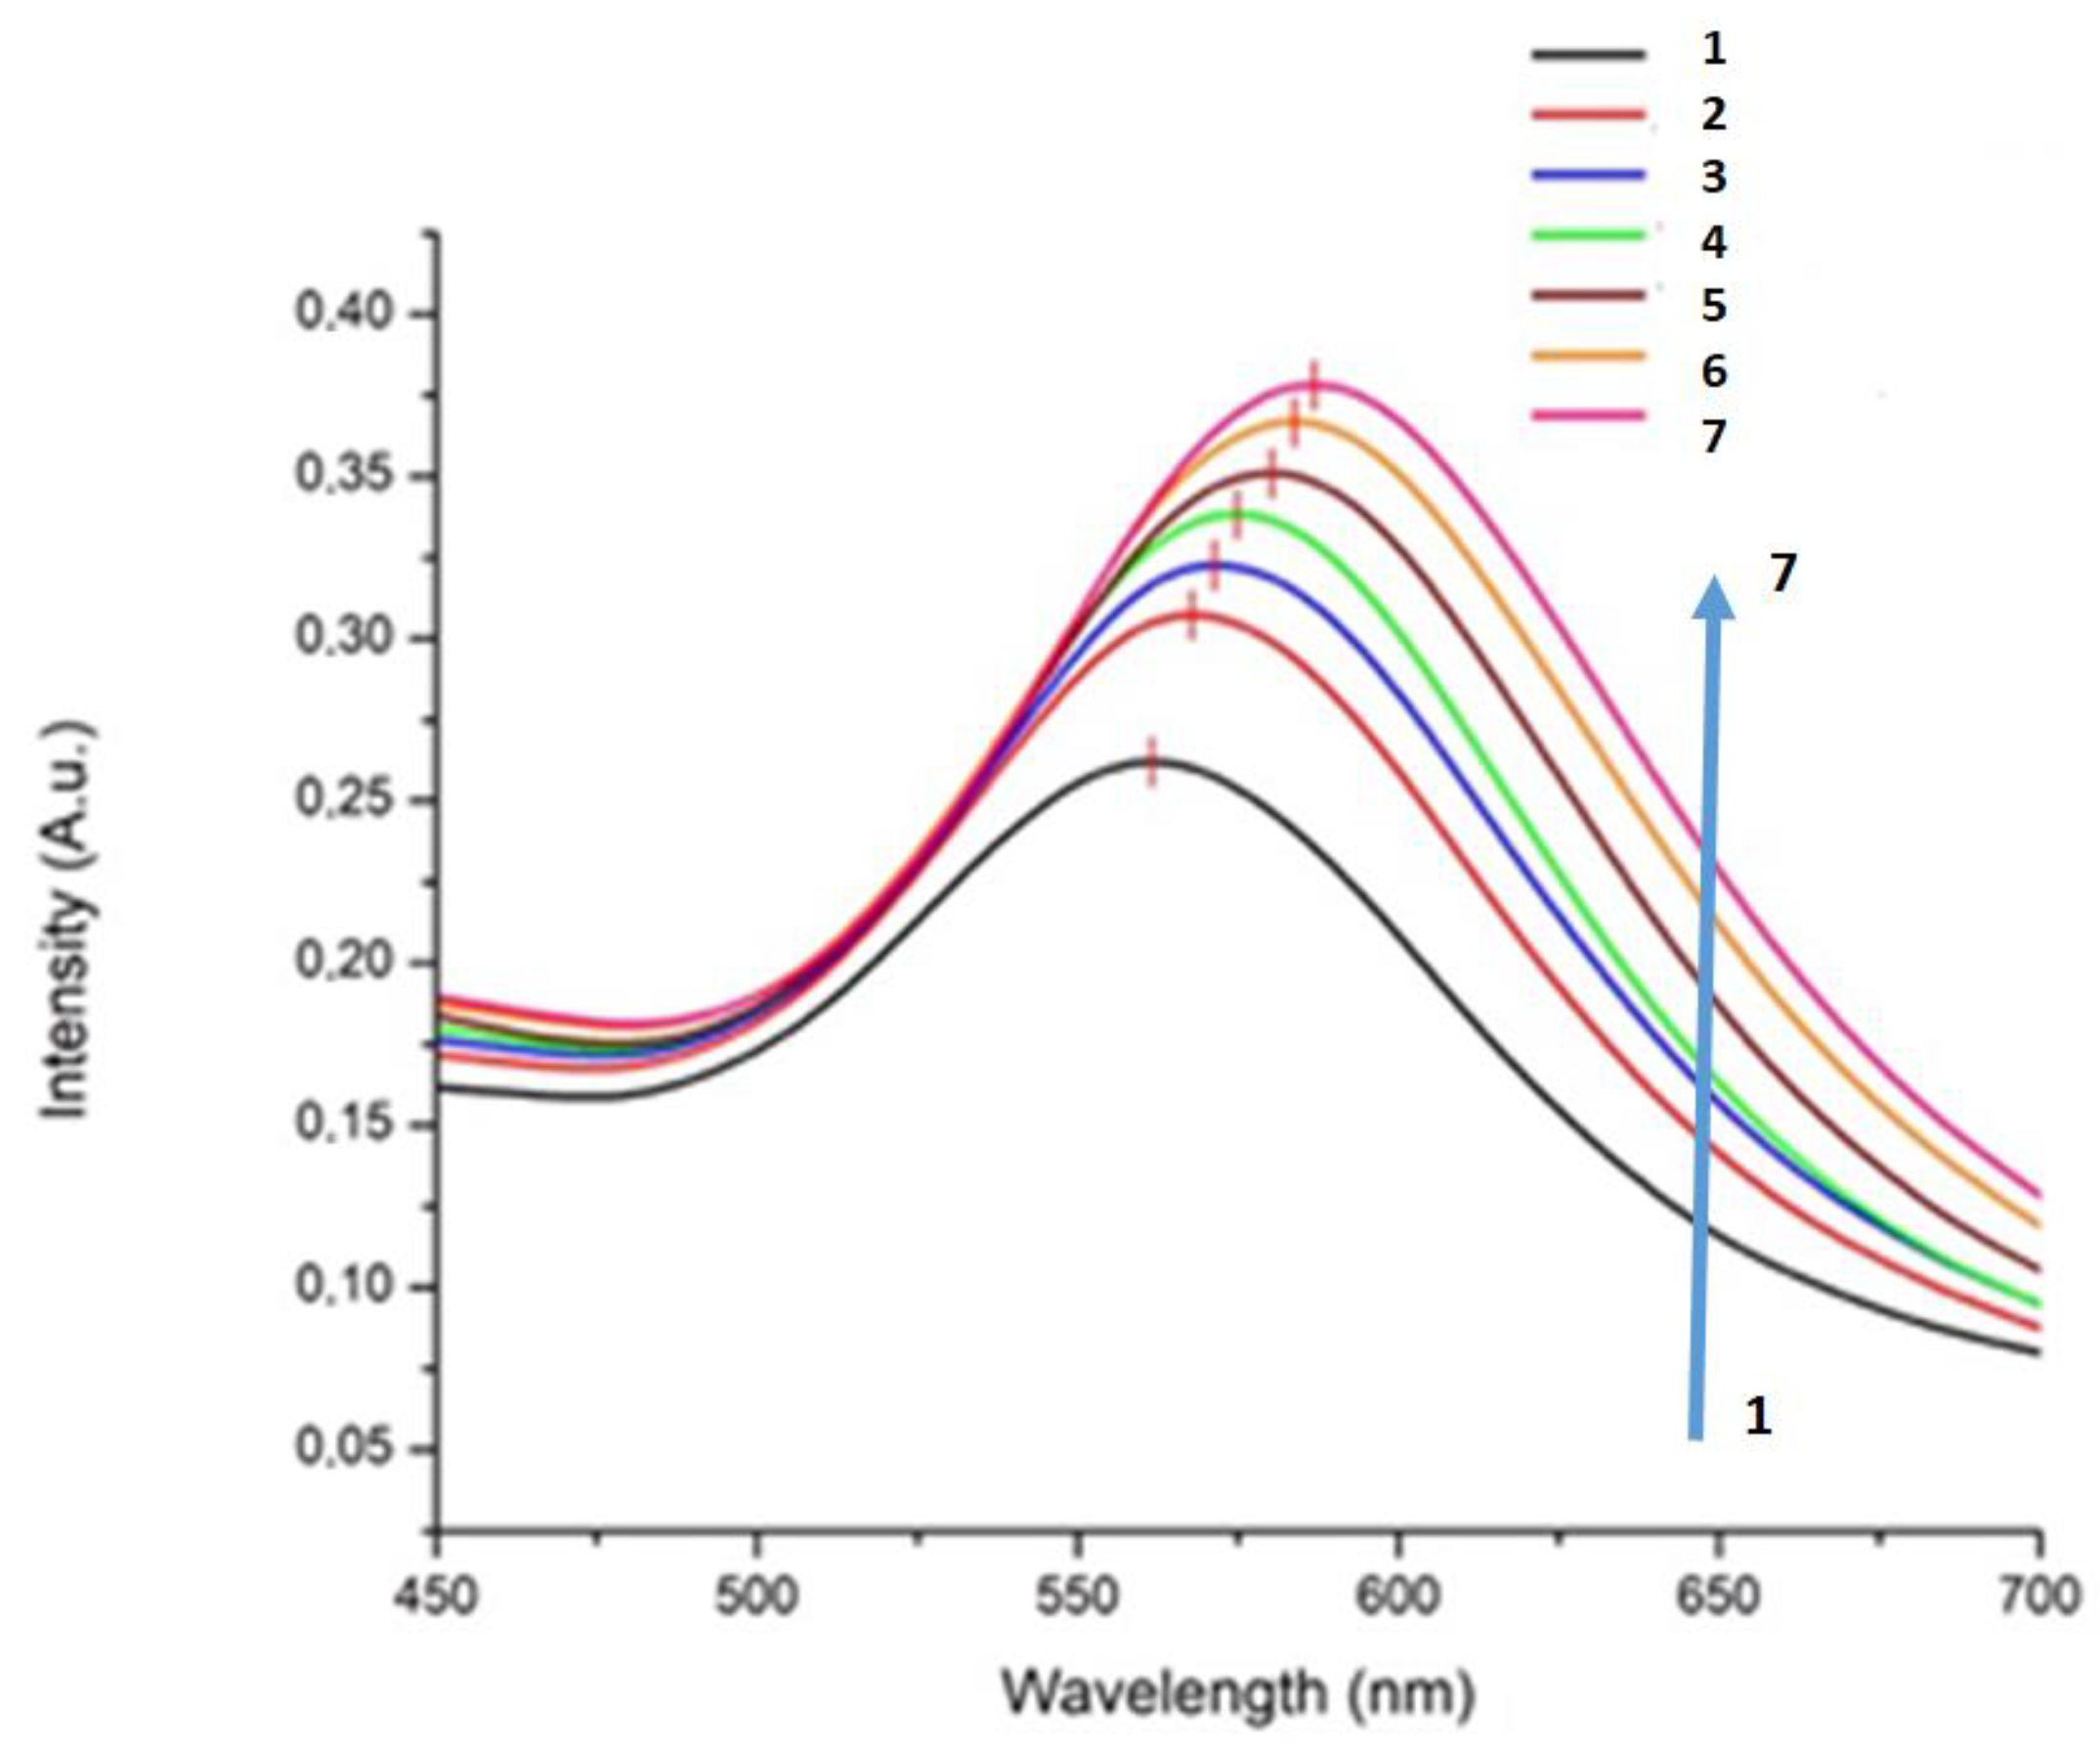
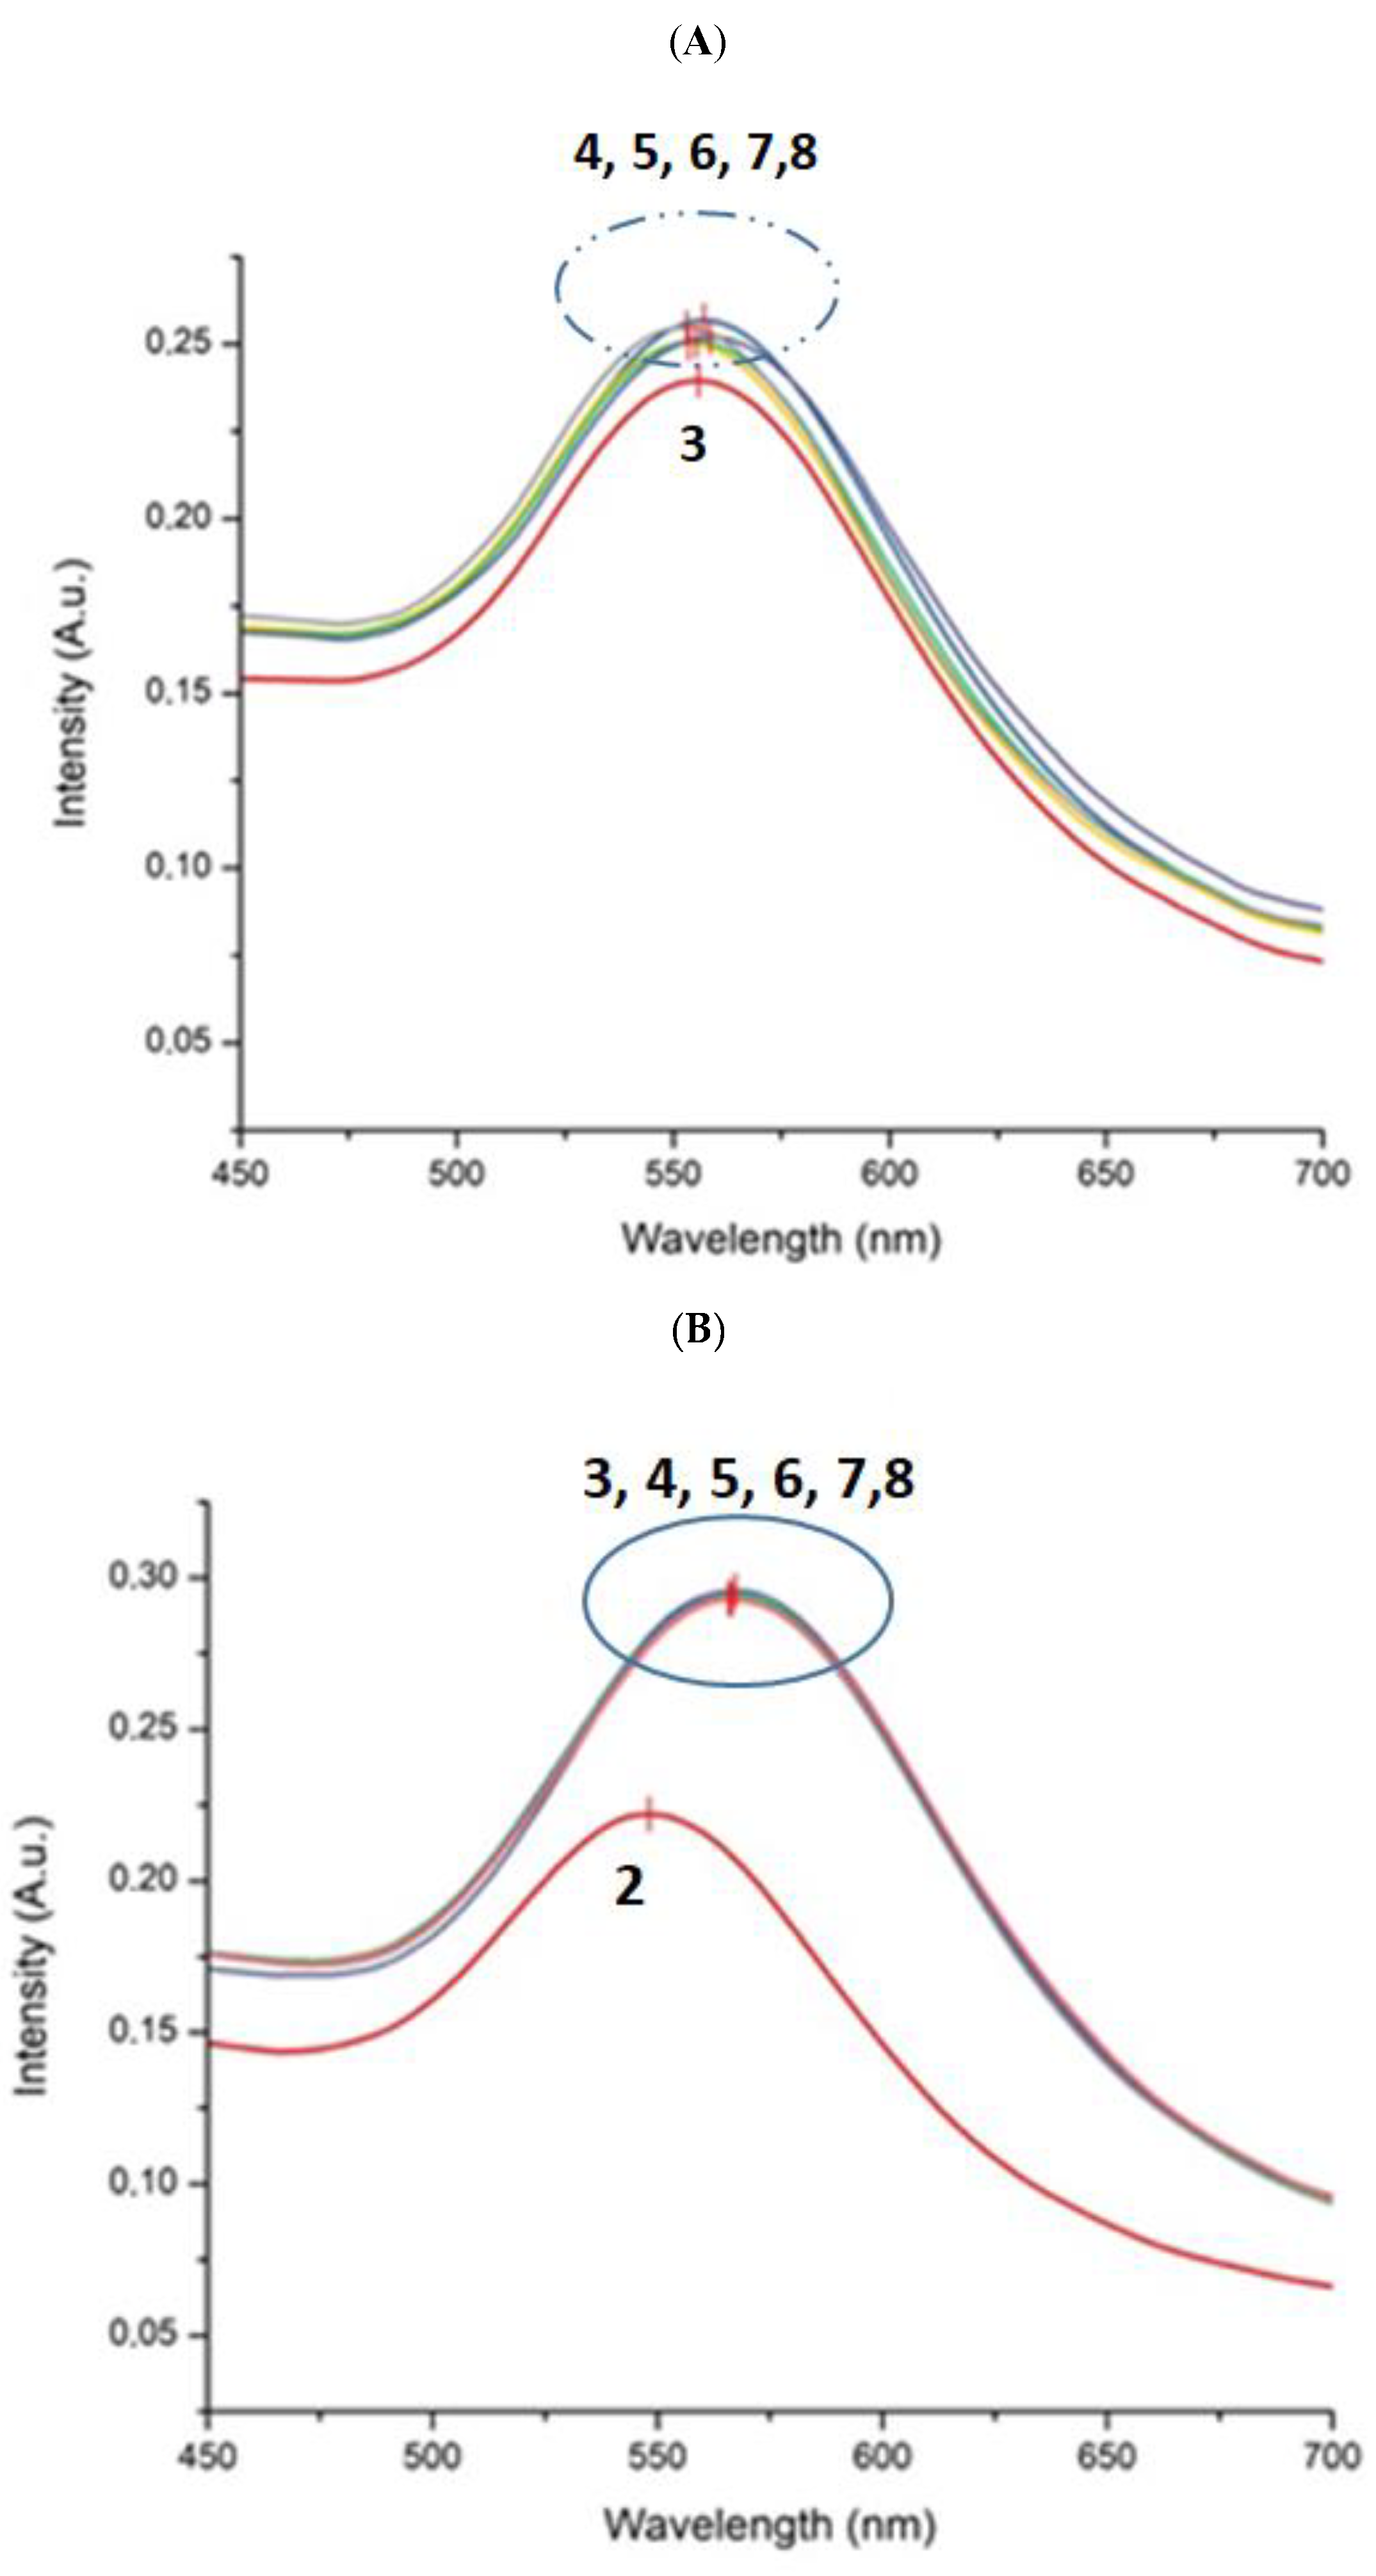
3.2. Diluents of Anti-Gliadin Antibodies and Their Impact on LSPR Performances

Three diluents of anti-IgG gliadin antibodies (70% ethanol, 0.1 M PBS and ultrapure sterilized water) were tested for their influence on the immune-recognition events in the presence of gliadin molecules and transduced via the localized surface plasmon resonance (LSPR) measurements.
PBS was tested as a diluent for the optical detection of gliadin as it mimics physiological conditions well and is the most widely used buffer for biosensors development. Figure 3 depicted the LSPR spectra in the presence of different gliadin concentrations.
As expected, a maximum LSPR peak intensity versus the maximum wavelength is observed on spectrum 1 which demonstrates the plasmonic activity of the surface. The grafting of thiols (spectrum 2) and of the anti-IgG gliadin antibodies (spectrum 3) lead to an increase of the intensity and to a shift of the peak which highlights the modification of the optical properties of the surface and confirms the AuNPs functionalization. The deposition of gliadin at various concentrations (spectra 4–8) on the active surface slightly affects the intensity of the peak but a monotonic increase is observed. On the contrary, the shift of the peak versus gliadin content is not monotonic This is an issue for the ability of the biosensor to correctly detect gliadin in food samples.
PBS is an aqueous complex buffer containing various salts which can optically interact with gold nanostructures, masking the interaction between gliadin and anti-gliadin antibody. To confirm this hypothesis, PBS was replaced by ethanol. Figure 4 depicted the LSPR spectra when ethanol was used as a diluent. A strong improvement in the LSPR signal of the active AuNPs surface is observed with a monotonic increase in the intensity of the as well as the shift of the peak as a function of the gliadin content.
Finally, ddwater that was used for the extraction of gliadin from foods was also tested as a diluent. Figure 5 depicted the evolution of LSPR spectra for the same range of gliadin concentrations tested in the present of ddwater. Both the peak intensity and its shift exhibit non-monotonic variation versus the gliadin content. Such random spectra are pro-bably due to the decrease in immune-recognition events between anti-gliadin antibody and its target gliadin.
It is worthwhile to notice that none of the diluents destabilized the annealed nanostructures formed on coverslip as there was no significant variation in the peak shape and of the full width at half-maximum (FWHM) of the LSPR response.

3.3. Dose-Response Calibration Curves

In the Table 1 are summarized the optical evolution (maximum intensity and corresponding wavelength) for each tested diluent of anti-gliadin antibody, using data of Figure 3, Figure 4 and Figure 5.
Dose-response calibration curves of three specific immunosensing of gliadin concentrations are plotted using the maximum intensity of the LSPR peak (Figure 6A) and using the plasmon resonance maximum (Figure 6B).
As mentioned in the previous paragraph, the nature of the diluent strongly affects the shape of the calibration curves. When ddwater is used, the two calibration curves exhibit linear proportional behavior for peak intensity (R2 = 0.997) and corresponding wavelength (R2 = 0.9958) values with respect to the logarithm of the gliadin content. For the other two diluents, strong deviations from a linear response are observed. Even if the precise mechanism is still unknown, this could be explained more by disturbances of the anti-gliadin antibody-gliadin immune-recognition events than by a destabilization of AuNPs, which would have modified the values the FWHM of the LSPR response.
By using the peak intensity values versus gliadin content on Figure 6A, the theoretical curve calibration was calculated as y = 0.014x + 0.3374 where y represents the peak intensity and x the decimal logarithm of the gliadin content. In addition, by noting c the gliadin content in ppm, the equation can be rewritten such as y = 0.014log10c + 0.3374. After the differentiation step, the error on the gliadin content (Δc) can be expressed versus the error on the intensity (Δy) with:
Δ c = ( ln ( 10 ) 0.014 Δ y ) c = ( 164.5 Δ y ) c
Furthermore, by using the standard deviation values of the maximum peak intensity reported in Table 1, Δc is listed in Table 2 with the corresponding c values.
Ten peak intensity (I) measurements were performed on anti-gliadin/MUA/AiNPs coverslip acting as blank, leading to I = 0.3073 ± 0.0001 a.u The LOD and LOQ values are, respectively, calculated using the I value at 3SD (0.3076 A.u.) and the I value at 10SD (0.3083 A.u.) using the fitting equation.
The limit of detection (LOD) at 3SD is 0.0075 ppm, while the limit of quantification (LOQ) at 10 SD is 0.0085 ppm. These values are lower than the limit fixed by the European community emphasizing the feasibility of LSPR detection for food control.
Furthermore, by using the plasmon resonance maximum values versus gliadin content on Figure 6B, the theoretical curve calibration was calculated as y = 5.1x + 575.5 where y represents the plasmon resonance maximum and x the decimal logarithm of the gliadin content. Moreover, by noting c the gliadin content in ppm, the equation can be rewritten as follow: y = 5.1log10c + 575.5. After the differentiation step, the error on the gliadin content (Δc) can be expressed versus the error the plasmon resonance maximum (Δy) with:
Δ c = ( ln ( 10 ) 5.1 Δ y ) c = ( 0.45 Δ y ) c
As no difference have been observed between several experimental plasmon resonance maximum values for a given content of gliadin, Δy can be assimilated to the spectrometer accuracy which is equal to 0.2 nm. Δc is listed in Table 3 versus the corresponding c values.
By considering that the plasmon resonance maximum value is 567 nm for the anti-gliadin/MUA/AuNPs surface and the standard deviation (SD) is 0.2 nm, the LOD at 3SD is 0.03 ppm and LOQ at 10 SD is 0.05 ppm. These values are also lower that the limit fixed by the European community, proving the feasibility of such optical approach.
Even if the two methods fulfilled the requirements of gliadin detection in food, the method based on the plasmon resonance maximum will be preferred because it is less sensitive to the experimental conditions. The value of the incident intensity as well as the variation in thickness of the dropped sample affected the transmitted intensity but not its wavelength distribution.

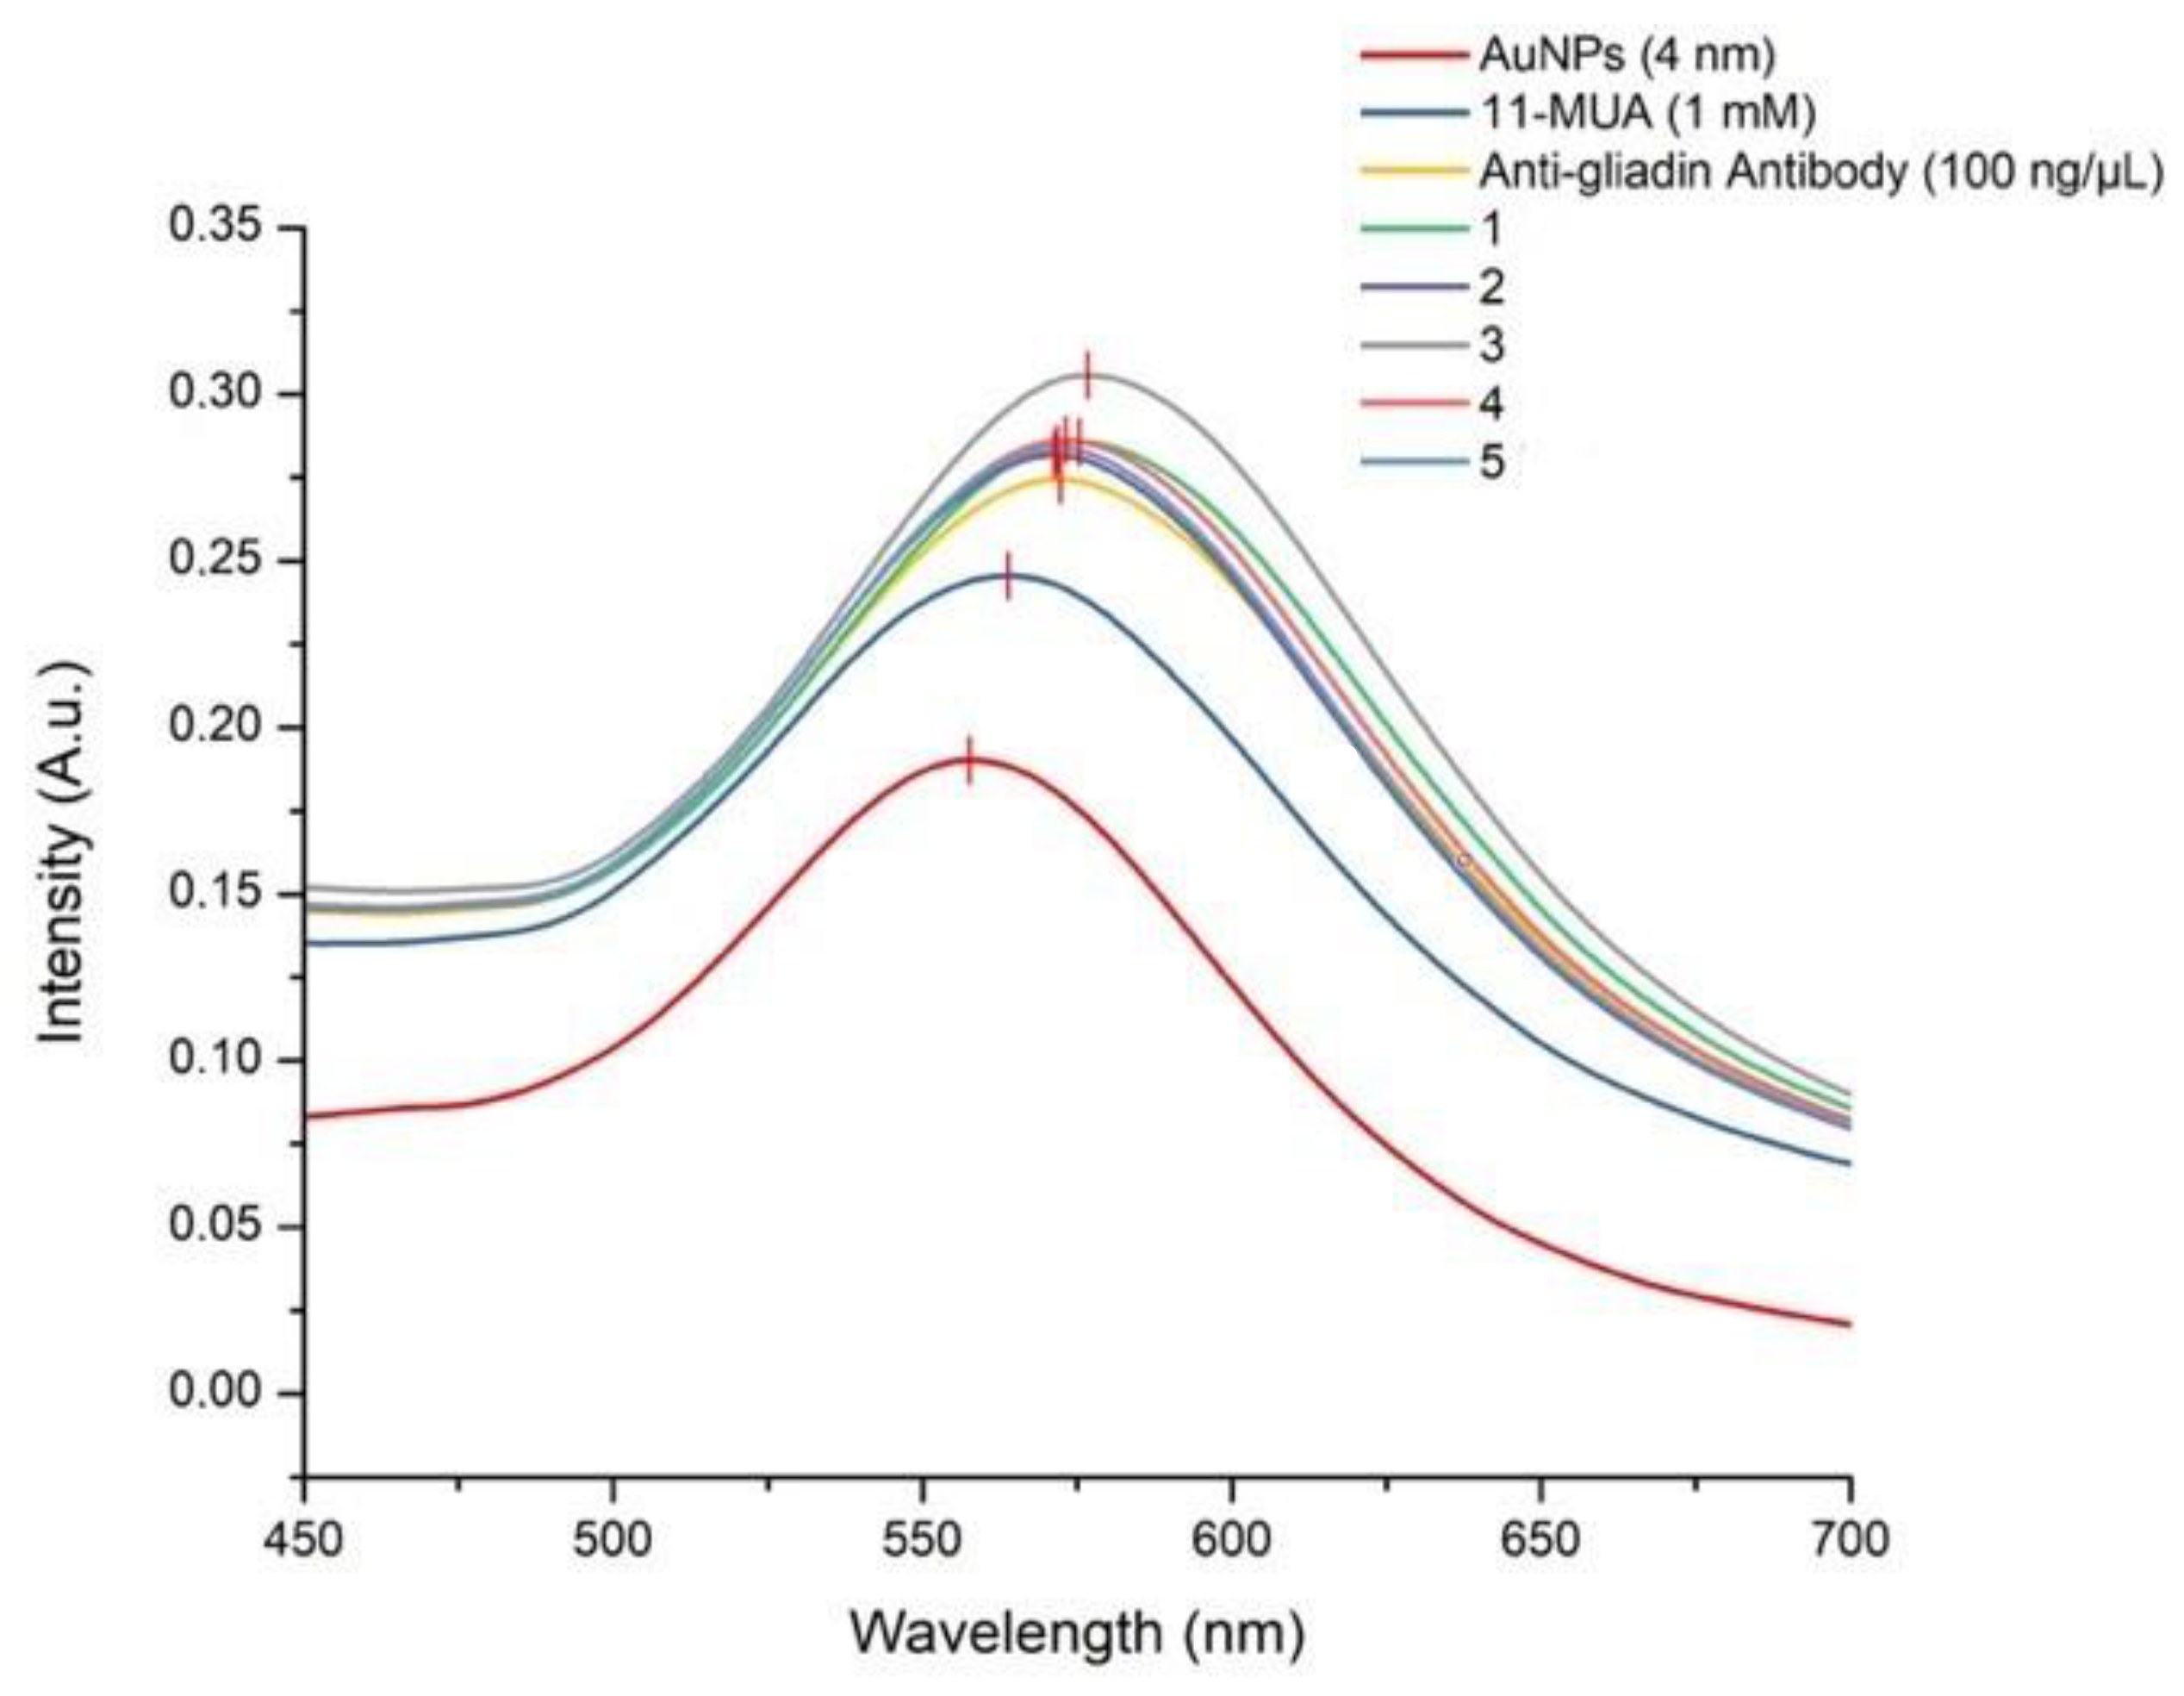
3.4. Controls Experiments

To confirm the specific plasmonic detection of gliadin in aqueous solutions, two control experiments were implemented.
First control experiment: the gliadin concentrations were tested directly on MUA-thiolated AuNPs (there is no prior incubation with anti-IgG gliadin antibodies). Theore-tically, the LSPR spectrum obtained for each gliadin concentration should correspond to that recorded in the presence of MUA labelled AuNPs. However, nonspecific and random adsorption of gliadin molecules on AuNPs is expected and recorded as negligible LSPR shifts (Figure 7A). Such an evolution of the optical signal is due to the absence of anti-gliadin antibodies grafted onto the AuNPs, responsible for specific bio-recognition events and therefore for the capture of gliadin molecules which, if there are any, will induce strong changes in the size and shape of the nanoparticles proportional to the concentrations of gliadin.
Second control experiment: nonspecific anti-IgG BSA antibodies diluted in ddwater were bound to the surface of AuNPs instead of anti-IgG gliadin antibodies. In this case, the LSPR spectra of the five concentrations of gliadin have the same optical evolution and correspond to spectrum recorded for the anti-BSA antibodies/MUA/AuNPs. These results proved that no gliadin was bound to the modified anti-BSA AuNPs and its complete surface removal after the rinsing step (Figure 7B).

3.5. LSPR Spectra of Gliadin Content in Commercial Food Samples

The biofunctionalization protocol (Section 2.6.3) was applied to detect the gliadin content in five commercial foods after a preliminary sample preparation (Section 2.5). The food supernatants were deposited on anti-gliadin antibodies modified AuNPs and after rinsing with ddwater were ready for optical investigations LSPR (Figure 8).
As can be seen in Figure 8, the maximum peak intensity values are quite similar to those recorded for the naked anti-IgG gliadin antibodies/AuNPs (samples 1, 2, 4 and 5), indicating that these samples could be gluten free. The wavelength value is less sensitive to variations in experimental conditions and can be measured more accurately than the maximum intensity value. The corresponding wavelengths read on the curve, after deposition of the samples, are, respectively, 571 nm for samples 2, 4, and 5, 576 nm for sample 1 and 579 nm for sample 3. Using the equation obtained from the dose calibration curve using the wavelength values, the content of gliadin in ppm is 0.100 +/− 0.009 ppm for samples 2, 4 and 5, 1.25 +/− 0.11 ppm for sample 1 and 4.8 +/− 0.4 ppm for sample 3.
Based on this measurement, all the gliadin contents of the five samples are lower of the limit fixed at 20 ppm by the European Commission. This result is in good agreement with the gluten free labelling for samples 1, 2 and 5 but not for samples 3 and 4, which are not labelled gluten-free. It is worthwhile to notice that samples 3 and 4 are rice-based preparations rich in starch known for their influence in the digestibility of the starch-lipids-gliadin (SLG) complexes [36]. Therefore, some discrepancy between optical experimental measurements for ordinary rice-based foods was expected where the formation of SLG complexes may affect the gliadin extraction/purification protocol and the immune recognition events between gliadin and anti-IgG gliadin antibodies.

4. Conclusions

An annealed biosensing platform based on the nanostructured TEM-formed micropatterns on thin glass coverslip are herein proposed for multiplexing detection of gliadin traces in either pure aqueous solutions or extracted from the food products. Three optical immunosensing configurations are compared in terms of the obtained plasmonic analytical performances such as maximum peak intensity versus the corresponding wavelength position. The main difference for the three immunosensors concerns the preparation of the anti-IgG gliadin antibodies dilutions used for the biofunctionalization of thiolated-AuNPs. Specifically, three distinct solutions, namely phosphate saline buffer, ethanol solvent and ultrapure sterilized distilled water were investigated for their influence in the immune-recognition events with the gliadin antigen. Based on the recorded LSPR spectra for each immunosensing configuration, it was found that the one using water for antibo-dies dilution shown the highest maximum plasmonic peak intensity and important LSPR shifts that are proportional with the logarithm of the tested gliadin concentrations. Moreover, the immunosensors using antibodies suspended in water solution has demonstrated a high repeatability and reliability among experiments with a LOD of 0.0075 ppm of gliadin.
LSPR tests performed with real food samples have also shown the ability to detect gliadin during a food survey even if there is an uncertainty on the real value of the gliadin’s content, which could help food manufacturers ensure the food safety of gluten-free labeled foods.

Author Contributions

Conceptualization, R.E.I.; formal analysis, G.C.B. and R.E.I.; funding acquisition, R.E.I. and M.M.; investigation, G.C.B.; methodology, G.C.B., L.Z. and R.E.I.; project administration, R.E.I.; software, G.C.B. and S.P.; supervision, R.E.I.; visualization, S.P.; writing—original draft, G.C.B.; writing—review and editing, R.E.I. All authors have read and agreed to the published version of the manuscript.

Funding

This research was funded by EIPHI Graduate School, grant number ANR17-EURE-0002.

Institutional Review Board Statement

Not applicable.

Informed Consent Statement

Not applicable.

Data Availability Statement

The data presented in this study are available within the article.

Acknowledgments

The authors thank the NANOMAT Champagne–Ardenne Regional Platform for optical and microscopic characterization facilities. L.Z. kindly thanks the Chinese Scholarship Council (CSC) for funding her doctoral scholarship in France (October 2017–April 2021). S.P. thanks the University of Udine for funding a three-month Master’s Program in France (September 2018–December 2018) Prot. N. 0037920 del 18-12-2017. R.E.I. and G.C.B. thank the EIPHI Graduate School (ANR17-EURE-0002) for financial support.

Conflicts of Interest

The authors declare no conflict of interest.

References

  1. Brouns, F.J.P.H.; van Buul, V.J.; Shewry, P.R. Does Wheat Make Us Fat and Sick? J. Cereal Sci. 2013, 58, 209–215. [Google Scholar] [CrossRef]
  2. Commission of the European Communities. Commission regulation (EC) no 41/2009 of 20 January 2009 concerning the composition and labelling of foodstuffs suitable for people intolerant to gluten. Off. J. Eur. Union 2009, 16/13–16/15. Available online: https://eur-lex.europa.eu/legal-content/EN/TXT/?uri=celex:32009R0041 (accessed on 27 November 2021).
  3. Wang, K.; Lu, F.; Li, Z.; Zhad, L.; Han, C. Recent Developments in Gluten-free Bread Baking Approaches: A review. Food Sci. Technol. 2017, 37, 1–9. [Google Scholar] [CrossRef] [Green Version]
  4. Rai, S.; Kaur, A.; Chopra, C.S. Gluten-free Products for Celiac Susceptible People. Front. Nutr. 2018, 5, 116. [Google Scholar] [CrossRef]
  5. Sabenca, C.; Ribeiro, M.; de Sousa, T.; Poeta, P.; Bagulho, A.S.; Igrejas, G. Wheat/Gluten-related Disorders and Gluten-free Diet Misconceptions: A Review. Foods 2021, 10, 1765. [Google Scholar] [CrossRef]
  6. Ortiz, C.; Valenzuela, R.; Lucero, A.Y. Celiac Disease, Non celiac Gluten Sensitivity and Wheat Allergy: Comparison of 3 Different Diseases Triggered by the Same Food. Rev. Chil. Pediatr. 2017, 88, 417–423. [Google Scholar] [CrossRef] [PubMed] [Green Version]
  7. Caio, G.; Volta, U.; Sapone, A.; Leffler, D.A.; De Giogio, R.; Catassi, C.; Fasano, A. Celiac disease: A comprehensive current review. BMC Med. 2019, 17, 142. [Google Scholar] [CrossRef] [PubMed] [Green Version]
  8. Barbaro, M.R.; Cremon, C.; Wrona, D.; Fuschi, D.; Marasco, G.; Stanghellini, V.; Barbara, G. Non-celiac Gluten Sensitivity in the Context of Functional Gastrointestinal Disorders. Nutrients 2021, 12, 3735. [Google Scholar] [CrossRef]
  9. Roszkowska, A.; Pawlicka, M.; Mroczek, A.; Balabuszek, K.; Nieradko-Iwanicka, B. Non-celiac Gluten Sensitivity: A Review. Medicina 2019, 55, 222. [Google Scholar] [CrossRef] [PubMed] [Green Version]
  10. Sergi, C.; Villanacci, V.; Carroccio, A. Non-celiac wheat sensitivity: Rationality and irrationality of a gluten-free diet in individuals affected with non-celiac disease: A review. BMC Gastroenterol. 2021, 21, 5. [Google Scholar] [CrossRef]
  11. Osorio, C.E.; Mejias, J.H.; Rustgi, S. Gluten Detection Methods and Their Critical Role in Assuring Safe Diets for Celiac Patients. Nutrients 2019, 11, 2920. [Google Scholar] [CrossRef] [PubMed] [Green Version]
  12. Melini, F.; Melina, V. Immunological Methods in Gluten Risk Analysis: A Snapshot. Safety 2018, 4, 56. [Google Scholar] [CrossRef] [Green Version]
  13. Ciaurriz, P.; Fernández, F.; Tellechea, E.; Moran, J.F.; Asensio, A.C. Comparison of Four Functionalization Methods of Gold Nanoparticles for Enhancing the Enzyme-Linked Immunosorbent Assay (ELISA). Beilstein J. Nanotechnol. 2017, 8, 244–253. [Google Scholar] [CrossRef] [Green Version]
  14. Yu, J.M.; Lee, J.H.; Park, J.-D.; Choi, Y.-S.; Sung, J.-M.; Jang, H.W. Analyzing Gluten Content in Various Food Products Using Different Types of ELISA Test Kits. Foods 2021, 10, 108. [Google Scholar] [CrossRef] [PubMed]
  15. Codex Alimentarius Commission. Review of Cereals, Pulses and Legumes Methods, Joint FAO/WHO Food Standards Programme Codex Committee on Methods of Analysis and Sampling. 2019. CX/MAS 19/40/3-Add.2. Available online: https://www.fao.org/fao-who-codexalimentarius/sh-proxy/en/?lnk=1&url=https%253A%252F%252Fworkspace.fao.org%252Fsites%252Fcodex%252FMeetings%252FCX-715-40%252Fma40_03_add2e.pdf (accessed on 27 November 2021).
  16. Hahn, S.M. Food Labeling; Gluten-Free Labeling of Fermented or Hydrolyzed Food. Fed. Regist. 2020, 85, 49240–49261. [Google Scholar]
  17. From Polyclonal Sera to Recombinant Antibodies: A Review of immunological Detection of Gluten in Foodstuff. Foods 2021, 10, 66.
  18. Schalk, K.; Koehler, P.; Scherf, K.A. Targeted liquid chromatography tandem mass spectrometry to quantitate wheat gluten using well-defined reference proteins. PLoS ONE 2018, 13, e0192804. [Google Scholar] [CrossRef] [Green Version]
  19. Panda, R.; Garber, A.E. Western Blot Analysis of Fermented-Hydrolyzed Foods Utilizing Gluten-Specific Antibodies Employed in a Novel Multiplex Competitive ELISA. Anal. Bioanal. Chem. 2019, 411, 5159–5174. [Google Scholar] [CrossRef]
  20. Bromilow, S.N.L.; Gethings, L.A.; Langridge, J.I.; Shewry, P.R.; Buckley, M.; Bromley, M.J.; Mills, E.N.C. Comprehensive Proteomic Profiling of Wheat Gluten Using a Combination of Data-Independent and Data-Dependent Acquisition. Front. Plant 2017, 7, 2020. [Google Scholar] [CrossRef] [PubMed] [Green Version]
  21. Ahmed, N.; Meng, M. Detection of Gluten-Rich Cereals in Processed Foods with Enhanced Sensitivity by Targeting Mitochondrial DNA Using PCR. Food Anal. Methods 2019, 12, 811–825. [Google Scholar] [CrossRef]
  22. Mujico, J.R.; Lombardía, M.; Mena, M.C.; Méndez, E.; Albar, J.P. A highly sensitive real-time PCR system for quantification of wheat contamination in gluten-free food for celiac patients. Food Chem. 2011, 128, 795–801. [Google Scholar] [CrossRef]
  23. Rossella, S.; Nicolò, D.; Rosanna, T.; Rebeca, M.C.; de-los-Santos, I.N.; Jesffls, M.L. Selection of Anti-gluten DNA Aptamers in a Deep Eutectic Solvent. Angew. Chem. 2018, 130, 13032–13036. [Google Scholar]
  24. Miranda-Castro, R.; de-los-Santos-Álvarez, N.; Miranda-Ordieres, A.J.; Lobo-Castañón, M.J. Harnessing Aptamers to Overcome Channenges in Gluten Detection. Biosensors 2016, 6, 16. [Google Scholar] [CrossRef] [PubMed]
  25. Perumal, V.; Hashim, U. Advances in biosensors: Principle, architecture and applications. J. Appl. Biomed. 2014, 12, 1–15. [Google Scholar] [CrossRef]
  26. Gupta, S.; Kaushal, A.; Kumar, A.; Kumar, D. Recent Advances in Biosensors for Diagnosis of Celiac Disease: A Review. Biotechnol. Bioeng. 2019, 116, 444–451. [Google Scholar] [CrossRef]
  27. Pasinszki, T.; Krebsz, M. Biosensors for Non-invasive Detection of Celiac Disease Biomarkers in Body Fluids. Biosensors 2018, 8, 55. [Google Scholar] [CrossRef] [Green Version]
  28. Martín-Fernández, B.; De-Los-Santos-Álvarez, N.; Martín-Clemente, J.P.; Lobo-Castañón, M.J.; López-Ruiz, B. Challenging Genosensors in Food Samples: The Case of Gluten Determination in Highly Processed Samples. Talanta 2016, 146, 490–495. [Google Scholar] [CrossRef]
  29. Marín-Barroso, E.; Messina, G.A.; Bertolino, F.A.; Raba, J.; Pereira, S.V. Electrochemical Immunosensor Modified with Carbon Nanofibers Coupled to a Paper Platform for the Determination of Gliadins in Food Samples. Anal. Methods 2019, 11, 2170–2178. [Google Scholar] [CrossRef]
  30. Bariani, G.C.; Zhou, L.; Poggesi, S.; Mittapalli, R.; Manzano, M.; Ionescu, R.E. Acoustic Multi-detection of Gliadin using QCM Crystals Patterned with Controlled Sectors of TEM Grid and Annealed Nanoislands on Gold Electrode. Nanomaterials 2020, 10, 790. [Google Scholar] [CrossRef]
  31. Jia, K.; Bijeon, J.L.; Adam, P.M.; Ionescu, R.E. Large Scale Fabrication of Gold Nano-Structured Substrates via High Temperature Annealing and Their Direct Use for the LSPR Detection of Atrazine. Plasmonics 2013, 8, 143–151. [Google Scholar] [CrossRef]
  32. Kharati, M.; Rabiee, M.; Rostami-Nejad, M.; Aghamohammadi, E.; Asadzadeh-aghdaei, H.; Zali, M.R.; Rabiee, N.; Farahi, Y.; Bagherzadeh, M.; Webster, T.J. Development of a Nano Biosensor for Anti-gliadin detection for Celiac disease based on suspension microarray. Biomed. Phys. Eng. Express 2020, 6, 055015. [Google Scholar] [CrossRef] [PubMed]
  33. Ren, B.; Liu, G.K.; Lian, X.B.; Yang, Z.L.; Tian, Z.Q. Raman Spectroscopy on Transition Metals. Anal. Bioanal. Chem. 2007, 388, 29–45. [Google Scholar] [CrossRef] [PubMed] [Green Version]
  34. Hua, Z.; Yu, T.; Liu, D.; Xianyu, Y. Recent Advances in Gold Nanoparticles-based Biosensors for Food Safety Detection. Biosens. Bioelectron. 2021, 179, 113076. [Google Scholar] [CrossRef] [PubMed]
  35. Chu, P.-T.; Lin, C.-S.; Chen, W.-J.; Chen, C.-F.; Wen, H.-W. Detection of Gliadin in Foods Using a Quartz Crystal Microbalance Biosensor that Incorporates Gold Nanoparticles. J. Agric. Food Chem. 2012, 60, 6483–6492. [Google Scholar] [CrossRef] [Green Version]
  36. Kang, X.; Sui, J.; Zhang, X.; Wei, G.; Wang, B.; Liu, P.; Qui, L.; EL-Banna, H.A.; Cui, B.; Abd El-Aty, A.M. The Impact of Gliadin and Glutenin on the Formation and Structure of Starch-Lipid Complexes. Food Chem. 2022, 371, 131095. [Google Scholar] [CrossRef]
Figure 1. Preparation of the gliadin immunosensor on annealed gold nanostructured glass coverslip: (1) thiol 11-MUA; (2) immobilization of anti-IgG gliadin antibodies; (2*) specific immune-recognition of gliadin molecules; (3) immobilization of anti-IgG BSA antibodies, (3*) non-specific immune-recognition of gliadin molecules (A) and photos of glass coverslip after Au evaporation and annealing at 550 °C for 3 h on a hot plate (B).
Chemosensors 10 00038 g001
Figure 2. SEM images of the patterns of Tri-Slot TEM grid on coverslips after annealing on a hot plate (A) scale—1 mm and the morphology of AuNPs (B) scale—500 nm.
Chemosensors 10 00038 g002
Figure 3. LSPR spectra in the presence of five gliadin concentrations and anti-IgG antibody in PBS buffer for biofunctionalization of metallic nanostructures: (1) annealed 4 nm AuNPs; (2) MUA/AuNPs; (3) anti-gliadin/MUA/AuNPs; (4) 0.1 ppm gliadin; (5) 1 ppm gliadin; (6) 10 ppm gliadin; (7) 100 ppm gliadin; (8) 1000 ppm gliadin. (A.u.—absorbance units).
Chemosensors 10 00038 g003
Figure 4. LSPR spectra in the presence of five gliadin concentrations and anti-IgG antibody in ethanol solvent for biofunctionalization of metallic nanostructures: (1) annealed 4 nm AuNPs; (2) MUA/AuNPs; (3) anti-gliadin/MUA/AuNPs; (4) 0.1 ppm gliadin; (5) 1 ppm gliadin; (6) 10 ppm gliadin; (7) 100 ppm gliadin; (8) 1000 ppm gliadin. (A.u.—absorbance units).
Chemosensors 10 00038 g004
Figure 5. LSPR spectra in the presence of five gliadin concentrations and anti-IgG antibody in aqueous solution for biofunctionalization of metallic nanostructures: (1) annealed 4 nm AuNPs; (2) anti-gliadin/MUA/AuNPs; (3) 0.1 ppm gliadin; (4) 1 ppm gliadin; (5) 10 ppm gliadin; (6) 100 ppm gliadin; (7) 1000 ppm gliadin. (A.u.—absorbance units).
Chemosensors 10 00038 g005
Figure 6. Dose/response curves of plasmonic peak intensity (A) and of the corresponding plasmon resonance maximum (B) for five gliadin concentrations after incubation with anti-IgG gliadin antibodies functionalized AuNPs suspended in three individual solutions: in 0.1 M PBS (blue color); in 70% ethanol (orange color) and in ddwater (green color).
Chemosensors 10 00038 g006
Figure 7. LSPR spectra of two sets of control experiments recorded for five gliadin concentrations (A) in the absence of anti-IgG gliadin antibody and (B) in the presence of non-specific anti-IgG BSA-antibody suspended in aqueous solution (1) annealed 4 nm AuNPs; (2) MUA/AuNPs; (3) anti-gliadin/MUA/AuNPs; (4) 0.1 ppm gliadin; (5) 1 ppm gliadin; (6) 10 ppm gliadin; (7) 100 ppm gliadin and (8) 1000 ppm gliadin. (A.u.—absorbance units).
Chemosensors 10 00038 g007
Figure 8. LSPR spectra of supernatants extracted from five food samples (1 to 5) in the presence of specific anti-IgG gliadin antibodies suspended in ddwater and immobilized on MUA/AuNPs formed on annealed coverslip. (A.u.—absorbance units).
Chemosensors 10 00038 g008
Table 1. Summary of plasmonic evolutions (maximum peak intensity and their wavelength position) of biofunctionalized AuNPs with anti-IgG gliadin antibodies suspended in three individual solutions: in 0.1 M PBS (blue color); in 70% ethanol (in orange) and in ddwater (in green). (A.u.—absorbance units).
PBS 0.1 MWaterEthanol 70%
GliadinIntensityWavelengthIntensityWavelengthIntensityWavelength
(ppm)(A.u.)(nm)(A.u.)(nm)(A.u.)(nm)
0.10.270 ± 0.0125730.323 ± 0.0015700.229 ± 0.019557
10.269 ± 0.0085800.338 ± 0.0015760.258 ± 0.012564
100.274 ± 0.0105810.351 ± 0.0005810.267 ± 0.022576
1000.275 ± 0.0075690.367 ± 0.0025850.237 ± 0.005560
10000.283 ± 0.0125750.378 ± 0.0015910.231 ± 0.010559
Table 2. Estimated errors on the gliadin content using the LSPR peak intensity measurement.
c (ppm)Δy Assimilated to Standard DeviationΔc (ppm)
0.100.00090.01
1.000.00080.13
10.000.00040.66
1000.001525
10000.0012198
Table 3. Estimated errors on the gliadin content using the plasmon resonance maximum.
c (ppm)Δy Assimilated to the Spectrometer Accuracy (nm)Δc (ppm)
0.10.20.009
10.09
100.9
1009
100090
Publisher’s Note: MDPI stays neutral with regard to jurisdictional claims in published maps and institutional affiliations.

