Review

ZnO Transducers for Photoluminescence-Based Biosensors: A Review

i3N, Department of Physics, University of Aveiro, 3810-193 Aveiro, Portugal
*
Author to whom correspondence should be addressed.
Chemosensors 2022, 10(2), 39; https://doi.org/10.3390/chemosensors10020039
Submission received: 17 December 2021 / Revised: 7 January 2022 / Accepted: 17 January 2022 / Published: 21 January 2022
(This article belongs to the Special Issue Low-Cost Chemo/Bio-Sensors Based on Nanomaterials)

Abstract

:
Zinc oxide (ZnO) is a wide bandgap semiconductor material that has been widely explored for countless applications, including in biosensing. Among its interesting properties, its remarkable photoluminescence (PL), which typically exhibits an intense signal at room temperature (RT), arises as an extremely appealing alternative transduction approach due to the high sensitivity of its surface properties, providing high sensitivity and selectivity to the sensors relying on luminescence output. Therefore, even though not widely explored, in recent years some studies have been devoted to the use of the PL features of ZnO as an optical transducer for detection and quantification of specific analytes. Hence, in the present paper, we revised the works that have been published in the last few years concerning the use of ZnO nanostructures as the transducer element in different types of PL-based biosensors, namely enzymatic and immunosensors, towards the detection of analytes relevant for health and environment, like antibiotics, glucose, bacteria, virus or even tumor biomarkers. A comprehensive discussion on the possible physical mechanisms that rule the optical sensing response is also provided, as well as a warning regarding the effect that the buffer solution may play on the sensing experiments, as it was seen that the use of phosphate-containing solutions significantly affects the stability of the ZnO nanostructures, which may conduct to misleading interpretations of the sensing results and unreliable conclusions.

1. Introduction

Over the last decades, the field of biosensing has experienced outstanding developments due to the increasing need in finding simple, cost-effective, fast, and user-friendly solutions capable of identifying and measuring biomarkers with an accurate and reliable response. Such devices are an essential prerequisite for the prevention, monitoring, and treatment of diseases. Furthermore, biosensors find applications ranging from health, environmental, food and water monitoring to biosafety [1,2,3,4]. Since the first report on a glucose biosensor, which dates from the 1960s [5,6], countless efforts have been devoted to this topic and new works reporting the use of novel materials and/or transduction approaches are published daily [7,8,9,10,11,12]. This research was further boosted by the recent health crisis with the COVID-19 pandemic, which strongly increased the awareness of the population to the need for reliable solutions for a prompt diagnosis [13,14].
A biosensor is typically described as an analytic device that transforms the response provided by the interaction between a biological recognition element (bioreceptor) and its specific analyte (the substance of interest to detect) into a quantitative or semi-quantitative analytical signal (e.g., electrical, optical, electrochemical, colorimetric, etc.) that correlates with the concentration of the analyte [2,15,16,17,18]. These biological recognition elements are placed in direct spatial contact with the transducer material, forming the biorecognition layer, and are responsible for specifically recognizing and interacting with the target species [2,15,19]. On the other hand, the transducer translates the bio-recognition event into a signal that can be assessed and transmitted to the output system [2,15,17,19]. Indeed, the selection of the transducer is a paramount factor, as it will determine the type of signal that can be used for transduction. Besides, it plays a major role in the number of available analyte binding sites, as those depend on the quantity of bioreceptor that can be attached to the surface of the transducer [19,20].
Typically, the biosensors are characterized by some important figures of merit, namely:
(i)
specificity (the ability of the bioreceptor to detect the specific analyte in a complex sample);
(ii)
sensitivity (capacity of the biosensor to discriminate between two close analyte concentrations, which corresponds to the slope of the calibration curve);
(iii)
linearity (accuracy of the sensor’s response to a straight line, i.e., the response should change linearly with the analyte concentration in the range of interest);
(iv)
limit of detection (LOD, minimum quantity of analyte that the biosensor can accurately detect);
(v)
reproducibility (the ability of sensors prepared and measured under the same conditions to deliver identical outputs);
(vi)
stability (influence of the surrounding environment, e.g., temperature, pH, storage conditions on the sensing response) [16,17,21].
The progress in nanotechnology has opened the door for remarkable achievements in this field, namely by employing nanomaterials as building blocks for such biosensing devices [7,15,22,23,24,25]. Properties such as the high surface-to-volume ratio evidenced by the materials at the nanoscale are greatly appraised, promoting a large active area for sensing, which increases the sensitivity to the biological targets and enables a fast detection, with shorter analysis time, features highly desirable in developing biosensors [15,26,27]. Among the numerous nanostructured materials being employed, metal oxide semiconductors, particularly ZnO, are widely investigated for designing novel transducer platforms, owning to properties as non-toxicity, cost-effective production, and simple synthesis methods [1,2,4,28,29]. Additional features have been highlighted for ZnO, namely its biocompatibility and its variety of morphologies that can be easily changed in a controllable way to enhance their surface area [1,4,30,31]. Furthermore, as surface properties acquire a particularly relevant role at the nanoscale, having different morphologies and thus different surface conditions can also promote manageable variations in its properties that may be useful for sensing [31,32]. Additionally, ZnO also exhibits a high isoelectric point (9.1–9.5) that helps the immobilization of biomolecules, like antibodies or enzymes, which usually present a lower isoelectric point than ZnO, favoring electrostatic interactions between them [33,34,35]. And finally, one of the most important features is its noteworthy optical properties [32,36,37,38].
ZnO is a direct wide bandgap semiconductor (Eg~3.3 eV at RT [36]), which exhibits a large free-exciton (FX) binding energy, 60 meV, enabling the observation of excitonic emission processes at and above RT, thus offering the possibility of exploring such property in optical devices based on excitonic effects [36,37]. Besides the excitonic-related transition in the UV range, ZnO is known to possess a myriad of other optically active defects spanning from the UV to the infrared [36,39,40,41].
When dealing with this semiconductor at the nanoscale, the surface properties are likely to play a decisive role in the luminescence properties due to the higher surface-to-volume ratio. Hence, surface effects/defects may dominate over the bulk-related radiative recombination. Thus, the PL spectra will be affected and the appearance of new optical features can be promoted [32]. Indeed, it is this high sensitivity of the ZnO luminescence properties to the surface conditions that is emerging as a potential and promising tool in the sensing area.
Optical transduction has been regarded as an excellent alternative to the traditional electrochemical techniques, typically providing high sensitivity, real-time monitoring, and simple sample handling/manipulation, enabling a contactless measurement of the sensor’s response [2,42,43]. Thus, adding a biomolecular probe (e.g., protein, enzyme, deoxyribonucleic acid (DNA), antibody, etc.) to an optical transducer as ZnO will enable the development of optical biosensors with the characteristics listed above and with high specificity [42].
The use of ZnO nanostructures in biosensing devices has been the subject of several review articles over the last few years, emphasizing its unique properties in different types of devices (e.g., electrical, electrochemical, and optical biosensors) targeting different analytes [1,2,44,45,46,47]. Notwithstanding, the focus on its PL as a possible transduction mechanism is far less surveyed. Tereshchenko et al. [2] addressed this subject in a review paper published in 2016 where an overview of optical biosensors using ZnO nanostructures was presented. Since PL signals are very sensitive to small modifications in the materials’ surface, it is a powerful method to assess surface phenomena and evaluate the reactions that occur at the interface between the transducer and the bioreceptor when the biorecognition events take place, thus providing high sensitivity and specificity to sensors based on such signal [2]. Consequently, the use of the luminescence features of ZnO as an alternative transduction approach is being exploited in this field [2,9,34,35,42,48,49,50,51,52,53], in particular for direct detection, where the signal provided by the transducer is the one that is used for sensing, without the need of additional probes or tags [2]. As a number of relevant works were conducted more recently than the above-mentioned review, the present paper intends to fill that lack of compiled information on this specific topic. Therefore, here the main results that have been published up to now are presented, together with some new achievements attained by our research team. A discussion on the possible phenomena that account for the sensing response is also included. Additionally, some considerations are provided regarding the importance of selecting a suitable buffer solution for the surface modification and sensing evaluation, as it may affect the final response of the ZnO-based biosensors in a non-negligible way.

2. Overview of the Photoluminescence Properties of ZnO

The optical properties of ZnO have been extensively scrutinized for several decades, particularly regarding the interest in its remarkable emission, motivating an extensive number of PL studies [32,36,37,39,54,55,56,57,58,59]. At the high energies region (UV spectral region) of the emission spectra, FX transitions are observed, which are originated from the transitions of the exciton energy levels to the three valence bands of ZnO, A, B, and C, split by the action of the crystal field and spin-orbit interaction [36]. In the case of bulk ZnO, the FX transitions to the A-valence band (FXA) is typically located at ~3.377 eV, while a weak B-exciton transition was identified centered at 3.3898 eV [36], accounting for the reported energy separation of the A and B free exciton lines of ΔAB = 9–15 meV [36,39,55,60,61]. Tsoi et al. [62] reported values of 3.3760 eV, 3.3813 eV, and 3.4213 eV for the A, B, and C free exciton transitions (at 8 K), respectively.
The sharp lines that dominate the near band edge (NBE) spectral region, when probed at low temperature, are attributed to various donor-bound exciton (DX) recombinations. The DX recombination transitions are usually followed by longitudinal optical (LO) phonon replicas with an energy separation around 72 meV [61]. The recombination of ionized donor bound excitons (D+X) is normally found at 3.367 eV, whereas the neutral DX (D0X) emission is observed between 3.3628 eV and 3.359 eV [38]. Up to eleven excitonic recombinations have been identified in high-quality ZnO crystals due to DX. Although excitons bound to elements like H (I4), Al (I6), In (I8), and Ga (I9) were already reported in the literature, the chemical nature of the donor species associated with the remaining ones is still not completely clear [63]. Even though the DX recombinations dominate the PL spectra at low temperature, as the temperature increases DX dissociate and, at RT, the FX emission becomes the dominant one [36,63].
In the energy range between 3.34–3.31 eV, other features can appear associated to the two-electron satellite (TES) transitions. These transitions are related to radiative recombinations of a DX that leaves the donors in an excited state, thus leading to a recombination with lower energy than the one of the DX, with an energy separation that corresponds to the difference between the first excited state and the ground one of the donors [39]. Between 3.4–3.1 eV, transitions linked to the phonon-assisted DX can occur, as well as the donor-acceptor pairs (DAP) recombinations and their phonon replicas [32,38,39]. Moreover, a transition at 3.333 eV is often identified, the so-called Y-transition, assigned to excitonic recombination related to structural defects [38].
At 3.31 eV another emission line is frequently observed, particularly when dealing with nanostructures and samples with a high surface-to-volume ratio [57,64,65,66,67,68,69]. Several origins have been pointed out as responsible for this transition, namely surface excitonic contributions [65], structural defects-related transitions (e.g., stacking faults) [57,64], as well as other surface defects [67,68]. Nevertheless, it seems that different defects may give rise to radiative recombination in this particular energy, depending on the structural and surface properties of the samples. Thus, care must be taken in analyzing the PL data and a correlation with additional information (e.g., structural) is advised.
Likewise, in the visible spectral region, several broad emission bands have been reported, peaked in the blue, green, yellow, and orange/red [32,36,39,40,61,70,71,72,73], and innumerable defects have been correlated with such transitions. Probably the most investigated radiative transitions are the ones that give rise to a broad green luminescence (GL) band [36,39,40,70,74,75,76]. Among the different origins pointed out, intrinsic defects in the ZnO matrix, namely oxygen/zinc vacancies (VO/VZn), interstitial Zn atoms (Zni), Zn antisites (ZnO), transitions from Zni to VZn, have been highly debated and linked with the unstructured GL [36,75,76,77,78]. On the other hand, extrinsic impurities, especially Cu-related, have been suggested as the ones responsible for the structured GL that is observed at low temperatures [70,74,79]. An example of such band is depicted in Figure 1 for the case of the microrods (MR) produced by the laser-assisted flow deposition (LAFD) method [32,80]. The fact that the GL exhibits different spectral shapes and even slight shifts in its peak position depending on the type of samples and their growth methods is a clear indication that distinct types of defects can lead to radiative recombination in this spectral region. Furthermore, diverse defects can be present simultaneously in the same sample, contributing to the broadening of the band and increasing the complexity of its analysis.
Regarding the blue (BL), yellow (YL), and orange/red (RL) luminescence bands, fewer studies are available when compared with the GL. Nonetheless, the defects that have been correlated with these emissions are similar to the ones reported for the GL, appearing either as single point defects or by forming complexes with other defects [32,73]. For instance, the BL has been associated with transitions from the conduction band and oxygen antisites (OZn) or VZn [73,81,82,83]. Indeed, the VZn exhibits one of the lowest formation energies in ZnO [76]. Therefore, this defect and its complexes with others are amongst the most frequently assigned to the broad visible bands. Different charge states of the VZn result in emission at the blue (414 nm/~2.99 eV), green (525 nm/~2.36 eV), and orange/red (600 nm/~2.07 eV) [83]. Moreover, it was proposed that the YL and RL emissions arise from similar deep levels but with different initial states, for instance, from the conduction band or shallow donors to deep acceptors [36,40,84]. The presence of Li acceptors or interstitial oxygen (Oi) defects has also been linked with the observation of the YL [36,39,83,85,86]. The latter was also correlated with the RL, while surface dislocations or Zni defects have been pointed out as possible candidates as well [36,71,83,87].
Despite the above discussion regarding the possible defects/impurities in the origin of the radiative recombinations observed in ZnO, it is crucial to bear in mind that when one is analyzing crystals with a high surface-to-volume ratio, additional features may arise derived from the surface properties, which can overrule the PL output of the ZnO nanostructures [32,88]. Particularly, many studies highlight the role of surface defects in the origin of the GL [40,59,71,89,90,91], which is especially prevalent in structures grown from vapor-based methods [71,92,93]. Conversely, the YL is commonly observed in solution-grown ZnO (e.g., hydrothermal method) [94,95,96,97]. For instance, the presence of Zn(OH)2 or adsorbed hydroxyl groups at the surface of this semiconductor has been linked to the YL, disappearing after annealing [71,98]. Moreover, studies from our group in the ZnO MR produced by LAFD revealed the link between the 3.31 eV emission line (see the MR PL spectrum in Figure 1) and the presence of surface defects, which could be reduced and even removed by plasma treatments [68].
Indeed, the synthesis method plays a vital role in the defect incorporation, and thus, in the optical active defects present in the structures [80,99,100]. Moreover, even when the same method is applied, the grown conditions (e.g., temperature, atmosphere) affect the final properties of the crystals, like size and morphology, which in turn also influence the PL outcome. This is clearly demonstrated in Figure 1, where the spectra of three different ZnO morphologies, grown by the same technique, LAFD, and from the same precursors, are displayed, exhibiting distinct PL responses depending on the samples’ characteristics [80].

3. Photoluminescence-Based Sensing
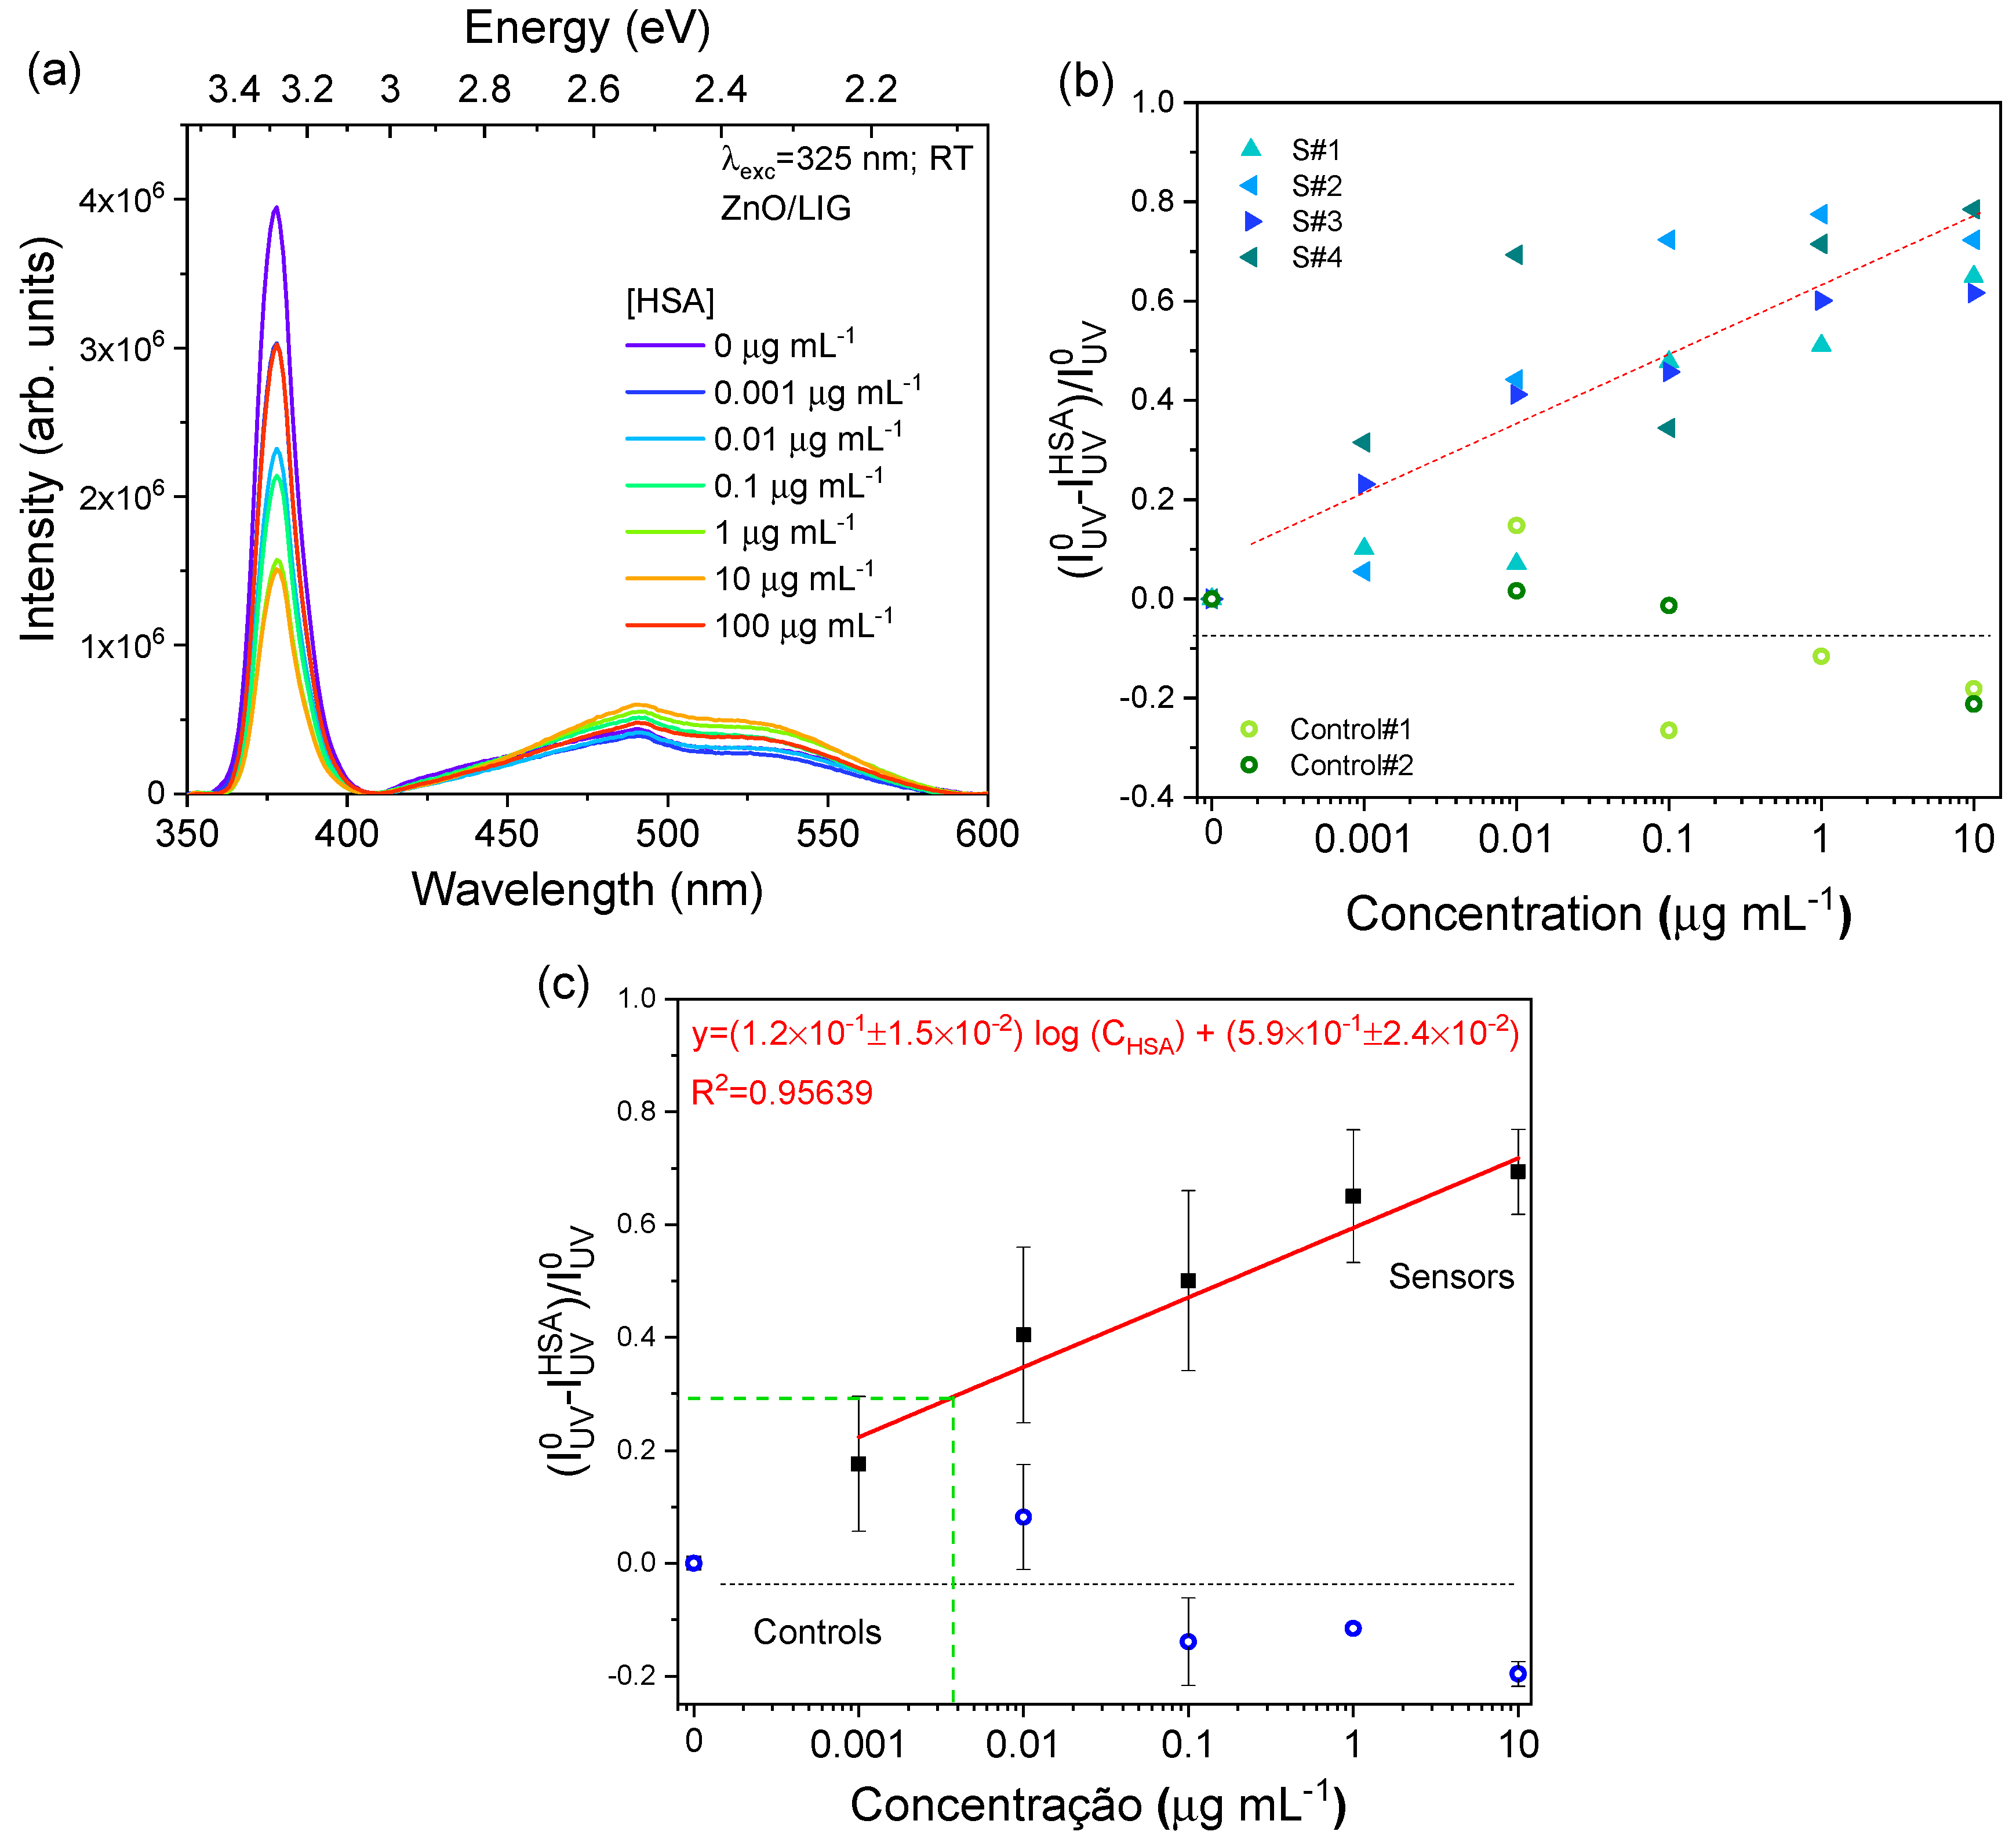
3.1. Immunosensors

ZnO PL-based sensing has been mostly reported in the development of immunosensing devices. An immunosensor is a biosensor where antibodies (AB) are used as biorecognition elements. It relies on the high specificity and affinity conferred by the biomolecular recognition of AB to its specific antigen [101,102]. Upon such immune reaction, a stable immunocomplex is formed and the biorecognition event is then converted into a measurable signal with the aid of the transducer since the formation of this complex alters the physical properties of the surface where the antibodies are immobilized (e.g., surface charge) [101,102]. Among the advantages of this type of biosensors, their high sensitivity, specificity and speed of detection are the most highlighted ones [101,103].
Table 1 summarizes some of the most relevant works reported so far in the literature concerning the use of the ZnO PL signal in immunosensors. At this point, we would like to highlight that even though most of the works devoted to the use of ZnO nanostructures in biosensing research use phosphate-based buffer solutions, a recent study by our group pointed out the fact that ZnO conversion into zinc phosphate takes place when in contact with phosphate ions, even at the physiological pH [104]. A detailed discussion on this topic is presented in Section 4 of this paper. Hence, special care must be taken when analyzing sensing data obtained using this type of buffer solution.
As can be seen in Table 1, different analytes have already been tested with promising results. The groups of Viter et al. [33,34,50,51] and Tereshchenko et al. [105] are among the most active in the field of PL-based biosensing. For instance, in 2014, Viter et al. [50] conducted a work in which ZnO nanorods produced via gaseous-disperse synthesis (GDS) and deposited on quartz substrates were employed as transducers in a biosensor that aimed the detection of Salmonella. The PL spectrum of the ZnO nanorods was recorded under 355 nm excitation and revealed a maximum at ~376 nm, related to the NBE recombination, and a weaker broad and asymmetric band peaked at ~520 nm. The former was the dominant emission, with an intensity nearly 100 times stronger than the one measured for the visible band. Therefore, the detection studies were focused on the NBE recombination. Upon the reaction of anti-Salmonella AB, physically adsorbed onto ZnO nanorods, with the Salmonella, the PL intensity decreased proportionally to the analyte concentrations in the range of 102–106 cell mL−1 (see Figure 2) [50]. This behavior was attributed to the immune reaction between Salmonella and anti-Salmonella AB, pointing to ZnO as a potential material for optical biosensor transducers.
In 2017, Tereshchenko et al. [105] employed ZnO thin films produced via atomic layer deposition (ALD) to construct a biosensor for the detection of Grapevine virus A-type (GVA) proteins. As in the previous case, the PL signal of the ZnO was assessed using 355 nm photons from a solid-state laser as the excitation source. Upon physical adsorption of the anti-GVA AB (bioreceptor) onto ZnO films, remarkable changes were observed in the spectra, namely the appearance of a PL emission with a maximum at ~452 nm and spanning from 400 nm to 550 nm, attributed to the interaction between the anti-GVA AB and the ZnO. The authors used this signal to optimize the AB concentration to be employed in further testing. After choosing the AB optimal concentration, sensing tests were carried out by placing an aliquot of the GVA-antigens solution onto the surface of the transducer and probing the subsequent PL spectra. Concentrations from 1 pg mL−1 to 1 μg mL−1 of GVA-antigens dissolved in phosphate buffer saline (PBS) were evaluated. The PL intensity of the band peaked at ~452 nm decreased with the increase in the antigen concentration in the range from 1 pg mL−1 to 10 ng mL−1, while further increase in the GVA-antigens concentration led to an increase in the PL intensity up to 1 µg mL−1. Therefore, the authors conclude that the developed sensor allowed the detection and quantification of the GVA proteins in the range from 1 pg mL−1 to 10 ng mL−1 [105].
An immunosensor for Ochratoxin A (OTA) was reported by Viter et al. [34]. The anti-OTA AB were properly oriented following the Protein-A functionalization strategy onto ZnO nanorods prepared by the GDS method. The sensing experiments were conducted by adding 200 µL of the OTA containing solutions (concentrations from 0.0001–10 ng mL−1) to the immunosensor cell and monitoring the evolution of PL outcome by using 337 nm excitation [34]. As depicted in Figure 3, the intensity of the PL signal progressively decreases with increasing analyte concentration. These sensors displayed good sensitivity in the range of 0.1–1 ng mL−1 and a LOD value of 0.01 ng mL−1 was estimated [34].
In 2019, the same group also described an immunosensing device for the determination of human leukemic cells using similar ZnO nanorod platforms [51]. In this case, the ZnO nanorods were modified with fluorescein isothiocyanate (FITC)-labelled AB and cells. More specifically, FITC-conjugated mouse AB against the human cluster of differentiation (CD) CD19 protein (anti-CD19-FITC* AB), which is the protein that is expressed in the development of B-cells. Anti-IgG1-FITC* AB were added to the nanorods for control studies and human leukemic IM9 cells were used as analytes. Healthy human’s peripheral blood mononuclear cells (PBMC) were also tested against the functionalized ZnO to evaluate specificity.
The detection experiments were carried out by incubating either the IM9 or the PBMC cells with either the anti-CD19-FITC* or the anti-IgG1-FITC* AB and evaluating the resultant PL signal of the ZnO sensing platform (337 nm laser line as the excitation source) [51]. An increase in the intensity of the ZnO PL signal was identified when the anti-CD19-FITC* AB were incubated at the surface of the nanorods, particularly in the NBE spectral region, correlating with the AB concentration. To assure a proper binding to the ZnO surface, the AB were further fixated using paraformaldehyde (PFA) to establish a cross-link with the thiol, amine, carboxyl, and hydroxyl groups of proteins [51]. This fixation with PFA led to a decrease of the NBE intensity to values comparable to the initially observed for the ZnO nanorods. Afterwards, when the samples modified with the anti-CD19 AB and the two cell lines were inspected, the authors verified that the behavior of the NBE intensity differs for the IM9 and PBMC (control) cells. Even though an increase was observed in both cases, the former resulted in a more pronounced enhancement in the PL intensity than the one depicted for the control case. Moreover, analyzing the PL signal as a function of the CD19-positive (IM9) cell concentration revealed an intensity increase in the range up to ~500 cell mm−2, while higher concentrations resulted in a stabilization of the signal. In the case of the samples modified with the IgG1 AB tested in the presence of IM9 cells, an increase in the signal was also identified, however with a much lower expression.
The use of the ZnO PL signal for the detection of human leukemic cells (T-lymphoblasts) was further explored by Tamashevski et al. [49], this time using the MOLT-4 cell line as the analyte and anti-CD5 AB, specific for CD proteins typically present on the surface of cancer cells, as bioreceptor. The cell culture MOLT-4 was employed as the origin of the T-lymphoblastic cells, derived from the peripheral blood of a patient with acute lymphoblastic leukemia. In this case, the AB were immobilized on the surface of the ZnO nanorods via physical adsorption and the PL signal was examined upon the addition of different AB concentrations, from 2.5 to 50 µg mL−1, to infer the optimal concentration to proceed with the detection experiments. The selection was made by choosing the concentration for which the PL signal was maximized, which corresponded to 5 µg mL−1. Once again, the NBE PL peak was the one selected to be monitored. Then, this signal was probed after immobilizing the T-lymphoblasts MOLT-4 cells in a range of concentrations between 10 to 1000 cells per sample. Analogously to what was reported in their previous work with the IM9 cell line [51], an increase in the PL intensity was observed for concentrations up to 500 cells, experiencing a saturation of the signal for higher values. However, control tests carried out with anti-IgG2a AB and the MOLT-4 cells also displayed an enhancement of the PL intensity. Nevertheless, this increase was seen to be significantly lower than in the case of the specific anti-CD5 AB, as in the previous work [51], attesting the sensing ability.
An immunosensor for the detection of bovine leukemia virus (BLV) AB were also reported by Viter et al. [33]. For this sensor, BLV proteins gp51 were used as biorecognition elements, as they correspond to the antigens specific for the AB against BLV. ZnO samples modified with poly(allylamine hydrochloride) (PAH) and then incubated with BLV protein gp51 were also prepared to compare the results between both functionalization approaches [33]. Similarly to previous results by these authors [34,50], when excited with 337 nm photons, the ZnO PL spectrum was dominated by the narrow NBE emission band in the UV spectral region, with an additional broad visible band, whose intensity was much weaker than the UV emission. Hence, the main analysis was dedicated to the NBE emission behavior upon incubation with either ‘BLV-positive’ or ’BLV-negative’ (control without anti-gp51 AB) cattle serum. In the first case, a decrease in the PL intensity signal was observed for ZnO either with or without PAH. However, in the case of the nanorods modified with PAH, this decrease was seen to be fairly linear with the logarithm of the analyte concentration (see Figure 4), while for the samples prepared without PAH a signal saturation was observed [33]. This behavior was explained by the fact that, for direct binding, the random orientation of BLV-antigens significantly reduces the sensitivity of the sensing platforms as fewer binding sites are available for the AB when compared with the PAH-assisted case. PAH is expected to provide a better alignment of the BLV-antigens, as well as enhanced electrostatic attraction of gp51 protein to the surface of the ZnO. Conversely, when the ‘BLV-negative’ probe was incubated onto the sensing platforms, the PL signal experienced an increase in its intensity, similar for either the samples with or without PAH. The PL behavior for the gp51&BSA/PAH/ZnO structures upon incubation with different concentrations of ‘BLV-positive’ or ’BLV-negative’ cattle serum is depicted in Figure 4.
In 2021, Myndrul et al. [106] used polyacrylonitrile (PAN)/ZnO nanofibres as the transducer integrated into a microfluidic cell to detect Aflatoxin B1 (AFB1), which is a toxin with a harmful effect in human health. The anti-AFB1 AB were covalently immobilized onto PAN/ZnO fibers and the PL properties were assessed using a He-Cd laser (325 nm) as the excitation source. The emission was seen to be dominated by a broad visible band peaked at ~565 nm. The detection experiments were then conducted by flowing different analyte concentrations through the microfluidic cell and recording the resultant PL signal. Concentrations in the range between 0.1 and 100 ng mL−1 were evaluated [106]. Similar to what happened in the case of the human leukemic cells [49,51], the PL intensity increased with the AFB1 concentration, displaying a 25% increase between the references and the concentration of 100 ng mL−1. A saturation in the signal occurred for concentrations above 20 ng mL−1, suggesting that all the AB became bound to the analyte at such concentration, hampering probing higher analyte contents and establishing an upper value for detection. Therefore, a detection range from 0.1 to 20 ng mL−1 was accomplished for those sensors, presenting a LOD of 39 pg mL−1, considerably lower than the values stipulated for the presence of such toxins in alimentary products [106].
Recently, our research group has also devoted great efforts studying ZnO-based transducers to be explored into optical biosensors [9,107]. In 2020, we investigated a PL-based immunosensor for the detection of the human chorionic gonadotropin (hCG) hormone [9]. In this case, the anti-hCG AB were physically adsorbed onto ZnO tetrapods produced by LAFD. As in the case of some of the above-mentioned works, the NBE emission was selected to be monitored since it was the dominant emission under 325 nm excitation and also the one that evidenced a more reproducible and distinct behavior during the performed tests. When hCG was added to the sensors, the intensity of the ZnO NBE signal progressively decreased with increasing concentrations of hCG, in the range from 1 to 100 ng mL−1 (see Figure 5a). Such behavior was seen to be reproducible and was attributed to the formation of a link between the anti-hCG AB and hCG hormone, forming the immunocomplex. Conversely, barely any changes were verified in the PL response of the control samples that were prepared without AB or with one non-specific to hCG (see Figure 5b), confirming that non-specific interactions between the ZnO surface and the target analyte are negligible. The PL dependence of the ZnO/anti-hCG/BSA samples with the hCG concentration can be better perceived in Figure 5c, where the response of the sensors was plotted as a function of the logarithm of the hCG concentration. This response was defined as
Response = I U V 0 I U V A n a l y t e ( C ) I U V 0
where I U V 0   stands for the integrated intensity of the NBE for the blank/reference (without any analyte) and I U V A n a l y t e corresponds to the integrated intensity of the same emission after analyte immobilization for each concentration C [9,107]. Therefore, the data demonstrated that the developed biosensor can be employed in hCG quantification, presenting fairly results in the range between 5 and 50 ng mL−1 [9].
Similar ZnO tetrapodal structures were also employed in the exploitation of a biosensing platform for the detection of tetracycline (TC) [107], which is a broad-spectrum antibiotic that can sometimes be present in freshwaters or animal food products [108]. Here, the anti-TC AB were covalently immobilized on the ZnO transducer. The PL response of the sensor under UV excitation (325 nm) and when in the presence of TC revealed a gradual decrease in the NBE PL intensity with increasing analyte concentration in the range between 0.001 and 1 µg L−1, in line with the previous results obtained for hCG. Higher TC concentrations were tested (up to 500 µg L−1), however, the signal was seen to reach a plateau in the high concentration regime (above ~10 µg L−1), which suggests that the majority of the antigen-binding sites were already engaged with TC antigens at such concentrations. Indeed, TC concentrations usually found in freshwaters are in the range of 0.008–1 µg L−1 [108], which is in agreement with the one obtained for our sensors [107]. A LOD of ~1.2 ng L−1 was estimated in this case, corresponding to one of the lowest LOD values reported so far for TC. Control experiments were carried out by (i) successive incubations of the sensors in physiological solution (PS), (ii) the use of a non-specific antibiotic (ciprofloxacin) in the test solution, and (iii) incubating the different analyte concentrations into samples that did not include the AB bioreceptors. In all cases, the PL signal barely changed, which points to the specificity of these biosensors. Moreover, some sensors were also incubated with TC solutions containing a fixed concentration of ciprofloxacin, evidenced an analogous behavior as the one observed for the sensors evaluated only in the presence of TC, showing that the presence on the additional antibiotic did not affect the sensing response and attesting their specificity.
Finally, due to the promising results obtained for both hCG and TC detection described above, biosensors for the detection of human serum albumin (HSA) were also prepared. HSA is the most abundant protein in plasma and an important biomarker for many diseases, including cancer, rheumatoid arthritis, ischemia, and post-menopausal obesity, among others [109].
In this case, both ZnO and ZnO/laser-induced graphene (LIG) composites, like the ones reported in [48], were tested as transducers. The same functionalization methodology used for the TC biosensors (covalent binding) was also applied using anti-HSA AB as the biorecognition elements [107]. In brief, 10 µL of (3-aminopropyl)triethoxysilane (APTES) were added in a mixture of ethanol and deionized water (70:30% v/v) and placed on the surface of the transducers for 1 h. Next, the samples were rinsed and placed in an oven at 120 °C for 20 min. After this time, 12.5 μL of N-(3-dimethylaminopropyl)-N’-ethylcarbodiimide hydrochloride (EDC) was mixed with 12.5 μL of N-Hydroxysuccinimide (NHS, 0.25 M) and 25 μL of AB diluted to a concentration of 0.5 mg mL−1 in PS. A 50 µL drop of this solution was in contact with the surface of the transducer for 2 h. Finally, 50 µL of BSA were placed on the surface of the previous samples during another 2 h [48].
The sensing experiments were conducted using the same procedure as the one mentioned above for the case of TC [107]. Briefly, an aliquot of 50 µL of the HSA solution was placed onto the surface of the sensors and left to incubate for 30 min. Then, the samples were rinsed with PS to remove analyte not bound to the bioreceptors and dried in air for 5 min prior to the PL acquisition. Control tests were conducted using samples prepared without anti-HSA and incubated with the same analyte solutions, or fully functionalized samples (ZnO/LIG + APTES + anti-HSA + BSA) incubated in the PS solution several consecutive times. Figure 6a shows the behavior of a representative ZnO/LIG composite sample (see reference [48]) subjected to different HSA concentrations. In agreement with the results obtained for hCG and TC, also in this case, the intensity of the UV emission decreases with increasing HSA concentration, from 0.001 to 1 µg mL−1. For the concentration of 10 µg mL−1 the signal seems to stabilize and further increases for higher concentrations (100 µg mL−1). It is worth mentioning that such a tendency was observed for all tested samples. Figure 6b displays the evolution of the sensing response (see Equation (1)) as a function of the HSA concentration, for selected sensors and control samples.
As in the preceding cases, a distinct behavior between sensors and controls was identified. Such response with the HSA concentration suggests that the prepared sensors are indeed capable of identifying and quantifying this analyte in concentrations up to 1 µg mL−1. From the present results, a response curve was constructed in line with Equation (1), as depicted in Figure 6c. Once again, the integrated intensity of the NBE emission was considered. From this data, one can clearly see that, when plotted in a semi-log scale, a linear calibration curve can be defined in the range from 0.001 to 10 µg mL−1, in line with the previous works with similar ZnO-based samples [9,107]. As the HSA concentration typically found in healthy individuals should be higher than 0.04 µg mL−1, the prepared sensors are well in line with the target values [110]. According to the approach reported for the TC detection [107], a LOD value of ~2.6 ng mL−1 was determined (see green dashed lines in Figure 6c). Additionally, this study allowed us to confirm that an analogous behavior for the UV PL intensity with increasing analyte concentration is being observed for all of the ZnO-based optical immunosensors prepared by our research group when modified with different bioreceptors. These results are also in agreement with other works reported in the literature [34,51,52,105,111]. This constitutes a strong indication that the phenomena that are playing a role in the transduction signal are similar in nature [9,107].
From the reported examples, one can infer that the application of ZnO (nano)structures already led to functional PL-based biosensor systems, presenting an interesting alternative to the more traditional (e.g., electrical and electrochemical) transduction approaches and offering further room for improvement.

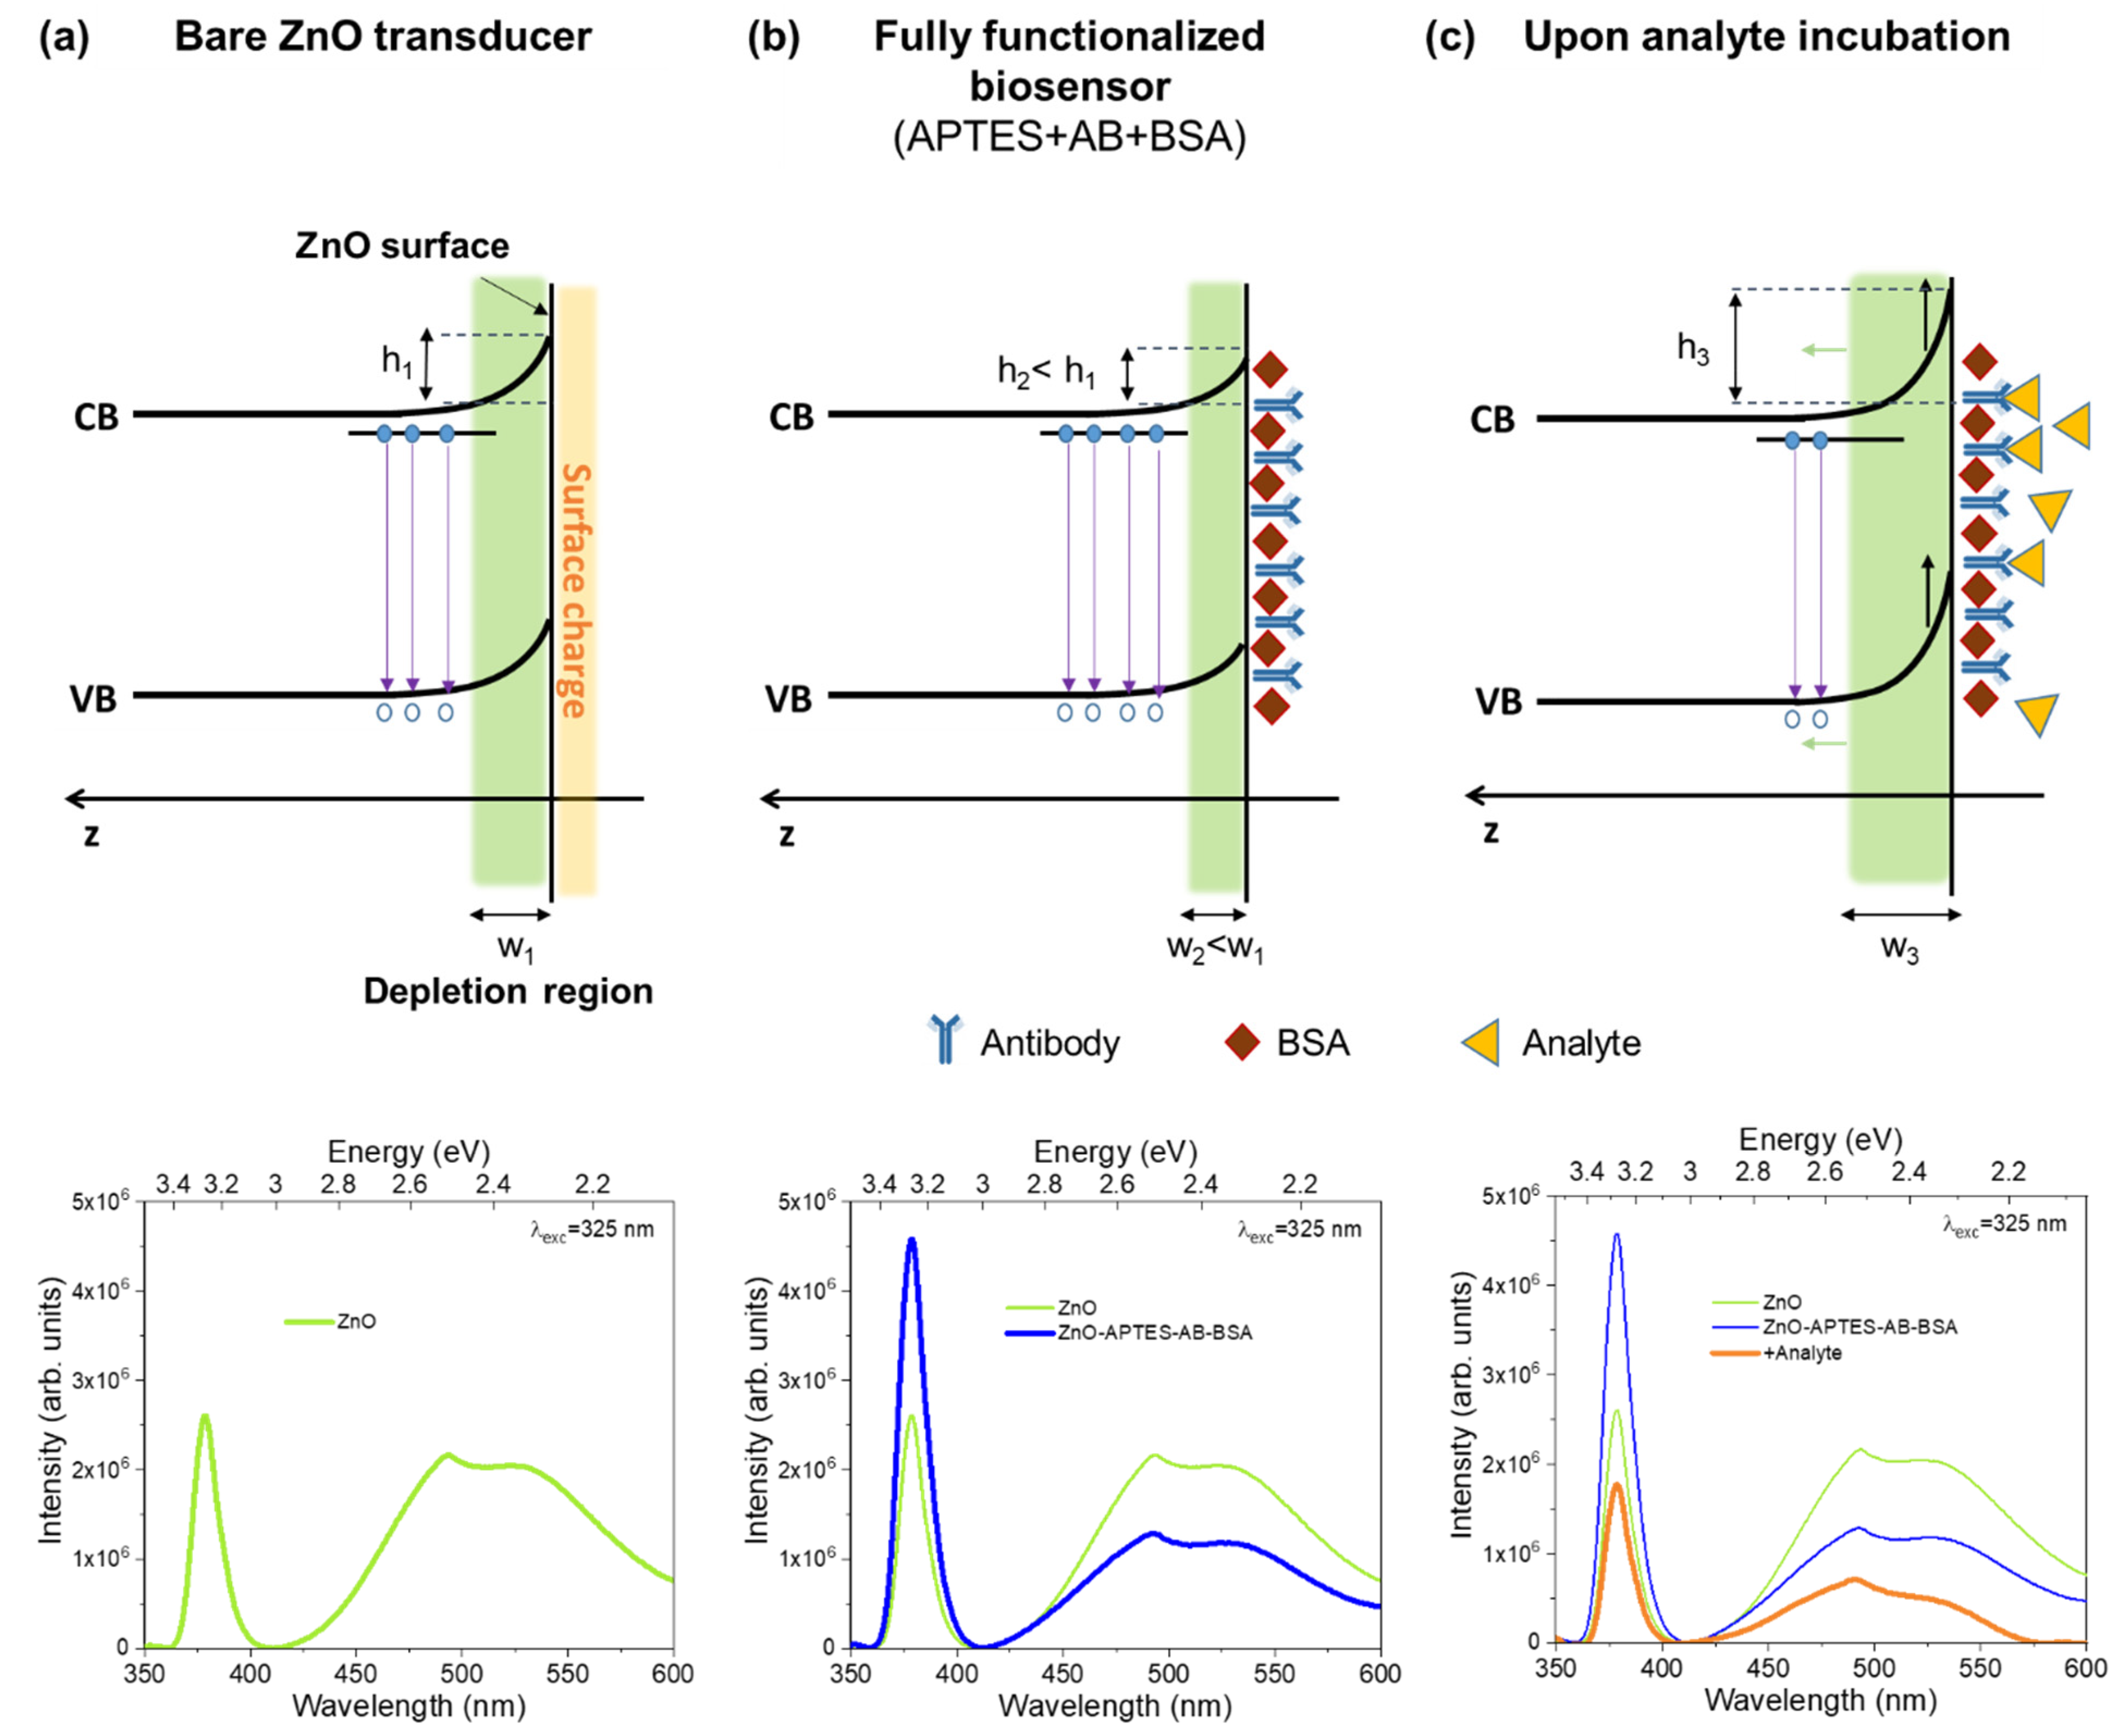
Proposed Sensing Mechanism

A likely explanation for the physical phenomena underlying the PL intensity dependence with the analyte concentration described above can be provided by considering that ZnO micro/nanostructure are known to possess several surface defects that may influence their optical properties [32]. Hence, the presence of such defects will lead to a surface charge density that differs from the one of the bulk region. This inhomogeneity in the charge density distribution creates a built-in electric field that it is responsible for the formation of a potential barrier and charge separation in the region near the surface, resulting in a depletion region. As such, the position of the Fermi level at the surface will be ruled by the charge induced by the surface defects and bending of the semiconductor electronic energy bands occurs near this region [32,112,113,114,115], as is illustrated in Figure 7a. Alterations to the surface band bending due to the presence of external agents (e.g., proteins, molecules, gases) at its proximity can reduce or even hinder the radiative recombination between photogenerated carriers in that region, affecting the intensity of the PL outcome [9,33,34,51,107,111,116].
Upon surface modification to introduce the biorecognition layer, a change in the surface charge density will take place, with new implications in the ZnO PL spectra. For instance, in the case of our ZnO tetrapods, it was observed that the addition of APTES led to an increase in the intensity of the UV emission, accompanied by a decrease in the GL intensity, which we attributed to the passivation (of part) of the surface defects initially present in the bare ZnO transducer [107]. Further functionalization with AB and BSA originated a decrease in PL intensity (especially in the UV region) due to the additional charge introduced by the proteins and the new electrostatic interaction that arise between them and ZnO. Nevertheless, the PL intensity remained higher than the bare ZnO case, as can be seen in the spectra depicted in Figure 7a,b. Thus, we proposed that the presence of the proteins induced variations on the charge distribution at the surface of the ZnO transducer, changing again the surface potential and, therefore, the band bending (Figure 7b).
When the analyte is immobilized and reacts with its specific bioreceptors, i.e., complementary AB, AB-antigen immunocomplexes are formed. In the formation of an AB-antigen complex (immunocomplex), the antigen-binding sites (or paratope) present in the AB antigen-binding fragment (Fab) regions interact with the antigenic determinant (or epitope), i.e., the part of the antigen that is specifically recognized by the AB. This interaction can be driven by several intermolecular forces, like hydrogen bonding, ionic bonding, Van der Waals forces, hydrophobic interactions, dispersion, and induction. Besides, steric repulsion forces will appear due to the interpenetration of the electron clouds of nonbonding atoms [117]. This repulsive force is extremely sensitive and defines the affinity of the AB, since, for a non-homologous antigen site and epitope, the repulsive force between them will be maximized. On the other hand, when the electron clouds of both paratope and epitope are complementary, the repulsive force is minimized and the AB presents a high affinity to that specific antigen [117]. Hence, as the AB charges will now participate in these interactions with the antigen, a significant alteration in the electrostatic interactions with the transducer surface will be experienced [9,111,116], leading to new charge density distribution and a new variation in the band bending (Figure 7c).
As the PL intensity is seen to decrease with increasing analyte concentration (see spectra in Figure 7c), an increase in the band bending is most likely to take place. The bending will be as pronounced as the quantity of the antigen/analyte present to react with the AB, up to a certain threshold where saturation occurs. Thus, the resultant PL intensity quenching can be correlated with the analyte concentration, providing the means for sensing. Hence, the transduction mechanism in immunosensing devices relies essentially on electrostatic interactions at the surface of the semiconductor. These phenomena are expected to be similar for all the ZnO PL-based immunosensors, either functionalized via covalent binding or physical adsorption [9,33,51,107]. It is worth mentioning that the charge transfer processes are unlikely in this case as neither the AB nor BSA proteins, as well as the analytes tested so far, are able to participate in electron transfer reactions [9,34,111].

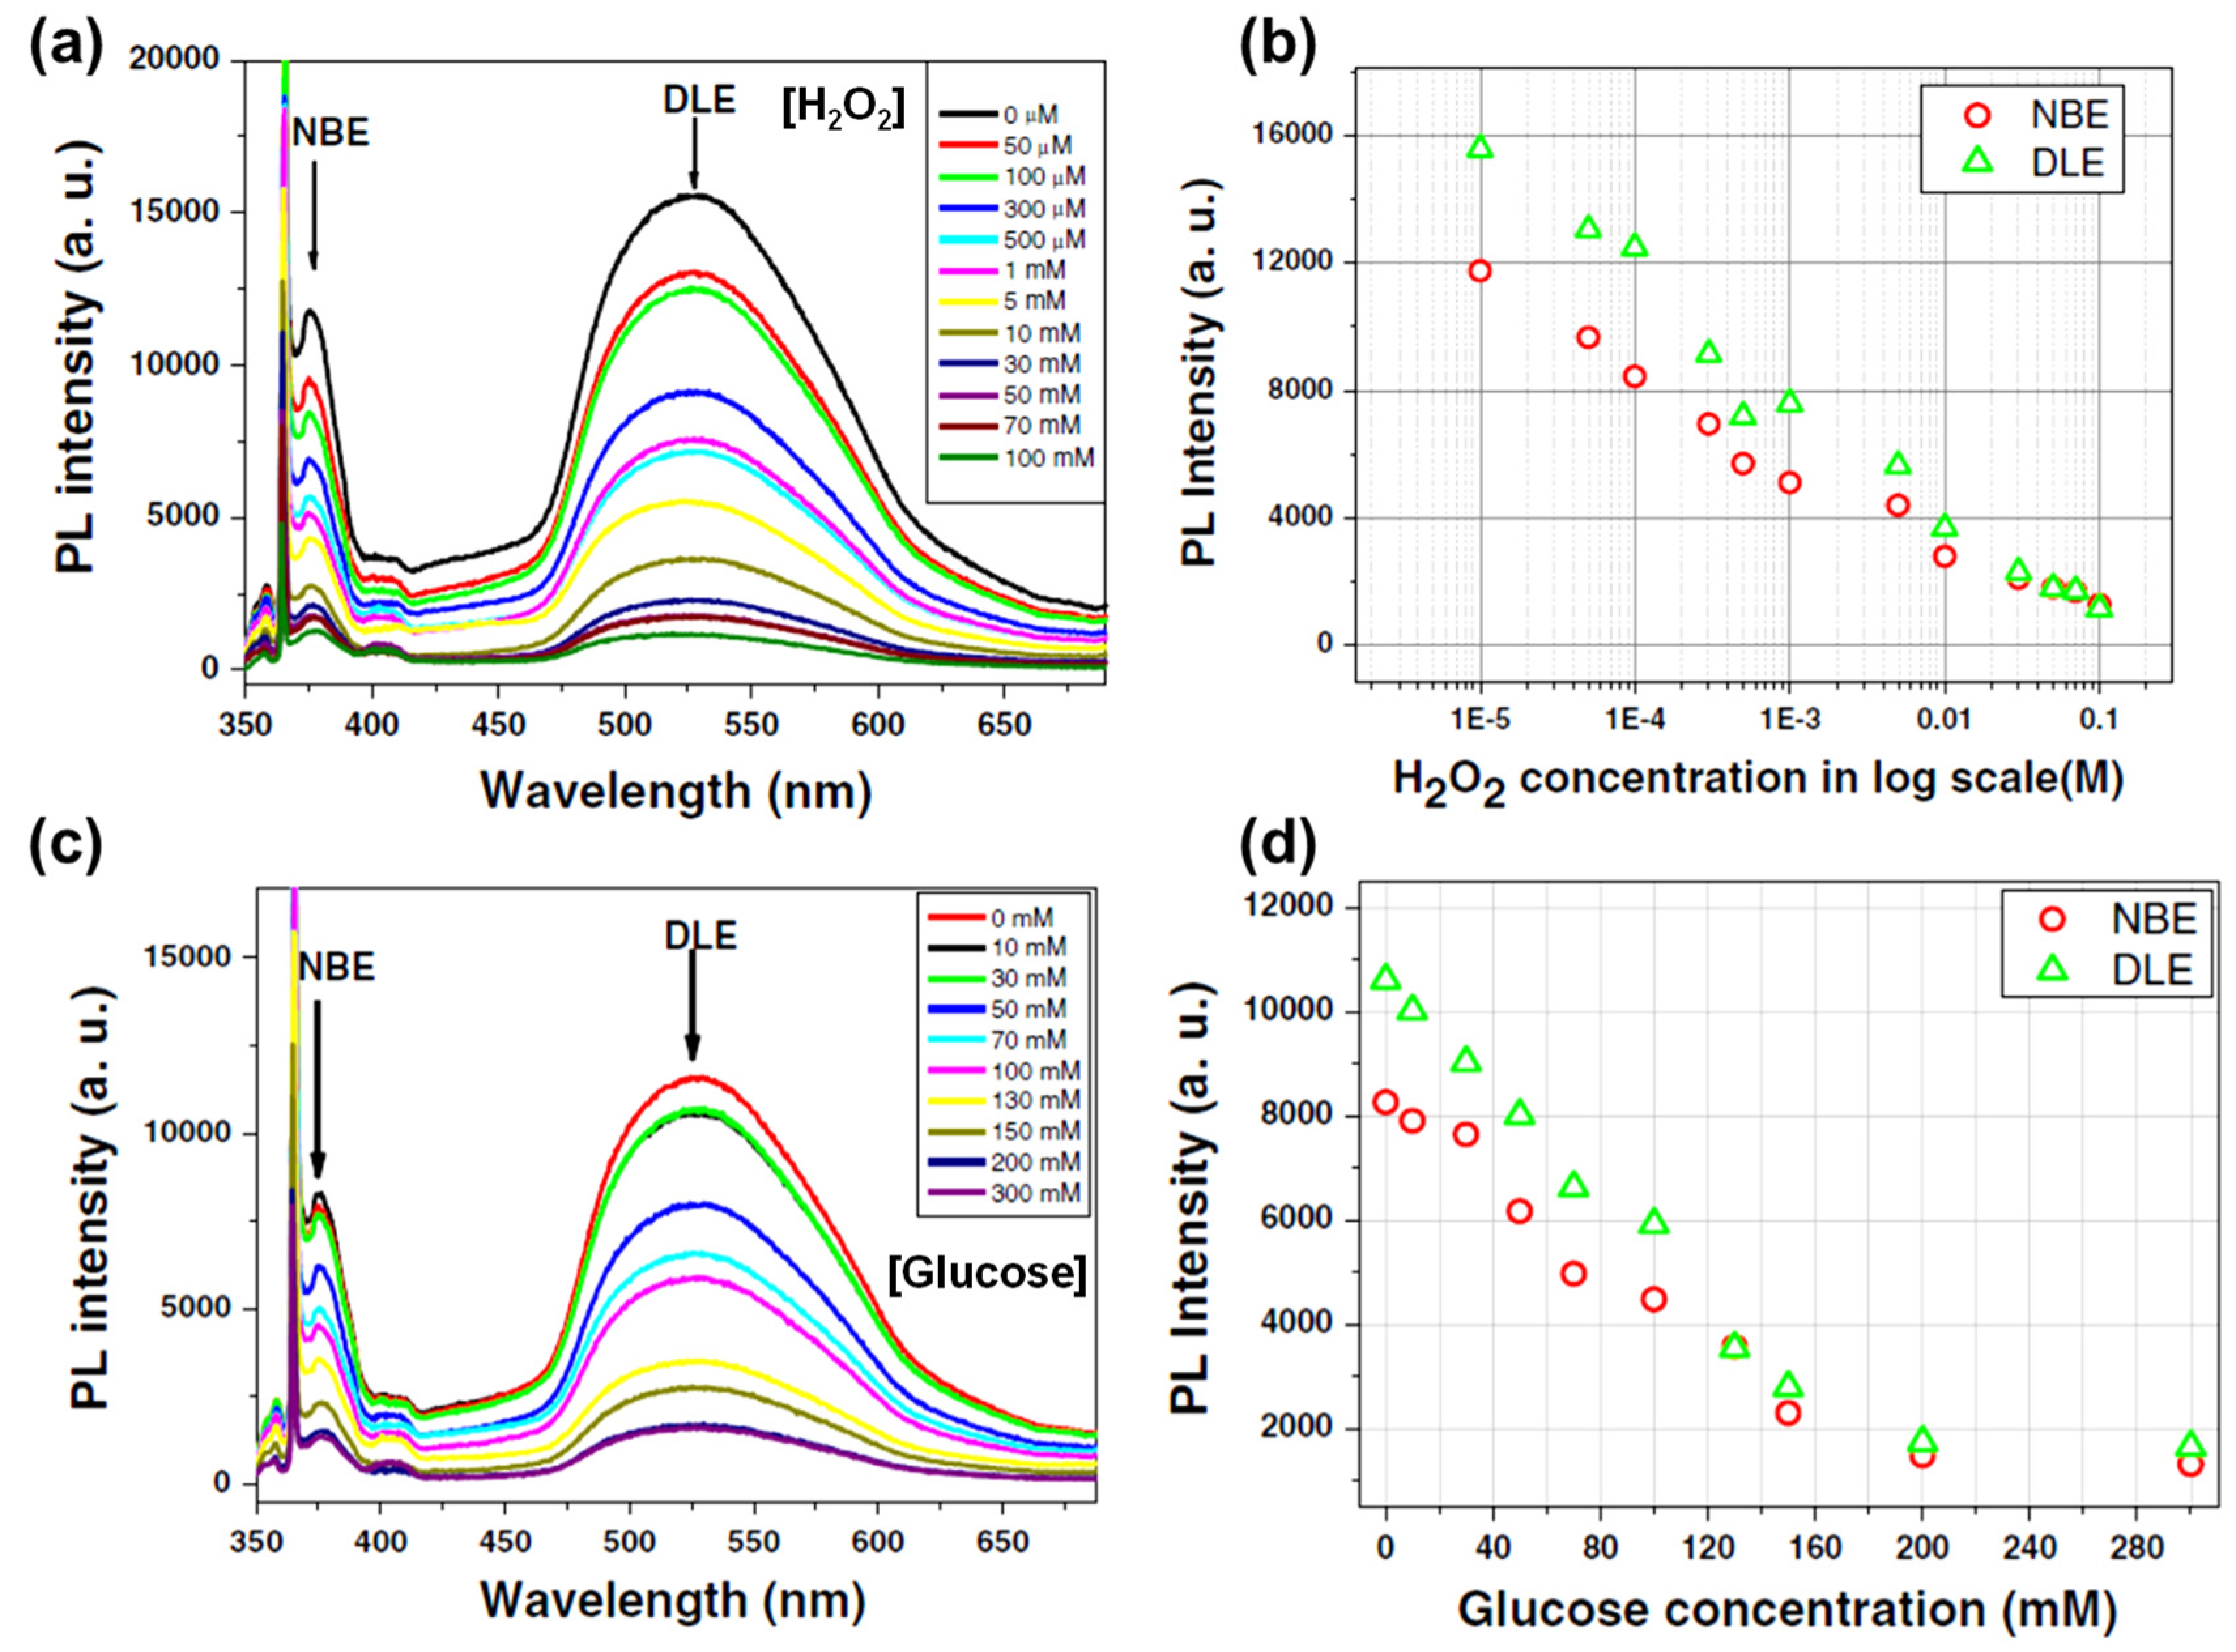
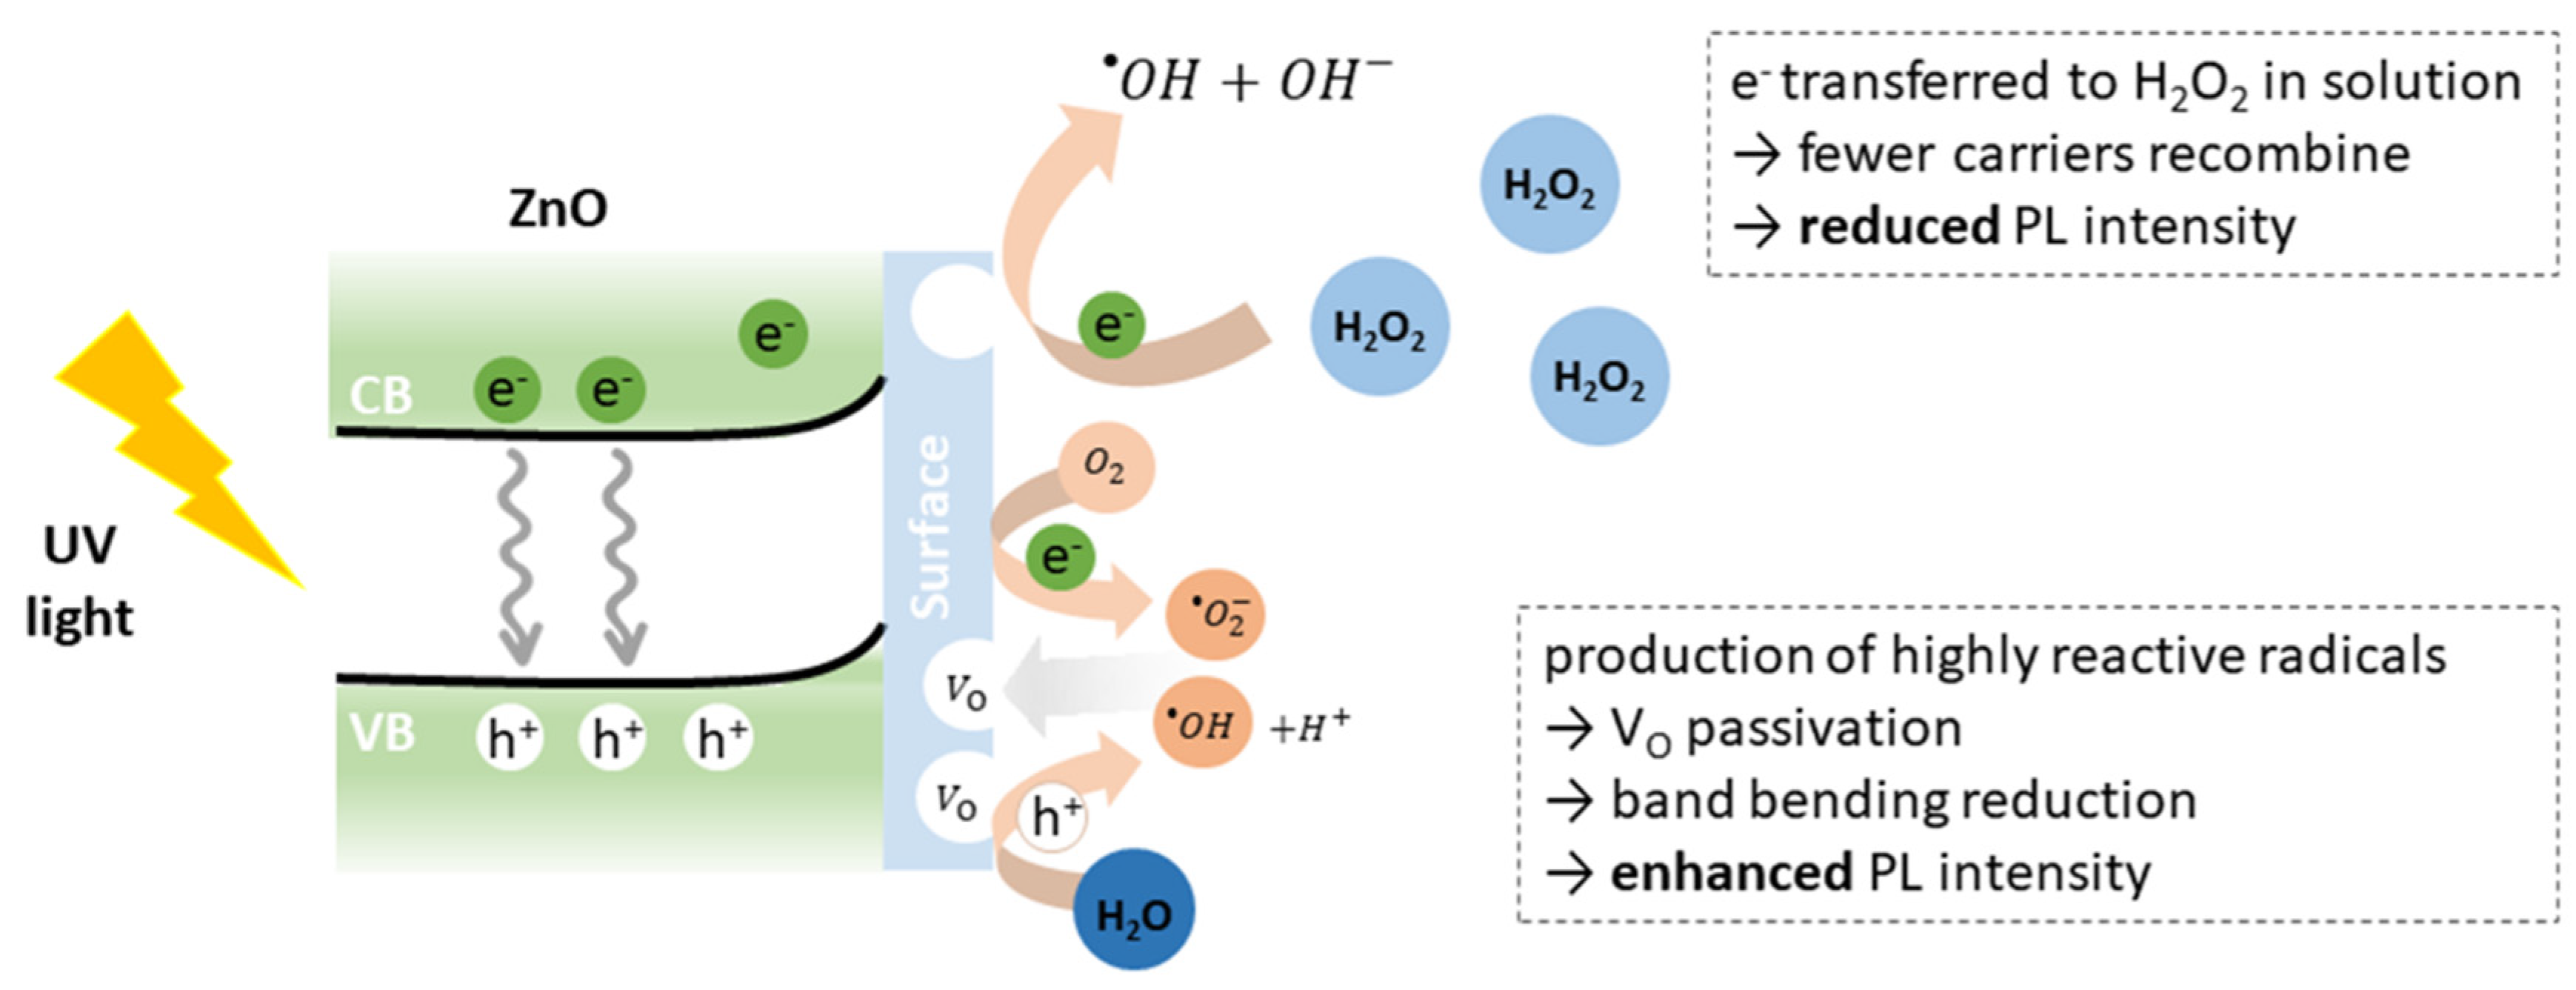
3.2. Enzymatic Sensors

Another important type of biosensors corresponds to the enzymatic ones, which uses enzymes as bioreceptors. Enzymes are proteins that are able to catalyze specific reactions where the specific molecule, known as substrate, is converted into a product, while small by-products can also be formed as a result of this enzymatic reaction. Since the enzyme can only act upon its target substrate due to its complementary properties, this reaction confers specificity to the biosensor using such proteins as biorecognition elements [118]. In this case, the detection is frequently considered indirect, as one monitors the formation of one or more by-products that result from the reaction between the enzyme and the substrate.
Unlike the previously described immunosensors’ case, upon the formation of the enzyme-substrate complex, the substrate is transformed into the reaction products and is released from the active site of the enzyme, letting the enzyme free to further react with other target molecules, promoting the reaction until the conversion of all the substrate present [118].
Advantages of the enzymatic biosensors include continuous real-time monitoring, as the enzymes are not consumed in the reaction, high catalytic activity, high specificity, fast reaction speed, among others. On the other hand, these proteins have a limited lifetime and their reactions are greatly dependent on pH, ionic strength of the solution in which there are placed, and temperature [118].
Though less explored than in the case of the immunosensors, ZnO PL-based transducers have also been studied in the development of enzymatic biosensors, particularly for the detection of glucose [52,119,120]. When the enzyme glucose oxidase (GOx) is in contact with glucose, a catalytic reaction takes place, leading to the formation of reaction by-products, as hydrogen peroxide (H2O2), following the reaction [121]
D glucose + O 2 + H 2 O GOx   gluconic   acid +   H 2 O 2
Therefore, it is possible to indirectly quantify the target analyte by monitoring the quantity of one of these by-products.
In 2012, Kim et al. [120] developed a biosensor for glucose detection where carboxyl-terminated ZnO nanocrystals were employed as a fluorescent transducer for the detection of glucose. The ZnO nanocrystals capped with mercaptoundecanoic acid (MUA) were functionalized with GOx via covalent immobilization The PL signal was assessed under 325 nm excitation in PBS solution prior to and after the addition of successive volumes of the glucose stock solution up to a concentration of 50 mM [120]. Overall, a steady decrease in the PL intensity of the UV maximum (~357 nm) was identified with increasing glucose concentration. When plotted against the glucose concentration, the PL intensity quenching revealed apparent linearity between 1.6–33.3 mM, which covers the typical glucose values for healthy individuals (~4 mM), as well as the range experience for people with diabetes (nearly from 5 to 20 mM) [120]. It is worth mentioning that no further decrease was observed above 40 mM, which is likely related to the limited amount of ZnO-MUA-GOx bioconjugates that are able to react with glucose. The observed reduction in the PL signal was attributed to the ZnO reaction with H2O2, which is formed during the catalytic oxidation reaction of glucose by GOx, as described in Equation (2). The authors proposed that H2O2 acts as a luminescence quencher by capturing electrons from the excited state of the semiconductor (e.g., conduction band), thus inhibiting their radiative recombination with the photogenerated holes. Consequently, this quenching will be proportional to the quantity of H2O2 in contact with ZnO. As the molecules of H2O2 formed is stoichiometrically equal to the number of glucose molecules, the quantity of glucose present in the solution can be estimated by the detection of this by-product. To verify that the PL intensity reduction was indeed due to the H2O2 formation, the ZnO-MUA-GOx samples were analyzed when in contact with different concentrations of H2O2, showing a similar behavior as the one recorded for glucose. Finally, to infer the specificity of the biosensors, a fixed concentration of cholesterol was added to the buffer solution and barely any change was detected in the PL intensity, while for the same concentration of glucose a substantial decrease had been observed [120]. Hence, the authors concluded that such sensors exhibit the potential to be used as glucose biosensors.
In 2015, Sodzel et al. [52] reported an analogous work, also devoted to the exploitation of H2O2 and glucose sensors based on the PL intensity quenching of the UV and visible luminescence of ZnO NP. As a first detection approach, different volumes of H2O2 were added to a dispersion of GOx functionalized ZnO NP, corresponding to a range of concentrations from 0.05 mM to 100 mM. The PL signal (355 nm excitation) was evaluated for each concentration and it was observed that its intensity decreased with increasing H2O2 concentration (Figure 8a,b). This quenching occurred both in the NBE, as well as in the visible emission band peaked at ~525 nm [52]. A concentration as low as 0.05 mM of H2O2 could be detected using such procedure.
As in the work of Kim et al. [120], this behavior was justified by the catalytical decomposition of H2O2 on the ZnO surface [52]. Such reaction is aided by the well-known photodegradation mechanisms of ZnO, in which when irradiated with energy equal to or higher than the bandgap, highly active holes ( h VB + ) and electrons ( e ) are photogenerated (Equation (3)). Then sequential reactions where highly active radicals are formed can occur depending on the species adsorbed on the ZnO surface. For example, for adsorbed water the surface reactions are represented from Equation (3) to Equation (7). Indeed, H2O2 can be one of the products of these reactions that can (i) be slowly decomposed, forming water and molecular oxygen, (ii) react with other radicals (Equation (8)) or (iii), under UV radiation, form more hydroxyl radicals (Equation (9)). However, H2O2 can also play as an electron acceptor (Equation (10)), and, in this case, electrons from the conduction band of ZnO are transferred to the H2O2 reaction (see illustration in Figure 9), thus fewer carriers will be available to recombine with the holes and the PL signal experiences a quenching that correlates with the quantity of the catalyzed analyte.
ZnO + h ν e + h VB +
h VB + + [ H 2 O ( ads ) OH + H + ] O H + H +
e + O 2 ( ads ) O 2
O 2 + H + HO 2
HO 2 + H + +   e H 2 O 2
H 2 O 2 + O 2 O H + OH + O 2
H 2 O 2 +   h ν 2   O H
H 2 O 2 +   e O H + OH
Then, Sodzel et al. [52] added successive volumes (20 μL) of the glucose stock solution to the GOx-functionalized ZnO dispersion. In this way, glucose concentrations from 10 to 300 mM were assessed. In a similar fashion to what was observed for the case of H2O2, a steady decrease in the PL intensity was recorded as the glucose concentration increases (Figure 8c), revealing a linear response up to 130 mM (Figure 8d), with a LOD of 10 mM [52]. This quenching was linked to the production of H2O2 during the catalytic reaction, as described above. Nevertheless, it is worth mentioning that a slight difference was observed in the sensitivity of the pure H2O2 and glucose that can be explained by the fact that for the case of glucose+enzyme+ZnO interaction, the H2O2 present in the solution is obtained only from the part of glucose that is decomposed by the GOx and this reaction may not be 100% efficient. Moreover, both the GOx enzyme immobilized at the surface of the ZnO, as well as the remaining by-products of the reaction, are likely to “cover” part of the ZnO active area, limiting the access of the H2O2 and the subsequent interaction [52]. Even so, these results seem promising as H2O2 is produced in several enzymatic reactions, namely by using oxidases specific, for instance, for cholesterol and lactose as substrates [118], and the reported results may be translated to the detection of several other analytes.
On the other hand, an opposite behavior was reported by Sung et al. [119], in 2012, that hypothesized that PL enhancement occurs due to direct electron transfer from the enzyme to ZnO during the glucose oxidation. These authors used ZnO/ZnS nanowires modified with mercapto-acetic acid (MAA), activated by esterification of N-hydroxysulfo-succinimide (Sulfo-NHS) and covalently functionalized with GOx for glucose sensing. In this work, they studied both ZnO–MAA–GOx and ZnO/ZnS–MAA–GOx samples and tested them in the presence of different glucose concentrations. PL analysis (325 nm excitation) of these sensing platforms prior to the incubation with the analyte revealed a strong UV emission (~380–383 nm) in both cases, which correspond to the NBE transition [119]. For the ZnO–MAA–GOx, a broad visible band peaked near 500 nm was also identified. The UV intensity was seen to be higher in the case of the ZnO/ZnS–MAA–GOx, likely related to the passivation of the surface dangling bonds by the ZnS coating. Likewise, the formation of this coating may also be accounted for defect healing of pre-existing defects in the bare ZnO, for instance, surface VO. The authors claim that, when in the presence of glucose, its catalytic reaction promoted by GOx (Equation (2)) leads to the release of two protons and two electrons that are transferred from glucose to the flavin moiety of the enzyme [119,122]. Then, those electrons can be further transferred to the transducer, increasing the number of carriers, and thus the PL intensity will be enhanced. Yet, as stated by G. S. Wilson in 2016 [123] and later, in 2018, demonstrated by Barlett et al. [124], direct electron transfer does not occur from GOx to the surface of the transducer as the cofactor flavin adenine dinucleotide (FAD), which enables the occurrence of the redox reaction, is deeply buried in the active site of GOx. Therefore, other mechanisms should be playing in this case. In fact, a similar PL enhancement behavior was observed using ZnO and ZnO/LIG composites for the H2O2 detection [48], i.e., without the presence of an oxidorreductase. As represented by Equations (3)–(9), several surface reactions can take place forming highly active radicals that can provide oxygen atoms (Figure 9) to (partially) fill VO that are likely to be present at the ZnO surface, contributing to the surface band bending mentioned above. Therefore, as such defects are removed, the band bending decreases and the NBE recombination is enhanced [48,125,126]. As the number of passivated defects will be associated with the amount of H2O2 providing active oxygen atoms, the increase in the PL intensity can be correlated with the quantity of this compound. A similar explanation can also be attributed to the results of Sung et al. [119]. A LOD of 0.14 mM was estimated for the ZnO/ZnS–MAA–GOx, while the ZnO–MAA–GOx sensors exhibited a LOD value of 0.23 mM. The linear detection range in both cases corresponded to 3.51–24.1 mM, well in line with the physiological glucose range of interest for this analyte [119].
In 2020, Briones et al. [127] conducted a work where ZnO-based fluorometric enzymatic assays were developed for the sensing of either lactate or cholesterol via the detection of H2O2 produced upon the enzymatic reactions with their complementary enzymes, lactate oxidase (LOx) and cholesterol oxidase (ChOx), respectively. The authors used ZnO nanowires produced by chemical vapor transport. The nanowires were dispersed in a phosphate buffer (pH 7) and then mixed with different concentrations of either LOx or ChOx [127] to optimize the ZnO/enzyme ratio. In such detection tests, the PL signal was monitored before and after the addition of the target analytes, exciting the samples at 330 nm. A total of 5 μL of lactate or cholesterol stock solutions were successively added to the test cuvette with the functionalized ZnO dispersion, recording the PL outcome in each step. The PL intensity was monitored at the maximum of the visible band, at ~520 nm. The authors observed a decrease in the intensity of this band after adding either the lactate or cholesterol and attributed the quenching to the H2O2 generated in the enzymatic reactions [127]. As well, the quenching of the ZnO PL intensity correlated with the concentration of analyte present in the sample. In the case of lactate, a linear response of the PL intensity quenching was observed up to 1.9 μM and a LOD of 0.54 μM was estimated. For cholesterol, the linear response was accomplished up to 1.1 μM, with a LOD of 0.24 μM [127]. Finally, the authors also tested their sensors in human serum samples with known concentrations of lactate and cholesterol and the values obtained agreed well with the expected ones, attesting to the applicability of their method in real samples.

3.3. Other Sensors

3.3.1. Other Receptors

Besides AB and enzymes, other biorecognition biomolecules have been employed in ZnO PL-based biosensors [128,129,130,131]. In 2020, Vasudevan et al. [129] used ZnO nanoparticles functionalized with cysteamine (Cys) for the detection of N-acyl homoserine lactone (AHL). AHL can be used as a suitable biomarker for the detection of urinary tract infections, as they are released by bacteria, including the pathogenic ones, as signaling molecules during the infection process [129]. The sensitivity of the prepared sensing platform was evaluated by the variation of the PL intensity, which was seen to be dependent on the AHL concentration. The excitation wavelength selected to probe the sensors was 320 nm and AHL with different chain sizes were tested (C4, C6 and 3-oxo-C12 HSLs) in the presence of the ZnO–Cys sensors [129]. Moreover, the optimal cysteamine concentration for the functionalization of the ZnO was also explored by monitoring the PL output of the system when varying concentrations of AHL (from 10–40 nM) were added to the solution containing the ZnO–Cys particles. The selection was made taking into account the ratio ZnO/Cys that led to a higher sensitivity when in the presence of the analytes. In this case, the emission peaked at 468 nm was the one that exhibited more pronounced changes in its intensity and, therefore, was chosen for the monitorization of the biosensing measurements. This intensity was found to increase with the concentration of AHL C4-HSL, while for the remaining ones (C6 and 3-oxo-C12 HSLs) the intensity decreased when compared to the functionalized ZnO. As the carbon chain length differs in the three types of AHL, their hydrophobicities are different, which impacts their interaction with the surface of the semiconductor. Thus, the PL intensity was seen to be inversely proportional to the hydrophobicity of the analytes. A linear dependence of the sensitivity was observed in the range 10–40 nM for the three AHL assessed. Finally, the ZnO–Cys platforms were tested in artificial urine media, showing that the sensitivity of the biosensor increased linearly with AHL concentration up to 120 nM. For higher values, the signal remained nearly constant, suggesting that the cysteamine active sites were occupied, hampering a further interaction with the AHL.
Another example is the immobilization of diphenylalanine (FF) peptide on the surface of ZnO nanoparticles to detect trypsin [130]. Trypsin is a serine protease that is present in the digestive system. Pancreatic disorders often result in high levels of trypsin in urine. This enzyme can cleave the peptide bond, particularly at the carboxyl end of amino acids. Thus, when using peptide-functionalized ZnO, the presence of such an enzyme will weaken the interaction between the peptide and ZnO, which is translated into the change of the ZnO optical properties. In this work, the authors probed the defect-related visible emission at 550 nm. For the detection measurements, trypsin was added to the FF-functionalized ZnO solution (in deionized water) at concentrations varying from 0 to 160 ng mL−1. The PL spectra for each concentration were recorded by exciting the samples with a wavelength of 325 nm [130]. With the increasing concentration of trypsin, the PL intensity increased, likely due to the cleavage of the FF-peptide bond, which is accompanied by a change in the FF-ZnO surface interactions. A LOD of 0.1 ng mL−1 was estimated for a linear detection range of 0 to 160 ng mL−1 [130].

3.3.2. Without Bioreceptor

Finally, there are also several reports of ZnO PL-based biosensors where no biorecognition elements were used [3,27,42,132,133,134,135,136,137]. For instance, Sarangi et al. [27] claimed that ZnO can act as a photocatalyst for the glucose oxidation reaction (photo-oxidation) in a similar fashion as GOx, releasing H2O2 and gluconic acid (see Equation (2)). For this purpose, the authors used hydrothermally synthesized ZnO nanorods as transducers and immobilized different glucose concentrations on their surface (0.25, 0.5, 5, 10, 20, 30, and 40 mM) via drop-casting. The PL spectra of the resultant samples were then assessed, selecting the wavelength of 250 nm for excitation. Similarly, samples treated with H2O2 in the same concentration range between 0.25 and 40 mM were also prepared and analyzed for comparison. In line with previous reports of the enzymatic sensors for glucose detection [52,120], the PL intensity of the NBE emission decreased linearly with the increased concentration of H2O2 in the range from 0 to 40 mM. In the case of glucose, a progressive decrease with increasing concentration was also observed, displaying good linearity in the range from 0.5 to 30 mM, corresponding to 9–540 mg dL−1, in agreement with the typical value range for monitoring glucose in patients with diabetes [27]. It is worth noting that this linear concentration range is similar to that found for H2O2, pointing to the same phenomena ruling the PL behavior. From the defined calibration curve, it was possible to estimate the sensitivity of the studied sensors (slope of the calibration line) as 1.4% mM−1. Therefore, the authors concluded that when the ZnO nanorods were exposed to UV irradiation, photo-oxidation of glucose takes place even in the absence of GOx. A photocatalytic process is claimed to occur, in which electron-hole pairs are generated in the semiconductor upon UV excitation (see Equation (3)). The photogenerated electrons can promote the formation of negatively ionized oxygen, which then is dissociated into atomic oxygen, being highly reactive as an oxidizing species and conducting to the oxidation of glucose and the formation of H2O2 [27]. Then, the PL quenching results from H2O2 acting as an electron acceptor, as mentioned in the case of the enzymatic sensors [27,120,127].
Additionally, control tests with BSA, ascorbic acid, and uric acid were conducted. No changes were identified neither in the shape nor intensity of the ZnO PL spectra. Nevertheless, in the case of BSA an additional emission band peaked at ~340 nm arose, related to the protein emission. Accordingly, the authors claimed that the obtained results showed significant prospects for application in monitoring glucose levels in human serums, as the influence of the glucose in the PL signal was markedly different from the one promoted by other substances likely present. Accordingly, such an approach can provide a wide linear detection range and a high sensitivity with no need for additional biomolecules for recognition. To further prove this point, the feasibility of these sensors was tested using real human blood samples. The results show that the values estimated from the PL quenching were slightly higher when compared to the traditional clinical analysis. Nonetheless, a good correlation between the two methods was obtained [27].
Mai et al. [132] also reported a non-enzymatic PL sensor for the detection of glucose using ZnO nanotubes as the transducer platform. The results obtained were in agreement with the ones of Sarangi et al. [27], with the intensity of the UV emission peaking at 384 nm (under 325 nm excitation) decreasing linearly with increasing glucose concentration in the range of 0.1–15 mM (see Figure 10). This decrease was seen to be more pronounced in the case of the NBE recombination than for the broad green band (peaked at 575 nm), in line with other works already mentioned [9,34,49,50,51,107]. A sensitivity of 3.5% mM−1 was estimated, considering the response as the percentage of the decrease of the PL intensity per mM when compared to the blank sample (before glucose addition). A LOD of 70 μM was attained for these sensors [132]. The developed sensors were also applied in the real blood samples, as in the case of Sarangi et al. [27], and the results were fairly coincident with the ones obtained from the conventional clinical analysis. The authors refer that as this is a non-enzymatic sensor, it will be less influenced by environmental conditions such as temperature, pH, etc., which is frequently a concern with the biosensors using biological elements, like enzymes or antibodies as bioreceptors. In this case, the transduction signal is only dependent on the interaction efficiency between the ZnO transducer and the analyte [132]. However, and despite the fact that both Sarangi et al. [27] and Mai et al. [132] performed control studies with other possible interferences (BSA, ascorbic acid and uric acid) with no significant effect on the ZnO spectra, it is important to stress that such sensors do not provide specificity. Hence, if another analyte prone to photo-oxidation and whose oxidation reaction releases H2O2, as lactate or cholesterol, is also present in the sample under analysis, it may not be possible to selectively distinguish between the reactions and conduct a proper assessment of the concentration of the target analyte, making it rather difficult to obtain reliable outputs.
Besides glucose, Zhao et al. [133] reported the use of ZnO quantum dots (QDs, ca. 3–5 nm) capped with APTES as probes to detect and quantify dopamine without the need for any bioreceptor. The APTES modified ZnO QDs presented a broad emission band peaked at 530 nm (bandwidth ~120 nm) when excited with 337 nm. When 5 µM of dopamine were added to the APTES-ZnO QDs aqueous solution, a decrease in the PL intensity was observed to ~10% of the initial one, together with a slight shift of the peak position. Uncapped ZnO QDs samples were also analyzed in the presence of the dopamine and, in that case, the signal experienced a decrease to about 67% of the initial PL intensity, indicating that the presence of APTES has a significant effect on the quenching process promoted by dopamine. The authors related this effect with the hydrogen bonding interaction between the amine group of APTES and dopamine [133]. UV absorption and Fourier-transform infrared (FTIR) spectroscopy confirmed that the dopamine- APTES/ZnO QDs complex is formed via non-covalent interactions, namely hydrogen bond interaction, inferred by the blue shift observed in the absorption peak of QDs when the dopamine was added. Moreover, a broadening of the N–H bending and stretching vibration peaks is observed, attributed to the hydrogen-bonding interaction of the amino groups in dopamine and APTES-capped ZnO QDs [133].
The PL behavior of the APTES-capped ZnO QDs was further assessed under different concentrations of dopamine (0, 0.05, 0.1, 0.5, 0.8, 1, 3, 5, 8, and 10 mM). The intensity of the PL signal decreased as the concentration of dopamine increased (Figure 11), presenting a linear response in the range from 0.05 to 10 mM. The PL quenching was associated with electron transfer from the ZnO QDs to the dopamine since this analyte presents redox activity [133]. As the experiments were conducted at pH ~7, dopamine can be easily oxidized by ambient O2, forming oxidized dopamine (quinones), which can act as an electron acceptor. When the ZnO QDs are excited by the UV light, photogenerated electrons can be transferred to the oxidized dopamine-quinone, leading to the PL quenching. This quenching is therefore proportional to the concentration of dopamine present.
The APTES-capped ZnO QDs were also employed in the analysis of real human serum samples to verify the possible interferences from common molecules present in human blood serum (e.g., uric acid, ascorbic acid, cysteine, tyrosine, glucose, lactase, and so on). None of them evidenced any effect on the PL intensity or spectral shape, attesting to the selectivity of the APTES-ZnO QDs to probe dopamine [133]. As in this case no reaction was seen to the glucose presence, one may infer that the presence of APTES and/or the surface properties of the ZnO nanostructures likely play a decisive role in the selective detection of different bio-analytes, as in the case of the gas sensors [138].
Recently, Soundharraj et al. [135] also used ZnO NP as the transducer in an optical biosensor for the detection of different biomolecules, in particular urea. N-doped ZnO NP (particle size of ~10 nm) were produced by a chemical precipitation method [135]. The sensing experiments were carried out by dispersing the N-doped ZnO into deionized water and then adding the targeted molecule at various concentrations. The PL spectra were recorded prior to analyte addition and for each concentration, using an excitation of 340 nm. The biomolecules evaluated included urea, glucose, sucrose, thiourea, and BSA. The emission band peaked at 385 nm was seen to decrease in intensity with increasing concentration for all the biomolecules evaluated. In the case of urea, a linear detection range of 2.6–26 mM was achieved, evidencing a decrease of ~50% between the initial (reference) and the final concentration. Total intensity reductions of 35%, 33%, 26.9%, and 13.7% were estimated for glucose, sucrose, thiourea, and BSA, respectively [135]. As seen, urea demonstrated the highest quenching efficiency and the lowest LOD, corresponding to a value of 4.9 µM. As in the previous case of dopamine detection, this quenching was attributed to electron transfer between the biomolecules and the N-doped ZnO. Although appealing as they are not restricted by the preservation conditions of the bioreceptor, since the PL behavior was similar for all the analytes tested, such sensors present important limitations in real samples, like blood for instance. These biomolecules are likely to be all present in the same sample and it will not be possible to discriminate the influence that each one has on the PL intensity quenching, hampering their proper selective identification and quantification.

4. Influence of the Buffer Solution

During the ZnO functionalization and sensing experiments performed by our research group, slight changes in the spectral shape of the ZnO-related PL signal were perceived even when only exposed to the buffer solutions (phosphate buffers). This observation raised some questions regarding the effect that the species present in such solutions could have on the ZnO stability. Phosphate-based buffers are widely used in biosensing experiments to keep a constant pH, as well as an ion concentration that mimics the human blood [139]. However, it was seen that when ZnO micro/nanostructures are in contact with solutions containing phosphate ions, the ZnO structures suffer a phase conversion toward zinc phosphate [104,140,141], which significantly affected their transduction signal, particularly in the case of the PL output. As such, errors may be induced in the analysis of the transducing results, hampering the utilization of this semiconductor as a transducer if such phenomena are not well understood. Hence, a systematic study to understand these effects was conducted and the detailed analysis of the obtained results can be seen in [104].
ZnO transducers like the ones reported in [9,107] were immersed in phosphate-containing solutions at different pH values (pH = 5.8 and pH = 7.4) for several times (up to 72 h). Notable differences in the morphology of the samples were observed, particularly after 72 h of immersion (see Figure 12). On one hand, in the case of pH 7.4, besides the initial ZnO tetrapods, randomly distributed spherical-like shaped particles with diameters around 500 nm were also detected, evidencing some agglomerates mixed with the tetrapodal structures, which continue to be abundantly present. According to the Raman spectroscopy and X-ray diffraction (XRD) structural data, these particles are mostly amorphous, although traces of crystalline phases were also identified [104]. On the other hand, for the structures immersed in the solution with pH 5.8 during the same time, profound changes took place. New morphologies, with a flower-like morphology, appeared randomly distributed throughout the whole surface of the sample. These structures exhibited higher dimensions, in the range of tens to a few hundred µm and seemed to grow radially from a common center, being organized in a hierarchical branched structure. The newly formed crystal displays a parallelepiped shape with well-defined facets, presenting widths below 1 µm and lengths with tens of µm (Figure 12) [104].
Such changes were explained by the fact that when ZnO is placed in aqueous environments, some zinc ions are released to the solution at the same time that adsorption and precipitation of phosphate ions take place. Therefore, a reaction between them takes place, leading to the progressive conversion of ZnO into zinc phosphate, as more Zn ions are released to the media. This release of Zn ions increases for lower pH, explaining the important role of this parameter in the conversion [140,142,143,144]. On the other hand, for a pH = 7.4, the lower dissolution rate of Zn2+ makes the complexation with the PO 4 3 less favored and the formation of zinc phosphate is limited and with poorer crystalline quality [145]. Nonetheless, this amorphous phase also plays an important role in the overall properties of the transducers, as was attested by the changes in the PL signal (Figure 13) [104].
Indeed, Raman and XRD data corroborated the enhancement of the phase transformation from ZnO to zinc phosphate with increasing immersion time in the case of the solution with pH = 5.8, while for pH = 7.4 only a crystalline ZnO phase was detected, with the Raman spectra suggesting the formation of the amorphous zinc phosphate [104]. The FTIR spectroscopy characterization indicated that the observed changes at the surface of the transducers were similar for both pH and analogous surface states are likely to be promoted by those groups/species [104].
As the main goal was to use the PL response of the ZnO structures as the transduction signal in biosensors, the analysis of the effect of this transformation in the optical properties was of utmost importance. Hence, the optical properties of such samples were thoroughly assessed by PL and PL excitation (PLE) [104]. Taking into account the RT PL spectra (Figure 13a, first and last spectra), the distinction between the spectral features of Zn3(PO4)2·xH2O and ZnO may not be straightforward at first glance, which can lead to misleading conclusions. A close inspection of Figure 13a reveals that the UV emission suffers a slight shift to higher energies as the immersion time progresses and differences also arise in the visible spectral range with increasing immersion time, particularly in the pH = 5.8 case, where 3 h of immersion time are sufficient to observe a reduction in the visible/UV intensity ratio and the appearance of a week emission band peaked at ~430 nm (see black arrow in Figure 13a). As the immersion time in the buffer solutions proceeds, this feature becomes more prominent. For 72 h, the band at ~430 nm prevails for the (pH = 5.8) solution, while the GL emission almost vanished. In the case of the samples at pH = 7.4 solution for the same time, the differences are less obvious, but the band at ~430 nm is also present, corroborating that some phase conversion also takes place. The most remarkable differences arise when low-temperature PL studies were carried out, as displayed in Figure 13b. In such a case, the differences in the spectral shape are particularly noteworthy, especially in the UV range, allowing a clear distinction between the different stages of this phase transformation [104]. Hence, this conversion will undoubtedly affect the final sensing signal as the contact times assessed in this work can be easily met during the functionalization process together with the sensing experiments, and must be carefully evaluated.
As a suitable buffer for ZnO, we selected the physiological solution (containing only NaCl and KCl salts) to handle the sensing tests, as no differences in the morphological, structural, or optical properties were identified, even after a 72 h immersion [104].
Eixenberger et al. [146] also conducted a study concerning the stability of ZnO nanoparticles in several biological buffers that are frequently used in biological studies to keep physiological pH in cell culture and other biological media. Real-time dissolution kinetics measurements were carried out using buffers as HEPES (N-(2-Hydroxyethyl)piperazine-N′-(2-ethanesulfonic acid)), MOPS (3-(N-morpholino)propanesulfonic acid), PIPES (piperazine-N,N′-bis(2-ethanesulfonic acid)), PBS, TES (2-[[1,3-dihydroxy-2-(hydroxymethyl)propan-2-yl]amino]ethanesulfonic acid), sodium bicarbonate, and tricine (N-[tris(hydroxymethyl)methyl]glycine), and the pH was adjusted to 7.4. The same volume of each buffer was added to the ZnO solution (in nanopure water) [146]. A rapid dissolution of the ZnO nanoparticles was observed for all the biological buffers with exception of PBS and sodium bicarbonate. After ~20 min, HEPES, MOPS, PIPES, TES, and tricine exhibited a dissolution rate over ~72%, contrasting with the 3.3% and 1.4% evidenced for PBS and sodium bicarbonate, respectively. Hence, such a high level of dissolution is likely to have a very significant impact on the data collected when using these buffering systems, and this knowledge must be regarded before using them in biosensing experiments [146]. Besides the buffers, according to the same study, the presence of the ZnO nanoparticles in a common cell media (RPMI 1640) promoted also a phase conversion, similar to what was found in our work [104]. The samples were evaluated several times up to 24 h. FTIR studies on the immersed samples revealed that, among others, a strong peak at 1050 cm−1 emerged with increasing immersion time, being associated with a convolution of the PO 4 3 symmetric and antisymmetric stretching modes, indicating the formation of a phosphate-related phase. This was seen to occur in cell culture media both with and without HEPES, thus, the conversion should be mostly promoted by the media [146]. As no new maxima were identified in XRD, the phosphate-related phase is expected to be amorphous in either case [146], which is in line with the observations at the same pH = 7.4 mentioned above and reported in [104].
The above-mentioned works put in evidence the crucial need for a proper evaluation of the effects of any buffers or testing media prior to initiating the sensing experiments as the impact of the former in the ZnO transduction properties should be correctly separated from the one resulting from an effective biorecognition event.

5. Conclusions & Future Perspective

In this review, we gave a broad overview of the various studies that have been conducted in the scope of ZnO PL-based biosensors. Several ZnO nanostructures have been applied for the development of different types of biosensors, ranging from immunosensors to enzymatic sensors and even to biosensors that only rely on the ZnO itself and its properties, e.g., photocatalytic, to selectively detect the target analytes. The sensitivity and LOD outcomes of some of these sensors can rival the ones found for the more traditional electrochemical biosensors, foreseeing excellent prospects for the implementation of this transduction method in future biosensing devices.
Even though there are still many open questions regarding the physical phenomena that rule the PL behavior in correlation with the concentration of the probed species, there seems to be a consensus in the literature regarding the mechanisms behind the operation of the immunosensors. In this case, the electrostatic interactions between the immunocomplex that is formed when the AB react with their specific antigen and the surface of the transducer play a major role. As changes in charge distribution occur at the surface of ZnO during this biorecognition event, changes in the band bending will take place, thus affecting the number of the photogenerated carriers able to recombine and, consequently, the PL intensity. Such variation in the PL intensity is proportional to the analyte concentration, enabling the calibration of the sensor. However, for the other types of sensors, the detection phenomena remain less clear. Nevertheless, charge transfer processes involving catalytic reactions are likely to govern the transduction of enzymatic sensors and even others where direct interaction between the ZnO and the analytes is reported. In those cases, electrostatic interactions may also be involved in the PL behavior, being highly dependent on the type of biomolecule probed and the surface properties of ZnO.
Despite being extremely attractive to be used as a transducer in biosensing devices, ZnO poses some concerns, not only limited to the field of optical transduction. As discussed in Section 4, the influence of the buffer solution and the solution media where the sensors are tested is quite relevant in the feasibility of ZnO-based transducers as this material was seen to react easily with some of the solution components. All the reactions external to the sensing, as the phosphate-induced conversion discussed above, must be carefully evaluated. Adequate knowledge of such effects on the transduction signal for each sensing condition (e.g., pH, other species present in the target sample, overall contact time with the solution, and so on) is mandatory and will require massive research. Only in this way should it be possible to distinguish other phenomena from the effective sensing and design of a device that can deliver a trustworthy sensing outcome that can be reliable when operating in real biological fluids or real water samples (e.g., from streams, rivers or wastewater), for instance, as those typically contain phosphate species, which will then promote the mentioned conversion. Therefore, although the results reported in the literature and here presented seem very appealing, several important issues must be overcome before implementing this semiconductor in real-life applications.

Author Contributions

Conceptualization, J.R. and S.O.P.; methodology, J.R.; validation, J.R., S.O.P., F.M.C. and T.M.; formal analysis, J.R. and S.O.P.; investigation, J.R., S.O.P., J.Z., M.B. and C.R.; writing—original draft preparation, J.R.; writing—review and editing, J.R., S.O.P., F.M.C. and T.M.; project administration, J.R.; funding acquisition, J.R. and F.M.C. All authors have read and agreed to the published version of the manuscript.

Funding

This research was funded by national funds through the FCT–Portuguese Foundation for Science and Technology under the i3N project UID-B/50025/2020 & UID-P/50025/2020. Funds were also received from FCT/MEC and FEDER, through the COMPETE 2020 Program, under project PTDC/NAN-MAT/28755/2017 (POCI-01-0145-FEDER-028755).

Institutional Review Board Statement

Not applicable.

Informed Consent Statement

Not applicable.

Data Availability Statement

The raw/processed data required to reproduce these findings can be shared upon request.

Acknowledgments

Sónia O. Pereira thanks i3N for her BPD grant BPD/UI96/5808/2017. Julia Zanoni thanks FCT/MEC and FEDER for her grant BI/UI96/9106/2020, under the scope of project PTDC/NAN-MAT/28755/2017.

Conflicts of Interest

The authors declare no conflict of interest. The funders had no role in the design of the study; in the collection, analyses, or interpretation of data; in the writing of the manuscript, or in the decision to publish the results.

References

  1. Bhat, S.S.; Qurashi, A.; Khanday, F.A. ZnO nanostructures based biosensors for cancer and infectious disease applications: Perspectives, prospects and promises. TrAC Trends Anal. Chem. 2017, 86, 1–13. [Google Scholar] [CrossRef]
  2. Tereshchenko, A.; Bechelany, M.; Viter, R.; Khranovskyy, V.; Smyntyna, V.; Starodub, N.; Yakimova, R. Optical biosensors based on ZnO nanostructures: Advantages and perspectives. A review. Sens. Actuators B Chem. 2016, 229, 664–677. [Google Scholar] [CrossRef] [Green Version]
  3. Hariharan, S.; Karthikeyan, B. Band bending effect induced non-enzymatic highly sensitive glucose sensing in ZnO nanoparticles. J. Lumin. 2017, 183, 1–6. [Google Scholar] [CrossRef]
  4. Zheng, L.; Wan, Y.; Qi, P.; Sun, Y.; Zhang, D.; Yu, L. Lectin functionalized ZnO nanoarrays as a 3D nano-biointerface for bacterial detection. Talanta 2017, 167, 600–606. [Google Scholar] [CrossRef]
  5. Grieshaber, D.; MacKenzie, R.; Vörös, J.; Reimhult, E. Electrochemical Biosensors—Sensor Principles and Architectures. Sensors 2008, 8, 1400–1458. [Google Scholar] [CrossRef]
  6. Clark, L.C.; Lyons, C. Electrode Systems for Continuous Monitoring in Cardiovascular Surgery. Ann. N. Y. Acad. Sci. 1962, 102, 29–45. [Google Scholar] [CrossRef] [PubMed]
  7. Welch, E.C.; Powell, J.M.; Clevinger, T.B.; Fairman, A.E.; Shukla, A. Advances in Biosensors and Diagnostic Technologies Using Nanostructures and Nanomaterials. Adv. Funct. Mater. 2021, 31, 2104126. [Google Scholar] [CrossRef]
  8. Ehtesabi, H. Carbon nanomaterials for salivary-based biosensors: A review. Mater. Today Chem. 2020, 17, 100342. [Google Scholar] [CrossRef]
  9. Rodrigues, J.; Pereira, S.O.; Santos, N.F.; Rodrigues, C.; Costa, F.M.; Monteiro, T. Insights on luminescence quenching of ZnO tetrapods in the detection of hCG. Appl. Surf. Sci. 2020, 527, 146813. [Google Scholar] [CrossRef]
  10. Toyos-Rodríguez, C.; García-Alonso, F.J.; de la Escosura-Muñiz, A. Electrochemical Biosensors Based on Nanomaterials for Early Detection of Alzheimer’s Disease. Sensors 2020, 20, 4748. [Google Scholar] [CrossRef]
  11. Juan-Colás, J.; Parkin, A.; Dunn, K.E.; Scullion, M.G.; Krauss, T.F.; Johnson, S.D. The electrophotonic silicon biosensor. Nat. Commun. 2016, 7, 12769. [Google Scholar] [CrossRef] [Green Version]
  12. Marques, A.C.; Pinheiro, T.; Martins, G.V.; Cardoso, A.R.; Martins, R.; Sales, M.G.; Fortunato, E. Non-enzymatic lab-on-paper devices for biosensing applications. Compr. Anal. Chem. 2020, 89, 189–237. [Google Scholar]
  13. Sharma, S.; Saini, S.; Khangembam, M.; Singh, V. Nanomaterials-Based Biosensors for COVID-19 Detection—A Review. IEEE Sens. J. 2021, 21, 5598–5611. [Google Scholar] [CrossRef]
  14. Abid, S.A.; Ahmed Muneer, A.; Al-Kadmy, I.M.S.; Sattar, A.A.; Beshbishy, A.M.; Batiha, G.E.-S.; Hetta, H.F. Biosensors as a future diagnostic approach for COVID-19. Life Sci. 2021, 273, 119117. [Google Scholar] [CrossRef] [PubMed]
  15. Kumar, S.; Ahlawat, W.; Kumar, R.; Dilbaghi, N. Graphene, carbon nanotubes, zinc oxide and gold as elite nanomaterials for fabrication of biosensors for healthcare. Biosens. Bioelectron. 2015, 70, 498–503. [Google Scholar] [CrossRef]
  16. Metkar, S.K.; Girigoswami, K. Diagnostic biosensors in medicine—A review. Biocatal. Agric. Biotechnol. 2019, 17, 271–283. [Google Scholar] [CrossRef]
  17. Bhalla, N.; Jolly, P.; Formisano, N.; Estrela, P. Introduction to biosensors. Essays Biochem. 2016, 60, 1–8. [Google Scholar] [CrossRef] [PubMed] [Green Version]
  18. Rodriguez-Mozaz, S.; Lopez de Alda, M.J.; Barceló, D. Biosensors as useful tools for environmental analysis and monitoring. Anal. Bioanal. Chem. 2006, 386, 1025–1041. [Google Scholar] [CrossRef]
  19. Kumar, M.A.; Jung, S.; Ji, T. Protein Biosensors Based on Polymer Nanowires, Carbon Nanotubes and Zinc Oxide Nanorods. Sensors 2011, 11, 5087–5111. [Google Scholar] [CrossRef] [Green Version]
  20. Yakimova, R. ZnO materials and surface tailoring for biosensing. Front. Biosci. 2012, E4, 254. [Google Scholar] [CrossRef]
  21. Thévenot, D.R.; Toth, K.; Durst, R.A.; Wilson, G.S. Electrochemical biosensors: Recommended definitions and classification. Biosens. Bioelectron. 2001, 16, 121–131. [Google Scholar] [CrossRef]
  22. Azmy, N.A.N.; Bakar, A.A.A.; Arsad, N.; Idris, S.; Mohmad, A.R.; Abdul Hamid, A. Enhancement of ZnO-rGO nanocomposite thin films by gamma radiation for E. coli sensor. Appl. Surf. Sci. 2017, 392, 1134–1143. [Google Scholar] [CrossRef]
  23. Lu, Y.-M.; Wang, P.-C.; Tang, J.-F.; Chu, S.-Y. Dependence of seed layer thickness on sensitivity of nano-ZnO cholesterol biosensor. IOP Conf. Ser. Mater. Sci. Eng. 2017, 167, 012021. [Google Scholar] [CrossRef]
  24. Pérez-López, B.; Merkoçi, A. Nanomaterials based biosensors for food analysis applications. Trends Food Sci. Technol. 2011, 22, 625–639. [Google Scholar] [CrossRef]
  25. Pandey, P.; Datta, M.; Malhotra, B.D. Prospects of Nanomaterials in Biosensors. Anal. Lett. 2008, 41, 159–209. [Google Scholar] [CrossRef]
  26. Lv, M.; Liu, Y.; Geng, J.; Kou, X.; Xin, Z.; Yang, D. Engineering nanomaterials-based biosensors for food safety detection. Biosens. Bioelectron. 2018, 106, 122–128. [Google Scholar] [CrossRef]
  27. Sarangi, S.N.; Nozaki, S.; Sahu, S.N. ZnO Nanorod-Based Non-Enzymatic Optical Glucose Biosensor. J. Biomed. Nanotechnol. 2015, 11, 988–996. [Google Scholar] [CrossRef]
  28. Tao, N. Challenges and Promises of Metal Oxide Nanosensors. ACS Sens. 2019, 4, 780. [Google Scholar] [CrossRef] [PubMed] [Green Version]
  29. Beitollahi, H.; Tajik, S.; Garkani Nejad, F.; Safaei, M. Recent advances in ZnO nanostructure-based electrochemical sensors and biosensors. J. Mater. Chem. B 2020, 8, 5826–5844. [Google Scholar] [CrossRef]
  30. Özgür, Ü.; Hofstetter, D.; Morkoç, H. ZnO Devices and Applications: A Review of Current Status and Future Prospects. Proc. IEEE 2010, 98, 1255–1268. [Google Scholar] [CrossRef]
  31. Mishra, Y.K.; Adelung, R. ZnO tetrapod materials for functional applications. Mater. Today 2018, 21, 631–651. [Google Scholar] [CrossRef]
  32. Rodrigues, J.; Ben Sedrine, N.; Correia, M.R.; Monteiro, T. Photoluminescence investigations of ZnO micro/nanostructures. Mater. Today Chem. 2020, 16, 100243. [Google Scholar] [CrossRef]
  33. Viter, R.; Savchuk, M.; Starodub, N.; Balevicius, Z.; Tumenas, S.; Ramanaviciene, A.; Jevdokimovs, D.; Erts, D.; Iatsunskyi, I.; Ramanavicius, A. Photoluminescence immunosensor based on bovine leukemia virus proteins immobilized on the ZnO nanorods. Sens. Actuators B Chem. 2019, 285, 601–606. [Google Scholar] [CrossRef] [Green Version]
  34. Viter, R.; Savchuk, M.; Iatsunskyi, I.; Pietralik, Z.; Starodub, N.; Shpyrka, N.; Ramanaviciene, A.; Ramanavicius, A. Analytical, thermodynamical and kinetic characteristics of photoluminescence immunosensor for the determination of Ochratoxin A. Biosens. Bioelectron. 2018, 99, 237–243. [Google Scholar] [CrossRef]
  35. Viter, R.; Jekabsons, K.; Kalnina, Z.; Poletaev, N.; Hsu, S.H.; Riekstina, U. Bioanalytical system for detection of cancer cells with photoluminescent ZnO nanorods. Nanotechnology 2016, 27, 465101. [Google Scholar] [CrossRef]
  36. Özgür, Ü.; Alivov, Y.I.; Liu, C.; Teke, A.; Reshchikov, M.A.; Doğan, S.; Avrutin, V.; Cho, S.-J.; Morkoç, H. A comprehensive review of ZnO materials and devices. J. Appl. Phys. 2005, 98, 041301. [Google Scholar] [CrossRef] [Green Version]
  37. Janotti, A.; Van De Walle, C.G. Fundamentals of zinc oxide as a semiconductor. Rep. Prog. Phys. 2009, 72, 126501. [Google Scholar] [CrossRef] [Green Version]
  38. Klingshirn, C.F.; Waag, A.; Hoffmann, A.; Geurts, J. Zinc Oxide: From Fundamental Properties towards Novel Applications, 1st ed.; Springer: Berlin/Heidelberg, Germany, 2010; ISBN 3642105777. [Google Scholar]
  39. Jagadish, C.; Pearton, S. Zinc Oxide Bulk, Thin Films and Nanostructures; Elsevier: Amsterdam, The Netherlands, 2006; ISBN 9780080447223. [Google Scholar]
  40. Djurišić, A.B.; Leung, Y.H.; Tam, K.H.; Ding, L.; Ge, W.K.; Chen, H.Y.; Gwo, S. Green, yellow, and orange defect emission from ZnO nanostructures: Influence of excitation wavelength. Appl. Phys. Lett. 2006, 88, 103107. [Google Scholar] [CrossRef] [Green Version]
  41. Heo, Y.W.; Norton, D.P.; Pearton, S.J. Origin of green luminescence in ZnO thin film grown by molecular-beam epitaxy. J. Appl. Phys. 2005, 98, 073502. [Google Scholar] [CrossRef]
  42. Politi, J.; Rea, I.; Dardano, P.; De Stefano, L.; Gioffrè, M. Versatile synthesis of ZnO nanowires for quantitative optical sensing of molecular biorecognition. Sens. Actuators B Chem. 2015, 220, 705–711. [Google Scholar] [CrossRef]
  43. Steiner, M.-S.; Duerkop, A.; Wolfbeis, O.S.; Joel, S.; Madou, M.; Wang, P.; Daunert, S.; Ruggiero, G.; Orlando, P.; Labella, T.; et al. Optical methods for sensing glucose. Chem. Soc. Rev. 2011, 40, 4805. [Google Scholar] [CrossRef]
  44. Barman, A.; Bhhattacharya, S.; Majumder, R. A review on application of ZnO nano particles as biosensors. J. Phys. Conf. Ser. 2021, 1797, 012044. [Google Scholar] [CrossRef]
  45. Napi, M.L.M.; Sultan, S.M.; Ismail, R.; How, K.W.; Ahmad, M.K. Electrochemical-Based Biosensors on Different Zinc Oxide Nanostructures: A Review. Materials 2019, 12, 2985. [Google Scholar] [CrossRef] [PubMed] [Green Version]
  46. Mei, G.S.; Menon, P.S.; Hegde, G. ZnO for performance enhancement of surface plasmon resonance biosensor: A review. Mater. Res. Express 2020, 7, 012003. [Google Scholar] [CrossRef]
  47. Tripathy, N.; Kim, D.-H. Metal oxide modified ZnO nanomaterials for biosensor applications. Nano Converg. 2018, 5, 27. [Google Scholar] [CrossRef] [PubMed]
  48. Zanoni, J.; Moura, J.P.; Santos, N.F.; Carvalho, A.F.; Fernandes, A.J.S.; Monteiro, T.; Costa, F.M.; Pereira, S.O.; Rodrigues, J. Dual Transduction of H2O2 Detection Using ZnO/Laser-Induced Graphene Composites. Chemosensors 2021, 9, 102. [Google Scholar] [CrossRef]
  49. Tamashevski, A.; Harmaza, Y.; Slobozhanina, E.; Viter, R.; Iatsunskyi, I. Photoluminescent Detection of Human T-Lymphoblastic Cells by ZnO Nanorods. Molecules 2020, 25, 3168. [Google Scholar] [CrossRef]
  50. Viter, R.; Khranovskyy, V.; Starodub, N.; Ogorodniichuk, Y.; Gevelyuk, S.; Gertnere, Z.; Poletaev, N.; Yakimova, R.; Erts, D.; Smyntyna, V.; et al. Application of Room Temperature Photoluminescence from ZnO Nanorods for Salmonella Detection. IEEE Sens. J. 2014, 14, 2028–2034. [Google Scholar] [CrossRef] [Green Version]
  51. Tamashevski, A.; Harmaza, Y.; Viter, R.; Jevdokimovs, D.; Poplausks, R.; Slobozhanina, E.; Mikoliunaite, L.; Erts, D.; Ramanaviciene, A.; Ramanavicius, A. Zinc oxide nanorod based immunosensing platform for the determination of human leukemic cells. Talanta 2019, 200, 378–386. [Google Scholar] [CrossRef] [Green Version]
  52. Sodzel, D.; Khranovskyy, V.; Beni, V.; Turner, A.P.F.; Viter, R.; Eriksson, M.O.; Holtz, P.-O.; Janot, J.-M.; Bechelany, M.; Balme, S.; et al. Continuous sensing of hydrogen peroxide and glucose via quenching of the UV and visible luminescence of ZnO nanoparticles. Microchim. Acta 2015, 182, 1819–1826. [Google Scholar] [CrossRef]
  53. Viter, R.; Iatsunskyi, I. Metal Oxide Nanostructures in Sensing. In Nanomaterials Design for Sensing Applications; Elsevier: Amsterdam, The Netherlands, 2019; pp. 41–91. [Google Scholar]
  54. Strassburg, M.; Rodina, A.; Dworzak, M.; Haboeck, U.; Krestnikov, I.L.; Hoffmann, A.; Gelhausen, O.; Phillips, M.R.; Alves, H.R.; Zeuner, A.; et al. Identification of bound exciton complexes in ZnO. Phys. Status Solidi 2004, 241, 607–611. [Google Scholar] [CrossRef]
  55. Thomas, D.G. The exciton spectrum of zinc oxide. J. Phys. Chem. Solids 1960, 15, 86–96. [Google Scholar] [CrossRef]
  56. Thonke, K.; Gruber, T.; Teofilov, N.; Schönfelder, R.; Waag, A.; Sauer, R. Donor–acceptor pair transitions in ZnO substrate material. Phys. B Condens. Matter 2001, 308–310, 945–948. [Google Scholar] [CrossRef]
  57. Thonke, K.; Schirra, M.; Schneider, R.; Reiser, A.; Prinz, G.M.; Feneberg, M.; Biskupek, J.; Kaiser, U.; Sauer, R. The role of stacking faults and their associated 0.13ev acceptor state in doped and undoped ZnO layers and nanostructures. Microelectron. J. 2009, 40, 210–214. [Google Scholar] [CrossRef]
  58. Grabowska, J.; Meaney, A.; Nanda, K.K.; Mosnier, J.-P.; Henry, M.O.; Duclère, J.-R.; McGlynn, E. Surface excitonic emission and quenching effects in ZnO nanowire/nanowall systems: Limiting effects on device potential. Phys. Rev. B 2005, 71, 115439. [Google Scholar] [CrossRef] [Green Version]
  59. Li, D.; Leung, Y.H.; Djurišić, A.B.; Liu, Z.T.; Xie, M.H.; Shi, S.L.; Xu, S.J.; Chan, W.K. Different origins of visible luminescence in ZnO nanostructures fabricated by the chemical and evaporation methods. Appl. Phys. Lett. 2004, 85, 1601–1603. [Google Scholar] [CrossRef] [Green Version]
  60. Reynolds, D.C.; Look, D.C.; Jogai, B.; Litton, C.W.; Cantwell, G.; Harsch, W.C. Valence-band ordering in ZnO. Phys. Rev. B 1999, 60, 2340–2344. [Google Scholar] [CrossRef] [Green Version]
  61. Morkoç, H.; Özgür, Ü. Zinc Oxide: Fundamentals, Materials and Device Technology; John Wiley & Sons: Weinheim, Germany, 2009; ISBN 3527623957. [Google Scholar]
  62. Tsoi, S.; Lu, X.; Ramdas, A.K.; Alawadhi, H.; Grimsditch, M.; Cardona, M.; Lauck, R. Isotopic-mass dependence of the A, B, and C excitonic band gaps in ZnO at low temperatures. Phys. Rev. B 2006, 74, 165203. [Google Scholar] [CrossRef] [Green Version]
  63. Meyer, B.K.; Alves, H.; Hofmann, D.M.; Kriegseis, W.; Forster, D.; Bertram, F.; Christen, J.; Hoffmann, A.; Straßburg, M.; Dworzak, M.; et al. Bound exciton and donor–acceptor pair recombinations in ZnO. Phys. Status Solidi 2004, 241, 231–260. [Google Scholar] [CrossRef]
  64. Schirra, M.; Schneider, R.; Reiser, A.; Prinz, G.M.; Feneberg, M.; Biskupek, J.; Kaiser, U.; Krill, C.E.; Thonke, K.; Sauer, R. Stacking fault related 3.31-eV luminescence at 130-meV acceptors in zinc oxide. Phys. Rev. B 2008, 77, 125215. [Google Scholar] [CrossRef]
  65. Fallert, J.; Hauschild, R.; Stelzl, F.; Urban, A.; Wissinger, M.; Zhou, H.; Klingshirn, C.; Kalt, H. Surface-state related luminescence in ZnO nanocrystals. J. Appl. Phys. 2007, 101, 073506. [Google Scholar] [CrossRef]
  66. Wagner, M.R.; Zimmer, P.; Hoffmann, A.; Thomsen, C. Resonant Raman scattering at exciton intermediate states in ZnO. Phys. Status Solidi Rapid Res. Lett. 2007, 1, 169–171. [Google Scholar] [CrossRef]
  67. Kurbanov, S.S.; Kang, T.W. Spectral behavior of the emission around 3.31eV (A-line) from ZnO nanocrystals. J. Lumin. 2010, 130, 767–770. [Google Scholar] [CrossRef]
  68. Rodrigues, J.; Holz, T.; Fath Allah, R.; Gonzalez, D.; Ben, T.; Correira, M.R.; Monteiro, T.; Costa, F.M. Effect of the N2 and H2 plasma treatments on band edge emission of ZnO microrods. Sci. Rep. 2015, 5, 10783. [Google Scholar] [CrossRef] [Green Version]
  69. Tainoff, D.; Masenelli, B.; Mélinon, P.; Belsky, A.; Ledoux, G.; Amans, D.; Dujardin, C.; Fedorov, N.; Martin, P. Competition between exciton-phonon interaction and defects states in the 3.31 eV band in ZnO. Phys. Rev. B 2010, 81, 115304. [Google Scholar] [CrossRef] [Green Version]
  70. Dingle, R. Luminescent Transitions Associated With Divalent Copper Impurities and the Green Emission from Semiconducting Zinc Oxide. Phys. Rev. Lett. 1969, 23, 579–581. [Google Scholar] [CrossRef]
  71. Djurišić, A.B.; Leung, Y.H.; Tam, K.H.; Hsu, Y.F.; Ding, L.; Ge, W.K.; Zhong, Y.C.; Wong, K.S.; Chan, W.K.; Tam, H.L.; et al. Defect emissions in ZnO nanostructures. Nanotechnology 2007, 18, 095702. [Google Scholar] [CrossRef]
  72. Reshchikov, M.A.; Morkoç, H.; Nemeth, B.; Nause, J.; Xie, J.; Hertog, B.; Osinsky, A. Luminescence properties of defects in ZnO. Phys. B Condens. Matter 2007, 401–402, 358–361. [Google Scholar] [CrossRef]
  73. Galdámez-Martinez, A.; Santana, G.; Güell, F.; Martínez-Alanis, P.R.; Dutt, A. Photoluminescence of ZnO Nanowires: A Review. Nanomaterials 2020, 10, 857. [Google Scholar] [CrossRef]
  74. Garces, N.Y.; Wang, L.; Bai, L.; Giles, N.C.; Halliburton, L.E.; Cantwell, G. Role of copper in the green luminescence from ZnO crystals. Appl. Phys. Lett. 2002, 81, 622–624. [Google Scholar] [CrossRef]
  75. Kohan, A.F.; Ceder, G.; Morgan, D.; Walle, C.G. Van De First-principles study of native point defects in ZnO. Phys. Rev. B 2000, 61, 19–27. [Google Scholar] [CrossRef] [Green Version]
  76. Janotti, A.; Van De Walle, C.G. Native point defects in ZnO. Phys. Rev. B Condens. Matter Mater. Phys. 2007, 76, 165202. [Google Scholar] [CrossRef]
  77. Wang, X.J.; Vlasenko, L.S.; Pearton, S.J.; Chen, W.M.; Buyanova, I.A. Oxygen and zinc vacancies in as-grown ZnO single crystals. J. Phys. D Appl. Phys. 2009, 42, 175411. [Google Scholar] [CrossRef]
  78. Hofmann, D.M.; Pfisterer, D.; Sann, J.; Meyer, B.K.; Tena-Zaera, R.; Munoz-Sanjose, V.; Frank, T.; Pensl, G. Properties of the oxygen vacancy in ZnO. Appl. Phys. A 2007, 88, 147–151. [Google Scholar] [CrossRef]
  79. Kuhnert, R.; Helbig, R. Vibronic structure of the green photoluminescence due to copper impurities in ZnO. J. Lumin. 1981, 26, 203–206. [Google Scholar] [CrossRef]
  80. Rodrigues, J.; Fernandes, A.J.S.; Monteiro, T.; Costa, F.M. A review on the laser-assisted flow deposition method: Growth of ZnO micro and nanostructures. CrystEngComm 2019, 21, 1071–1090. [Google Scholar] [CrossRef]
  81. Lima, S.A.; Sigoli, F.; Jafelicci, M., Jr.; Davolos, M. Luminescent properties and lattice defects correlation on zinc oxide. Int. J. Inorg. Mater. 2001, 3, 749–754. [Google Scholar] [CrossRef]
  82. Brillson, L.J.; Dong, Y.; Tuomisto, F.; Svensson, B.G.; Kuznetsov, A.Y.; Doutt, D.; Mosbacker, H.L.; Cantwell, G.; Zhang, J.; Song, J.J.; et al. Native point defects at ZnO surfaces, interfaces and bulk films. Phys. Status Solidi 2012, 9, 1566–1569. [Google Scholar] [CrossRef]
  83. Lv, J.; Li, C.; Chai, Z. Defect luminescence and its mediated physical properties in ZnO. J. Lumin. 2019, 208, 225–237. [Google Scholar] [CrossRef]
  84. Djurisić, A.B.; Leung, Y.H. Optical properties of ZnO nanostructures. Small 2006, 2, 944–961. [Google Scholar] [CrossRef] [PubMed]
  85. Reshchikov, M.A.; Xie, J.Q.; Hertog, B.; Osinsky, A. Yellow luminescence in ZnO layers grown on sapphire. J. Appl. Phys. 2008, 103, 103514. [Google Scholar] [CrossRef] [Green Version]
  86. Rodnyi, P.A.; Khodyuk, I.V. Optical and luminescence properties of zinc oxide (Review). Opt. Spectrosc. 2011, 111, 776–785. [Google Scholar] [CrossRef] [Green Version]
  87. Alvi, N.H.; ul Hasan, K.; Nur, O.; Willander, M. The origin of the red emission in n-ZnO nanotubes/p-GaN white light emitting diodes. Nanoscale Res. Lett. 2011, 6, 130. [Google Scholar] [CrossRef] [PubMed] [Green Version]
  88. Wong, K.M.; Alay-e-Abbas, S.M.; Fang, Y.; Shaukat, A.; Lei, Y. Spatial distribution of neutral oxygen vacancies on ZnO nanowire surfaces: An investigation combining confocal microscopy and first principles calculations. J. Appl. Phys. 2013, 114, 034901. [Google Scholar] [CrossRef] [Green Version]
  89. Rodrigues, J.; Pimentel, A.; Fortunato, E.; Monteiro, T.; Costa, F.M. Photocatalytic Activity of Laser-Processed ZnO Micro/Nanocrystals. Phys. Status Solidi 2018, 215, 1800155. [Google Scholar] [CrossRef]
  90. Rodrigues, J.; Smazna, D.; Ben Sedrine, N.; Nogales, E.; Adelung, R.; Mishra, Y.K.; Mendez, B.; Correia, M.R.; Monteiro, T. Probing surface states in C60 decorated ZnO microwires: Detailed photoluminescence and cathodoluminescence investigations. Nanoscale Adv. 2019, 1, 1516–1526. [Google Scholar] [CrossRef] [Green Version]
  91. Hsu, N.E.; Hung, W.K.; Chen, Y.F. Origin of defect emission identified by polarized luminescence from aligned ZnO nanorods. J. Appl. Phys. 2004, 96, 4671–4673. [Google Scholar] [CrossRef]
  92. Ahn, C.H.; Kim, Y.Y.; Kim, D.C.; Mohanta, S.K.; Cho, H.K. A comparative analysis of deep level emission in ZnO layers deposited by various methods. J. Appl. Phys. 2009, 105, 013502. [Google Scholar] [CrossRef]
  93. Roy, V.A.L.; Djurišić, A.B.; Chan, W.K.; Gao, J.; Lui, H.F.; Surya, C. Luminescent and structural properties of ZnO nanorods prepared under different conditions. Appl. Phys. Lett. 2003, 83, 141–143. [Google Scholar] [CrossRef] [Green Version]
  94. Pimentel, A.; Nunes, D.; Duarte, P.; Rodrigues, J.; Costa, F.M.; Monteiro, T.; Martins, R.; Fortunato, E. Synthesis of Long ZnO Nanorods under Microwave Irradiation or Conventional Heating. J. Phys. Chem. C 2014, 118, 14629–14639. [Google Scholar] [CrossRef]
  95. Hsu, J.W.P.; Tallant, D.R.; Simpson, R.L.; Missert, N.A.; Copeland, R.G. Luminescent properties of solution-grown ZnO nanorods. Appl. Phys. Lett. 2006, 88, 252103. [Google Scholar] [CrossRef]
  96. Tam, K.H.; Cheung, C.K.; Leung, Y.H.; Djurišić, A.B.; Ling, C.C.; Beling, C.D.; Fung, S.; Kwok, W.M.; Chan, W.K.; Phillips, D.L.; et al. Defects in ZnO nanorods prepared by a hydrothermal method. J. Phys. Chem. B 2006, 110, 20865–20871. [Google Scholar] [CrossRef]
  97. Leung, Y.H.; Djurišić, A.B.; Liu, Z.T.; Li, D.; Xie, M.H.; Chan, W.K. Defect photoluminescence of ZnO nanorods synthesized by chemical methods. J. Phys. Chem. Solids 2008, 69, 353–357. [Google Scholar] [CrossRef]
  98. Zhou, H.; Alves, H.; Hofmann, D.M.; Kriegseis, W.; Meyer, B.K.; Kaczmarczyk, G.; Hoffmann, A. Behind the weak excitonic emission of ZnO quantum dots: ZnO/Zn(OH)2 core-shell structure. Appl. Phys. Lett. 2002, 80, 210–212. [Google Scholar] [CrossRef]
  99. Santos, N.F.; Rodrigues, J.; Pereira, S.O.; Fernandes, A.J.S.; Monteiro, T.; Costa, F.M. Electrochemical and photoluminescence response of laser-induced graphene/electrodeposited ZnO composites. Sci. Rep. 2021, 11, 17154. [Google Scholar] [CrossRef] [PubMed]
  100. Pimentel, A.; Rodrigues, J.; Duarte, P.; Nunes, D.; Costa, F.M.; Monteiro, T.; Martins, R.; Fortunato, E. Effect of solvents on ZnO nanostructures synthesized by solvothermal method assisted by microwave radiation: A photocatalytic study. J. Mater. Sci. 2015, 50, 5777–5787. [Google Scholar] [CrossRef]
  101. Aizawa, M. Immunosensors for Clinical Analysis. Adv. Clin. Chem. 1994, 31, 247–275. [Google Scholar]
  102. Aydin, E.B.; Aydin, M.; Sezgintürk, M.K. Advances in electrochemical immunosensors. Adv. Clin. Chem. 2019, 92, 1–57. [Google Scholar] [PubMed]
  103. Van Emon, J.M. Immunoassays in Biotechnology. In Comprehensive Biotechnology; Elsevier: Amsterdam, The Netherlands, 2011; pp. 659–667. [Google Scholar]
  104. Rodrigues, J.; Pereira, S.O.; Zanoni, J.; Falcão, B.P.; Santos, N.F.; Moura, J.P.; Soares, M.R.; Rino, L.; Costa, F.M.; Monteiro, T. The impact of physiological buffer solutions on zinc oxide nanostructures: Zinc phosphate conversion. Mater. Today Chem. 2022, 23, 100629. [Google Scholar] [CrossRef]
  105. Tereshchenko, A.; Fedorenko, V.; Smyntyna, V.; Konup, I.; Konup, A.; Eriksson, M.; Yakimova, R.; Ramanavicius, A.; Balme, S.; Bechelany, M. ZnO films formed by atomic layer deposition as an optical biosensor platform for the detection of Grapevine virus A-type proteins. Biosens. Bioelectron. 2017, 92, 763–769. [Google Scholar] [CrossRef]
  106. Myndrul, V.; Coy, E.; Bechelany, M.; Iatsunskyi, I. Photoluminescence label-free immunosensor for the detection of Aflatoxin B1 using polyacrylonitrile/zinc oxide nanofibers. Mater. Sci. Eng. C 2021, 118, 111401. [Google Scholar] [CrossRef]
  107. Brás, M.; Zanoni, J.; Falcão, B.P.; Leitão, J.P.; Costa, F.M.; Monteiro, T.; Pereira, S.O.; Rodrigues, J. Label-Free Nanoscale ZnO Tetrapod-Based Transducers for Tetracycline Detection. ACS Appl. Nano Mater. 0383, c8. [Google Scholar] [CrossRef]
  108. Danner, M.C.; Robertson, A.; Behrends, V.; Reiss, J. Antibiotic pollution in surface fresh waters: Occurrence and effects. Sci. Total Environ. 2019, 664, 793–804. [Google Scholar] [CrossRef] [PubMed]
  109. Fanali, G.; di Masi, A.; Trezza, V.; Marino, M.; Fasano, M.; Ascenzi, P. Human serum albumin: From bench to bedside. Mol. Asp. Med. 2012, 33, 209–290. [Google Scholar] [CrossRef]
  110. Infusino, I.; Panteghini, M. Serum albumin: Accuracy and clinical use. Clin. Chim. Acta 2013, 419, 15–18. [Google Scholar] [CrossRef]
  111. Viter, R.; Tereshchenko, A.; Smyntyna, V.; Ogorodniichuk, J.; Starodub, N.; Yakimova, R.; Khranovskyy, V.; Ramanavicius, A. Toward development of optical biosensors based on photoluminescence of TiO2 nanoparticles for the detection of Salmonella. Sens. Actuators B Chem. 2017, 252, 95–102. [Google Scholar] [CrossRef] [Green Version]
  112. Chen, C.-Y.; Retamal, J.R.D.; Wu, I.-W.; Lien, D.-H.; Chen, M.-W.; Ding, Y.; Chueh, Y.-L.; Wu, C.-I.; He, J.-H. Probing Surface Band Bending of Surface-Engineered Metal Oxide Nanowires. ACS Nano 2012, 6, 9366–9372. [Google Scholar] [CrossRef] [PubMed]
  113. Calarco, R.; Stoica, T.; Brandt, O.; Geelhaar, L. Surface-induced effects in GaN nanowires. J. Mater. Res. 2011, 26, 2157–2168. [Google Scholar] [CrossRef]
  114. Calarco, R.; Marso, M.; Richter, T.; Aykanat, A.I.; Meijers, R.; Hart, A.V.D.; Stoica, T.; Lüth, H. Size-dependent photoconductivity in MBE-grown GaN-nanowires. Nano Lett. 2005, 5, 981–984. [Google Scholar] [CrossRef] [Green Version]
  115. Zhang, Z.; Yates, J.T. Band Bending in Semiconductors: Chemical and Physical Consequences at Surfaces and Interfaces. Chem. Rev. 2012, 112, 5520–5551. [Google Scholar] [CrossRef]
  116. Tereshchenko, A.; Smyntyna, V.; Ramanavicius, A. Interaction mechanism between TiO2 nanostructures and bovine leukemia virus proteins in photoluminescence-based immunosensors. RSC Adv. 2018, 8, 37740–37748. [Google Scholar] [CrossRef] [Green Version]
  117. Steward, M.W. Antibodies: Their Structure and Function; Springer: Dordrecht, The Netherlands, 2012; ISBN 978-0-412-25640-0. [Google Scholar]
  118. Nikolelis, D.P.; Varzakas, T.; Erdem, A.; Nikoleli, G.-P. Portable Biosensing of Food Toxicants and Environmental Pollutants; CRC Press: Boca Raton, FL, USA, 2013. [Google Scholar]
  119. Sung, Y.-M.; Noh, K.; Kwak, W.-C.; Kim, T.G. Enhanced glucose detection using enzyme-immobilized ZnO/ZnS core/sheath nanowires. Sens. Actuators B Chem. 2012, 161, 453–459. [Google Scholar] [CrossRef]
  120. Kim, K.-E.; Kim, T.G.; Sung, Y.-M. Enzyme-conjugated ZnO nanocrystals for collisional quenching-based glucose sensing. CrystEngComm 2012, 14, 2859. [Google Scholar] [CrossRef]
  121. Rahman, M.M.; Ahammad, A.J.S.; Jin, J.-H.; Ahn, S.J.; Lee, J.-J. A Comprehensive Review of Glucose Biosensors Based on Nanostructured Metal-Oxides. Sensors 2010, 10, 4855–4886. [Google Scholar] [CrossRef] [PubMed]
  122. Haouz, A.; Twist, C.; Zentz, C.; Tauc, P.; Alpert, B. Dynamic and structural properties of glucose oxidase enzyme. Eur. Biophys. J. 1998, 27, 19–25. [Google Scholar] [CrossRef] [PubMed]
  123. Wilson, G.S. Native glucose oxidase does not undergo direct electron transfer. Biosens. Bioelectron. 2016, 82, vii. [Google Scholar] [CrossRef]
  124. Bartlett, P.N.; Al-Lolage, F.A. There is no evidence to support literature claims of direct electron transfer (DET) for native glucose oxidase (GOx) at carbon nanotubes or graphene. J. Electroanal. Chem. 2018, 819, 26–37. [Google Scholar] [CrossRef] [Green Version]
  125. Chen, Y.; Jiang, F.; Wang, L.; Mo, C.; Pu, Y.; Fang, W. Influence of hydrogen peroxide solution on the properties of ZnO thin films. J. Cryst. Growth 2004, 268, 71–75. [Google Scholar] [CrossRef]
  126. Su, W.-Y.; Huang, J.-S.; Lin, C.-F. Improving the property of ZnO nanorods using hydrogen peroxide solution. J. Cryst. Growth 2008, 310, 2806–2809. [Google Scholar] [CrossRef]
  127. Briones, M.; Busó-Rogero, C.; Catalán-Gómez, S.; García-Mendiola, T.; Pariente, F.; Redondo-Cubero, A.; Lorenzo, M.E. ZnO nanowire-based fluorometric enzymatic assays for lactate and cholesterol. Microchim. Acta 2020, 187, 180. [Google Scholar] [CrossRef] [PubMed]
  128. Nagovitsyn, I.A.; Chudinova, G.K.; Lobanov, A.V.; Boruleva, E.A.; Moshnikov, V.A.; Nalimova, S.S.; Kononova, I.E. Enhancement of Fluorescence of Nanosized ZnO: SiO2 Films in the Presence of Human Serum Albumin. Russ. J. Phys. Chem. B 2018, 12, 651–656. [Google Scholar] [CrossRef]
  129. Vasudevan, S.; Srinivasan, P.; Rayappan, J.B.B.; Solomon, A.P. A photoluminescence biosensor for the detection of N-acyl homoserine lactone using cysteamine functionalized ZnO nanoparticles for the early diagnosis of urinary tract infections. J. Mater. Chem. B 2020, 8, 4228–4236. [Google Scholar] [CrossRef] [PubMed]
  130. Swaminathan, N.; Sharma, N.; Nerthigan, Y.; Wu, H.-F. Self-assembled diphenylalanine-zinc oxide hybrid nanostructures as a highly selective luminescent biosensor for trypsin detection. Appl. Surf. Sci. 2021, 554, 149600. [Google Scholar] [CrossRef]
  131. Malinovskis, U.; Dutovs, A.; Poplausks, R.; Jevdokimovs, D.; Graniel, O.; Bechelany, M.; Muiznieks, I.; Erts, D.; Prikulis, J. Visible Photoluminescence of Variable-Length Zinc Oxide Nanorods Embedded in Porous Anodic Alumina Template for Biosensor Applications. Coatings 2021, 11, 756. [Google Scholar] [CrossRef]
  132. Mai, H.H.; Tran, D.H.; Janssens, E. Non-enzymatic fluorescent glucose sensor using vertically aligned ZnO nanotubes grown by a one-step, seedless hydrothermal method. Microchim. Acta 2019, 186, 245. [Google Scholar] [CrossRef]
  133. Zhao, D.; Song, H.; Hao, L.; Liu, X.; Zhang, L.; Lv, Y. Luminescent ZnO quantum dots for sensitive and selective detection of dopamine. Talanta 2013, 107, 133–139. [Google Scholar] [CrossRef]
  134. Mai, H.H.; Janssens, E. Au nanoparticle–decorated ZnO nanorods as fluorescent non-enzymatic glucose probe. Microchim. Acta 2020, 187, 577. [Google Scholar] [CrossRef]
  135. Soundharraj, P.; Dhinasekaran, D.; Rajendran, A.R.; Prakasarao, A.; Ganesan, S. N-Doped zinc oxide as an effective fluorescence sensor for urea detection. New J. Chem. 2021, 45, 6080–6090. [Google Scholar] [CrossRef]
  136. Kamaci, U.D.; Kamaci, M. Selective and Sensitive ZnO Quantum Dots Based Fluorescent Biosensor for Detection of Cysteine. J. Fluoresc. 2021, 31, 401–414. [Google Scholar] [CrossRef]
  137. Ghosh, J.; Ghosh, R.; Giri, P.K. Tuning the visible photoluminescence in Al doped ZnO thin film and its application in label-free glucose detection. Sens. Actuators B Chem. 2018, 254, 681–689. [Google Scholar] [CrossRef]
  138. Walker, J.M.; Akbar, S.A.; Morris, P.A. Synergistic effects in gas sensing semiconducting oxide nano-heterostructures: A review. Sens. Actuators B Chem. 2019, 286, 624–640. [Google Scholar] [CrossRef]
  139. Mendoza García, M.; Izadifar, M.; Chen, X. Evaluation of PBS Treatment and PEI Coating Effects on Surface Morphology and Cellular Response of 3D-Printed Alginate Scaffolds. J. Funct. Biomater. 2017, 8, 48. [Google Scholar] [CrossRef] [PubMed] [Green Version]
  140. Lv, J.; Zhang, S.; Luo, L.; Han, W.; Zhang, J.; Yang, K.; Christie, P. Dissolution and Microstructural Transformation of ZnO Nanoparticles under the Influence of Phosphate. Environ. Sci. Technol. 2012, 46, 7215–7221. [Google Scholar] [CrossRef] [PubMed]
  141. Rathnayake, S.; Unrine, J.M.; Judy, J.; Miller, A.-F.; Rao, W.; Bertsch, P.M. Multitechnique Investigation of the pH Dependence of Phosphate Induced Transformations of ZnO Nanoparticles. Environ. Sci. Technol. 2014, 48, 4757–4764. [Google Scholar] [CrossRef] [PubMed]
  142. Mudunkotuwa, I.A.; Rupasinghe, T.; Wu, C.-M.; Grassian, V.H. Dissolution of ZnO Nanoparticles at Circumneutral pH: A Study of Size Effects in the Presence and Absence of Citric Acid. Langmuir 2012, 28, 396–403. [Google Scholar] [CrossRef] [PubMed]
  143. David, C.A.; Galceran, J.; Rey-Castro, C.; Puy, J.; Companys, E.; Salvador, J.; Monné, J.; Wallace, R.; Vakourov, A. Dissolution Kinetics and Solubility of ZnO Nanoparticles Followed by AGNES. J. Phys. Chem. C 2012, 116, 11758–11767. [Google Scholar] [CrossRef]
  144. Ziemniak, S.E.; Jones, M.E.; Combs, K.E.S. Zinc(II) oxide solubility and phase behavior in aqueous sodium phosphate solutions at elevated temperatures. J. Solut. Chem. 1992, 21, 1153–1176. [Google Scholar] [CrossRef]
  145. Han, Y.; Kim, D.; Hwang, G.; Lee, B.; Eom, I.; Kim, P.J.; Tong, M.; Kim, H. Aggregation and dissolution of ZnO nanoparticles synthesized by different methods: Influence of ionic strength and humic acid. Colloids Surf. A Physicochem. Eng. Asp. 2014, 451, 7–15. [Google Scholar] [CrossRef]
  146. Eixenberger, J.E.; Anders, C.B.; Hermann, R.J.; Brown, R.J.; Reddy, K.M.; Punnoose, A.; Wingett, D.G. Rapid Dissolution of ZnO Nanoparticles Induced by Biological Buffers Significantly Impacts Cytotoxicity. Chem. Res. Toxicol. 2017, 30, 1641–1651. [Google Scholar] [CrossRef] [Green Version]
Figure 1. 14 K PL spectra and respective scanning electron microscopy (SEM) images of distinct morphologies, nanoparticles (NP), tetrapods (TP) and microrods (MR), of ZnO crystals grown by the LAFD method under different laser powers in air atmosphere. More details can be found in [80].
Chemosensors 10 00039 g001
Figure 2. RT PL spectra of the ZnO nanorods modified with anti-Salmonella AB and bovine serum albumin (BSA), monitored in the NBE spectral region for different concentrations of Salmonella. Copyright 2014 IEEE. Reprinted, with permission, from Viter et al. [50].
Chemosensors 10 00039 g002
Figure 3. RT PL spectra of the ZnO nanorods monitored after the incubation of the different concentrations of OTA and registered at steady-state conditions under 337 nm excitation. Reprinted from Viter et al. [34]. Copyright (2018), with permission from Elsevier.
Chemosensors 10 00039 g003
Figure 4. RT PL spectra of the gp51&BSA/PAH/ZnO structure when incubated with the (a) ‘BLV-positive’ probe and (b) ‘BLV-negative’ (without any specific anti-gp51 AB). (c) Calibration plots of immunosensor gp51&BSA/PAH/ZnO-NR/glass upon incubation with ‘BLV-positive’ and ‘BLV-negative’ probes. S corresponds to 1-Inorm(C), where Inorm(C) is the normalized PL intensity (at the NBE maximum) at corresponding probe concentration C. Adapted from the work of Viter et al. [33]. Copyright (2019), with permission from Elsevier.
Chemosensors 10 00039 g004
Figure 5. RT PL spectra for ZnO samples incubated with different hCG concentrations (a) sensor (ZnO/anti-hCG/BSA) and (b) control samples (ZnO/anti-E. coli/BSA). (c) Mean variation of the sensing response with the logarithm of the hCG concentration. Adapted from Rodrigues et al. [9]. Copyright (2020), with permission from Elsevier.
Chemosensors 10 00039 g005
Figure 6. (a) RT PL spectra of a ZnO/LIG composites representative sample incubated with different HSA concentrations. (b) Sensing response (Equation (1)) as a function of the logarithm of the HSA concentration for representative sensors and control samples ZnO/LIG composites (1 mg of LIG [48]). (c) Average evolution of the sensing response and the respective calibration curve. The average evolution of the control samples was also added for comparison. In figures (b,c) the “0” value corresponds to the intensity of the blank and was added to simplify the representation.
Chemosensors 10 00039 g006
Figure 7. Schematic illustration of the band bending phenomena occurring near the surface of ZnO upon surface functionalization and analyte incubation and respective representative PL spectra: (a) bare ZnO transducer, (b) after complete surface functionalization, i.e., silanization followed by immobilization of the AB and BSA proteins, and (c) after incubation with the target analyte. CB and VB stand for conduction and valence bands, respectively. h corresponds to the height of the potential barrier, while w denotes the width of the depletion region. The full circles illustrate electrons while the open circles denote holes and the straight arrow represent radiative recombination.
Chemosensors 10 00039 g007
Figure 8. RT PL spectra of the ZnO NP in the presence of different concentrations of (a) H2O2 and (c) glucose. (b) Semi-logarithmic plot of PL intensity of the NBE and visible emission (DLE) as a function of the H2O2 concentration. (d) PL intensity of the NBE and DLE as a function of glucose concentration. Adapted from Sodzel et al. [52]. Reprinted by permission from Springer Nature Customer Service Centre GmbH: Springer Nature, Microchimica Acta [52]. COPYRIGHT (2015).
Chemosensors 10 00039 g008
Figure 9. Schematic representation of electron transfer from ZnO to H2O2 under UV illumination and the formation of oxygen active species that may passivate the oxygen vacancies (VO) at the surface of ZnO, in accordance with Equations (3) and (4).
Chemosensors 10 00039 g009
Figure 10. (a) Normalized PL spectra of the ZnO nanotubes when in contact with different glucose concentrations and the respective (b) response curve given by the change in the PL peak intensity. Image from Mai et al. [132]. Reprinted by permission from Springer Nature Customer Service Centre GmbH: Springer Nature, Microchimica Acta [132]. Copyright (2019).
Chemosensors 10 00039 g010
Figure 11. RT PL spectra of the APTES-capped ZnO QDs with different dopamine concentrations. Inset: relative intensity of APTES-capped ZnO QDs at 530 nm versus the concentration of dopamine. Reprinted from Zhao et al. [133]. Copyright (2013), with permission from Elsevier.
Chemosensors 10 00039 g011
Figure 12. Representative SEM images of the ZnO samples prior and after 72 h of immersion in solutions containing phosphate ions at different pH.
Chemosensors 10 00039 g012
Figure 13. (a) RT and (b) 14 K PL spectra for the ZnO samples immersed in the solutions containing phosphate ions with different pH and during different times. The spectra were vertically shifted for clarity. The vertical dashed lines indicate the positions associated with the ZnO recombinations. Reprinted from J. Rodrigues et al. [104]. Copyright (2022), with permission from Elsevier.
Chemosensors 10 00039 g013
Table 1. Summary of the works reported in the literature concerning ZnO immunosensors with PL transduction.
Type of ZnO StructuresGrowth
Methodology
Excitation
Wavelength
Functionalization ApproachBioreceptorAnalyte TestedPublication YearRef.
NanorodsGDS355 nmPhysical adsorptionAnti-Salmonella ABSalmonella sp.2014[50]
FilmsALD355 nmPhysical adsorptionAnti-Grapevine virus A-type ABGrapevine virus A-type2017[105]
NanorodsGDS337 nmCovalent
immobilization
Anti-Ochratoxin A ABOchratoxin A2018[34]
NanorodsGDS337 nmPhysical adsorptionBLV 1 protein gp51anti-gp51 AB2019[33]
NanorodsGDS337 nmCovalent
immobilization
Anti-human CD19 ABHuman leukemic cells (B-lymphoblastoid cell line IM9)2019[51]
NanorodsGDS337 nmPhysical adsorption & Covalent immobilizationAnti-CD5 ABHuman leukemic T-cells (cell line MOLT-4 2)2020[49]
TetrapodsLAFD325 nmPhysical adsorptionAnti-hCG ABhCG2020[9]
Polyacrylonitrile/ZnO nanofibresElectrospinning + ALD325 nmCovalent
immobilization
Anti-aflatoxin B1 ABAflatoxin B12021[106]
TetrapodsLAFD325 nmCovalent
immobilization
Anti-tetracycline ABTetracycline2022[107]
TetrapodsLAFD325 nmCovalent
immobilization
Anti-HSA ABHSA-Present
work
1 Bovine leukemia virus (BLV) 2 Derived from patients with acute lymphoblastic leukemia.
Publisher’s Note: MDPI stays neutral with regard to jurisdictional claims in published maps and institutional affiliations.

