Article

Electronic Nose Analysis and Statistical Methods for Investigating Volatile Organic Compounds and Yield of Mint Essential Oils Obtained by Hydrodistillation

by
Sepideh Zorpeykar
1,
Esmaeil Mirzaee-Ghaleh
1,*,
Hamed Karami
2,
Zeynab Ramedani
1 and
Alphus Dan Wilson
3,*
1
Department of Mechanical Engineering of Biosystems, Razi University, Kermanshah 67156-85421, Iran
2
Department of Petroleum Engineering, Knowledge University, Erbil 44001, Iraq
3
Pathology Department, Southern Hardwoods Laboratory, Center for Forest Health & Disturbance, Forest Genetics & Ecosystems Biology, Southern Research Station, USDA Forest Service, 432 Stoneville Road, Stoneville, MS 38776-0227, USA
*
Authors to whom correspondence should be addressed.
Chemosensors 2022, 10(11), 486; https://doi.org/10.3390/chemosensors10110486
Submission received: 6 October 2022 / Revised: 7 November 2022 / Accepted: 12 November 2022 / Published: 16 November 2022
(This article belongs to the Special Issue Chemometrics for Analytical Chemistry)

Abstract

:
A major problem associated with the development of medicinal plant products is the lack of quick, easy, and inexpensive methods to assess and monitor product quality. Essential oils are natural plant-derived volatile substances used worldwide for numerous applications. The important uses of these valuable products often induce producers to create fraudulent or lower quality products. As a result, consumers place a high value on authentic and certified products. Mint is valued for essential oil used in the food, pharmaceutical, cosmetic, and health industries. This study investigated the use of an experimental electronic nose (e-nose) for the detection of steam-distilled essential oils. The e-nose was used to evaluate and analyze VOC emissions from essential oil (EO) and distilled water extracts (DWEs) obtained from mint plants of different ages and for leaves dried in the shade or in the sun prior to hydrodistillation. Principal component analysis (PCA), linear discriminant analysis (LDA), and artificial neural networks (ANN) were performed on electrical signals generated from electronic nose sensors for the classification of VOC emissions. More accurate discriminations were obtained for DWEs sample VOCs than for EO VOCs. The electronic nose proved to be a reliable and fast tool for identifying plant EO. The age of plants had no statistically significant effect on the EO concentration extracted from mint leaves.

1. Introduction

Peppermint (Mentha piperita) belongs to the Lamiaceae plant family and is one of the most important medicinal plants widely used in the pharmaceutical, food, and health industries [1]. Mentha piperita is a sterile hybrid of species (M. aquatica × M. spicata), which is probably the most important peppermint source for oil distillation in the world based on the area of land cultivated [2]. Commercially grown mint leaves are fragrant, sweet, and have an aromatic, pungent, and spicy aroma, with a flavor that is cool to the taste. Peppermint is used medicinally to treat nausea, bronchitis, flatulence, anorexia, ulcerative colitis, and liver problems, and as an anti-inflammatory, carminative, antiemetic, diuretic, antispasmodic, analgesic, stimulant, and anticatarrhal agent [3]. It is also widely used in the flavoring of chewing gum, candy, ice cream, desserts, baked goods, tobacco, alcoholic beverages, and to flavor medicinal and oral drugs [2].
Mint is primarily cultivated for its volatile oil, although some countries use mint leaves in salad dressings. Peppermint is considered to be the most popular mint with the greatest medicinal value [4]. The essential oil (EO) content and composition varies among peppermints due to environmental variables such as air temperature, humidity, soil moisture and fertility, planting and harvesting times, and plant age [4,5,6]. The chemical structure of EO can also be affected by seasonal changes such as flowering status and harvesting times [5,6]. The genetics of the plant also may influence the biosynthesis and types of EOs produced [4]. The yield of peppermint EOs has been estimated to range from 0.1 to 2.5% of leaf dry weight [3,4,7].
Peppermint oil (Menthae piperitae aetheroleum) is extracted from fresh, semi-dried, or dried mint leaves. The oils are most commonly extracted using methods including cold pressing, solvent extraction, and hydrodistillation using a Clevenger extraction apparatus. The major constituents of peppermint oil are menthol (30–55%) and menthone (14–32%). Other monoterpenes present include 1,8-cineole (6–14%), isomenthone (2–10%), limonene (1–5%), neomenthol (2.5–3.5%), menthofuran (1–9%), α-pinene (1.0–1.5%), and β-pinene (1–2%) [7]. These mixtures of volatile organic compounds (VOCs) may also be influenced by extraction parameters such as temperature, time, pressure, and extraction methods [3,8]. Mint volatiles are largely composed of plant VOCs from the terpenoid chemical classes (monoterpenes, diterpenes, and sesquiterpenes).
Herbal medicines are used to support human health. Consequently, it is important to control the quality and purity of herbal medicines, like pharmaceuticals, to assure their potency and effectiveness. Unlike synthetic drugs, there are no strict regulatory standards for medicinal plant products. This lack of oversight can lead to dangerous results to human health due to intentional or unintentional fraud, counterfeiting, and dilutions with cheaper ingredients (adulteration), leading to a lower quality of herbal products [9,10]. Quality control procedures should be employed to ensure the quality of medicinal products. Both qualitative and quantitative measures are taken to ensure the safety of these products. Spectral methods such as UV (ultraviolet) and IR (infrared) are used for determining general visual qualitative aspects, whereas chemical analysis methods such as high-performance thin layer chromatography (HP-TLC), high pressure/high-performance liquid chromatography (HP-LC), supercritical fluid chromatography (SFC), thermal analysis, inductively coupled plasma mass spectrometry (ICP-MS), liquid chromatography-mass spectrometry (LC-MS), and gas chromatography-mass spectrometry (GC-MS) have been used for quality control [8]. Standardization methods are used to determine the identification, quality, and purity of medicinal plants, as well as the certification of herbal products. Primary identification using physical, chemical, and biological properties may contribute to product purity. To standardize herbal medicines with current and future trends, the World Health Organization (WHO) has established guidelines for standardization methods and procedures based on organoleptic properties, ash values, moisture content, microbial contamination, and chromatographic and spectroscopic evaluations [8].
Several studies have investigated the quality of EOs by analyzing their chemical composition and odor activities [11]. These analyses, including chromatographic and spectroscopic methods, provide more accurate information on quantitative and qualitative characteristics of EO compositions [12]. Such chemical analyses are complex, expensive, and time consuming. Human sensory analysis, based on olfactory detection by a skilled sensory panel, is similarly expensive and limited by small sample-size determinations due to operational fatigue [11,12]. New trends in olfactory evaluation techniques have emerged through the development of artificial olfactory systems, such as electronic-nose (e-nose) devices. The artificial olfaction methods do not replace conventional qualitative chemical analyses of VOCs, but provide an alternative, more rapid method for assessing and discriminating precise mixtures of VOC emissions from plants.
An electronic nose consists of an array of sensors, providing a collective output from all sensors that are used in combination with pattern recognition algorithms to detect and differentiate simple and complex odors or aromas [10]. An e-nose recognizes aroma patterns without identifying the individual chemical species present in the sample mixture. The signal responses from the sensor array are then converted by a transducer into digital output patterns (sensory response patterns). The signal responses of all sensors in the sensor array (to VOCs in the sample) are collectively assembled to form a sensor response pattern (smellprint signature) that is uniquely associated with specific sample types [13]. E-nose devices have been utilized extensively for numerous applications, particularly in plant sciences [14]. Due to their speed, portability, and compact design, electronic noses have been applied by the food industry for fraud detection [15], food quality assessments [16], beverage industry [16,17], agriculture [14,18], as well as for biomedicine, healthcare, and forensic science applications [19,20].
The objectives of this study were to test the capabilities of an experimental metal oxide semiconducting (MOS) electronic nose to (1) detect and distinguish differences in the overall composition of VOCs present within mixtures of headspace volatiles of EO and distilled water extract (DWE) mint fractions derived from different hydrodistillation methods, and (2) determine the effects of the plant age (at leaf harvest) and leaf drying methods on extraction yields of each fraction. The aim is to improve the effectiveness and efficiency of hydrodistillations of these valuable mint components for commercial applications and to qualify the aroma characteristics of the extraction products.

2. Materials and Methods

2.1. Preparation of Samples

Peppermint plants, M. piperita cultivar ‘Asia’, were asexually propagated to produce genetically identical clones that were planted in a field as a monocultural crop near Sahneh City, Kermanshah, Iran. Mint fields were irrigated at 4-day intervals until harvest in late June. No pesticides or fertilizers were applied prior to harvest. Stems of field-grown peppermint plants (ages 1–5 years after initial planting) were cut 4–5 cm from the ground and all collected at the same time for subsequent leaf sampling. Following harvests, the leaves from plants of the five different ages were separated and dried on the stems in two separate locations, either in full sun or in the shade, until dried to equilibrium with ambient air, then leaves from stems of individual plants (of specific ages) were removed and collected as raw materials for hydrodistillation. Sampling of leaves for each air-drying treatment consisted of 15 leaf sample replicates collected from separate plants of each of the five age classes and two drying methods, resulting in 150 total samples prepared for extraction and testing as two separate fractions (EO and DWE) from which VOCs were analyzed. To indicate differences in sample air-drying methods (treatments) used, the letter A was used for samples dried in the shade, and the letter B was used for samples dried in full sun. Moreover, the age of the plant was indicated for each sample type with numbers 1 to 5.

2.2. Extraction of EOs and DWEs by Hydrodistillation

The hydrodistillation process, used for the extraction of volatile EOs and related mint components, utilized liquid suspensions of dried peppermint leaves and were boiled and distilled to separate mint volatile extracts based on the differences in boiling points of individual chemical species. Steam distillates were separated into fractions by boiling to vaporize VOCs that were condensed as liquid condensates using a water-cooled condensation column and collected as separate distillate fractions composed of EOs and DWEs [3].
The EOs were extracted by hydrodistillation using a specially constructed Clevenger-type apparatus. For this study, each sample was prepared for extraction by placing 30 g of dried mint leaves into approximately 660 mL of distilled water, then placed within the 1 L vessel of the Clevenger apparatus. After the water was brought to a boil, each leaf sample was extracted for 2 h in the boiling water prior to distillation. The amount of total EOs extracted was calculated based on the percentage volume per gram weight (v/w%), based on the volume of EO condensates obtained from each extraction treatment. Using a thin graduate cylinder tube, the volume of the EO condensate was measured. Mint EOs make up about one-tenth of the total condensate volume that exits from the outlet tube of the Clevenger apparatus. After the mint EO distillate fraction emerges, the larger volume of the DWE condensate emerges from the tube. The DWE fraction diminishes to lower levels (in concentration) with reduced volatiles released over time, indicating the end of plant extraction. We stored the EO fractions in small 1.5 mL plastic containers with water-tight lids in the freezer at −18 °C until the samples were analyzed and tested for purity using the electronic nose. The larger DWE fraction (second distillate) was passed through a filtration system (funnel with filter cloth, and paper) to remove any suspended particles above 10 µm diameter. The DWE fraction was poured into sealed plastic bottles, labeled, and stored until cooled to ambient temperature at 21 °C. Each peppermint EO and DWE sample distillate fraction was placed into a 50 mL glass sampling container sealed with Parafilm plastic wrap for 20 min to build headspace volatiles immediately prior to e-nose analysis.

2.3. Electronic Nose

An experimental MOS electronic nose equipped with eight metal oxide sensors was used for all experiments. The entire VOC analysis apparatus consisted of a sample receiving system (gas sampling chamber), the gas sensor array of the e-nose, a data collection system, and pattern recognition algorithms used in sample discriminations. The eight metal oxide semiconductor (MOS) sensors in the sensor array were sensitive to a specific class of volatile chemicals. The characteristics of individual sensors in the MOS sensors array are summarized based on gases detected and detection range in Table 1. The electronic nose was activated and prewarmed for 1 hr to operating temperature (25 ± 1 ℃) before sample analysis to ensure a constant stable sensor surface temperature. The sensor gas path was purged with ambient carrier-input air, then filtered with calcium carbonate crystals to <4% relative humidity and with activated-carbon charcoal to remove exogenous, VOC contaminants. Prefiltered air was used in the building sample headspace and to purge the e-nose sensors before and after individual sample analysis runs.
The full e-nose sample analysis cycle consisted of the baseline correction, sample odor injection, and sensor chamber purging between individual sample runs. The sequence of e-nose data collection for each sample was initiated by placing each sample in a sampling container to build VOC headspace volatiles for analysis. The sample container was connected to the e-nose and fresh filtered air was passed through the sensor chamber to cleanse the sensor array prior to introduction of the headspace sample from the sampling chamber into the e-nose. The sample gas was pumped into the sensor array at a flow rate of 1 L/min. The response of the sensor array to sample volatiles was recorded by a data recorder. The sensor chamber was then cleansed again with pure air to prepare the sensor array for the subsequent sample analyzed. During the final stage of the analysis cycle prior to introduction of a new sample, a purge process was initiated in which filtered air was again pumped into the sensor chamber to normalize and precondition the sensor signal. The full run time took 100 s for a complete analysis cycle.
During exposure to the sample gas, the sensor array’s conductance change was converted to voltage change, and the voltage (V) was used as the electronic nose sensor response (one sample per treatment). The detection process involved eight voltage curves and a 150-s measurement phase. Following the measurement, the data were automatically recorded for analysis. Equation (1) was used to correct the baseline to eliminate noise and to normalize sensor responses:
Y s ( t ) = X s ( t ) X s ( 0 ) X s ( 0 )
where YS (t) is the normalized response, XS (0) is the baseline, and XS (t) is the sensor response. Using pre-processing methods and chemometrics tools, these data were statistically analyzed as described in the following sections.

2.4. Extraction Methods and Data Analysis

The classification performance of different extraction methods was analyzed using statistical methods including principal component analysis (PCA), linear discriminant analysis (LDA), and artificial neural network (ANN) methods, based on analyses of individual e-nose sensor voltage-response curves. Chemometric analysis was performed using Unscrambler vers. 10.1 (CAMO AS, Trondheim, Norway) and MATLAB vers. 7.1 (Mathworks. Inc., Natick, MA, USA) software packages.
An ANOVA factorial analysis was conducted using SPSS 16.0 software (SPSS Inc., Chicago, IL, USA) to determine the effect of experimental independent variable parameters, including plant age at harvest, leaf sample drying method, and plant age x drying method on yield of steam extracted EO content. A secondary statistic of Duncan’s multiple range test was calculated to determine the significance between treatment means of EO yields for plant age and drying factors.

Statistical Classifier Methods

Principal component analysis is the most widely used unsupervised method for data reduction, preserving as much statistical information as possible [21]. PCA involves the transformation of original data into a different form through orthogonal transformation. The largest variance between the data occurs in the first coordinate, the first principal component (PC1), and the second largest variance occurs in the second coordinate, the second principal component (PC2). The first two coordinates (PC1, PC2) after transformation explain most of the variance of the data within fewer dimensions. Coordinates in the transformed space are linear combinations of the original feature vectors. PCA simplifies data complexity by preserving trends and patterns into smaller dimensions. Analysis was performed on the maximum values of the response curves of the electronic nose sensor output responses to VOCs present in samples, reflecting a stable response of sensors to sample gas analytes recorded in the electrical signal [22]. The classification results of each sample (treatment) group using LDA are linearly correlated. LDA differs from PCA in that it is based on categorical information. Using PCA aims to minimize data noise and multicollinearity between different variables, whereas LDA aims to maximize the between-class variance and minimize the within-class variance [23,24].
Support vector machine (SVMs) methods are used for regression and classification, and SVM algorithms are classified as pattern recognition algorithms. SVM was originally developed for the linear classification of separable data, but it is now applied to non-linear data using kernel functions. Essentially, SVM defines decision boundaries for different classes of data points using hyperplanes, with edges separating classes according to the distance between data points. It has been widely used and studied because of its useful capabilities in regression classification and prediction [25].
ANNs are based on biological neural systems, which use a vast network of neurons to process data. The signal path between neurons is called a synapse, and all nodes are interconnected. These signals are usually real numbers, and the nodes calculate the outputs based on linear or nonlinear functions. A raw data set is processed in three layers: the input layer, the hidden layer, and the output layer [26].
Electronic-nose sensors with selective, high response sensitivities and wide responses to specific gas analyte mixtures are used in combination with neural networks for gas detection and discriminations. In the current study, the normalized signals of the gas sensor array were applied to a feedforward network developed in MATLAB (ANN) with eight input neurons (associated with the eight sensors in the array) and 10 result output neurons for results of sample identification and neurons of the hidden layer, which were determined by trial and error. Based on the data obtained from the electronic nose, 60% of the data were used for training, 20% for validation, and 20% for testing.

3. Results

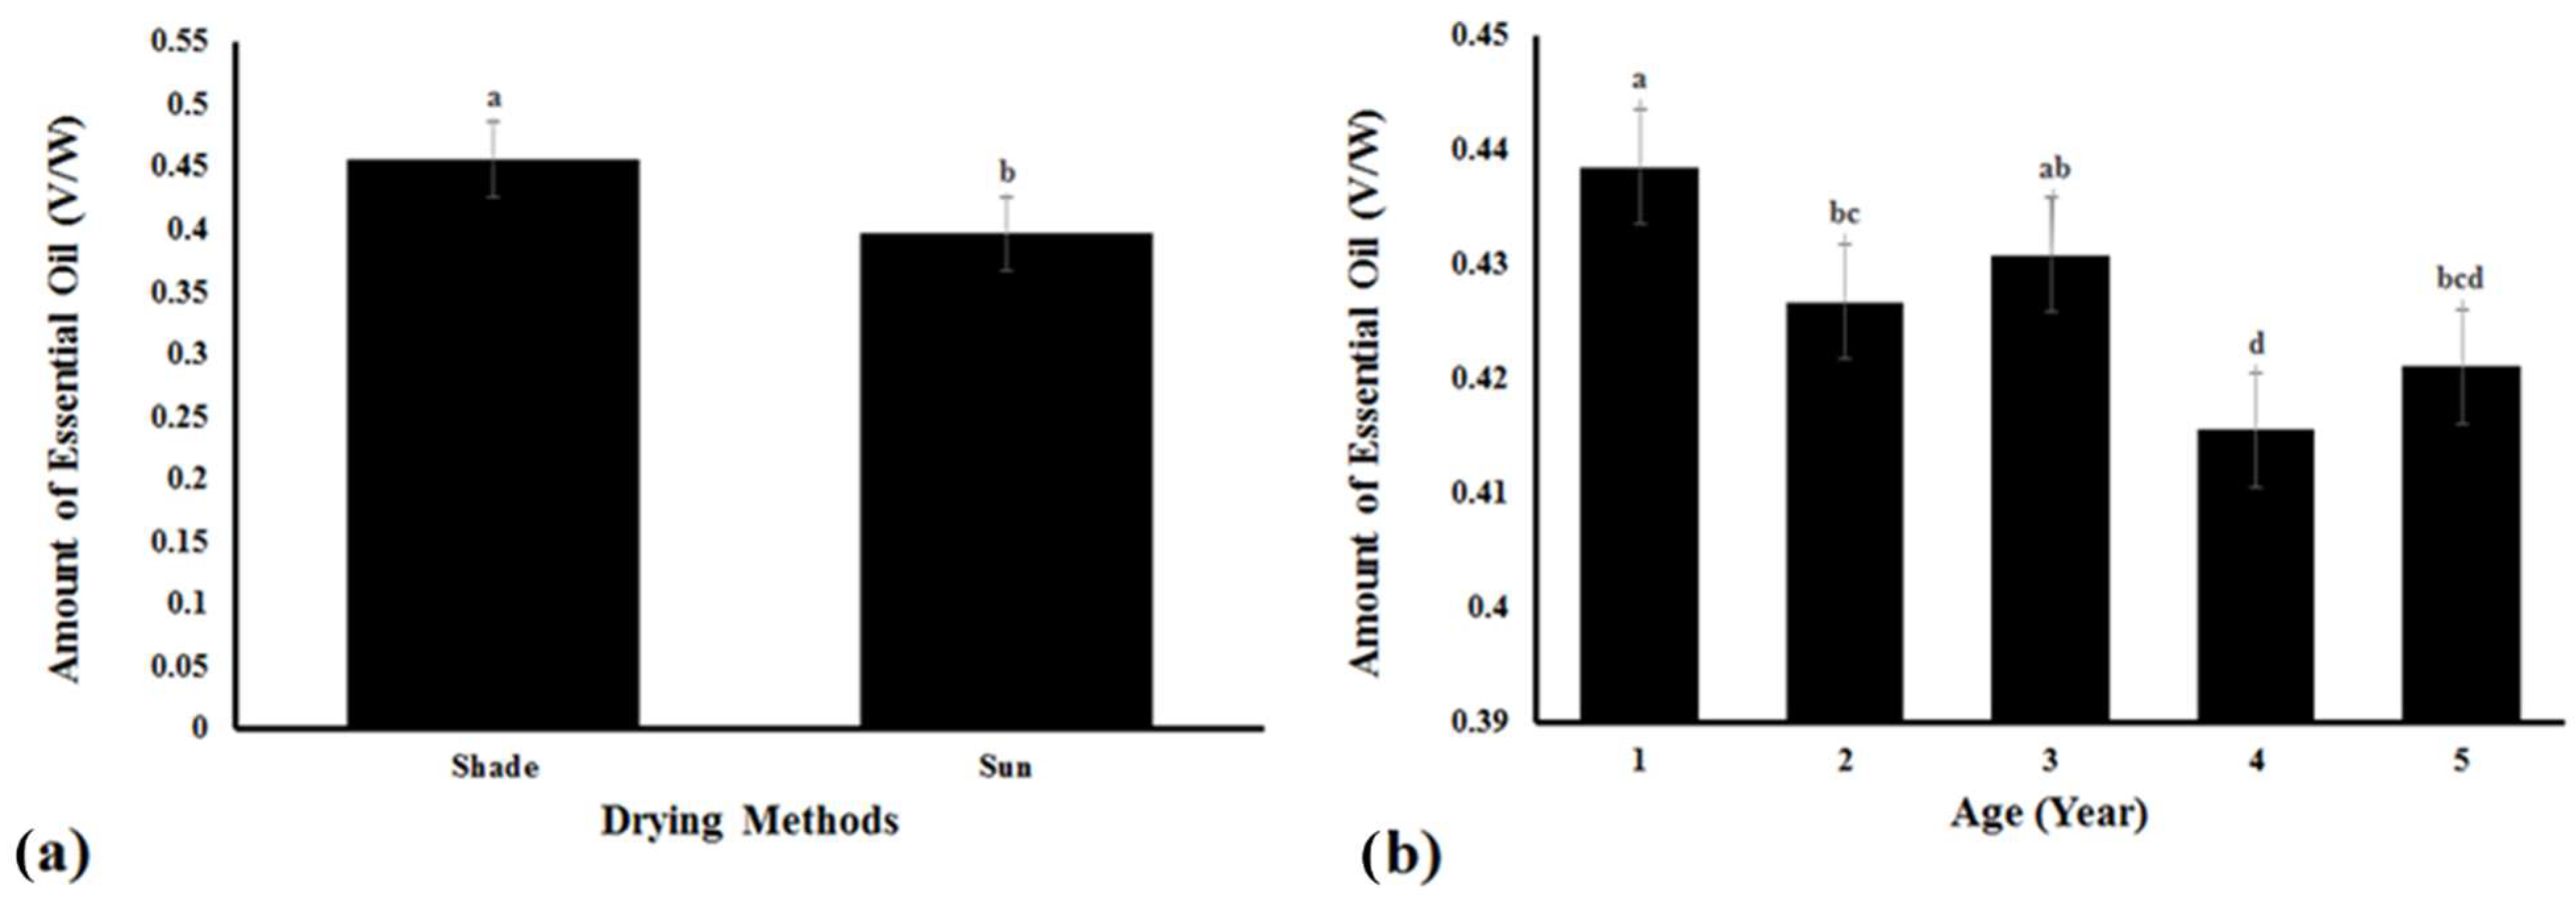
3.1. Effect of Harvesting Age and Drying Method on the Extracted EO Concentration

A factorial statistical analysis using ANOVA was conducted to determine the effect of experimental parameters, including plant age at harvest and leaf sample drying method on extracted EO content (yield). ANOVA results for this experiment are shown in Table 2. The independent variable factors of plant age and drying method had highly significant effects on the EO yield (p < 0.0001). However, the plant age x drying method factor interaction had no significant effect on the EO yield (p = 0.45).
The results of Duncan’s multiple range tests (secondary statistic), showing differences in EO yield means due to the drying method and plant age effects on EO extraction, are shown in Figure 1a. In the shade-drying method, the EO extraction was 0.4563 mL/g (v/w), while in the sun-drying method, the EO yield was significantly less at 0.3966 mL/g. Significant differences were observed in the EO yield from plants of different ages, but no clear trend (Figure 1b). In 1-year old plants, the maximum amount of extracted EO was 0.4385 mL by volume weight, whereas in 4-year old plants, the least amount of extracted EO was 0.4155 mL.

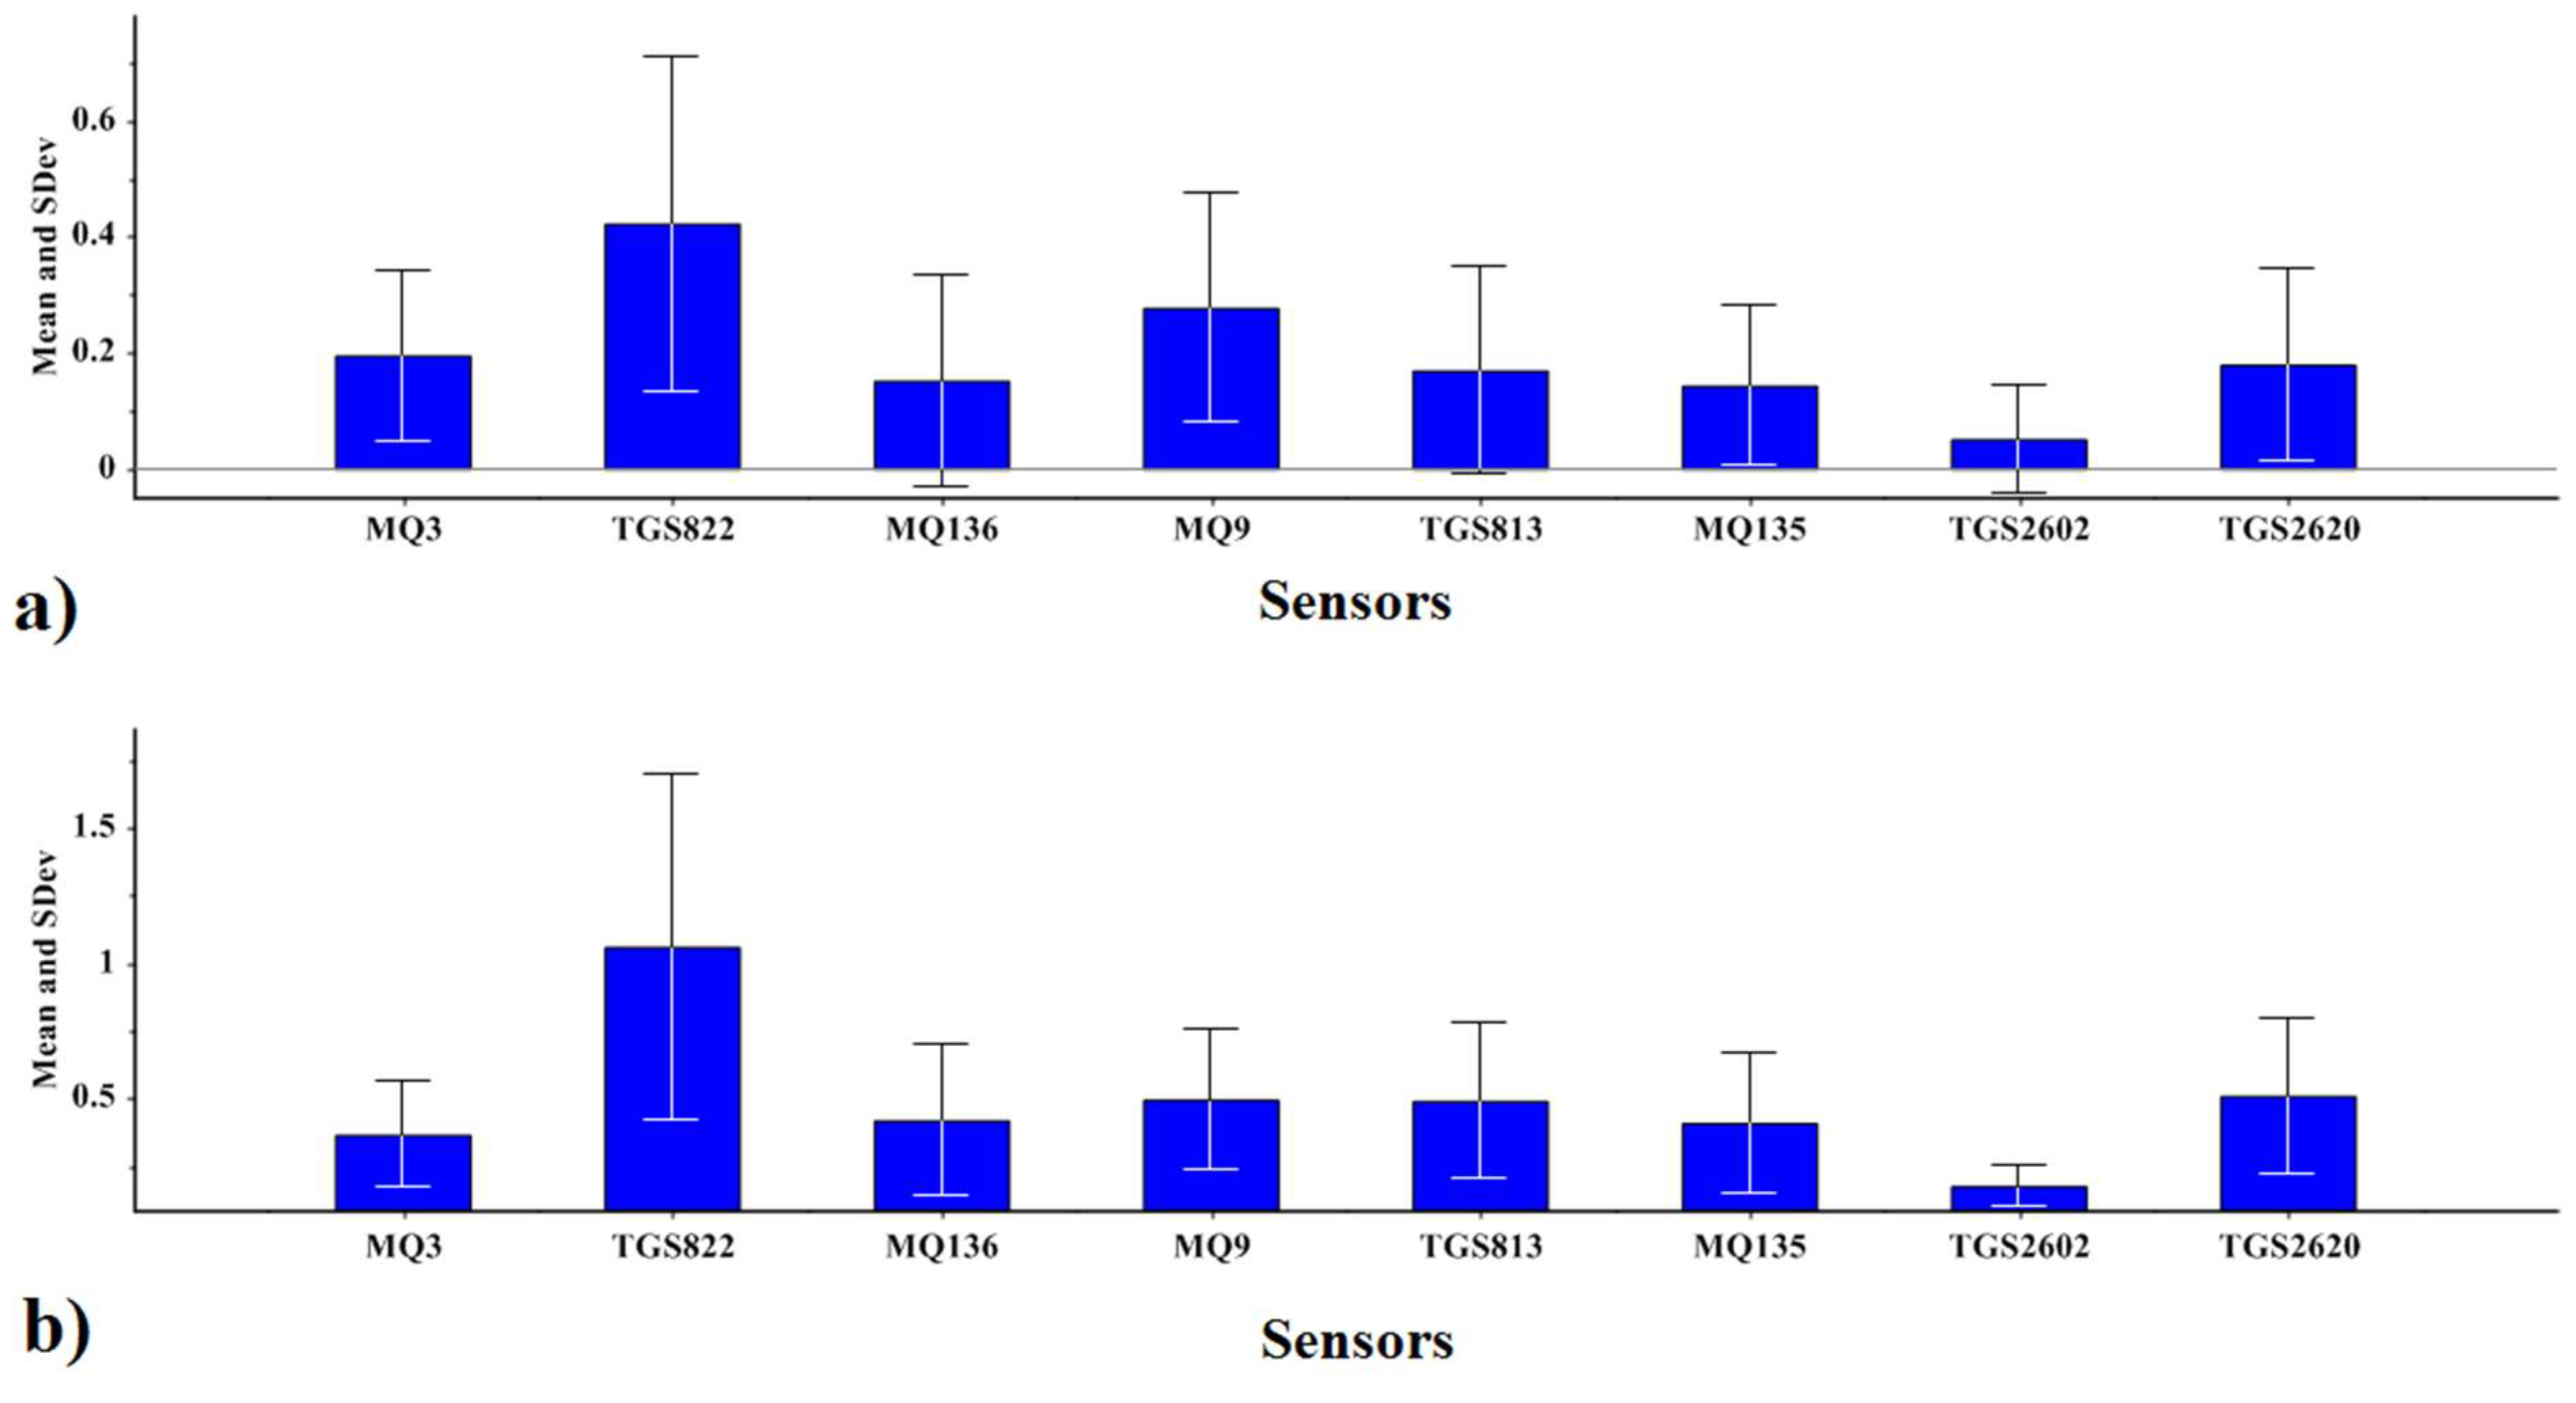
3.2. E-Nose Sensor Response Smellprint Patterns

A radar chart of E-nose sensor responses was used to observe differences in smellprint patterns resulting from sensor array responses to VOCs of mint EOs and DWEs after drying in shade vs. sun at different plant ages. The average normalized output responses of e-nose sensors are represented by corresponding radar plots from the analysis of distillate fractions of EOs and DWEs (Figure 2). E-nose sensor responses to VOCs of DWEs showed very similar smellprint patterns for samples derived from plants of different ages (Figure 2a). However, sensor intensity responses decreased proportionally as plant age increased for DWEs. Generally, shade air-dried samples had significantly greater sensor output responses than sun-dried samples, indicating greater yields of DWEs from shade air-dried plants.
The responses of e-nose sensors to VOCs of EOs resulted in considerably different smellprint patterns from leaf samples of different age plants (Figure 2b). The smellprint pattern for 1-year-old plants was similar to the results for 2-year-old plants, but older plants (3–5 years) had significantly different sensor response patterns. Sensor intensity responses decreased proportionally with increasing plant age for EO samples. Again, sensor response intensities were greater for shade air-dried leaf samples than for sun-dried samples.
Comparisons of sensor array response to VOCs from DWE and EO samples indicated different smellprint patterns and intensities, providing evidence for significant differences in the VOC composition of headspace volatiles from these two types of distillation fractions (Figure 2a,b). Sensor intensity responses generally were greater for the water DWE distillate fraction than for the oil EO fraction based on radar plot data.
The standard deviations of sensor responses to peppermint DWEs and EOs are presented in Figure 3. Sensors responded more strongly to DWEs than to EOs. Gas sensors TGS822, MQ9, and TGS2620 generally had the highest sensor intensity response to EO volatiles (Figure 3a). Similar results were observed for sensor intensity responses to VOC of DWEs, but intensity responses were reduced for sensors MQ3 and MQ9 (Figure 3b).

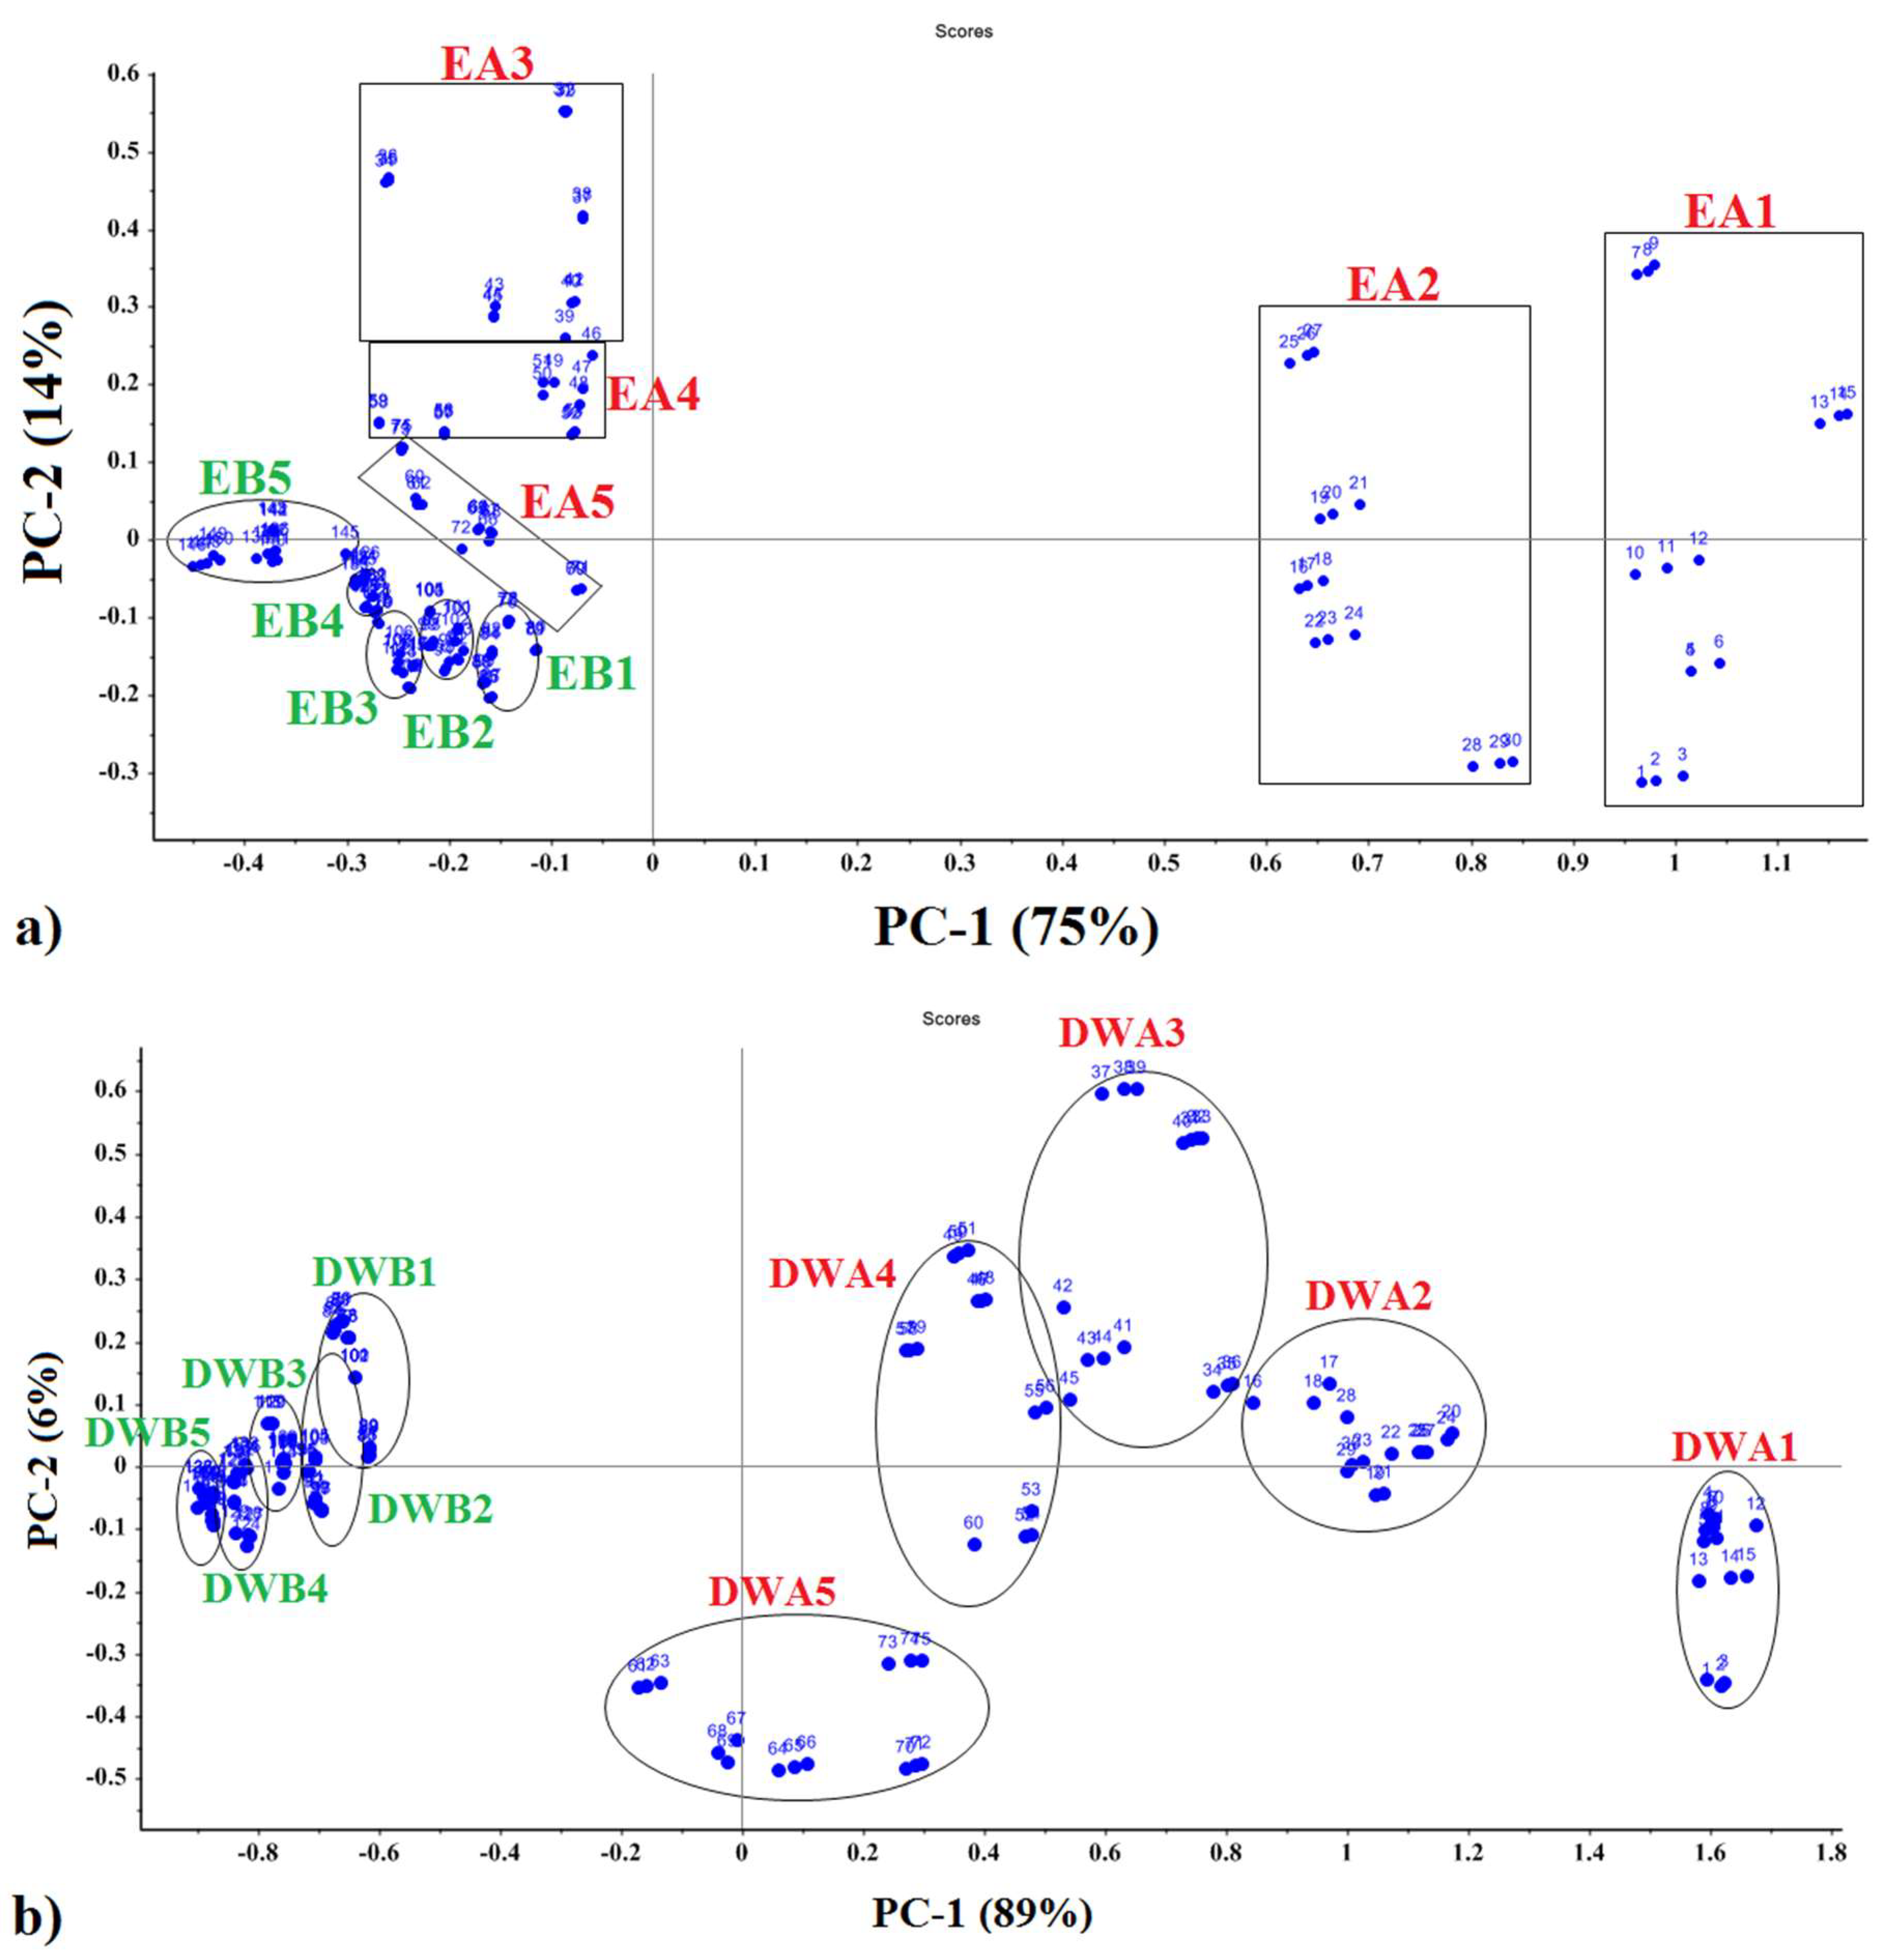
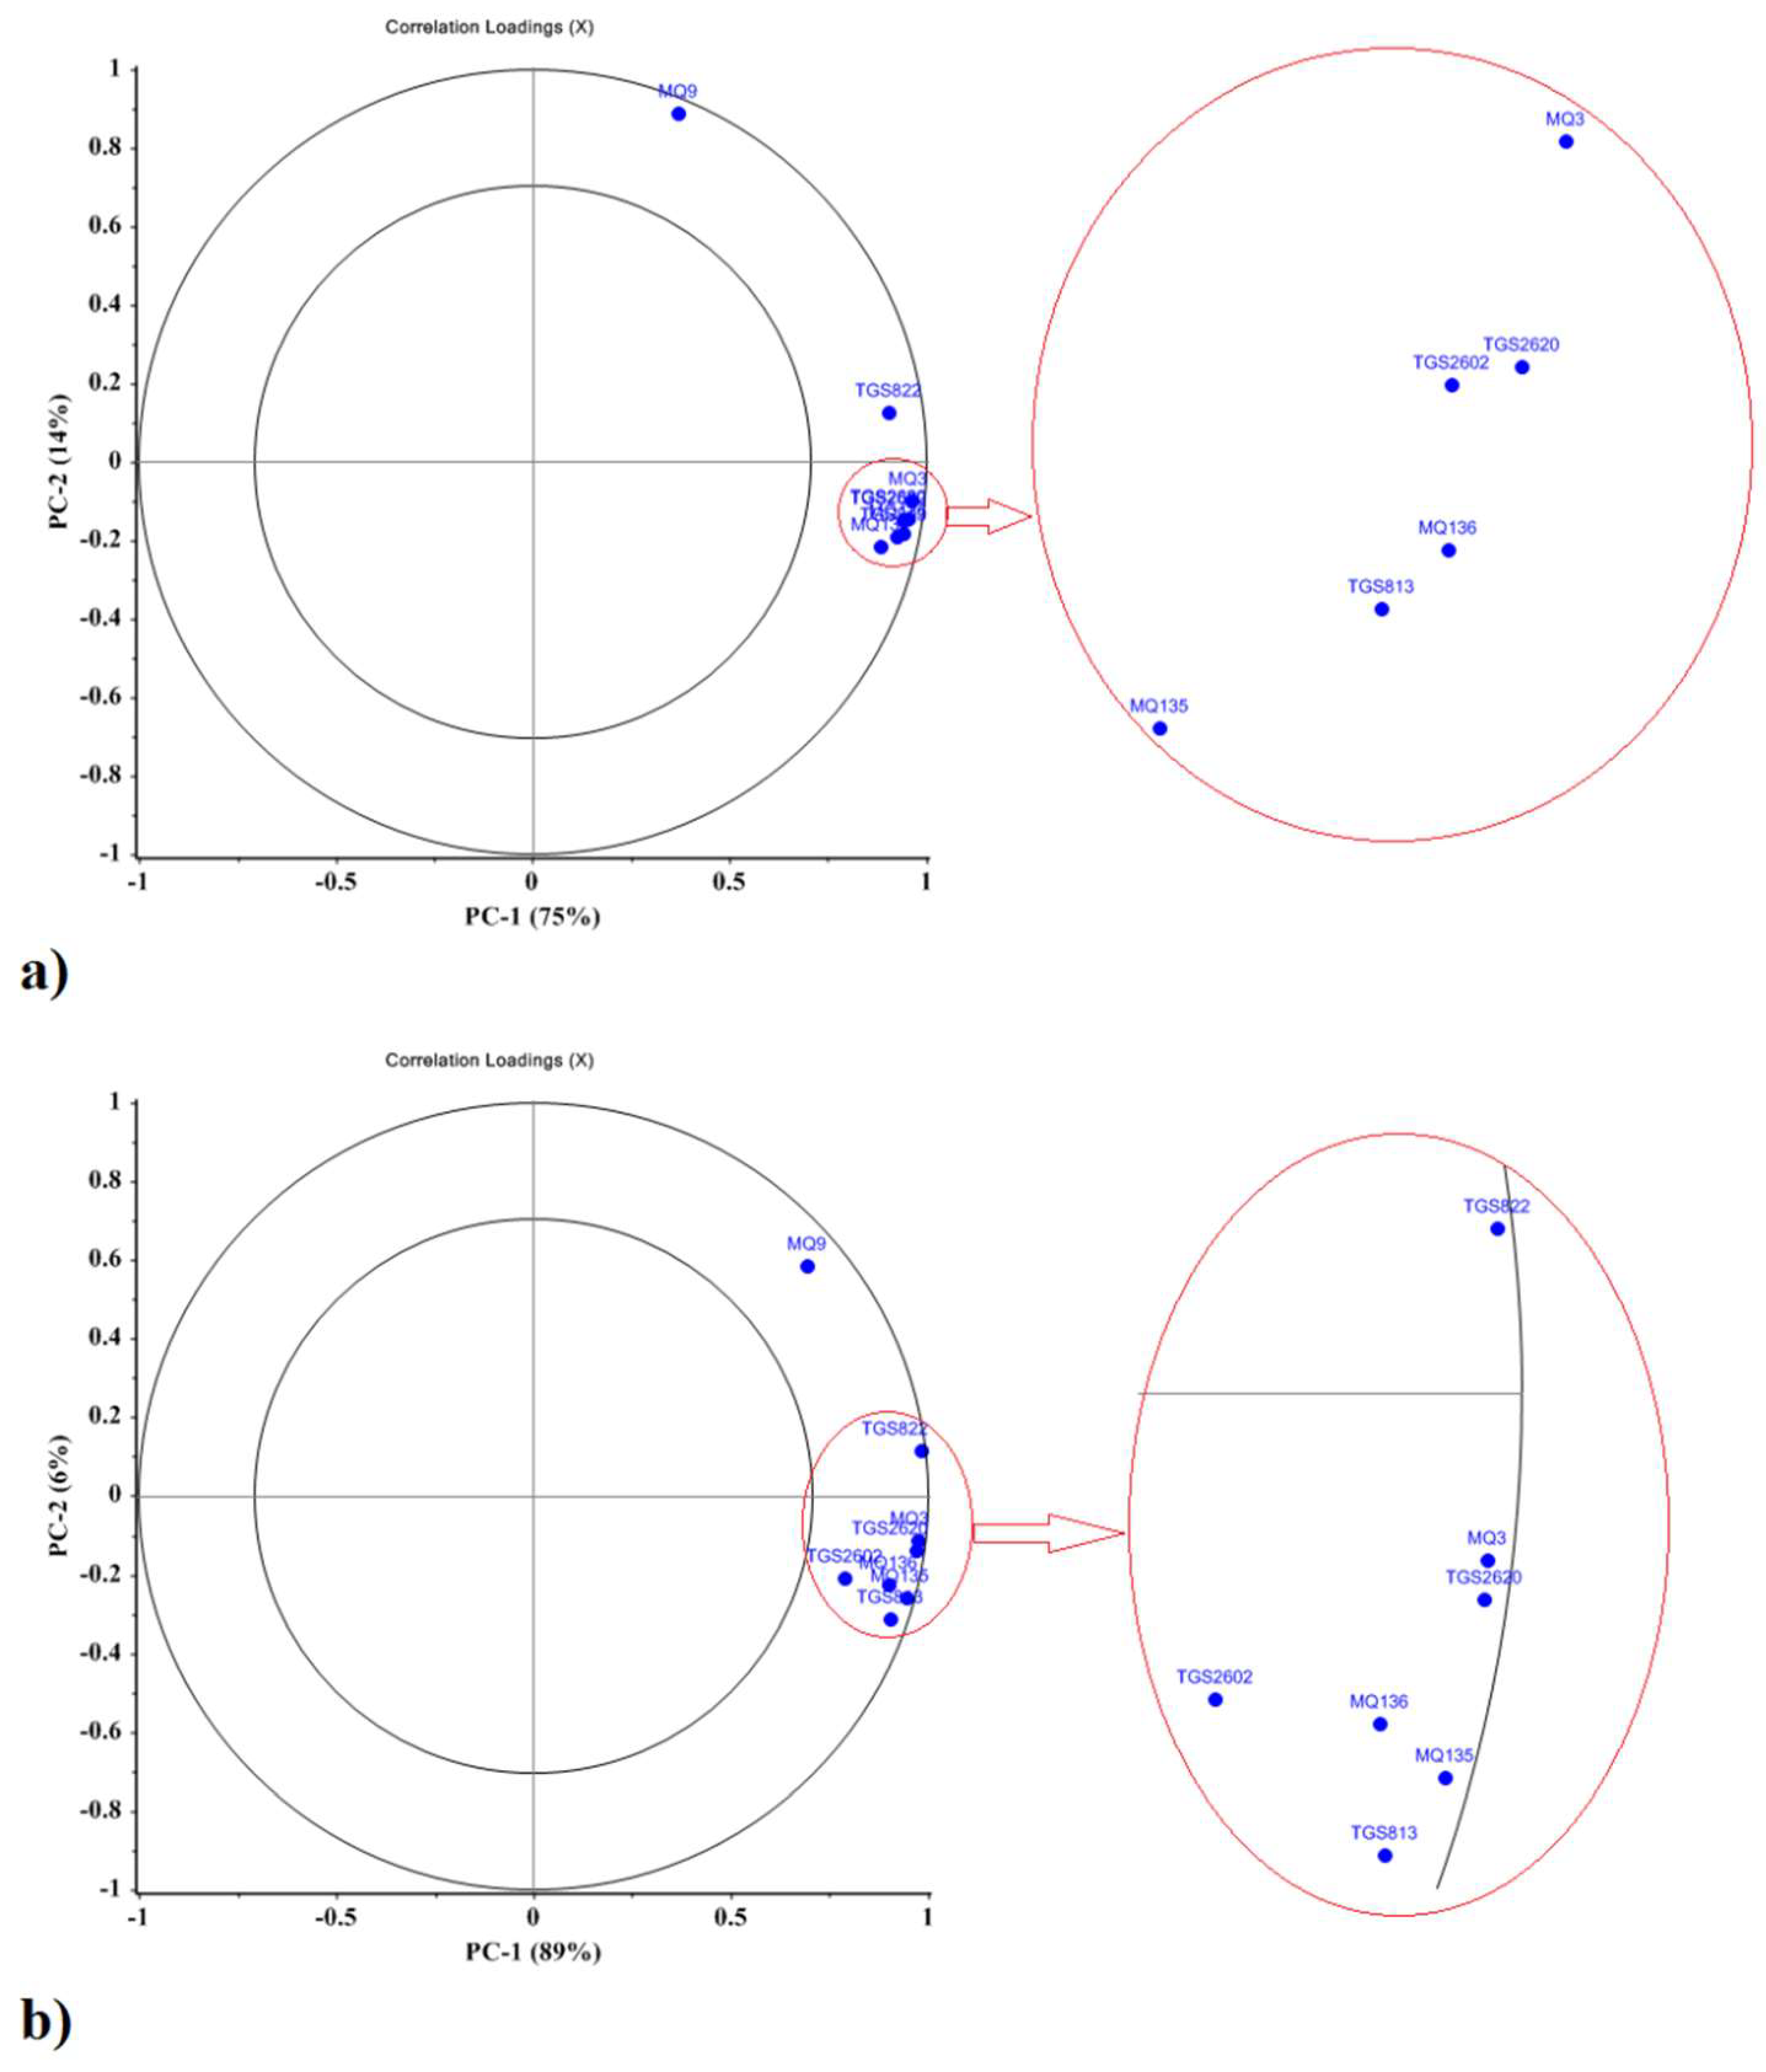
3.3. Principal Component Analysis

PCA analyses of each fractional component from hydro-distillation provided PCA data cluster plots indicating differences in the VOC mixtures for each treatment, as displayed in Figure 4. The separate principal components, indicated by the x-axis (PC-1) and y-axis (PC-2), provided a means for separate data points two-dimensionally. The variance of peppermint EO was 75% for PC-1 and 14% for PC-2, accounting for 89% of the total variance of the normalized data (Figure 4a). The variance of the data for DWE principal components was 89% for PC-1 and 6% for PC-2, respectively, with 95% of the total variance accounted for by the first two principal components (Figure 4b). PCA analysis indicated that the PC-1 principal component for DWE samples explained a larger proportion of the total variance than for EO samples (Figure 4a,b), showing higher accuracy in detecting DWE samples.
The distribution of data clusters and distances between them within PCA plots provided indications of similarities and differences in chemical composition of VOC mixtures between the various sample types (Figure 4a,b). Data cluster and locations of EO samples on the PCA plot indicate that samples air-dried in the shade from 1-year- and 2-year-old plants, located in the far-right quadrants, were most spacially separated from data clusters of the other sample types (located predominantly in the left quadrants of the plot (Figure 4a). EO samples from 3 to 5-year-old plants, dried in the shade, were located mainly in the upper left quadrant, whereas EO samples (from 1 to 5 year-old plants) dried in the sun were fairly tightly clustered in the left bottom quadrant with mostly negative values. Data clusters of different sample types that are further apart (more distant) are chemically less related in VOC chemical composition. Sample types with tight data clusters have a narrow range of VOC composition compared to more widely separated data clusters, indicating samples with a wider range of VOC composition (greater variability of VOC composition within the sample type).
The distribution of PCA data clusters for DWE samples was considerably different from that for EO samples (Figure 4b). All DWE samples, derived from 1 to 5 year-old plants with leaf samples dried in the shade, were located in the right quadrants of the plots, but once again the samples from 1-year- and 2-year-old plants were positioned furthest to the right (relative to older, 3 to 5-year plants) which were located more to the left side of the right quadrants. All DWE samples from leaves air-dried in the sun were tightly clustered in the far-left quadrants with considerable amounts of overlap between data clusters (Figure 4b), indicating low variability of VOC composition among DWE samples.
The correlation loadings plot shows the relationships between all variables and the relative role of sensors for each principal component as illustrated in Figure 5. The inner circle represents 50% of the total variance while the outer circle represents 100% of the total data variance. The higher the loading coefficient of a sensor, the greater its role in detection and classification. All the sensors had high loading coefficients and played a significant role in detecting EO and DWE hydrodistillation fractions (Figure 5a,b).

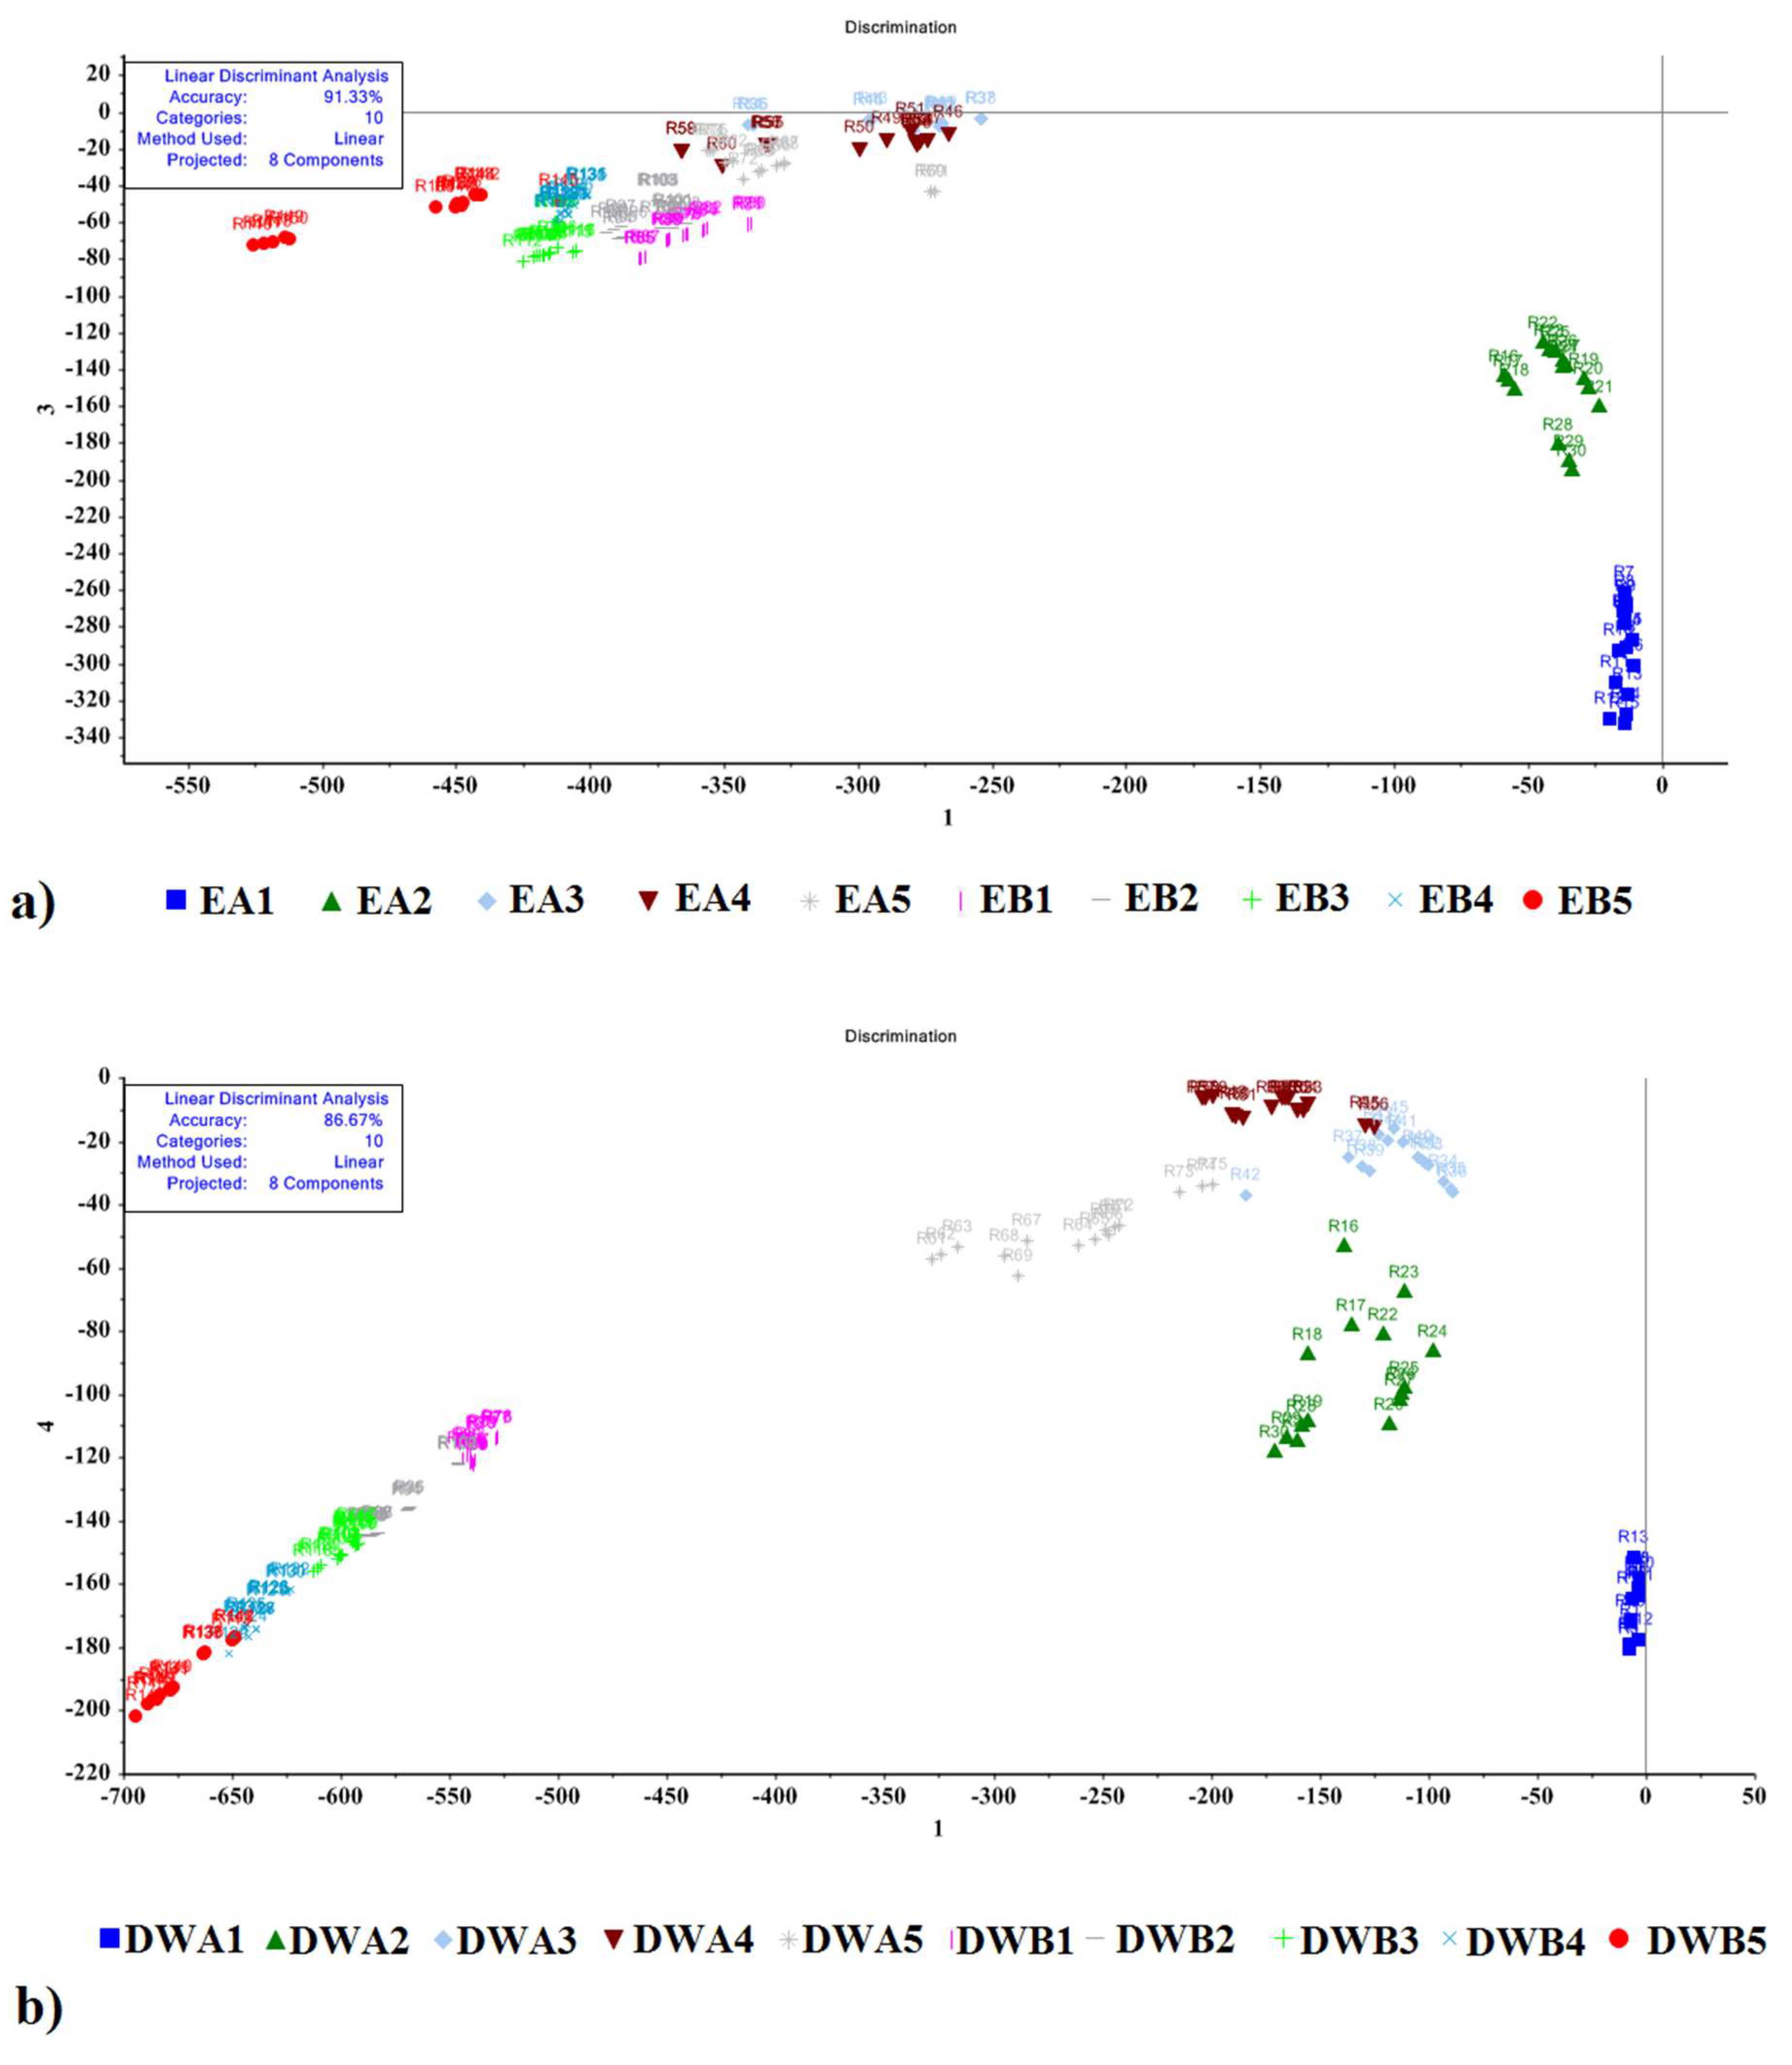
3.4. Linear Discriminant Analysis

The LDA method included data from all eight MOS e-nose sensors that had the same weight. The accuracy of the model for the classification of mint EO was 91.33%, and for mint DWE was 86.67%. The LDA method effectively discriminated between EO and DWE samples dried in the shade, but samples dried in the sun were not well classified due to the overlap of data clusters between treatment types. Data overlaps may result in misidentifications and incorrect classifications. LDA emphasizes the spatial distribution of mint aroma components and their distance from one another. The greater the dispersion between data collection points, the greater the group differentiation. There was good separation of data clusters for samples dried in the shade, but data from samples dried in the sun overlapped to some extent, indicating that the drying method has a significant impact on aroma variation. Samples EA1, EA2, and DWA1-5 were completely separated (isolated) from data clusters of other sample types, whereas some samples overlapped to some extent (Figure 6a,b), indicating closer chemical relatedness of VOC emissions.
Table 3 presents data for the confusion matrix and performance parameters of the LDA method. For the total of 150 data samples, only 13 were wrongly recognized for peppermint EO, while only 20 were misrecognized for peppermint DWE. As shown in Table 3, the wrong samples in the classification include one EA3 sample, two EA4 samples, three EA5 samples, three EB2 samples, three EB3 samples, and one EB5 sample. Some samples were misidentified as incorrect sample types (including one DWA3 sample, five DWB1 samples, three DWB2 samples, three DWB4 samples, and six DWB5 samples). In addition, according to the values in Table 3, the average values of accuracy, precision, recognition value, specificity, AUC and F-score for peppermint EO were 0.98, 0.92, 0.91, 0.99, 0.95, and 0.91, respectively. The same values for peppermint DWE were 0.97, 0.87, 0.87, 0.99, 0.93 and 0.86, respectively.
The confusion matrix data for LDA indicated that the drying method had a greater impact on DWE and EO extraction yield than plant age. Consequently, LDA was conducted without considering the age of the plant, and classification was based on the drying method alone (Figure 7a,b). As a result of this two-group classification method, the mint EO samples were correctly classified with 93.33% accuracy, whereas mint DWE samples were correctly classified with 100% accuracy (Table 4). Table 4 presents the confusion matrix and performance parameters of the LDA statistical method. Based on the average of 150 data, only 10 data for peppermint EO were misclassified, while all data for peppermint DWE were correctly classified. In Table 4, the misclassified samples belong to the first group, shade drying, which overlaps with sun drying, while for peppermint DWE both groups were correctly classified. It can also be seen from the values in Table 4 that the average values for accuracy, precision, recognition value, specificity, AUC, and F-score for peppermint EO were 0.93, 0.94, 0.93, 0.93, 0.94, and 0.93, respectively, while those obtained for mint DWE were 1.00.

3.5. Artificial Neural Networks

The input layer used normalized data from eight metal oxide sensors as input and 10 EO groups and peppermint DWE as targets to build the ANN. The hidden layer was also obtained by trial and error. Results are presented in Table 5 based on 60% of the total data used for training, 20% for validation, and 20% for testing.
A characteristic pattern in the sensor array is the presence of a particular gas which is equivalent to a signature that can be learned from sufficient training. The correct classification rate (CCR), R-squared (R2), and root mean square error (RMSE) were used to evaluate the obtained models. As shown in Table 5, the topology 8-10-10 obtained the best results for 10 groups of EO, while the topology 8-9-10 presented the best results for 10 groups of DWE. Thus, the R2 value of train and test for peppermint EO was 0.999 and 0.962, respectively, and the RMSE for train and test was 0.007 and 0.359, respectively. In addition, the model has an overall detection accuracy of 96.7%. By contrast, the R2 value for train and test in peppermint DWE was 0.999 and 0.998, respectively; and RMSE for the mentioned parameters was 0.036 and 0.070, respectively. Moreover, the model had an overall detection accuracy of 100%.
The confusion matrix and functional parameters are also shown in Table 6. Rows in the table correspond to the network output or predicted sample class, respectively, and columns correspond to the target class or the actual sample. The diagonal cells represent the number of correct classifications by ANN, while the off-diagonal cells represent the gases that were incorrectly classified. For mint EO, 5 of 150 data were incorrectly identified and the model has a detection accuracy of 96.7, whereas for mint DWE, all samples were identified correctly and the accuracy was 100%. The average values for accuracy, precision, recognition value, specificity, AUC, and F-score for peppermint EO were 0.99, 0.97, 0.97, 100, 0.98, and 0.94, respectively (Table 6), while these values for mint DWE were 100%. As shown by the lower performance value score for the training phase compared to the test phase, there is no evidence of under- or over-fitting.
The 8-10-10 topology had an accuracy of 100 for the classification based on the drying method for peppermint EO. Thus, the coefficient for determination (R2) values for train and test were both 0.999. For mint DWE, the 8-9-10 topology had an accuracy of 100% and the R2 values for train and test were also 0.999.

4. Discussion

We examined the capabilities of an experimental e-nose device to discriminate between VOC emissions from EO and DWE fractions of mint hydrodistillation and evaluated the effects of plant age at harvest and leaf drying methods (prior to extraction) on final yields. The e-nose device was found to be effective in distinguishing headspace VOC emissions from the two types of extracts analyzed. The analytical methods evaluated for the classification of volatiles’ composition included PCA, LDA, and ANN, which were performed from the analysis of electrical signals derived from electronic-nose sensors. PCA data cluster plots and indicated differences in the composition of VOC mixtures for each treatment. The LDA method effectively discriminated between EO and DWE samples dried in the shade, but samples dried in the sun were not well classified due to the overlap of data clusters between the treatment types. The ANN model had an overall detection accuracy of 96.7% for both EO and DWEs. The e-nose provided slightly more accurate discriminations for DWEs than for peppermint EOs. We found that the age of plants when mint leaves were harvested had no statistically significant effect on the essential oil concentration extracted. The electronic nose proved to be a reliable and fast tool for identifying plant EOs.
Several factors have been examined in previous studies to determine what plant and environmental parameters are important in affecting EO yields. Souza et al. [27] reported that leaf maturation is the physiological parameter most responsible for increasing the EO yield and VOC content of mint. Their results showed that young leaves are associated with higher contents of VOCs, including limonene and ketone monoterpenes (intermediates in the biosynthesis of menthol), but adult leaves contained higher contents of alcohol and ester monoterpenes. We did not examine the effects of leaf maturation on VOC content, but instead determined the effects of plant age on EO yield. Younger, 1-year old plants generally produced greater quantities of EOs than older plants, but there were no significant differences in EOs produced by plants older than 1 year of age. The effects of other environmental factors such as ambient temperature, cultivation methods, irrigation, and fertilization were not tested because all of these factors were held constant across sample types (plants of different ages all harvested at the same time).
Gershenzon et al. [28] examined monoterpene VOC changes. The monoterpene content of young leaves increased rapidly for the first 21 days of leaf development, then leveled off and was stable for the remainder of leaf life. In mint plant taxa, monoterpene content increases during the early stages of organ development and then remains relatively constant over the rest of organ life. The production of different types of monoterpenes in mint leaves largely depends on the age of leaves (level of maturity) and is controlled by subtle changes in the expression of monoterpene metabolic pathways that occur in a synchronous or successive process from the apex to the base of the leaf [29]. They determined this from studying the developmental changes in the monoterpene composition of individual glandular trichomes.
Mokhtarikhah et al. [30] showed that the highest yield of EOs from spearmint (M. spicata) was obtained from leaves dried in the sun. Ozdemir et al. [31] reported that they dried leaf, flower, and branches of Origanum vulgare and Origanum onites in an oven at 60 °C in the shade and in the sun and showed that the highest yield EO was obtained when dried in the shade. Bettaieb Rebey et al. [32] studied the effect of different drying methods on EO yield in seeds. Shade-dried samples yielded more EO than oven- and sun-dried samples. Drying plant samples in the shade is presumably the preferred and best drying method. As shade drying uses a lower temperature, aromatic compounds are evaporated at a slower rate and EOs are more abundant than in samples dried in an oven or in the sun [3,4].
It is essential for quality assessment to determine how EOs are extracted and produced. To preserve medicinal biochemical compounds, drying is the most common method [33,34]. After harvest, medicinal plants are very susceptible to fungal damage due to high humidity and moisture content. It is therefore important to reduce the drying humidity when choosing the most appropriate method. Drying moisture should be reduced to 5–12% [32,35]. The EO of fresh plants are stored on the leaf surfaces and in leaf trichomes. The integrity of oil glands in dried products depends on the persistence of EOs in dried leaves. As a result, maintaining trichome integrity or reducing damage to trichomes during drying may increase the production of EOs [36]. Many other factors can affect the production of EO in medicinal plants, such as the distance between plants (plant density), cutting height, season, age, harvest time, and drying method. EO production and associated medicinal properties are directly affected by these factors [37]. Several studies have demonstrated the effects of drying methods on the amount of EO in medicinal plants [3,9,38,39,40,41]. Some studies have focused on the age of plants at leaf harvest. Plant age should be determined not only based on the mass of the plant to be harvested, but also on its active EO content, without which the product would be sold at a lower price to consumers [34].
A plant’s appropriate age at harvest for optimal EO content depends on the plant parts harvested, growth stage, and time of year. Analyzing the effects of two plant ages on the EO content of Melissa officinalis leaves, researchers found that there was no significant difference (<0.02%) in the EO content of leaves from plants of different ages [42]. May et al. [43] similarly observed no variability in EO yield from leaves of Rosmarinus officinalis plants at various ages. Rocha et al. [34] investigated the effect of plant age on EO content and composition in Cymbopogon citratus leaves and concluded that plant age does not affect the amount of EO extracted from lemongrass leaves.
The differences we observed in the present study between EO yields and volatiles obtained from sun-drying and shade-drying methods may be attributed to the volatilization of some plant VOCs during drying at higher temperatures when exposed to direct sunlight. In addition, moisture is released by diffusion from the surface of the leaves as they dry. Since the oil-producing glands of the plant are located on or near the leaf surface, some EO is lost as the plant dries. There are other possible explanations for a decrease in the amount of EO during sun drying [8]. Sun drying yielded 0.3966 mL of EO. As a result, shade-dried plants produced more EO than sun-dried plants. Similarly, Mokhtarikhah et al. [30] showed that the highest yield of spearmint EO was measured after drying in the shade. Ozdemir et al. [31] reported that they dried Origanum vulgare and Origanum onites in an oven at 60 °C in the shade and in the sun and showed that the highest yield EO was obtained when dried in the shade.
Previous studies have utilized electronic-nose devices to detect the EO qualities of medicinal flowering plants. We tested a MOS e-nose instrument in the current study to investigate EO emissions from peppermint due to the versatility and effectiveness of these sensor types in plant VOC detection. Gorji-Chakespari et al. [44] utilized a similar MOS e-nose to distinguish between the EO volatiles of Rosa damascena. Their results analyzed with PCA and LDA showed that two principal components explained 85% and 99% of the sample variance, respectively. They concluded that the electronic nose functioned effectively as an accurate, fast, and inexpensive system for discriminating between Rosa damascena oil VOC composition. Graboski et al. [45] used a carbon nanocomposite sensor based e-nose for detection of clove EO. Based on PCA, they discovered that an e-nose could successfully detect differences in VOC composition at a variety of concentrations. EO levels could also be monitored using this approach. Aghoutane et al. [46] used an electronic nose along with PCA, DFA, and HCA methods to distinguish Okoume and Aiele EO volatiles. Other studies on EO analysis include such species as Mentha spicata [47], Cymbidium ensifolium [48], ginseng [49], Asari radix and Rhizoma spp. [50], Z. jujuba [51], and classification of rosemary (Rosmarinus officinalis) EO [52].

5. Conclusions

An experimental electronic nose was tested for the capabilities of detecting and discriminating between VOC headspace emissions from EO and DWE fractions of mint hydrodistillations. We evaluated PCA, LDA, and ANN algorithms for effectiveness and accuracy in discriminating between differences in overall VOC composition based on e-nose sensor responses. We found that the leaf extraction yield of EO obtained, regardless of the leaf-drying method, does not depend on the age of the peppermint plants. PCA was more effective in classifying VOCs from the DWE water fraction than from the EO fraction. The ANN method was more accurate than LDA for discriminating VOC sample types, but both methods indicated some overlapping data for peppermint EO. We conclude that peppermint DWE and EO can be effectively distinguished by analyzing VOC emissions from both fractions using electronic-nose sensory response data. Identification of individual VOCs by the e-nose is not necessary to discriminate between sample types. In fact, electronic-nose sensors detect collective differences in sample VOC composition without distinguishing individual VOCs present. The experimental e-nose VOC analysis results here provided good discrimination between peppermint EO and DWE fractions, distinguising between volatile emissions for quality assessments. Thus, the electronic nose could potentially be used commercially as a rapid, non-destructive method for detecting different types of mint hydrodistillation fractions (based on VOC emissions) for quality control assessments prior to the sale of medicinal mint extracts. In addition, the e-nose would be quite useful for monitoring types of EO VOC emissions at different times of the year for various mint cultivars, and as environmental factors change, to determine the best times to harvest leaves for EO extractions for optimum medicinal value.

Author Contributions

The contributions of collaborating scientists to this research article, as individual authors, are specified as follows. The contribution categories of individual authors include conceptualization, E.M.-G. and H.K.; methodology, E.M.-G. and H.K.; software, H.K.; validation, E.M.-G. and H.K.; formal analysis, H.K.; investigation, E.M.-G.; resources, E.M.-G.; data curation, H.K.; writing—original draft preparation, H.K. and S.Z.; writing—review and editing, A.D.W., H.K. and S.Z.; visualization, A.D.W. and H.K.; supervision, E.M.-G. and Z.R.; project administration, E.M.-G. and Z.R.; funding acquisition, E.M.-G. All authors have read and agreed to the published version of the manuscript.

Funding

This research received no external funding.

Institutional Review Board Statement

Not applicable.

Informed Consent Statement

Not applicable.

Data Availability Statement

Not applicable.

Acknowledgments

The authors recognize the financial assistance and infrastructure support provided by Razi University which is greatly appreciated.

Conflicts of Interest

The authors declare no conflict of interest.

References

  1. Murray, M.T. Ch. 94—Mentha piperita (Peppermint). In Textbook of Natural Medicine, 5th ed.; Pizzorno, J.E., Murray, M.T., Eds.; Churchill Livingstone: St. Louis, MO, USA, 2020; Volume 1, pp. 713–715. [Google Scholar] [CrossRef]
  2. Kokkini, S.; Karousou, R.; Hanlidou, E. Herbs of the Labiatae. In Encyclopedia of Food Sciences and Nutrition, 2nd ed.; Caballero, B., Ed.; Academic Press: Oxford, UK, 2003; pp. 3082–3090. [Google Scholar] [CrossRef]
  3. Karami, H.; Rasekh, M.; Darvishi, Y.; Khaledi, R. Effect of drying temperature and air velocity on the essential oil content of Mentha aquatica L. J. Essent. Oil Bear. Plants 2017, 20, 1131–1136. [Google Scholar] [CrossRef]
  4. Fejér, J.; Gruľová, D.; De Feo, V. Biomass production and essential oil in a new bred cultivar of peppermint (Mentha × piperita L.). Ind. Crops Prod. 2017, 109, 812–817. [Google Scholar] [CrossRef]
  5. Grulova, D.; De Martino, L.; Mancini, E.; Salamon, I.; De Feo, V. Seasonal variability of the main components in essential oil of Mentha × piperita L. J. Sci. Food Agric. 2015, 95, 621–627. [Google Scholar] [CrossRef] [PubMed]
  6. Zheljazkov, V.D.; Cantrell, C.L.; Astatkie, T.; Hristov, A. Yield, content, and composition of peppermint and spearmints as a function of harvesting time and drying. J. Agric. Food Chem. 2010, 58, 11400–11407. [Google Scholar] [CrossRef] [PubMed]
  7. Sachan, A.; Das, D.; Shuaib, M.D.; Gangwar, S.; Sharma, R. An overview on Menthae piperitae (Peppermint oil). Int. J. Pharm. Chem. Biol. Sci. 2013, 3, 834–838. Available online: https://www.ijpcbs.com/articles/an-overview-on-menthae-piperitae-peppermint-oil.pdf (accessed on 2 November 2022).
  8. Balekundri, A.; Mannur, V. Quality control of the traditional herbs and herbal products: A review. Future J. Pharm. Sci. 2020, 6, 67. [Google Scholar] [CrossRef]
  9. Liu, J.; Wang, W.; Yang, Y.; Yan, Y.; Wang, W.; Wu, H.; Ren, Z. A rapid discrimination of authentic and unauthentic Radix Angelicae Sinensis growth regions by electronic nose coupled with multivariate statistical analyses. Sensors 2014, 14, 20134–20148. [Google Scholar] [CrossRef] [Green Version]
  10. Rasekh, M.; Karami, H.; Wilson, A.D.; Gancarz, M. Performance analysis of MAU-9 electronic-nose MOS sensor array components and ANN classification methods for discrimination of herb and fruit essential oils. Chemosensors 2021, 9, 243. [Google Scholar] [CrossRef]
  11. Marriott, P.J.; Shellie, R.; Cornwell, C. Gas chromatographic technologies for the analysis of essential oils. J. Chromatogr. A 2001, 936, 1–22. [Google Scholar] [CrossRef]
  12. Russo, M.; Serra, D.; Suraci, F.; Postorino, S. Effectiveness of electronic nose systems to detect bergamot (Citrus bergamia Risso et Poiteau) essential oil quality and genuineness. J. Essential Oil Res. 2012, 24, 137–151. [Google Scholar] [CrossRef]
  13. Wilson, A.D.; Baietto, M. Applications and advances in electronic-nose technologies. Sensors 2009, 9, 5099–5148. [Google Scholar] [CrossRef]
  14. Wilson, A.D. Diverse applications of electronic-nose technologies in agriculture and forestry. Sensors 2013, 13, 2295–2348. [Google Scholar] [CrossRef] [PubMed] [Green Version]
  15. Zarezadeh, M.R.; Aboonajmi, M.; Varnamkhasti, M.G.; Azarikia, F. Olive oil classification and fraud detection using e-nose and ultrasonic system. Food Anal. Methods 2021, 14, 2199–2210. [Google Scholar] [CrossRef]
  16. Loutfi, A.; Coradeschia, S.; Mani, G.K.; Shankar, P.; Rayappan, J.B.B. Electronic noses for food quality: A review. J. Food Eng. 2015, 144, 103–111. [Google Scholar] [CrossRef]
  17. Bhattacharya, N.; Tudu, B.; Jana, A.; Ghosh, D.; Bandhopadhyaya, R.; Bhuyan, M. Preemptive identification of optimum fermentation time for black tea using electronic nose. Sens. Actuators B Chem. 2008, 131, 110–116. [Google Scholar] [CrossRef]
  18. Tatli, S.; Mirzaee-Ghaleh, E.; Rabbani, H.; Karami, H.; Wilson, A.D. Rapid detection of urea fertilizer effects on VOC emissions from cucumber fruits using a MOS e-nose sensor array. Agronomy 2022, 12, 35. [Google Scholar] [CrossRef]
  19. Farraia, M.V.; Cavaleiro Rufo, J.; Paciência, I.; Mendes, F.; Delgado, L.; Moreira, A. The electronic nose technology in clinical diagnosis: A systematic review. Porto Biomed. J. 2019, 4, e42. [Google Scholar] [CrossRef]
  20. Barshick, S.; Griest, W.H.; Vass, A.A. Electronic aroma detection technology for forensic and law enforcement applications. In Proc. SPIE 2941, Forensic Evidence Analysis and Crime Scene Investigation, (10 February 1997); Society of Photo-Optical Instrumentation Engineers: Washington, DC, USA, 1997. [Google Scholar] [CrossRef] [Green Version]
  21. Bro, R.; Smilde, A.K. Principal component analysis. Anal. Methods 2014, 6, 2812–2831. [Google Scholar] [CrossRef]
  22. Srinath, K.; Kiranmayee, A.H.; Bhanot, S.; Panchariya, P.C. Detection of palm oil adulteration in sunflower oil using ATR-MIR spectroscopy coupled with chemometric algorithms. MAPAN 2022, 37, 483–493. [Google Scholar] [CrossRef]
  23. Hartyáni, P.; Dalmadi, I.; Knorr, D. Electronic nose investigation of Alicyclobacillus acidoterrestris inoculated apple and orange juice treated by high hydrostatic pressure. Food Control 2013, 32, 262–269. [Google Scholar] [CrossRef]
  24. Qiao, J.; Su, G.; Liu, C.; Zou, Y.; Chang, Z.; Yu, H.; Wang, L.; Guo, R. Study on the application of electronic nose technology in the detection for the artificial ripening of crab apples. Horticulturae 2022, 8, 386. [Google Scholar] [CrossRef]
  25. Pardo, M.; Sberveglieri, G. Classification of electronic nose data with support vector machines. Sens. Actuators B Chem. 2005, 107, 730–737. [Google Scholar] [CrossRef]
  26. Shahid, A.; Choi, J.-H.; Rana, A.U.H.S.; Kim, H.-S. Least squares neural network-based wireless e-nose system using an SnO2 sensor array. Sensors 2018, 18, 1446. [Google Scholar] [CrossRef] [PubMed] [Green Version]
  27. Souza, M.; Lemos, M.; Brito, D.; Nora Castro, R.; Souza, S. Production and quality of menthol mint essential oil and antifungal and antigerminative activity. Am. J. Plant Sci. 2014, 5, 3311–3318. [Google Scholar] [CrossRef] [Green Version]
  28. Gershenzon, J.; McConkey, M.E.; Croteau, R.B. Regulation of monoterpene accumulation in leaves of peppermint. Plant Physiology 2000, 122, 205–214. [Google Scholar] [CrossRef] [Green Version]
  29. Voirin, B.; Bayet, C. Developmental changes in the monoterpene composition of Mentha x piperita leaves from individual peltate trichomes. Phytochemistry 1996, 43, 573–580. [Google Scholar] [CrossRef]
  30. Mokhtarikhah, G.; Ebadi, M.-T.; Ayyari, M. Qualitative changes of spearmint essential oil as affected by drying methods. Ind. Crops Prod. 2020, 153, 112492. [Google Scholar] [CrossRef]
  31. Ozdemir, N.; Ozgen, Y.; Kiralan, M.; Bayrak, A.; Arslan, N.; Ramadan, M.F. Effect of different drying methods on the essential oil yield, composition and antioxidant activity of Origanum vulgare L. and Origanum onites L. J. Food Meas. Charact. 2018, 12, 820–825. [Google Scholar] [CrossRef]
  32. Bettaieb Rebey, I.; Bourgou, S.; Ben Kaab, S.; Aidi Wannes, W.; Ksouri, R.; Saidani Tounsi, M.; Fauconnier, M.-L. On the effect of initial drying techniques on essential oil composition, phenolic compound and antioxidant properties of anise (Pimpinella anisum L.) seeds. J. Food Meas. Charact. 2020, 14, 220–228. [Google Scholar] [CrossRef] [Green Version]
  33. Parhizi, Z.; Karami, H.; Golpour, I.; Kaveh, M.; Szymanek, M.; Blanco-Marigorta, A.M.; Marcos, J.D.; Khalife, E.; Skowron, S.; Adnan Othman, N.; et al. Modeling and optimization of energy and exergy parameters of a hybrid-solar dryer for basil leaf drying using RSM. Sustainability 2022, 14, 8839. [Google Scholar] [CrossRef]
  34. Rocha, R.P.; de Castro Melo, E.; Barbosa, L.C.A.; dos Santos, R.H.S.; Cecon, P.R.; Dallacort, R.; Santi, A. Influence of plant age on the content and composition of essential oil of Cymbopogon citratus (DC.) Stapf. J. Med. Plants Res. 2014, 8, 1121–1126. [Google Scholar] [CrossRef] [Green Version]
  35. Guo, H.L.; Chen, Y.; Xu, W.; Xu, M.T.; Sun, Y.; Wang, X.C.; Wang, X.Y.; Luo, J.; Zhang, H.; Xiong, Y.K. Assessment of dry-ing kinetics, textural and aroma attributes of Mentha haplocalyx leaves during the hot air thin-layer drying process. Foods 2022, 11, 784. [Google Scholar] [CrossRef] [PubMed]
  36. Hazrati, S.; Lotfi, K.; Govahi, M.; Ebadi, M.-T. A comparative study: Influence of various drying methods on essential oil components and biological properties of Stachys lavandulifolia. Food Sci. Nutr. 2021, 9, 2612–2619. [Google Scholar] [CrossRef] [PubMed]
  37. Rahimi, A.; Farrokhi, E. Evaluation of the effect of different drying methods on antioxidant and phytochemical activity of essential oil of Origanum vulgare L. subsp. gracile. Eco-phytochem. J. Med. Plants 2019, 7, 15–27. Available online: https://www.sid.ir/en/journal/ViewPaper.aspx?id=787488 (accessed on 17 September 2022).
  38. de Aquino Brito Lima-Corrêa, R.; dos Santos Andrade, M.; da Silva, M.F.G.F.; Freire, J.T.; Ferreira, M.C. Thin-layer and vibrofluidized drying of basil leaves (Ocimum basilicum L.): Analysis of drying homogeneity and influence of drying conditions on the composition of essential oil and leaf colour. J. Appl. Res. Med. Aromat. Plants 2017, 7, 54–63. [Google Scholar] [CrossRef]
  39. Taheri-Garavand, A.; Mumivand, H.; Fatahi, S.; Nasiri, A.; Omid, M. Modeling the kinetics of essential oil content and main constituents of mint (Mentha aquatica L.) leaves during thin-layer drying process using response surface methodology. J. Food Process. Preserv. 2021, 45, e15515. [Google Scholar] [CrossRef]
  40. Ahmed, A.; Ayoub, K.; Chaima, A.J.; Hanaa, L.; Abdelaziz, C. Effect of drying methods on yield, chemical composition and bioactivities of essential oil obtained from Moroccan Mentha pulegium L. Biocatal. Agric. Biotechnol. 2018, 16, 638–643. [Google Scholar] [CrossRef]
  41. Soodmand-Moghaddam, S.; Sharifi, M.; Zareiforoush, H. Investigation of fuel consumption and essential oil content in drying process of lemon verbena leaves using a continuous flow dryer equipped with a solar pre-heating system. J. Clean. Prod. 2019, 233, 1133–1145. [Google Scholar] [CrossRef]
  42. Meira, M.; Manganotti, S.; Ronie Martins, E. Crescimento e produção de óleo essencial de Melissa officinalis L. nas condições climáticas de Montes Claros—MG. Biotemas 2011, 24, 1–8. [Google Scholar] [CrossRef]
  43. May, A.; Suguino, E.; Martins, A.; Barata, L.; Pinheiro, M.Q. Biomass production and essential oil of rosemary (Rosmarinus officinalis L.) in function of the height and interval between the cuts. Rev. Bras. Plantas Med. 2010, 12, 195–200. [Google Scholar] [CrossRef]
  44. Gorji-Chakespari, A.; Nikbakht, A.M.; Sefidkon, F.; Ghasemi-Varnamkhasti, M.; Valero, E.L. Classification of essential oil composition in Rosa damascena Mill. genotypes using an electronic nose. J. Appl. Res. Med. Aromat. Plants 2017, 4, 27–34. [Google Scholar] [CrossRef]
  45. Graboski, A.M.; Zakrzevski, C.A.; Shimizu, F.M.; Paschoalin, R.T.; Soares, A.C.; Steffens, J.; Paroul, N.; Steffens, C. Electronic nose based on carbon nanocomposite sensors for clove essential oil detection. ACS Sens. 2020, 5, 1814–1821. [Google Scholar] [CrossRef]
  46. Aghoutane, Y.; Moufid, M.; Motia, S.; Padzys, G.S.; Omouendze, L.P.; Llobet, E.; Bouchikhi, B.; El Bari, N. Characterization and analysis of okoume and aiele essential oils from Gabon by GC-MS, electronic nose, and their antibacterial activity assessment. Sensors 2020, 20, 6750. [Google Scholar] [CrossRef] [PubMed]
  47. Kiani, S.; Minaei, S.; Ghasemi-Varnamkhasti, M. Real-time aroma monitoring of mint (Mentha spicata L.) leaves during the drying process using electronic nose system. Measurement 2018, 124, 447–452. [Google Scholar] [CrossRef]
  48. Zhang, B.; Huang, Y.; Zhang, Q.; Liu, X.; Li, F.; Chen, K. Fragrance discrimination of Chinese Cymbidium species and cultivars using an electronic nose. Sci. Hortic. 2014, 172, 271–277. [Google Scholar] [CrossRef]
  49. Cui, S.; Wang, J.; Yang, L.; Wu, J.; Wang, X. Qualitative and quantitative analysis on aroma characteristics of ginseng at different ages using E-nose and GC–MS combined with chemometrics. J. Pharm. Biomed. Anal. 2015, 102, 64–77. [Google Scholar] [CrossRef] [PubMed]
  50. Li, C.; Xu, F.; Cao, C.; Shang, M.-Y.; Zhang, C.-Y.; Yu, J.; Liu, G.-X.; Wang, X.; Cai, S.-Q. Comparative analysis of two species of Asari Radix et Rhizoma by electronic nose, headspace GC–MS and chemometrics. J. Pharm. Biomed. Anal. 2013, 85, 231–238. [Google Scholar] [CrossRef]
  51. Hui, G.; Jin, J.; Deng, S.; Ye, X.; Zhao, M.; Wang, M.; Ye, D. Winter jujube (Zizyphus jujuba Mill.) quality forecasting method based on electronic nose. Food Chem. 2015, 170, 484–491. [Google Scholar] [CrossRef]
  52. Nie, J.-Y.; Li, R.; Jiang, Z.-T.; Wang, Y.; Tan, J.; Tang, S.-H.; Zhang, Y. Antioxidant activity screening and chemical constituents of the essential oil from rosemary by ultra-fast GC electronic nose coupled with chemical methodology. J. Sci. Food Agric. 2020, 100, 3481–3487. [Google Scholar] [CrossRef]
Figure 1. The average of the mutual effects between drying methods and age of plant on the extracted essential oil. Bar graph of amount of EO yield (±1 SD) for: (a) Drying methods (shade vs. sun), and (b) Age of plant (years old) between treatment means using Duncan’s multiple range test. Values with the same letter (a–d) are not significantly different at p = 0.01.
Chemosensors 10 00486 g001
Figure 2. Radar graph sensor array responses to VOCs from DWEs and EO hydro-distillation extracts. Radar plots are displayed for: (a) Water extract of DWE (second distillate fraction), and (b) Oil extract of EO (first distillate fraction). Sensor response lines are color-coded by sample drying method (A & B) and plant age (1–5) combinations, for both DWE and EO samples types, as follows: black (A1), orange (B1), maroon (A2), yellow (B2), light green (A3), light blue (B3), purple (A4), dark green (B4), cyan (A5), and red (B5).
Chemosensors 10 00486 g002
Figure 3. E-nose sensor array output responses to VOCs from DWE and EO sample extractions. Bar graph of individual sensor outputs (±1 SD) for: (a) Water DWE extract (second fraction), and (b) Oil steam-distillate EO (first fraction) between treatment means using Duncan’s multiple range test.
Chemosensors 10 00486 g003
Figure 4. Two-dimensional PCA plot to (a) mint EO, and (b) mint DWE with data collected using an e-nose.
Chemosensors 10 00486 g004
Figure 5. Loading plot for PCA analysis. Relative contribution of sensors for discriminations of hydrodistillation sample types for (a) mint EO, oil fraction, and (b) mint DWE, water fraction, determined from sensor array output data collected using the 8-sensor MOS e-nose.
Chemosensors 10 00486 g005
Figure 6. LDA results for (a) mint EO, and (b) mint DWE with data collected using an e-nose. Symbols for hydrodistillation sample types: E = essential oil fraction, DW = distillate from water fraction; A = leaf samples dried in the shade, B = leaf samples dried in the shade. Numbers indicate the age of plants that leaf samples were taken from (1–5 years old).
Chemosensors 10 00486 g006
Figure 7. LDA results for classification of two groups (a) mint EO (blue squares), and (b) mint DWE (red circles).
Chemosensors 10 00486 g007
Table 1. Sensor type, chemical class sensitivity, and detection range concentrations for the MOS experimental electronic nose sensor array.
Sensor No.Sensor TypeCommon Gases DetectedDetection Range (ppm)
1MQ3Alcohol10–300
2TGS822Organic solvents50–5000
3MQ-136Sulfur dioxide (SO2)1–200
4MQ-9CO, combustible gases10–10,000
5TGS813CH4, C3H8, C4H10500–10,000
6MQ135Ammonia, benzene, sulfides10–10,000
7TGS2602H2S, sulfides, ammonia, toluene1–30
8TGS2620Alcohol, organic solvents50–5000
Table 2. ANOVA results of steam-distilled, extracted mint EO.
SourceType III
Sum of Squares
dfMean SquareFSignificance
(p Values)
Corrected Model0.029 a90.003532.741<0.0001
Intercept5.45715.4579.146 × 105<0.0001
Plant age0.00240.00078.953<0.0001
Drying method0.02710.0274.475 × 103<0.0001
Plant age × Drying method2.3 × 10−545.75 × 10−60.9640.449
Error0.000205.97 × 10−6
Total5.48630
Corrected Total0.02929
a Coefficient of determination, R2 = 0.996 (adjusted R2 = 0.994).
Table 3. Confusion matrix and performance parameters of LDA methods 1.
E-AE-BAccuracyPrecisionRecallSpecificityAUCF
1234512345
EA1150000000001.001.001.001.001.001.00
EA2015000000001.001.001.001.001.001.00
EA3001400000000.991.000.931.001.000.97
EA4001133000000.960.760.870.970.870.81
EA5000212000000.970.860.800.980.920.83
EB1000001510000.990.941.000.990.960.97
EB2000000120000.981.000.801.001.000.99
EB3000000212000.960.860.800.980.920.83
EB4000000031510.970.791.000.970.880.88
EB5000000000140.991.000.931.001.000.97
Average0.980.920.910.990.950.91
DW-ADW-BAccuracyPrecisionRecallSpecificityAUCF
1234512345
DWA1150000000001.001.001.001.001.001.00
DWA2015000000001.001.001.001.001.001.00
DWA3001400000000.991.000.931.001.000.97
DWA4001150000000.990.941.000.990.970.97
DWA5000015000001.001.001.001.001.001.00
DWB1000001020000.950.830.670.990.910.74
DWB2000005100000.930.670.670.960.810.67
DWB3000000315000.980.831.000.980.910.91
DWB4000000001260.940.670.800.960.810.73
DWB500000000390.940.750.600.980.860.67
Average0.970.870.870.990.930.86
1 Symbols for hydrodistillation sample types: E = essential oil fraction, DW = distillate from water fraction; A = leaf samples dried in the shade, B = leaf samples dried in the shade. Hyphens are used in column headings to separate sample type from drying method.
Table 4. Confusion matrix and performance parameters of LDA methods for classification of two groups.
EO-AEO-BAccuracyPrecisionRecallSpecificityAUCF
EOA6500.931.000.871.001.000.93
EOB10750.930.881.000.870.870.94
Average0.930.940.930.930.940.93
DW-ADW-BAccuracyPrecisionRecallSpecificityAUCF
DWA7501.001.001.001.001.001.00
DWB0751.001.001.001.001.001.00
Average1.001.001.001.001.001.00
Table 5. Artificial neural network results.
TopologyTrainingTestCCR (%)
RMSER2RMSER2
Essential Oil8-6-100.5550.9010.6570.84985.6
8-7-100.4300.9430.5650.89690.0
8-8-100.4090.9490.5970.88388.8
8-9-100.2790.9770.4250.94695.2
8-10-100.0070.9990.3590.96296.7
8-11-100.1090.9960.3640.95496.1
Mint Distilled Water8-6-100.5590.8980.5520.90191.1
8-7-100.4630.9330.4670.93293.9
8-8-100.3280.9680.4140.94795.1
8-9-100.0360.9990.0700.998100.0
8-10-100.4230.9450.6890.85686.2
8-11-100.3680.9600.5380.90791.2
Table 6. Confusion matrix and performance parameters of ANN methods.
EO-AEO-BAccuracyPrecisionRecallSpecificityAUCF
1234512345
EOA1150000000001.001.001.001.001.001.00
EOA2015000000001.001.001.001.001.001.00
EOA3001500000001.001.001.001.001.001.00
EOA4000140000000.991.000.931.001.000.97
EOA5000115000000.990.941.000.990.970.97
EOB1000001500001.001.001.001.001.001.00
EOB2000000150001.001.001.001.001.001.00
EOB3000000012000.981.000.801.001.000.89
EOB4000000031510.970.791.000.970.880.88
EOB5000000000140.991.000.931.001.000.97
Average0.990.970.971.000.980.97
DW-ADW-BAccuracyPrecisionRecallSpecificityAUCF
1234512345
DWA1150000000001.001.001.001.001.001.00
DWA2015000000001.001.001.001.001.001.00
DWA3001500000001.001.001.001.001.001.00
DWA4000150000001.001.001.001.001.001.00
DWA5000015000001.001.001.001.001.001.00
DWB1000001500001.001.001.001.001.001.00
DWB2000000150001.001.001.001.001.001.00
DWB3000000015001.001.001.001.001.001.00
DWB4000000001501.001.001.001.001.001.00
DWB5000000000151.001.001.001.001.001.00
Average1.001.001.001.001.001.00
Publisher’s Note: MDPI stays neutral with regard to jurisdictional claims in published maps and institutional affiliations.

