Article

Synthesis of Molecularly Imprinted Polymer Nanoparticles for SARS-CoV-2 Virus Detection Using Surface Plasmon Resonance

1
Institute of Chemistry, Faculty of Maths and Natural Sciences, Technical University of Berlin, 10623 Berlin, Germany
2
Ilse Katz Institute for Nanoscale Science and Technology, Ben Gurion University of the Negev, Be’er Sheva 84105, Israel
3
Institute of Virology, Freie University Berlin, 14163 Berlin, Germany
4
Department of Electro-Optics and Photonics Engineering, ECE School, Ben Gurion University of the Negev, Be’er Sheva 84105, Israel
5
Institute of Materials Science, Faculty of Engineering, Kiel University, 24143 Kiel, Germany
*
Author to whom correspondence should be addressed.
Chemosensors 2022, 10(11), 459; https://doi.org/10.3390/chemosensors10110459
Submission received: 1 August 2022 / Revised: 23 October 2022 / Accepted: 1 November 2022 / Published: 5 November 2022

Abstract

:
COVID-19 caused by a SARS-CoV-2 infection was first reported from Wuhan, China, and later recognized as a pandemic on March 11, 2020, by the World Health Organization (WHO). Gold standard nucleic acid and molecular-based testing have largely satisfied the requirements of early diagnosis and management of this infectious disease; however, these techniques are expensive and not readily available for point-of-care (POC) applications. The COVID-19 pandemic of the 21st century has emphasized that medicine is in dire need of advanced, rapid, and cheap diagnostic tools. Herein, we report on molecularly imprinted polymer nanoparticles (MIP-NPs/nanoMIPs) as plastic antibodies for the specific detection of SARS-CoV-2 by employing a surface plasmon resonance (SPR) sensor. High-affinity MIP-NPs directed against SARS-CoV-2 were manufactured using a solid-phase imprinting method. The MIP-NPs were then characterized using dynamic light scattering (DLS) and atomic force microscopy (AFM) prior to their incorporation into a label-free portable SPR device. Detection of SARS-CoV-2 was studied within a range of 104–106 PFU mL−1. The MIP-NPs demonstrated good binding affinity (KD = 0.12 pM) and selectivity toward SARS-CoV-2. The AFM, cyclic voltammetry, and square-wave voltammetry studies revealed the successful stepwise preparation of the sensor. A cross-reactivity test confirmed the specificity of the sensor. For the first time, this study demonstrates the potential of molecular imprinting technology in conjunction with miniaturized SPR devices for the detection of SARS-CoV-2 particles with high-affinity and specificity. Such sensors could help monitor and manage the risks related to virus contamination and infections also beyond the current pandemic.

1. Introduction

The polymerase chain reaction (PCR) and enzyme-linked immunosorbent assay (ELISA) are traditional molecular-based tests for the detection of viruses [1,2]. These techniques are considered the gold standard, and their reliability and urgency are therefore undeniable; however, scientists are warning about the frequent occurrence of zoonoses-infectious diseases that jump from animals to humans. Hence, the risk of a new pandemic is higher than ever before [3]. Increasing population and high migration rates will aid the easy spread of infectious diseases. The high processing time (~3–4 h), cost, and limited availability of conventional diagnostics would delay the tests in a larger population, especially in developing nations. Clinal accuracy of a diagnostic method is the most important parameter to define its true sensitivity and specificity. As a consequence, nucleic acid-based tests (NATs) have been reported to have ~30% of false-negative results in patients with COVID-19 [4]. Advanced NAT-based detection methods such as loop-mediated isothermal amplification (LAMP) which certainly reduces the processing time (~1–2 h) and is 10 times more sensitive than PCR, but still require skilled personnel, complex laboratory setups, and are not yet commercialized on a large scale [5]. On the other hand, antibody tests for serological examinations are successful for symptomatic populations after 5 days after infection. The accuracy of antibody tests for people infected with COVID-19 varies at different times since the onset of first symptoms, which is 30% in the first week, increases to 70% after 2 weeks, and more than 90% in 3rd week [6]. This requires a detailed analysis of real samples at different times and regions to establish the standards for antibody tests. In an emergent situation such as a global pandemic, such a pathway for the development of standard diagnostic tools is not feasible, whereas readily available antigen-based tests could only tell the presence or absence of the infection; however, they cannot quantify the viral load and hence the progression of the disease. They are also decisive to discriminate against asymptomatic populations [7]. The production and purification of specific antibodies for these tests require animals and highly equipped laboratories which increase the overall cost of diagnostics. In addition, antigen-based tests need to undergo rigorous quality control; they have higher specificity but cannot detect all active infections and thus have higher chances of false negatives. However, due to their high specificity and fast result output, future research on the clinical performance of antigen testing is highly encouraging [8]. Additionally, a requirement for labels in almost all the existing detection methods further reduces the shelf life.
In the past, researchers have exploited other advanced techniques to address different drawbacks of NAT- and molecular-based detection methods. These techniques include electrochemical [9,10], quartz crystal microbalance (QCM) [11,12], surface acoustic waves (SAW) [13], surface plasmon resonance/imaging (SPR(i)) [14,15], optical fiber [16], and surface-enhanced Raman spectroscopy (SERS) [17] that have been developed for the detection of viral infections. Table 1 also lists the existing sensor methods for COVID-19 diagnosis. As research efforts are being put to develop cheap and easy-to-operate sensors yet highly specific and accurate, molecularly imprinted polymers (MIPs) are a promising replacement for natural recognition elements. The new generation of synthetic receptors has now been established for high sensitivity, affinity (similar to natural receptors), and specificity. Given their synthetic nature, MIPs are certainly cost-effective and do not require animals (or cells), and a sophisticated laboratory environment for their production. Their synthesis can also be easily scaled up when compared to antibodies [18].
The process of molecular imprinting involves the embossing of a template (target to be detected) by the polymer matrix, which is a mixture of functional monomers used to self-assemble and polymerize around the template in the presence of an initiator and a cross-linker. Once the polymerization is completed, the template is removed and left with a 3D spatial conformation of the polymer matrix with cavities which are complementary, not only in terms of shape and size of the target but it also provides corresponding specific interactions for the further rebinding of the target molecules. These interactions can be covalent or non-covalent depending upon the type of monomers opted for and the mode of synthesis used [30]. The long shelf life and lesser stringent conditions of storage offer high stability [31]. Very recently, two research groups have used MIP technology for the detection of SARS-CoV-2 [32,33]; however, no one has studied the detection of the whole virus, to the best of our knowledge. Nonetheless, replacing natural binding receptors with MIPs is not new [34,35] and our research group have already explored imprinting whole viruses with high binding affinity and reasonable specificity [14,36].
In this work, we studied the potential of synthetic antibodies for the detection of the whole SARS-CoV-2 virus using a label-free miniaturized SPR-based sensor for the first time. The MIPs were produced by an adapted chemical method [37] using glass beads as a solid support. Since glass is inherently an inert material, it can withstand harsh chemicals used in the synthesis of nanoMIPs. Additionally, the conjugation of biomolecules onto a glass surface is very well-established [38]. Dynamic light scattering (DLS), atomic force microscopy (AFM), and electrochemical techniques were used for the characterization of nanoMIPs in the solution environment as well as on the sensor surface. The nanoMIP immobilized sensor allowed for the detection of the SARS-CoV-2 virus with high sensitivity, specificity, and affinity.

2. Materials and Methods

2.1. Reagents and Chemicals

N-hydroxysuccinimide (NHS), 1-ethyl-3-(3-dimethylaminopropyl) carbodiimide (EDC), 11-mercaptoundecanoic acid (MUDA), phosphate buffered saline (PBS), N-tert-butylacrylamine (TBAm), N-isopropylacrylamide (NIPAm), N,N’ methylenebisacrylamide (BIS), N-(3-aminopropyl) methacrylamide (APM), acrylic acid (AAc), N’- tetramethylethylenediamine (TEMED), 3-aminopropyltrimethyloxysilane (APTMS), ammonium persulphate (APS), glutaraldehyde (GA), TWEEN 20 (polyoxyethylenesorbitan monolaurate), sodium acetate, ethanolamine, ethanol, acetone, anhydrous toluene, and isopropanol (IPA) were purchased from Sigma Aldrich (Steinheim, Germany). Double-distilled water produced by a Millipore Direct-Q 3 UV (Millipore, Taufkirchen, Germany) was used for the synthesis of the nanoMIPs and buffer preparation. Glass beads (∅100 μm) were bought from Carl Roth (Karlsruhe, Germany). Syringe filters (Rotilabo PTFE, 0.45 μm and 0.22 μm) were obtained from Carl Roth (Karlsruhe, Germany). All chemicals and solvents were of analytical or HPLC grade and were used without further purification. A phosphate-buffered saline +0.05% Tween (PBST) buffer was prepared and filtered with a 0.22 μm syringe filter.

2.2. Apparatus and Equipment

A miniaturized angular SPR device (CORGI IIF, Plasmetrix) was used to carry out virus-sensing assays. The device consisted of two flow channels of height: length: width of 250 μm:5 mm:1 mm, respectively. A peristaltic pump and microtubing arrangement were additionally installed. The flow channels were pressure sealed with the help of a gasket with a transparent window. Briefly, an incident wavelength of 650 nm was collimated and passed through a polarizer to obtain transverse magnetic (TM) polarization. The polarized light was then focused using a lens and coupled through a prism for the excitation of surface plasmon on the sensing surface (50 nm gold). A detailed description of the optical arrangement can be found elsewhere [39].
Gold-coated sensor chips (12.4 × 7 × 0.7 mm) of 50 nm thickness were obtained from Plasmetrix (Montreal, QC, Canada) and used for SPR assays, as well as AFM studies. Electrochemical surface characterization on gold wires was performed using a PalmSens4 compact electrochemical interface with a three-electrode system. Further, the AFM NanoWizard II (JPK Instruments AG., Berlin, Germany) was used to study the surface topography of different steps in the biosensor fabrication process. Size and Zeta potential were measured with a LitesizerTM 500 (Anton Paar, Baden-Württemberg, Germany).

2.3. Preparation of the Virus Culture

SARS-CoV-2 particles were prepared from passage 3 of an early 2020 SARS-CoV-2 B.1 outbreak isolate (BetaCoV/Germany/BavPat1/2020) propagated on Vero E6 cells. An appropriate BSL-3 facility was used to handle SARS-CoV-2. Briefly, VeroE6 (ATCC CRL-1586) cells were cultured in the minimal essential medium (MEM; PAN Biotech, Aidenbach, Germany) which was supplemented with 10% fetal bovine serum (PAN Biotech, Aidenbach, Germany), 100 IU mL−1 penicillin G, and 100 µg mL−1 streptomycin (Carl Roth, Karlsruhe, Germany). After 48 h of infecting the Vero E6 cells, virus particles were harvested. To this end, two infected T-175 cell culture flasks were frozen at −80 °C and thawed to obtain a total volume of 50 mL crude lysate. This lysate was centrifuged for 10 min at 4 °C to remove any cellular debris, and then the virus particles in the supernatant were subsequently inactivated by a 24 h incubation period in 4% formaldehyde at room temperature and exported from the BSL-3 lab for further purification.
Further plaque forming units (pfu) were determined by growing Vero E6 cells in 12-well plates infected with 100 µL of serial 10-fold virus dilutions. The viral inoculum was removed after 1 h of incubation, and cells were overlaid with EMEM 2X containing 1.5% microcrystalline cellulose (Vivapur MCG, JRS Pharma, Patterson, NY, USA). Post 48 h of infection, the cells were fixed with 4% formalin. A 0.75% methylenblue solution was used to stain the wells and then they were washed with PBS to remove the residual stain. Plaques were then counted in an appropriate dilution to calculate virus titers in the inoculum.
Inactivated virus stock was further centrifuged at 1000× g for 10 min to remove residual cell debris and the obtained supernatant was filtered through a 0.45 μm syringe filter. The density centrifugation method was used to purify the virus particles. Briefly, 20% w/w sucrose in sterile PBS was injected into inactivated virus stock, ensuring the sucrose settled at the bottom of the falcon tube. After proper balancing, the stock was centrifuged at 133.900 rcf (SW 32 Ti, Beckman Coulter, Brea, CA, USA) for 2 h at 4 °C to obtain virus particles cushioned with sucrose at the bottom of the falcon tube. Further, for solvent exchange, a semi-permeable membrane of MWCO-6–8 kDa (Maxi-dialysis tube, Sigma, Steinheim, Germany) was used against sterile PBS at 4 °C for 3–4 days (replaced with fresh PBS each day) under constant stirring. The obtained stock in the PBS was used for nanoMIP synthesis and sensing assays.

2.4. Synthesis of the NanoMIPs

2.4.1. Derivatization of Glass Beads

The salinization of glass beads for solid-phase synthesis was performed in order to covalently attach virus particles on their surface. Firstly, 60 g of glass beads were activated by boiling (~130 °C) in 40 mL of 2 M NaOH for 15 min. The beads were then washed six times with an excess of double-distilled water to bring the pH to 7.5 before completely drying them with nitrogen. The glass beads were salinized using 24 mL of 2% v/v solution of APTMS in anhydrous toluene overnight under a nitrogen atmosphere. After the beads were washed eight times with 30 mL of acetone under vacuum and dried, they were activated with a 7% v/v glutaraldehyde solution in PBS (pH 7.4, filtered using 0.22 μm syringe filter) for 2 h.
Further, the beads were rinsed with double-distilled water and incubated for the conjugation of the template (SARS-CoV-2) overnight at 4 °C, where 4 mL of the template was used in 25 mL of the PBS. The beads were taken out for rinsing and drying the following day under a vacuum. To prevent non-specific interactions and self-coupling of unconjugated (or free) reactive glutaraldehyde, the beads were incubated in 50 mL of 0.1 M ethanolamine in PBS for 15 min. Afterward, the beads were washed and rinsed for the final time and stored in the fridge for nanoMIP synthesis.

2.4.2. NanoMIP Synthesis and Yield Calculation

The synthesis procedure of SARS-CoV-2-specific MIP receptors (Figure 1) was adapted from the article by Altintas et al. [14]. SARS-CoV-2 conjugated glass beads were used for the formation of a specific polymer matrix. Briefly, 39 mg NIPAm, 2 mg BIS, 54 mg N-(3-aminopropyl) methylacrlamide hydrochloride, and 2.2 μL acrylic acid were added in 98 mL of double-distilled water in a double-neck flask. Subsequently, 33 mg of N-tert-butylacrylamide and methacryloxyethyl thiol carbamoyl rhodamine B were separately dissolved in 1 mL of absolute ethanol prior to the addition of the above mixture. This concoction was sonicated for 30 min to ensure uniform mixing. Nitrogen purging was performed for 30 min to maintain an inert atmosphere and prevent possible environmental contamination. The polymerization was then initiated by injecting APS (initially dissolved in 800 μL doubled-distilled water) and 24 μL TEMED for 2 h at room temperature. The mixture was decanted, and beads were washed five times with double-distilled water at 15 °C to remove the partially or wholly unpolymerized mixture. Specific MIP nanoparticles were eluted by passing six fractions of double-distilled water through the column with frit at 70 °C. The harvested MIP receptors were freeze-dried for 2 days. The obtained yield was quantified by first accurately measuring a clean glass vial three times. An amount of 5 mL of the MIP dispersion in ultra-pure water (MilliQ, 50 nm filtered) was transferred into the vial and left to freeze dry again. Once the water was completely sublimated, the vial was weighed again to finally subtract from the weight of the empty vial measured prior. The obtained yield was set to a concentration of 1 mg mL−1 with ultra-pure water, which was sonicated for 30 min and filtered using a 0.45 μm syringe filter for further characterization and virus sensing assays.

2.5. Characterization of NanoMIPs

The hydrodynamic radius of nanoMIPs was determined by DLS using LitesizerTM 500 (Anton Paar, Baden-Württemberg, Germany). The stability of the nanoparticles in water was established by analyzing the zeta potential using the same instrument.
The nanoMIPs were also visualized on the sensor chip surface by employing AFM under tapping mode (intermediate contact). The stock solution of nanoMIPs in ultra-pure water was diluted, and 10 μL of the solution was drop cast on a cleaned silicon wafer. The drop was left to air-dry and observed under AFM NanoWizard II (JPK Instruments AG., Berlin, Germany) at different scales. The nanoMIP sensor fabrication steps were also characterized using the AFM to visualize changes in the surface topography from bare chip surface to virus binding.
In addition, two primary electrochemical techniques (CV and SWV) were employed to confirm the successful construction of the nanoMIP sensor. For this, the gold substrate was used as a working electrode in the electrochemical measurement setup [40].

2.6. SARS-CoV-2 Virus Detection Assay

The gold sensor chips were initially sonicated in IPA followed by sonication in double-distilled water for 10 min each and then dried with a gentle blow of nitrogen. The chips were covered with piranha solution (3:1 H2SO4:H2O2) in a glass petri dish for 15 min under the fume hood. After that, the reaction was stopped with excess double-distilled water, and chips were rinsed thoroughly. Sensor chips were dried with nitrogen prior to further use. Once the chip cleaning and preparation processes were completed, they were equilibrated with absolute ethanol for 15 min and transferred to a 20 mM solution of 1-mercaptoundecanoic acid (MUDA) in absolute ethanol overnight to form a self-assembled monolayer (SAM) on the surface. The dish was sealed with parafilm to prevent interference from air and dust. After incubation, the chips were washed with excess absolute ethanol, followed by rinsing with double-distilled water and dried with nitrogen gas. The MUDA-coated chips could be stored at 4 °C for up to a week. All the buffers for SPR experiments were prepared using double-distilled water, filtered with a 0.22 μm syringe filter, and degassed before use. The flow rate was maintained at 5 μL min−1 using a peristaltic pump (Ismatec Reglo ICC Digital pump, 2-channel, Cole-Parmer GmbH). The buffers were switched manually using reservoirs from Elveflow (Paris, France). To immobilize nanoMIPs, MUDA-coated chips were activated with a 6 min injection of a freshly prepared EDC/NHS solution (0.4 M EDC, 0.1 M NHS) for amine coupling with nanoMIPs. Before the injection of nanoMIPs, NHS ester was stabilized using sodium acetate buffer (10 mM, pH 4.5) for 2 min. After the nanoMIPs immobilization, any available remaining binding sites were blocked with a 4 min injection of 1 M ethanolamine. Figure 2 shows the major steps involved in sensor fabrication and virus detection. Virus samples were prepared in PBST to facilitate the flow through micro tubing and sensor channels and prevent air from becoming trapped inside the microfluidics. The association time was kept for 12 min and dissociation was maintained for 4 min. Cross-reactivity assays were conducted using human adenovirus (HAdV), which is quite similar to SARS-CoV-2 in terms of size and shape.

3. Results and Discussion

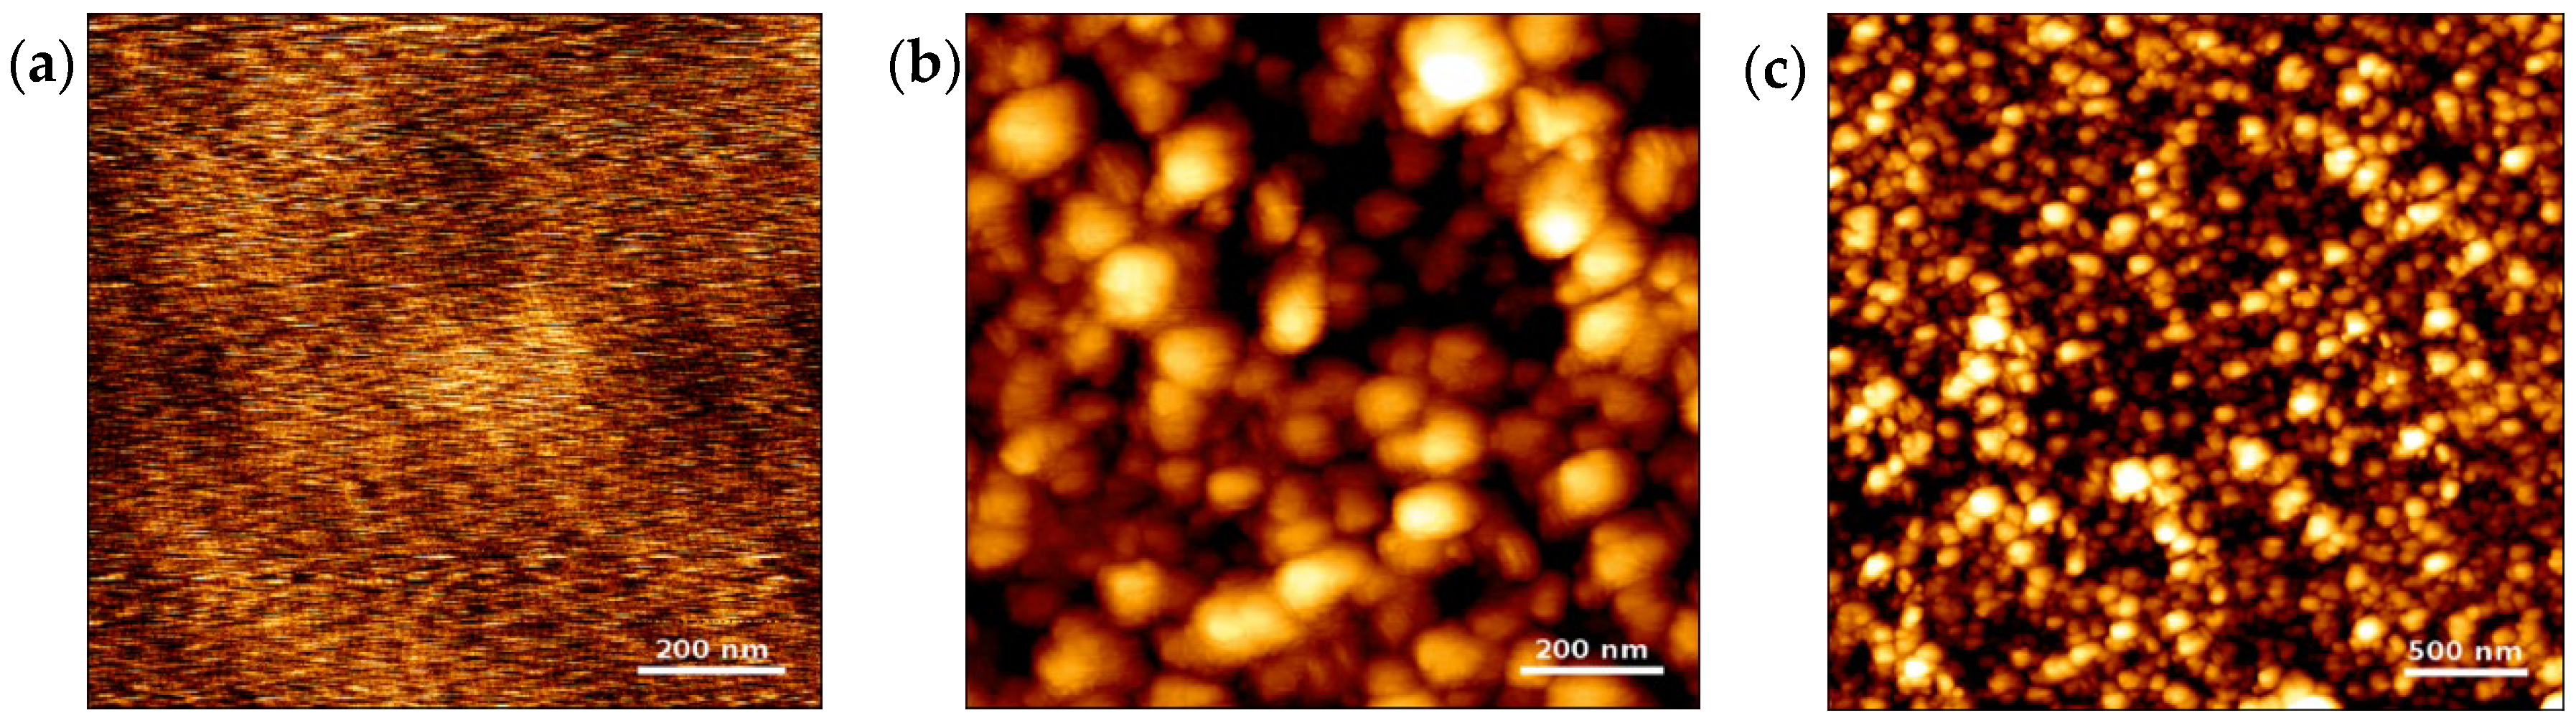
3.1. Size and Stability of NanoMIPs

The nanoMIPs obtained after synthesis were characterized using the DLS method to check the uniformity, quality, and size of the MIPs. This technique measures the Brownian motion and relates this to the hydrodynamic size of the particle. The size of the nanoMIPs was measured in ultra-pure MilliQ water and at constant room temperature (25 °C). The backscattered mode was used to carry out 60 runs for each recording. The average hydrodynamic radius of the SARS-CoV-2 nanoMIPs was found to be 94.64 ± 2.34 nm with the polydispersity index (PDI) of 0.257, indicating highly monodisperse and uniform polymer particles in the solution (Figure 3a,b). Zeta potential was also measured in ultrapure water (Omega cuvette Z Mat. No. 189417) to determine the stability of the colloidal solution. The average zeta potential of the nanoparticles was determined as −24.79 ± 1.23 mV with 0.21 mS/cm conductivity (Figure 3c).

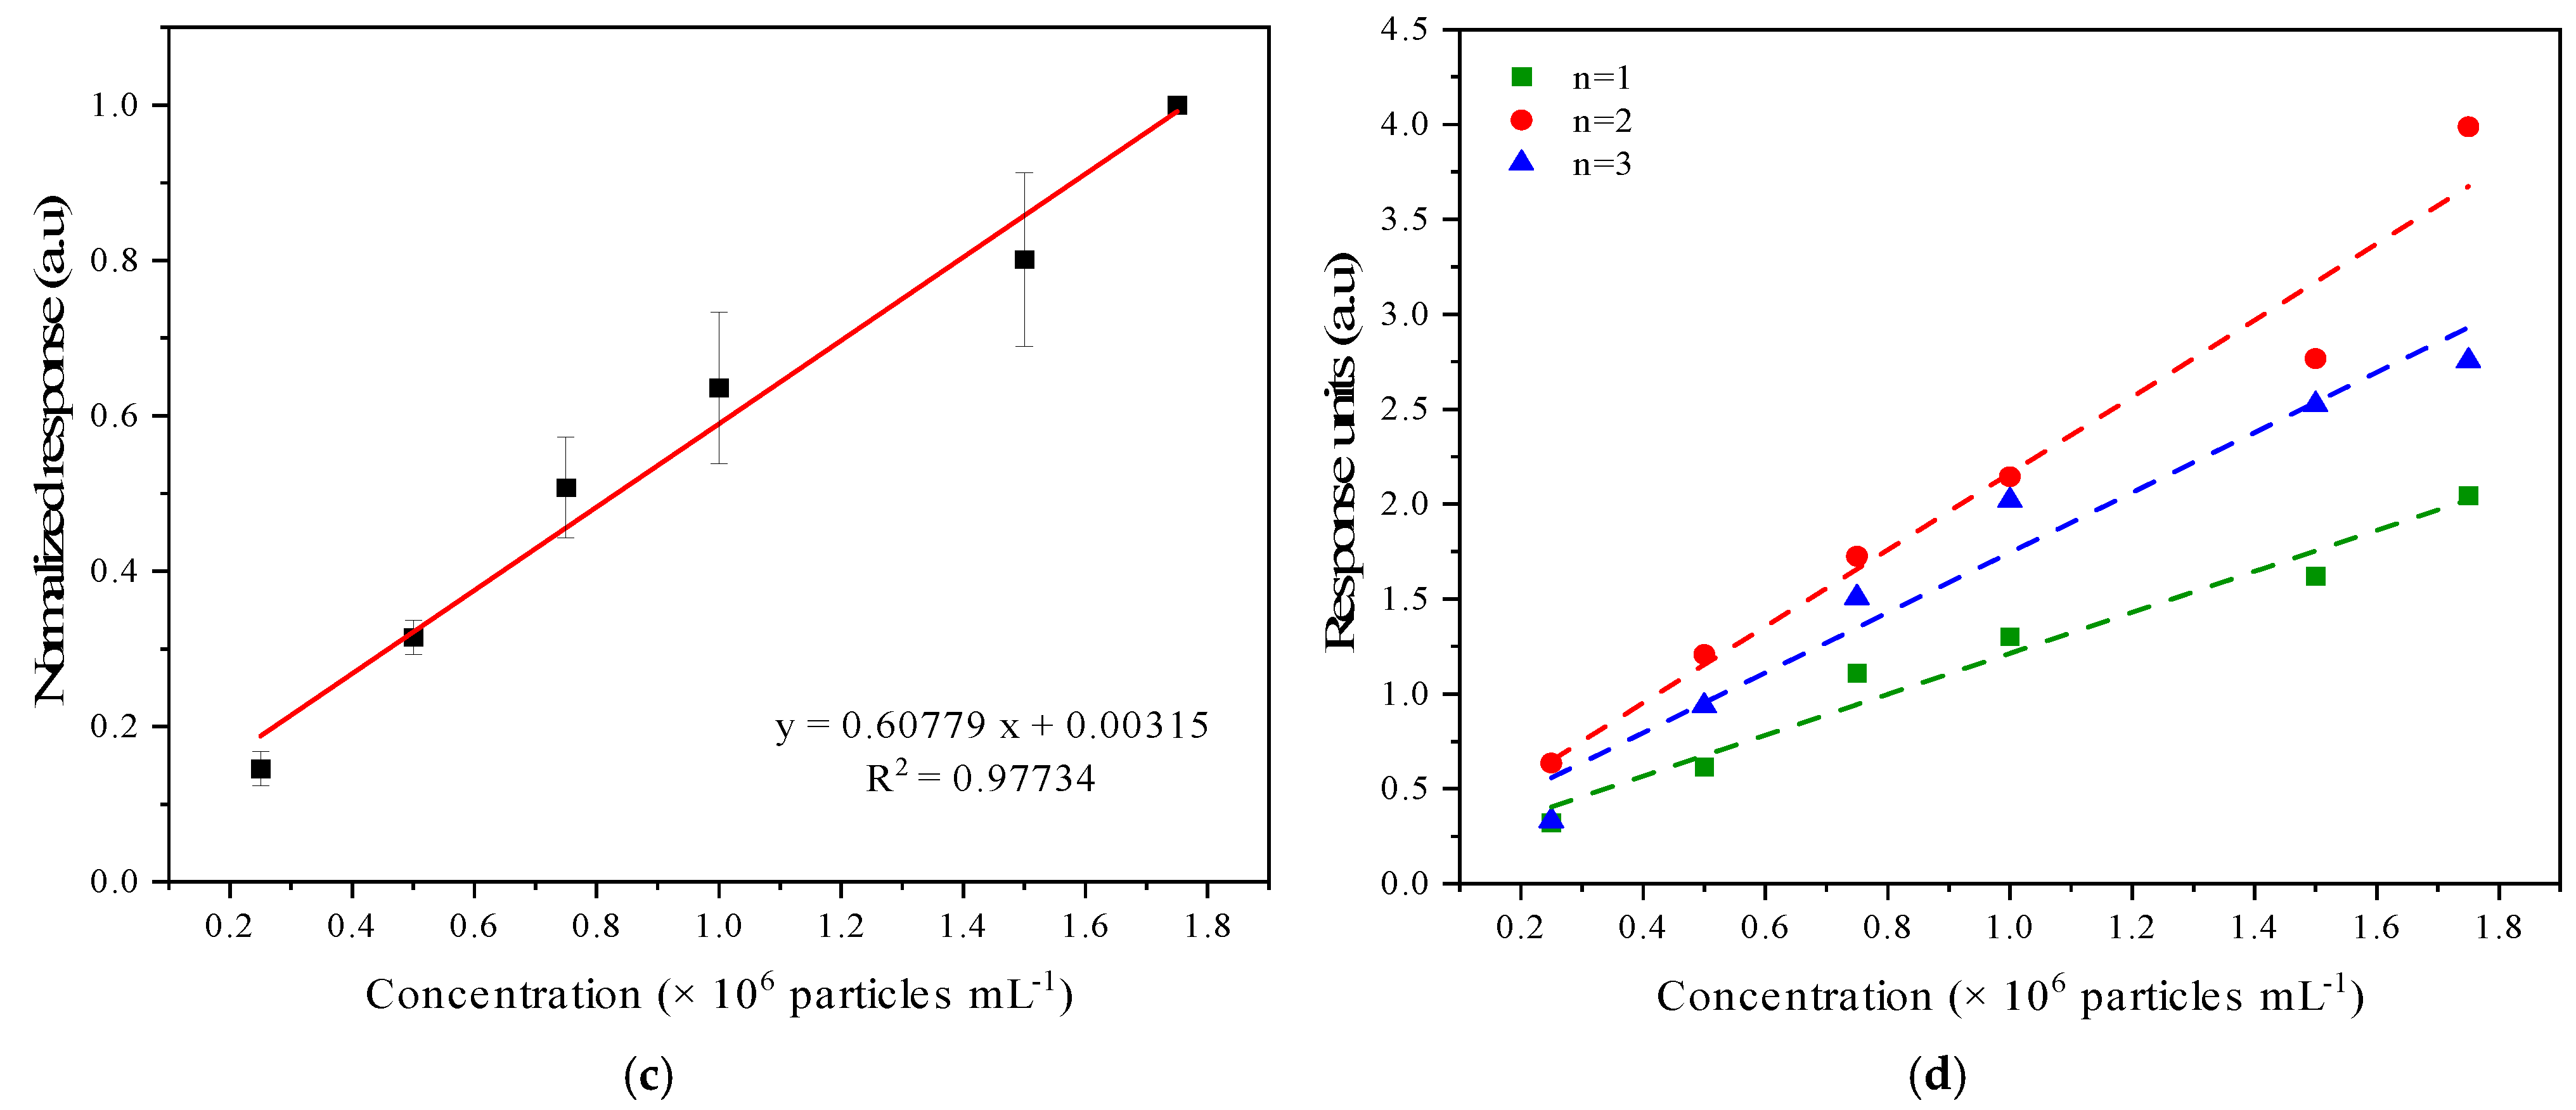
3.2. SARS-CoV-2 Virus Assay

High affinity and sensitivity are the main effect factors for the nanoMIP-based SPR sensors. The ideal assay type in an SPR sensor is direct assay, where the surface receptor can efficiently capture the analyte without any signal amplification agents or labels; however, this heavily depends on enough affinity between a MIP receptor and its analyte. The size of the analyte also matters a lot when it comes to SPR sensors. It is hard to detect small analytes with high sensitivity using a direct-assay strategy. The selection of a suitable surface chemistry, as well as the quality of the gold layer on the sensor chip surface, is also critical matters to consider for avoiding chip-to-chip variation in sensor signal. In the current work, the affinity of the MIPs was found to be high towards the virus of interest and the size of the analyte is large enough to achieve good sensitivity using a direct assay. Ionic concentration and pH of several buffers used during each step of immobilization are also important factors to ensure uniform and high-density coverage of the nanoMIPs which also influence the level of non-specific bindings or fouling of the SPR sensor surface. Therefore, a careful screening of the immobilization buffers and the use of appropriate surface chemistry were achieved in this work, and SARS-CoV-2-specific nanoMIP receptors were then immobilized onto an SPR-based biosensor to investigate the binding affinity, sensitivity, and specificity. Amine coupling chemistry was utilized on carboxylic-terminated alkane-thiol. First, MUDA was allowed to form an Au-S covalent bond on the SPR gold chip. The mixture of EDC/NHS was then used to activate and form intermediate NHS-ester to couple with primary amine groups strategically made available to nanoMIP receptors during synthesis [14]. An amount of 100 µg mL−1 of nanoMIPs were allowed to immobilize for 10 min at a slow flow rate to ensure full coverage of the sensor chip surface.
A change of 10−4 SPR refractive index units (RIUs) was observed after the nanoMIP immobilization (Figure 4a). The units were consistent over three different gold chips, indicating good reproducibility of the immobilization protocol. Further, the virus samples were prepared in the PBST in a linear range (0.25–1.75 × 10⁶ particles mL−1). An amount of 100 µL of each concentration was injected into the analyte channel at a flow rate of 5 µL min−1. The total detection time for screening one virus sample was less than 20 min. A sensogram of the cumulative binding assay with association and dissociation times of 12 min and 4 min, respectively, are shown in Figure 4b. A calibration curve with the linear fit was plotted from the normalized SPR response after each PBST wash (Figure 4c) to obtain the limit of detection. Considering the variable noise level of the SPR signal from Figure 4c, the limit of detection is estimated (noise divided by sensitivity (slope)) to be in the range depending on the concentration range: LOD = (0.1‒3.61) × 105 particles in 1 mL, and therefore the LOQ is equal to (0.33‒1.0) × 106 particles in 1 mL.
According to Figure 4c, the sensor is linear within the range of concentrations until nearly 2 million particles per mL, however, it is not saturating, and so it is most likely the dynamic range is even much higher. Due to the fact that the required amount of microfluidics can be as low as 1 µL, one should be able to detect the minimum number of a few hundreds of particles. Since the virus assay was performed in a cumulative binding format, a saturation of bulk-refractive index changes and slowdown of the association rate could be observed at high concentrations of the virus at the current immobilization density of nanoMIPs (Figure 4b).
Of note, the slightly high relative standard deviation of overall sensor data in Figure 4c must be attributed to the batch-to-batch variation in sensor chip production that in turn affects the limiting penetration depth offered by the gold sensor (~200 nm). The results of the bioassays obtained on individual sensor chip surfaces confirm this fact (Figure 4d); however, with further optimization of the sensor chip production for such a portable device, this concern could be fully addressed. On the other hand, it is worth mentioning that the variations obtained are at higher concentrations and are far away from the detection limit of the sensor. Therefore, this case would not hinder the measurement capability of the sensor for real cases.
Since 1000–100,000 RNA copies mL−1 are required to cause the SARS-CoV-2 infection, where 1 RNA copy is assumed to be equivalent to 1 virion particle, the LOD of the current sensor lies in the range of concentration and thus causing the infection. Additionally, according to a report, only 43% of PCR-confirmed positive SARS-CoV-2 cases could be detected by rapid antigen lateral flow devices (LFDs) [41]. Congruently, our sensor can perform better than LFDs for the viral loads above ~104 virion particles and can better deal with false negatives. The important features of portable/miniaturized sensors for a COVID-19 diagnosis reported in the literature are listed in Table 2. The methods mainly include electrochemical and field-effect transistor-based detection techniques for the determination of certain parts of SARS-CoV-2 viruses (e.g., spike and nucleocapsid proteins and genes, and genomic RNA). Of note, the current work brings a portable sensor and molecular imprinting technology together for the detection of the whole virus detection for the first time (Table 2). Moreover, it is also reporting on a novel SPR method that allows for efficient sensing performance with high affinity, sensitivity, and specificity.
SPR-based sensors are highly sensitive (10−7 RIU), meaning that even a small local fluctuation in temperature can misread the change in the refractive index. Additionally, it is also very responsive to flow rates and bulk refractive index changes, which usually introduce noise in the measurements. Both limitations can be addressed by incorporating effective heat sinks during instrumentation and by developing smart algorithms, respectively. Presently, we have not investigated the interference caused by miscellaneous non-specific binders such as cells, proteins, sugars, and other biomolecules likely to be present in a real sample. A diligent sample preparation may overcome the possible interference from non-specific binders in the future. In addition, the establishment of a suitable regeneration protocol would be useful for future applications to make the sensor even more user-friendly and cost-effective.
It is also worth mentioning the application scenarios of the nanoMIP assay for the SARS-CoV-2 virus. NanoMIP-based assays can withstand fluctuating temperatures due to high thermal stability of nanoMIPs in comparison to other bio-recognition receptors such as antibodies and synthetically designed aptamers. Therefore, such a sensing assay is very suitable for real-life sensors. To further enhance the performance of this assay for SARS-CoV-2 detection, the functional groups of nanoMIPs can be easily modified and they can be adopted in a variety of sensors, for example, lateral flow assays (LFA), and screen-printed electrodes for electrochemical-based sensing. The developed assay can also be easily combined with different nanomaterials (such as graphene, metal nanoparticles, and quantum dots) to enhance the sensor sensitivity towards SARS-CoV-2.

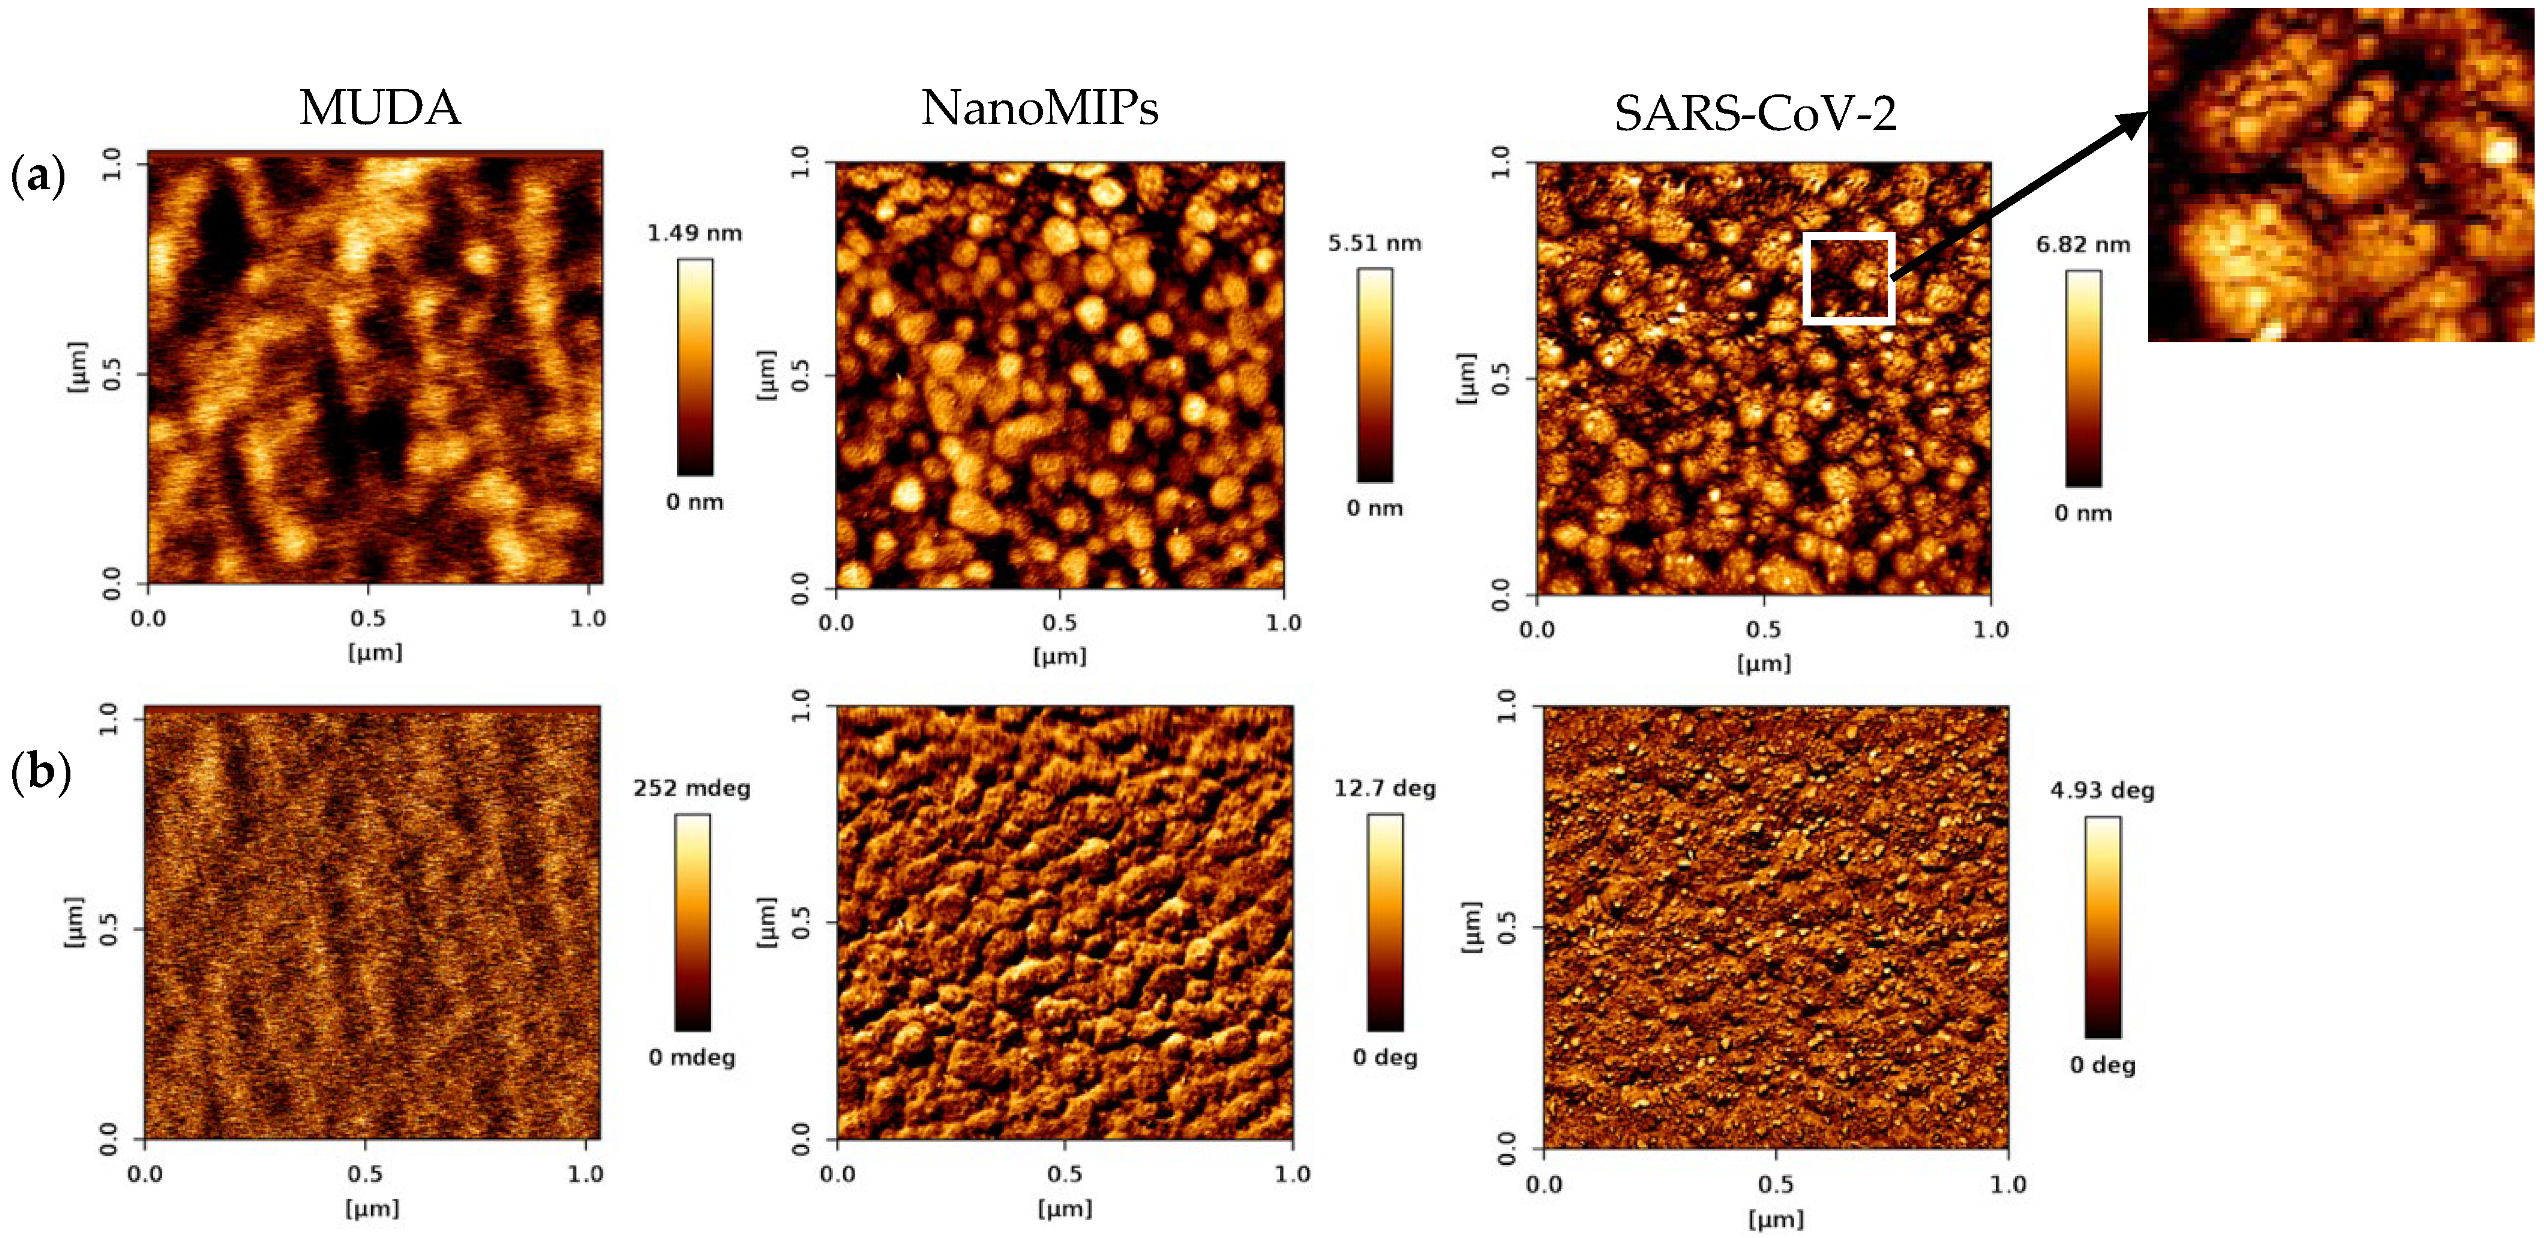
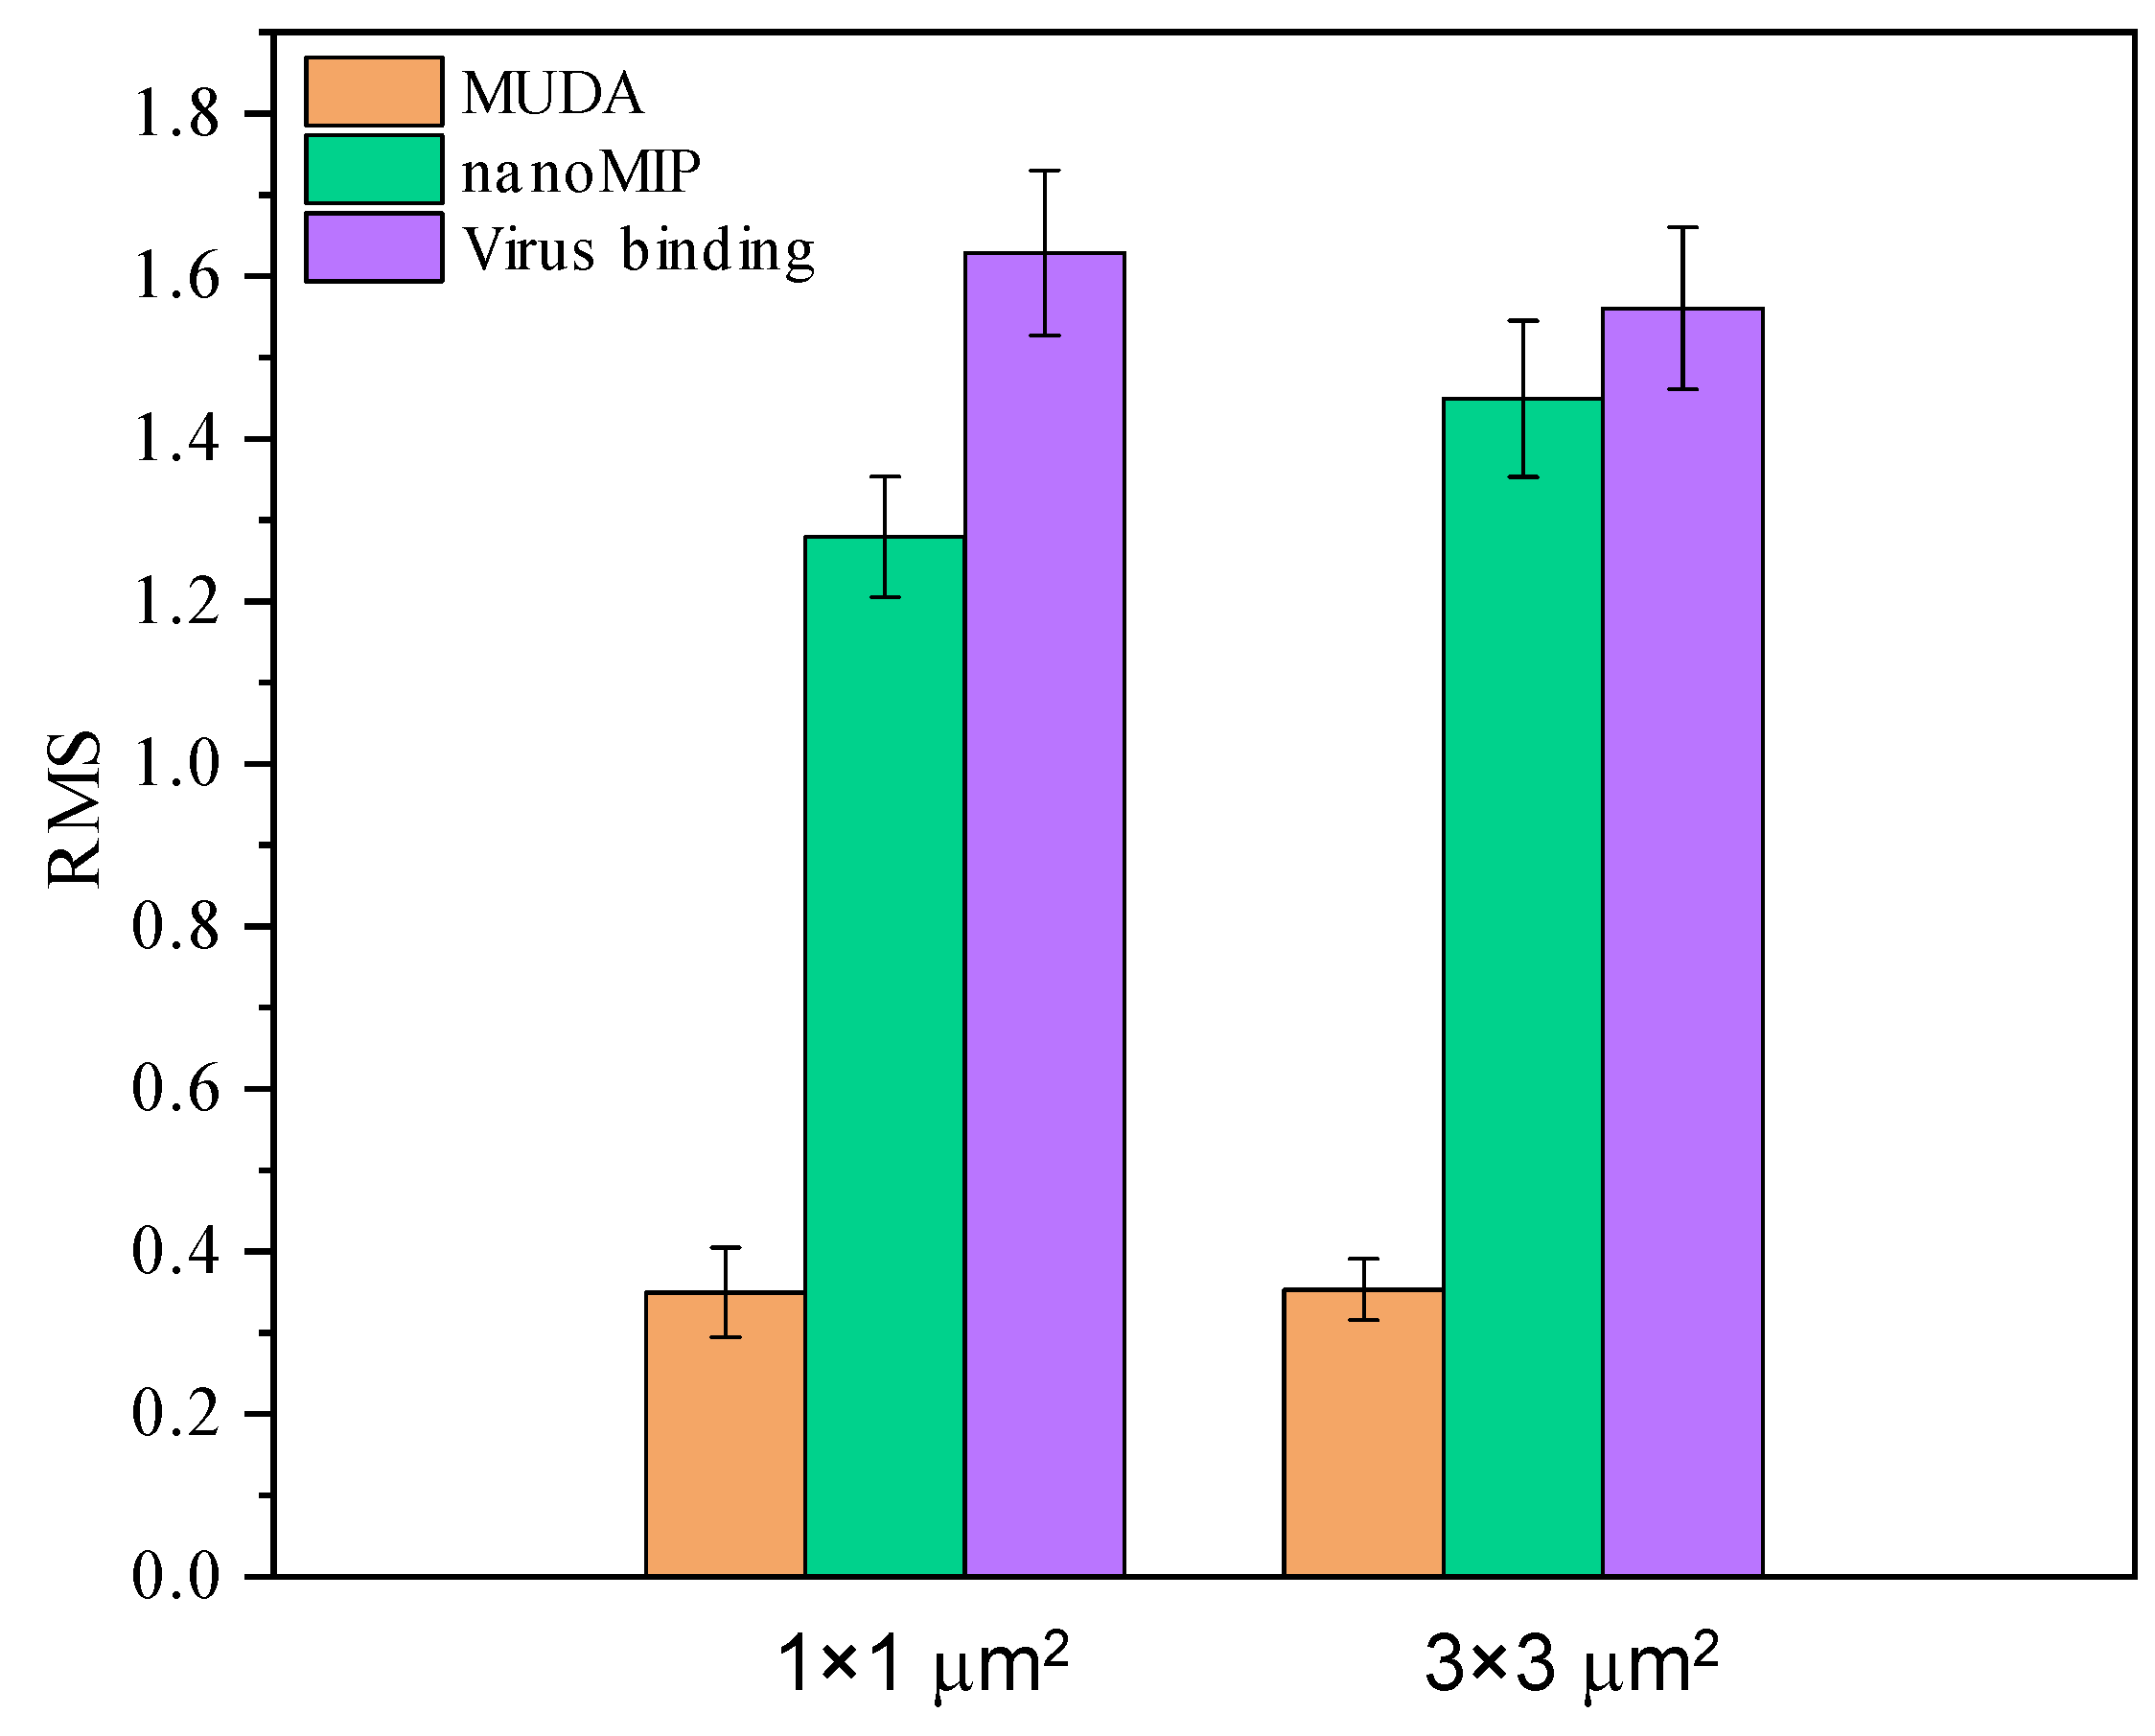
3.3. AFM Characterization of NanoMIP Sensor

Highly diluted nanoMIPs were drop casted on a cleaned silicon wafer. The observed nanoparticles were uniform and monodispersed and thus in good agreement with the DLS results (Figure 5). The 2D height image of the nanoMIPs with a 200 nm scale bar has uncovered the uniform size of particles slightly less than 100 nm (Figure 5b). Moreover, the surface topography and root-mean-square (RMS) roughness were investigated for sequential steps involved in nanoMIP immobilization and SARS-CoV-2 binding. Small pieces of the SPR gold chip were prepared in equal sizes and nanoMIPs were immobilized on cleaned chips using the same protocol mentioned in Section 2.5, under static conditions.
Figure 6a shows the homogenous binding of uniformly distributed nanoMIPs on a nearly smooth MUDA surface. Upon the binding of SARS-CoV-2, the local roughness of each nanoparticle increased, as shown in the zoomed section of the SARS-CoV-2 binding. Additionally, the AFM phase profiles were also retrieved as shown in Figure 6b. It is evident from the phase images that the texture of the surface varied considerably upon nanoMIP immobilization onto the activated self-assembled monolayer surface. A clear distinction of structural edges could be further comprehended after the binding of SARS-CoV-2 onto the nanoMIP-SPR sensor.
Moreover, the average RMS roughness of line sections taken from 10 different locations increased significantly with each step (Figure 7), which confirms the adsorption of the material.

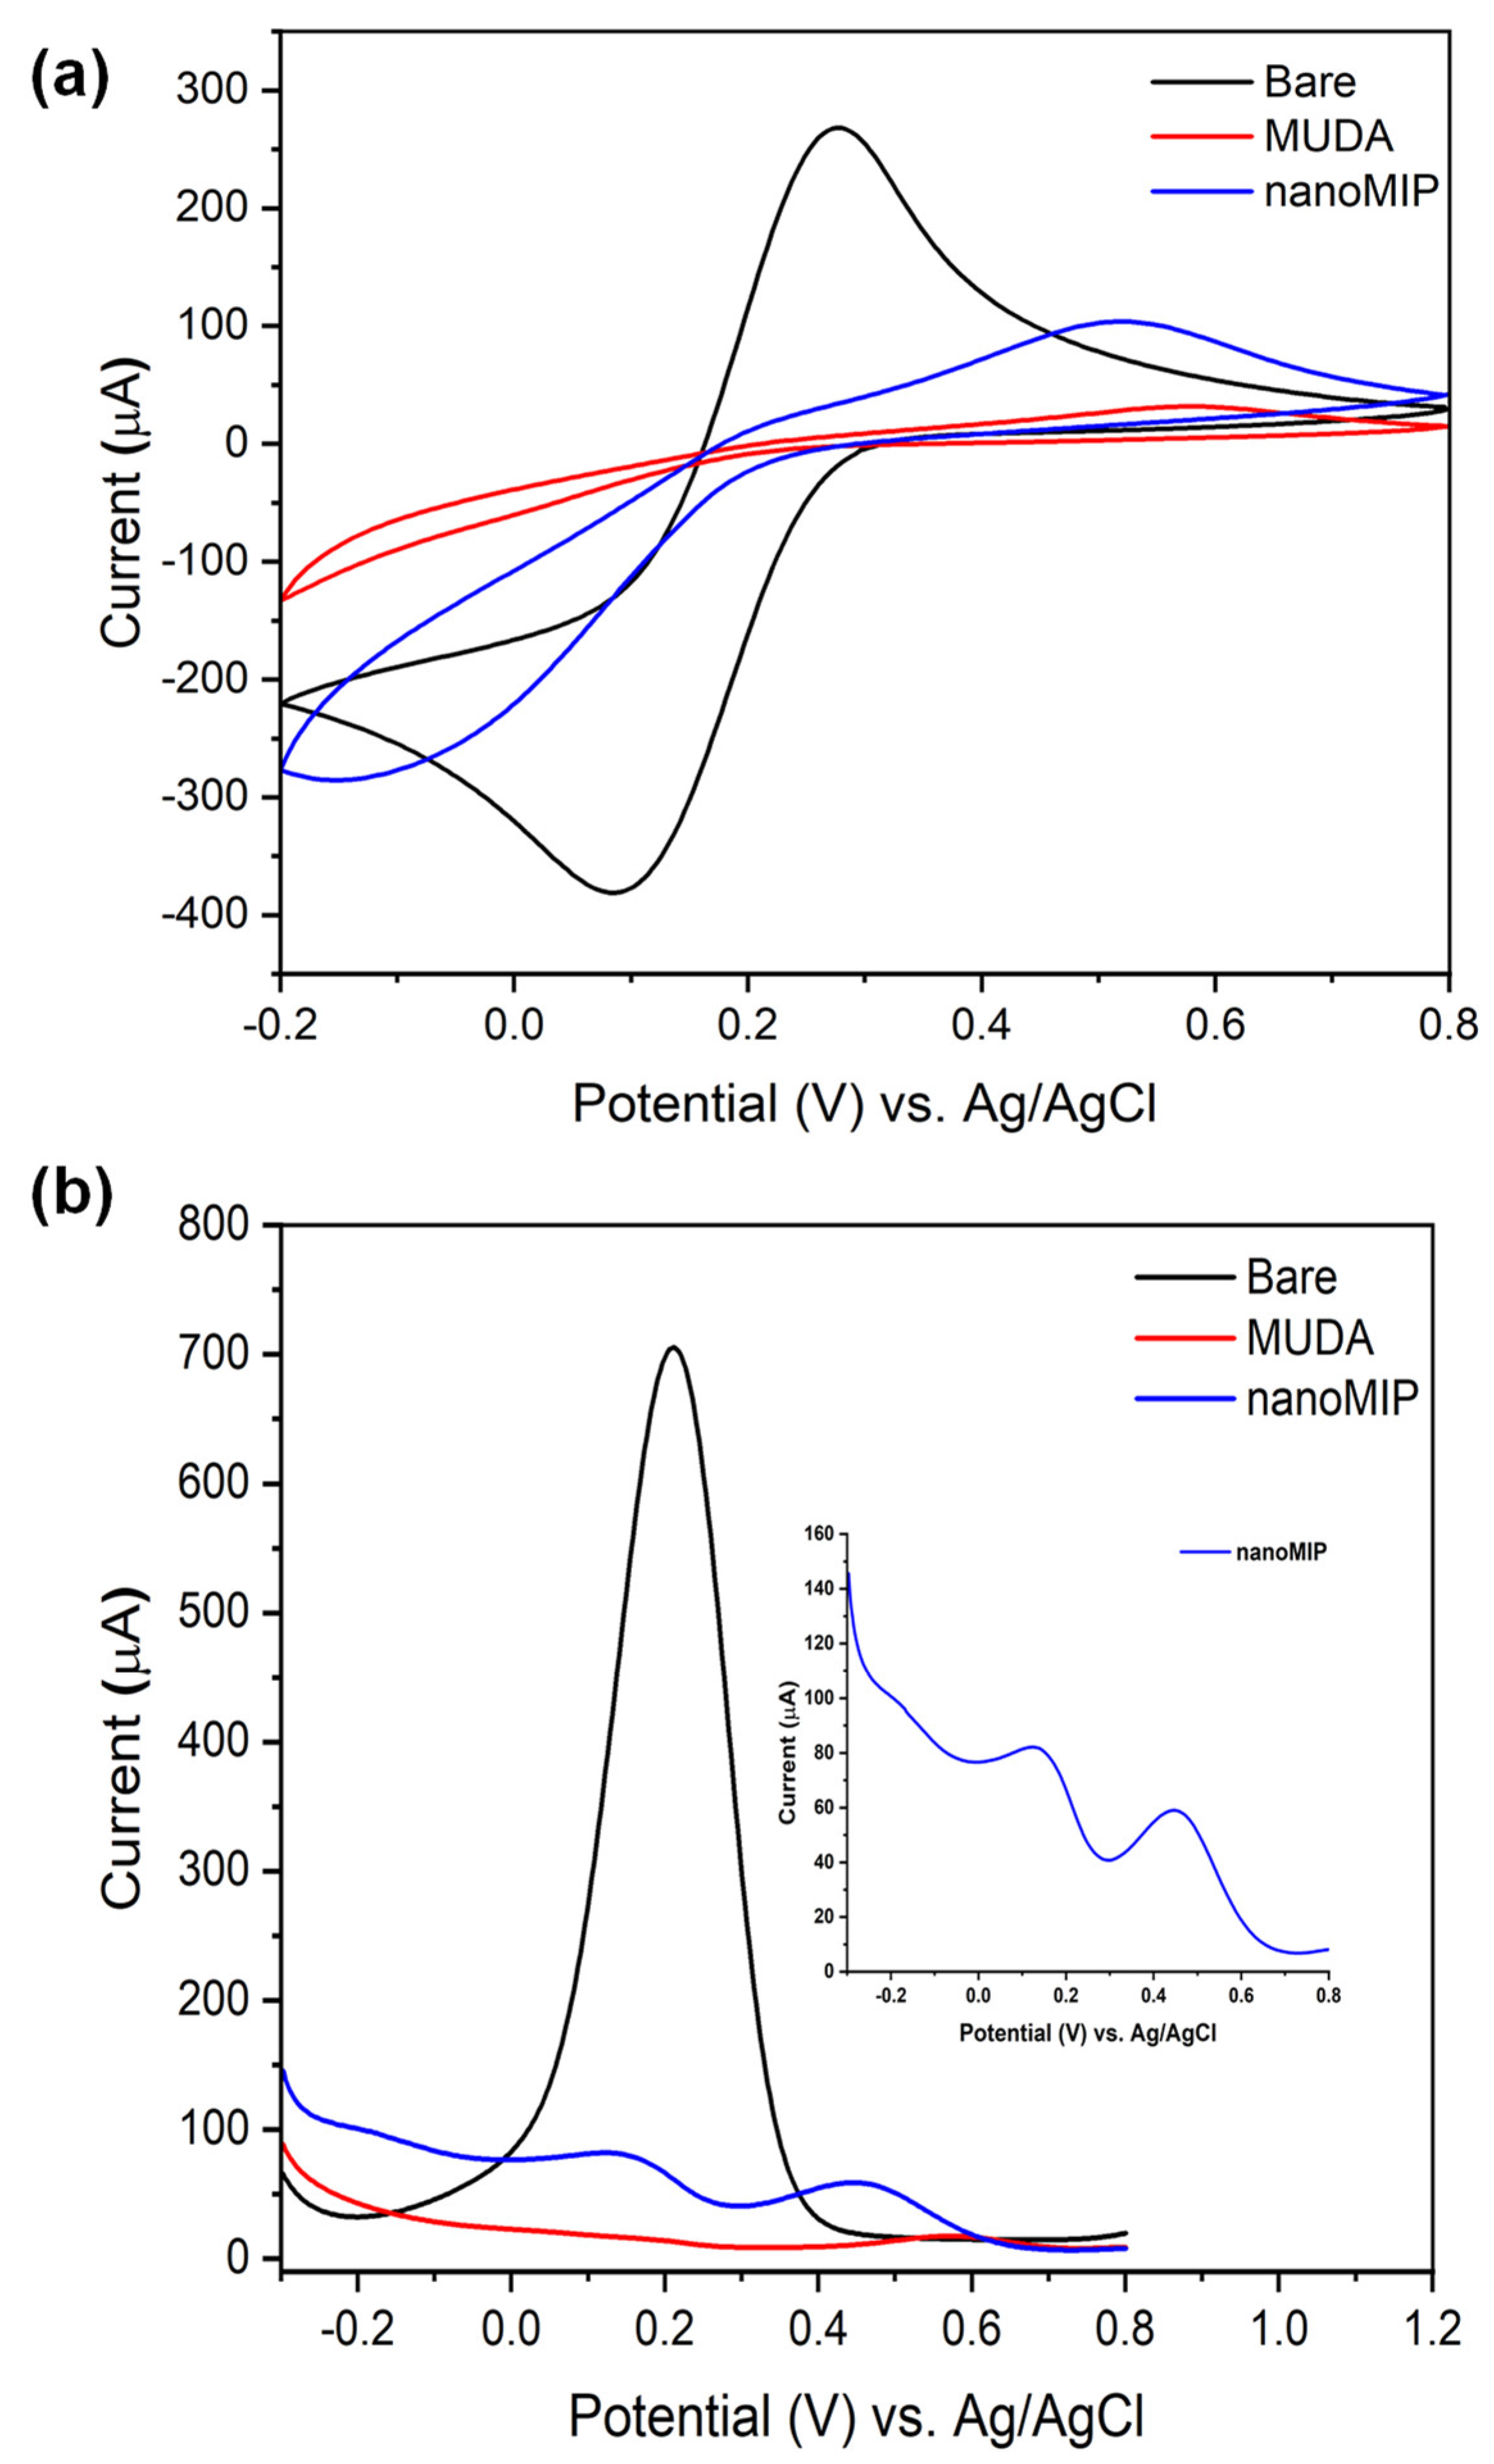
3.4. Electrochemical Characterization of NanoMIP Sensor

Cyclic voltammetry (CV) and square-wave voltammetry (SWV) are versatile and well-established electrochemical analytical tools used to study surface modification at a working electrode (Au). The three-electrode system of the counter electrode (CE), reference electrode (RE), and the working electrode (WE) of Pt, Ag/AgCl, and Au, respectively, were utilized for the electrochemical characterization of the nanoMIP-SPR sensor [49]. The sensor preparation steps, from bare gold surface to nanoMIP immobilization, were characterized using CV and SWV by immersing the gold electrode in a redox marker solution (10 mM K3Fe (CN6) in 0.1 M KCl). The current output correlates with the degree of surface coating and nanoMIPs immobilized on the gold surface, where a bare electrode surface can freely involve itself in the electron exchange process, depicted as the maximum positive peak, and reduce it, illustrated by the maximum negative peak, whereas a fully covered surface cannot produce current due to the lack of free electrons on the surface. However, Figure 8a showed a shift in redox peaks with an increase in current upon the binding of nanoMIPs. This was further confirmed with SWV measurements, where an increase in current was seen after achieving ~96% suppression from the MUDA self-assembly (Figure 8b). A shift and the presence of two peaks in SWV suggested that the current is originating from different electro-active species. Since nanoMIPs are negatively charged, as indicated by zeta potential (Figure 3c), their participation in electrochemical-assisted electron exchange may confirm their binding.

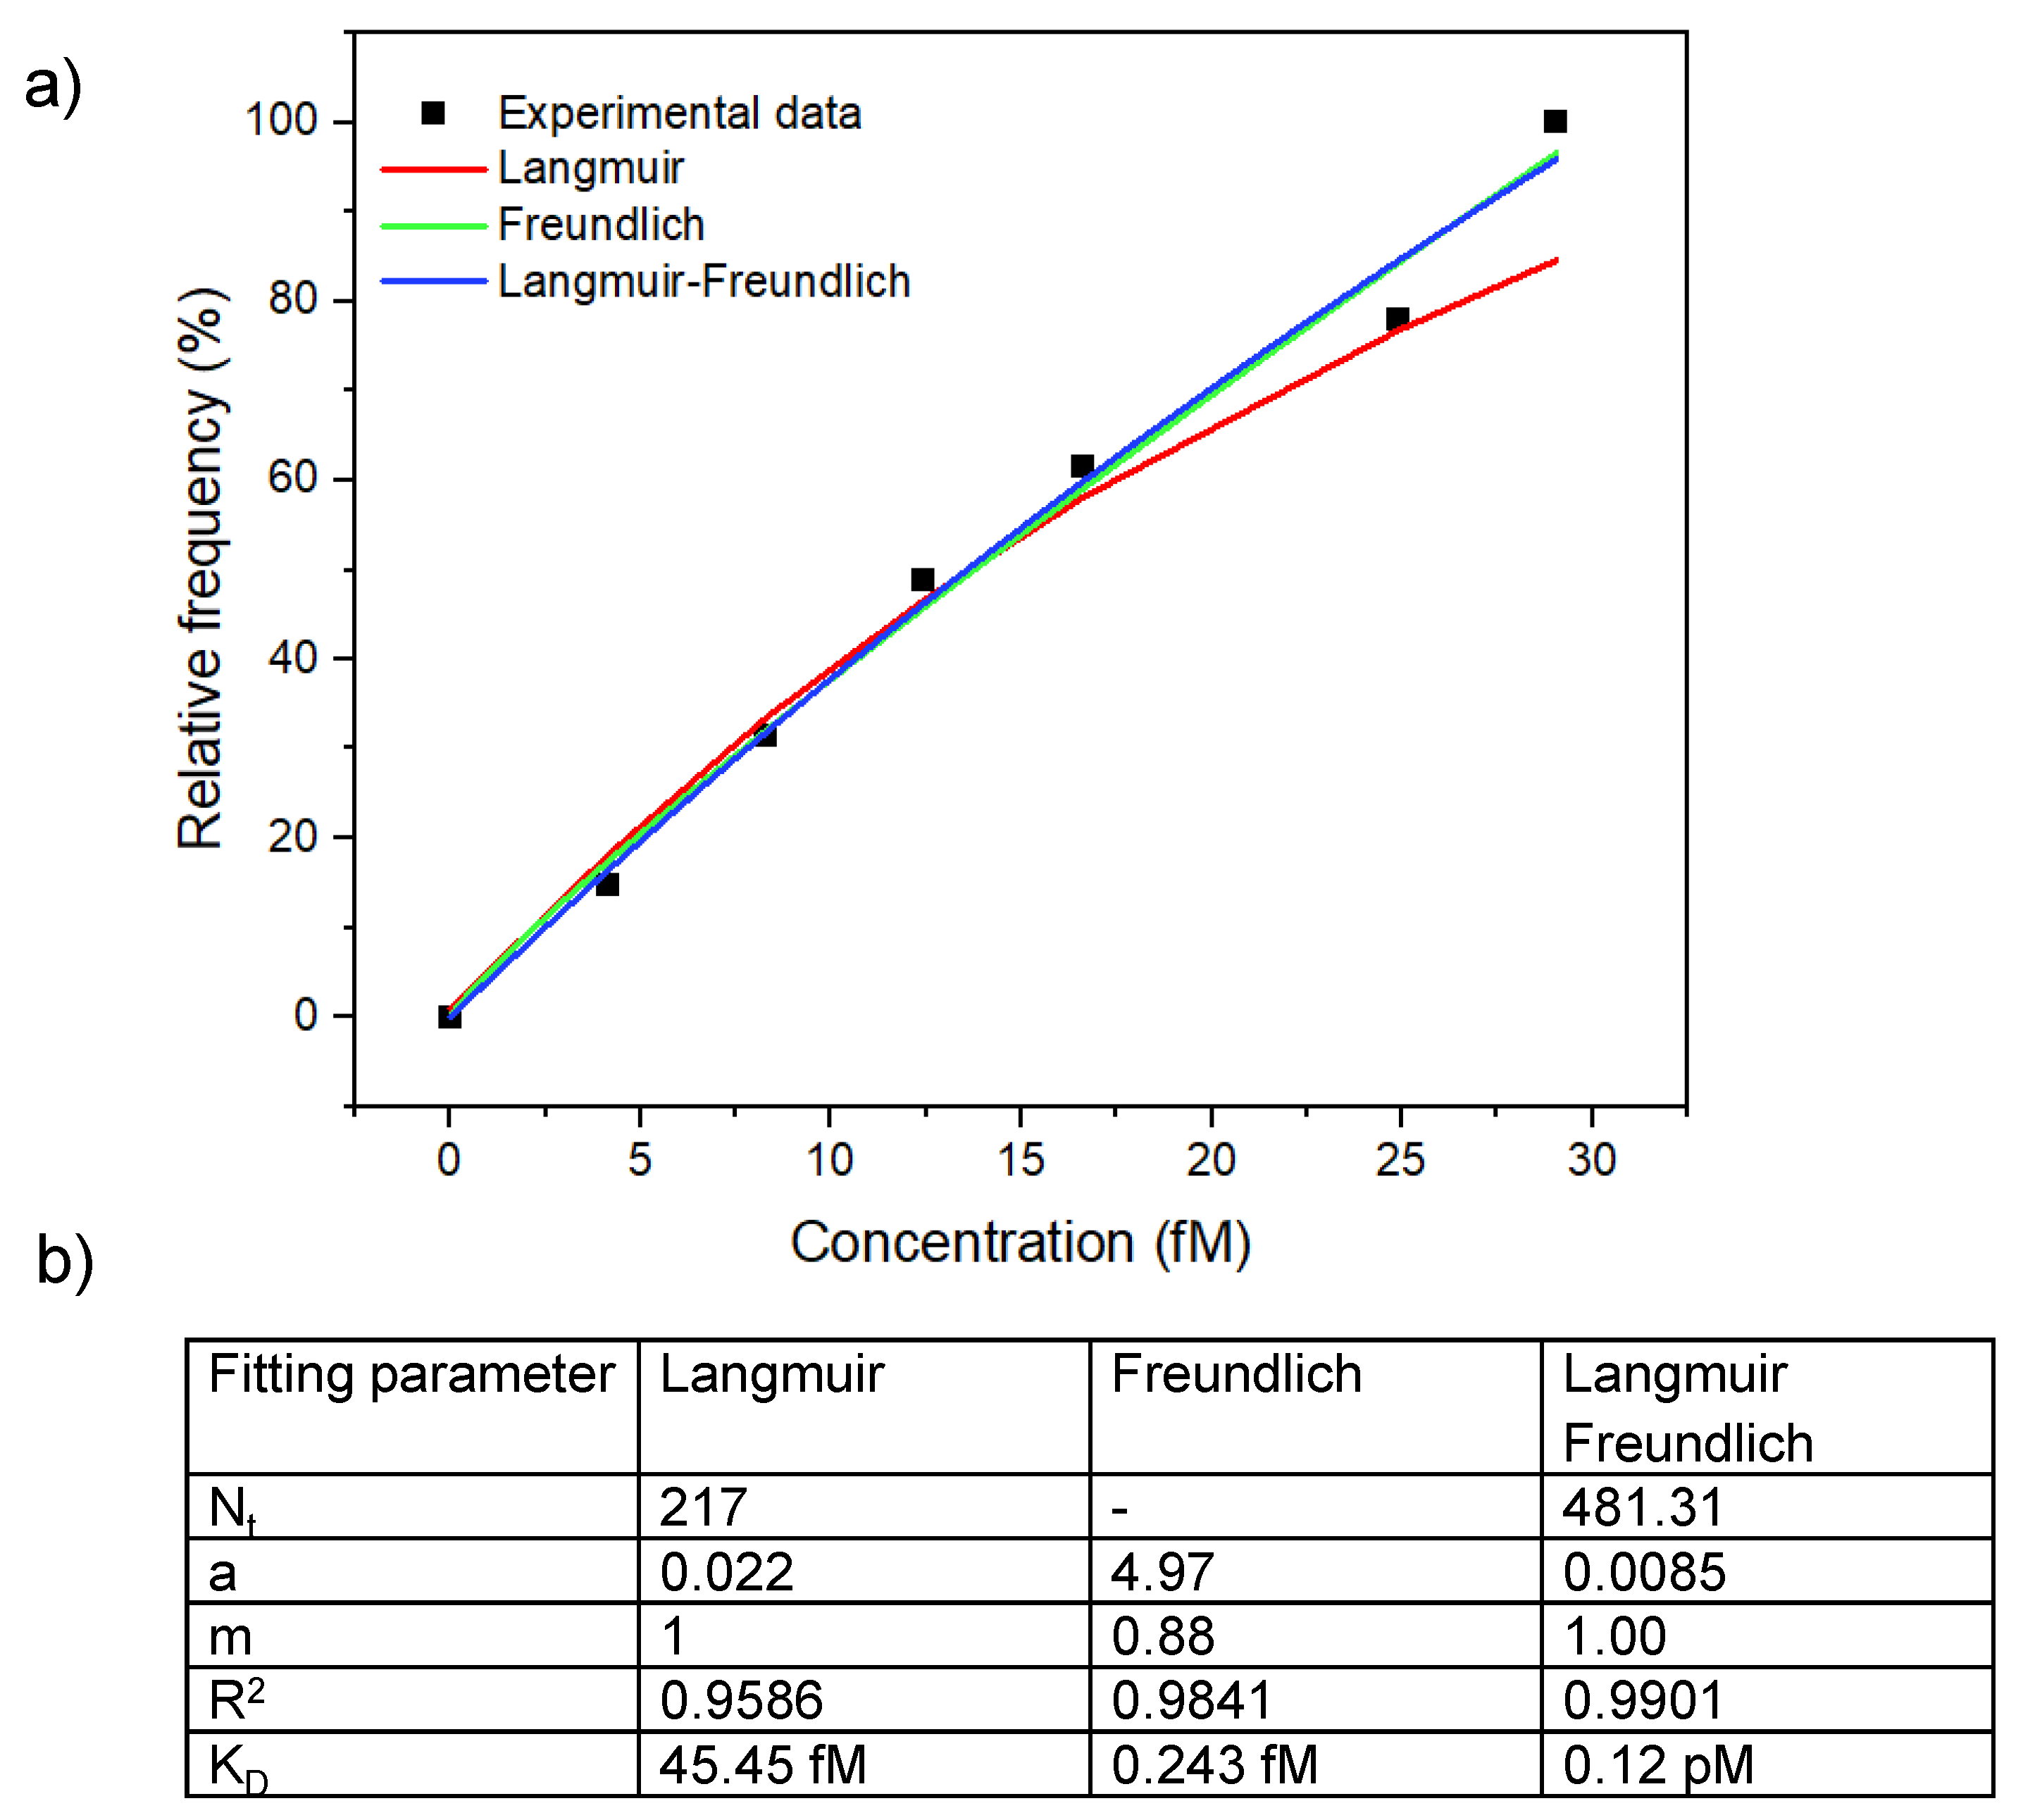
3.5. Kinetic Data Analysis

The investigation of the dissociation constant (KD) is fundamental for the analysis of binding kinetics for a ligand–receptor pair. Adsorption isotherms (Langmuir, Freundlich, and Langmuir–Freundlich) were used to determine the extent of affinity of SARS-CoV-2 towards its specific nanoMIP. In principle, Langmuir and Freundlich binding models undertake homogeneity (1:1 or one-to-one binding of receptor and ligand) and heterogeneity (one-to-many), respectively [50,51]. The Langmuir–Freundlich model is the combination of two adsorption isotherms which assumes the surface is homogeneous, however the biosorption event is a cooperative process, which is described by the following equation.
N = N m K C n / 1 + K C n
where K ,   n are isotherm constant and homogeneity index, respectively. This model lies between the concentrations where it reduces to Freundlich model for lower concentrations and at a high concentration level it leans towards Langmuir fitting [52]. The number of virion particles per mL was first converted into molar concentration by calculating the number of moles against each number of viruses in the sample (particles) and thus converting it into molarity. Further, different models were fitted to the experimental results by adjusting parameters Nt, a, m where a is the Freundlich parameter related to binding affinity and m is the index of heterogeneity of the sorbent (nanoMIP receptor). The value of m lies between 0 and 1, defining m = 1 as a perfectly homogeneous system. Langmuir and Freundlich isotherms were fitted using rectangular hyperbola and allometric1 (classical Freundlich) functions using Origin Pro8.1, respectively. Whereas, for Langmuir–Freundlich isotherm, a user defined function was input based on Equation (1). The mean association constant K0 is the function of a and m (Equation (2)) whose inverse gives the value of the dissociation constant, KD (Equation (3)). Upon calculation, the best fit was achieved with the Langmuir–Freundlich model with an R2 = 0.9901 resulting in the binding affinity of 0.12 pM. (Figure 9a). This heterogeneity is expected since the binding of the whole virus is a complex process due to the fact that various glycoproteins, lipid moieties, and sugars are available on the virus surface and take part in the recognition and binding events with specific nanoMIPs. Figure 9b shows the details of fitting parameters of adsorption isotherms.
K 0 = a 1 m
K D = 1 K 0

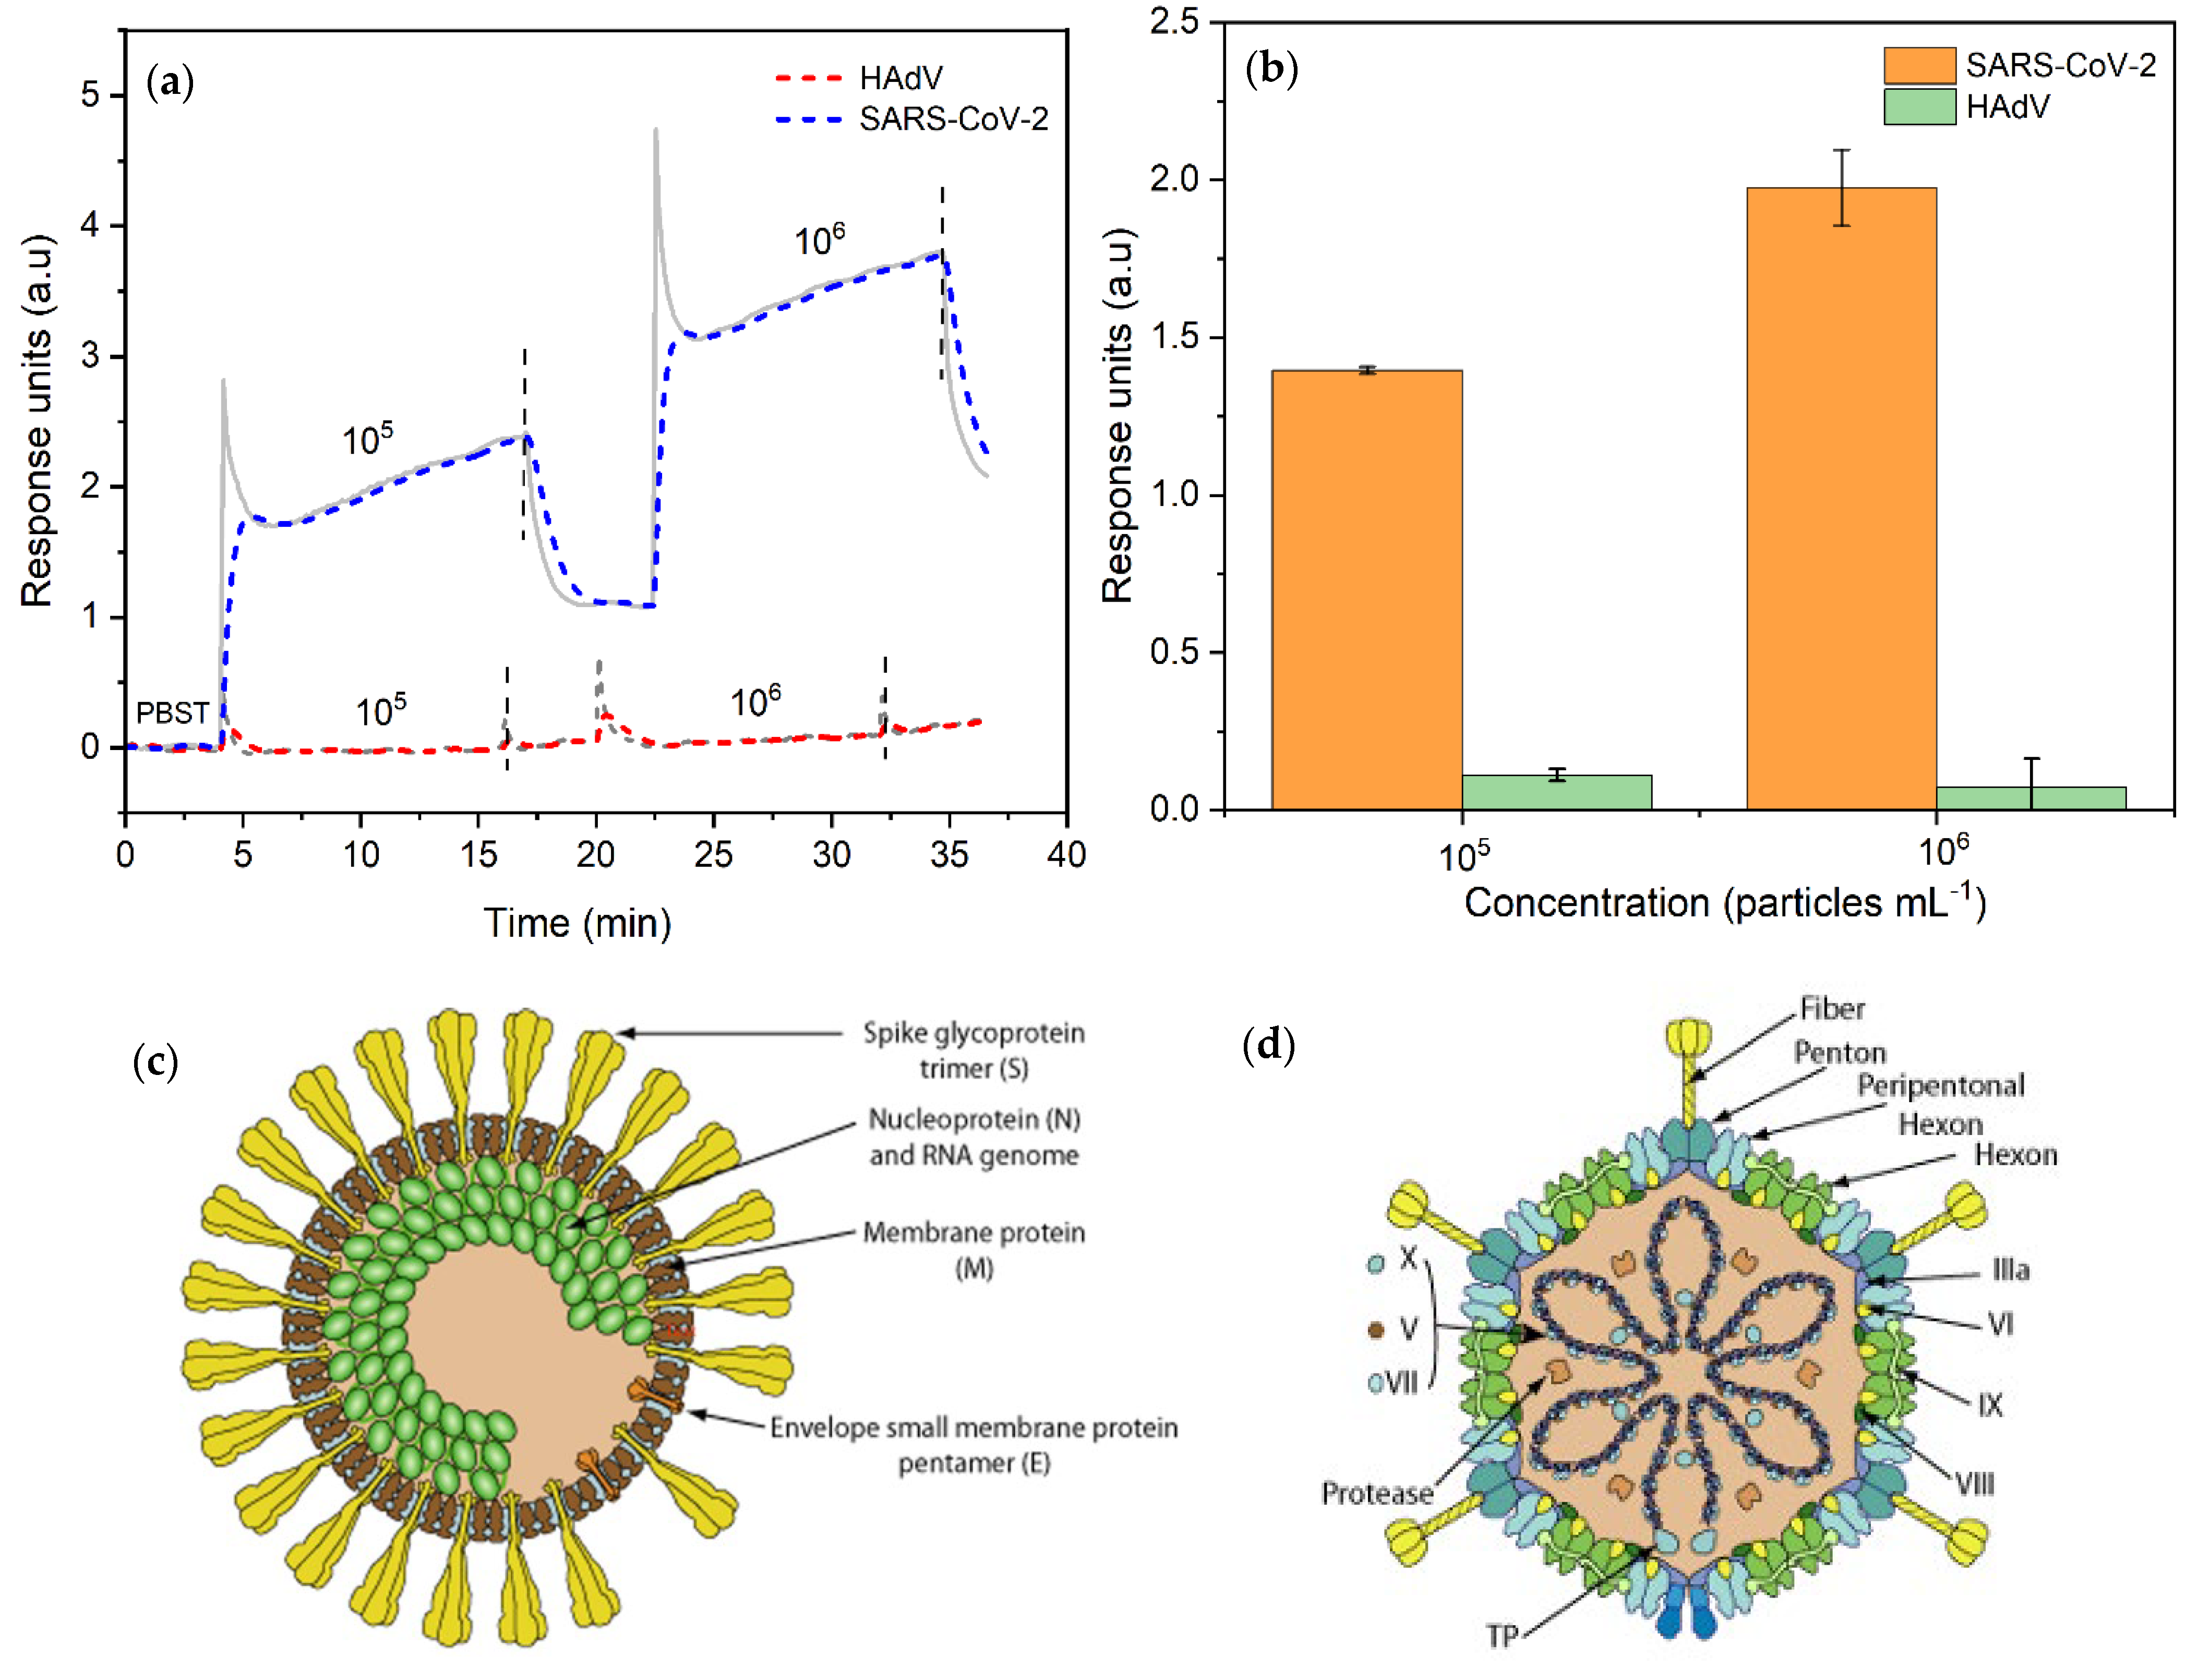
3.6. Cross-Reactivity Test

To confirm the specificity of the binding interaction between the nanoMIP and its target (SARS-CoV-2), a control virus (human adenovirus, HAdV) was also tested at two different concentrations (105 and 106 particles mL−1) (Figure 10a). The non-specific binding of HdAV was found to be in the range of 5–10%, indicating an excellent specificity of the nanoMIPs towards SARS-CoV-2, despite the high similarity between two human pathogenic viruses (Figure 10b–d).

4. Conclusions

In this work, a nanoMIP-based SPR sensor was developed for the rapid and cost-efficient diagnosis of SARS-CoV-2 using a portable microfluidic device. The label-free sensor allowed for the detection of SARS-CoV-2 in the concentration range of 0.25–1.75 × 10⁶ particles mL−1 with a LOD of 104 particles. The nanoMIPs showed an excellent binding affinity towards the target virus with a KD of 0.12 pM. The sensor fabrication steps were successfully confirmed by AFM, CV, and SWV methods. Cross-reactivity studies with a structurally similar human pathogenic virus (HAdV) revealed that the developed sensor has shown only 5–10% non-specific binding. The sensor is an excellent candidate for further developments for the point-of-care diagnosis of infectious diseases caused by pathogenic viruses.

Author Contributions

Z.A. conceptualized the research, directed the project, provided the resources, and wrote the manuscript. A.B. designed and performed the experiments, analyzed the results, and wrote the manuscript. I.A. facilitated the knowledge transfer on SPR technology. J.T. prepared and provided the viruses. All authors have read and agreed to the published version of the manuscript.

Funding

Z.A. thanks the German Research Foundation (DFG, Grant number: 428780268) and Aventis Foundation (Grant number: 80304368) for the financial support as the principal investigator. Moreover, the project is partially funded from the European Union’s Horizon 2020 research and innovation programme under the Marie Skłodowska-Curie grant agreement No 872662.

Data Availability Statement

The data presented in this study are available on request from the corresponding author.

Conflicts of Interest

The authors declare no conflict of interest.

References

  1. DeBiasi, R.L.; Tyler, K.L. Polymerase Chain Reaction in the Diagnosis and Management of Central Nervous System Infections. Arch. Neurol. 1999, 56, 1215–1219. [Google Scholar] [CrossRef] [PubMed] [Green Version]
  2. Wright, P.F.; Nilsson, E.; Lelenta, M. Standardisation and Validation of Enzyme- Linked Immunosorbent Assay Techniques for the Detection of Antibody in Infectious Disease Diagnosis. Rev. Sci. Tech. 1993, 12, 435–450. [Google Scholar] [CrossRef] [PubMed]
  3. Walsh, M.G.; Sawleshwarkar, S.; Hossain, S.; Mor, S.M. Whence the next Pandemic? The Intersecting Global Geography of the Animal-Human Interface, Poor Health Systems and Air Transit Centrality Reveals Conduits for High-Impact Spillover. One Health 2020, 11, 100177. [Google Scholar] [CrossRef] [PubMed]
  4. Whiley, D.M.; Lambert, S.B.; Bialasiewicz, S.; Goire, N. False-Negative Results in Nucleic Acid Amplification Tests-Do We Need to Routinely Use Two Genetic Targets in All Assays to Overcome Problems Caused by Sequence Variation. Crit. Rev. Microbiol. 2008, 34, 71–76. [Google Scholar] [CrossRef] [PubMed]
  5. Amaral, C.; Antunes, W.; Moe, E.; Duarte, A.G.; Lima, L.M.P.; Santos, C.; Gomes, I.L.; Afonso, G.S.; Vieira, R.; Teles, H.S.S.; et al. A Molecular Test Based on RT-LAMP for Rapid, Sensitive and Inexpensive Colorimetric Detection of SARS-CoV-2 in Clinical Samples. Sci. Rep. 2021, 11, 16430. [Google Scholar] [CrossRef] [PubMed]
  6. Udugama, B.; Kadhiresan, P.; Kozlowski, H.N.; Malekjahani, A.; Osborne, M.; Li, V.Y.C.; Chen, H.; Mubareka, S.; Gubbay, J.B.; Chan, W.C.W. Diagnosing COVID-19: The Disease and Tools for Detection. ACS Nano 2020, 14, 3822–3835. [Google Scholar] [CrossRef] [Green Version]
  7. Vandenberg, O.; Martiny, D.; Rochas, O.; Belkum, A.; Kozlakidis, Z. Considerations for Diagnostic COVID-19 Tests. Nat. Rev. Microbiol. 2021, 19, 171–183. [Google Scholar] [CrossRef]
  8. Chau, C.H.; Strope, J.D.; Figg, W.D. COVID-19 Clinical Diagnostics and Testing Technology. Pharmacotherapy 2020, 40, 857–868. [Google Scholar] [CrossRef]
  9. Alafeef, M.; Dighe, K.; Moitra, P.; Pan, D. Rapid Ultrasensitive, and Quantitative Detection of SARS-CoV-2 Using Antisense Oligonucleotides Directed Electrochemical Biosensor Chip. ACS Nano 2020, 14, 17028–17045. [Google Scholar] [CrossRef]
  10. Kim, J.; Mayorga-Martinez, C.C.; Vyskočil, J.; Ruzek, D.; Pumera, M. Plasmonic-Magnetic Nanorobots for SARS-CoV-2 RNA Detection through Electronic Readout. Appl. Mater. Today 2022, 27, 101402. [Google Scholar] [CrossRef]
  11. Lu, C.; Zhang, Y.; Tang, S.; Fang, Z.; Yang, H.; Chen, X.; Chen, G. Biosensors and Bioelectronics Sensing HIV Related Protein Using Epitope Imprinted Hydrophilic Polymer Coated Quartz Crystal Microbalance. Biosens. Bioelectron. 2012, 31, 439–444. [Google Scholar] [CrossRef]
  12. Navakul, K.; Sangma, C.; Yenchitsomanus, P.-T.; Chunta, S.; Lieberzeit, P.A. Enhancing Sensitivity of QCM for Dengue Type 1 Virus Detection Using Graphene-Based Polymer Composites. Anal. Bioanal. Chem. 2021, 413, 6191–6198. [Google Scholar] [CrossRef]
  13. Afzal, A.; Mujahid, A.; Schirhagl, R.; Bajwa, S.Z.; Latif, U.; Feroz, S. Gravimetric Viral Diagnostics: QCM Based Biosensors for Early Detection of Viruses. Chemosensors 2017, 5, 7. [Google Scholar] [CrossRef]
  14. Altintas, Z.; Gittens, M.; Guerreiro, A.; Thompson, K.A.; Walker, J.; Piletsky, S.; Tothill, I.E. Detection of Waterborne Viruses Using High Affinity Molecularly Imprinted Polymers. Anal. Chem. 2015, 87, 6801–6807. [Google Scholar] [CrossRef]
  15. Shrivastav, A.M.; Cvelbar, U.; Abdulhalim, I.A. Comprehensive Review on Plasmonic-Based Biosensors Used in Viral Diagnostics. Commun. Biol. 2021, 4, 70. [Google Scholar] [CrossRef]
  16. Cennamo, N.; Bossi, A.M.; Arcadio, F.; Maniglio, D.; Zeni, L. On the Effect of Soft Molecularly Imprinted Nanoparticles Receptors Combined to Nanoplasmonic Probes for Biomedical Applications. Front. Bioeng. Biotechnol. 2021, 9, 801489. [Google Scholar] [CrossRef]
  17. Kukushkin, V.I.; Ivanov, N.M.; Novoseltseva, A.A.; Gambaryan, A.S.; Yaminsky, I.V.; Kopylov, A.M.; Zavyalova, E.G. Highly Sensitive Detection of Influenza Virus with SERS Aptasensor. PLoS ONE 2019, 14, e0216247. [Google Scholar] [CrossRef] [Green Version]
  18. Altintas, Z. Advanced imprinted materials for virus monitoring. In Advanced Molecularly Imprinted Materials; Tiwari, A., Uzun, L., Eds.; WILEY-Scrivener: Beverly, MA, USA, 2016; pp. 389–412. ISBN 9781119336297. [Google Scholar] [CrossRef]
  19. Zhao, X.; Wang, Z.; Yang, B.; Li, Z.; Tong, Y.; Bi, Y.; Li, Z.; Xia, X.; Chen, X.; Zhang, L.; et al. Integrating PCR-Free Amplification and Synergistic Sensing for Ultrasensitive and Rapid CRISPR/Cas12a-Based SARS-CoV-2 Antigen Detection. Synth. Syst. Biotechnol. 2021, 6, 283–291. [Google Scholar] [CrossRef]
  20. Ramírez-Chavarría, R.G.; Castillo-Villanueva, E.; Alvarez-Serna, B.E.; Carrillo-Reyes, J.; Ramírez-Zamora, R.M.; Buitrón, G.; Alvarez-Icaza, L. Loop-Mediated Isothermal Amplification-Based Electrochemical Sensor for Detecting SARS-CoV-2 in Wastewater Samples. J. Environ. Chem. Eng. 2022, 10, 107488. [Google Scholar] [CrossRef]
  21. Liang, C.; Liu, B.; Li, J.; Lu, J.; Zhang, E.; Deng, Q.; Zhang, L.; Chen, R.; Fu, Y.; Li, C.; et al. Nanoenzyme Linked Immunochromatographic Sensor for Rapid and Quantitative Detection of SARS-CoV-2 Nucleocapsid Protein in Human Blood. Sens. Actuators B Chem. 2021, 349, 130718. [Google Scholar] [CrossRef]
  22. Ayankojo, A.G.; Boroznjak, R.; Reut, J.; Öpik, A.; Syritski, V. Molecularly Imprinted Polymer Based Electrochemical Sensor for Quantitative Detection of SARS-CoV-2 Spike Protein. Sens. Actuators B Chem. 2022, 353, 131160. [Google Scholar] [CrossRef] [PubMed]
  23. Ferreira, A.L.; De Lima, L.F.; Torres MD, T.; De Araujo, W.R.; De La Fuente-Nunez, C. Low-Cost Optodiagnostic for Minute-Time Scale Detection of SARS-CoV-2. ACS Nano 2021, 15, 17453–17462. [Google Scholar] [CrossRef] [PubMed]
  24. Jin, Z.; Mantri, Y.; Retout, M.; Cheng, Y.; Zhou, J.; Jorns, A.; Fajtova, P.; Yim, W.; Moore, C.; Xu, M.; et al. A Charge-Switchable Zwitterionic Peptide for Rapid Detection of SARS-CoV-2 Main Protease. Angew. Chem. Int. Ed. 2022, 61, e202112995. [Google Scholar] [CrossRef] [PubMed]
  25. Divagar, M.; Gayathri, R.; Rasool, R.; Shamlee, J.K.; Bhatia, H.; Satija, J.; Sai, V.V.R. Plasmonic Fiberoptic Absorbance Biosensor (P-FAB) for Rapid Detection of SARS-CoV-2 Nucleocapsid Protein. IEEE Sens. J. 2021, 21, 22758–22766. [Google Scholar] [CrossRef] [PubMed]
  26. Han, J.; Lee, S.; Jihoon, L.; Giwan, K.; Lee, Y.W. SARS-CoV-2 Spike Protein Detection Using Slightly Tapered No—Core Fiber-Based Optical Transducer. Microchim. Acta 2022, 189, 321. [Google Scholar] [CrossRef]
  27. Mojsoska, B.; Larsen, S.; Olsen, D.A.; Madsen, J.S.; Brandslund, I.; Alatraktchi, F.A. Rapid SARS-CoV-2 Detection Using Electrochemical Immunosensor. Sensors 2021, 21, 390. [Google Scholar] [CrossRef]
  28. Park, S.; Su Jeon, C.; Choi, N.; Moon, J.-I.; Min Lee, K.; Hyun Pyun, S.; Kang, T.; Choo, J. Sensitive and Reproducible Detection of SARS-CoV-2 Using SERS-Based Microdroplet Sensor. Chem. Eng. J. 2022, 446, 137085. [Google Scholar] [CrossRef]
  29. Nascimento, E.D.; Fonseca, W.T.; de Oliveira, T.R.; de Correia CR ST, B.; Faça, V.M.; de Morais, B.P.; Silvestrini, V.C.; Pott-Junior, H.; Teixeira, F.R.; Faria, R.C. COVID-19 Diagnosis by SARS-CoV-2 Spike Protein Detection in Saliva Using an Ultrasensitive Magneto-Assay Based on Disposable Electrochemical Sensor. Sens. Actuators B Chem. 2022, 353, 131128. [Google Scholar] [CrossRef]
  30. Haupt, K.; Rangel PX, M.; Tse, B.; Bui, S. Molecularly Imprinted Polymers: Antibody Mimics for Bioimaging and Therapy. Chem. Rev. 2020, 120, 9554–9582. [Google Scholar] [CrossRef]
  31. Haupt, K.; Mosbach, K. Molecularly Imprinted Polymers and Their Use in Biomimetic Sensors. Chem. Rev. 2000, 100, 2495–2504. [Google Scholar] [CrossRef]
  32. Raziq, A.; Kidakova, A.; Boroznjak, R.; Reut, J.; Opik, A.; Syritski, V. Development of a Portable MIP-Based Electrochemical Sensor for Detection of SARS-CoV-2 Antigen. Biosens. Bioelectron. 2021, 178, 113029. [Google Scholar] [CrossRef]
  33. Singhal, A.; Parihar, A.; Kumar, N.; Khan, R. High Throughput Molecularly Imprinted Polymers Based Electrochemical Nanosensors for Point-of-Care Diagnostics of COVID-19. Mater. Lett. 2022, 306, 130898. [Google Scholar] [CrossRef]
  34. Gast, M.; Sobek, H.; Mizaikoff, B. Trends in Analytical Chemistry Advances in Imprinting Strategies for Selective Virus Recognition a Review. Trends Anal. Chem. 2019, 114, 218–232. [Google Scholar] [CrossRef]
  35. Tai, D.; Lin, C.; Wu, T.; Chen, L. Recognition of Dengue Virus Protein Using Epitope-Mediated Molecularly Imprinted Film. Anal. Chem. 2005, 77, 5140–5143. [Google Scholar] [CrossRef]
  36. Altintas, Z.; Pocock, J.; Thompson, K.A.; Tothill, I.E. Comparative Investigations for Adenovirus Recognition and Quantification: Plastic or Natural Antibodies? Biosens. Bioelectron. 2015, 74, 996–1004. [Google Scholar] [CrossRef]
  37. Hoshino, Y.; Kodama, T.; Okahata, Y.; Shea, K.J. Peptide Imprinted Polymer Nanoparticles: A Plastic Antibody. J. Am. Chem. Soc. 2008, 130, 15242–15243. [Google Scholar] [CrossRef]
  38. Subramanian, A.; Kennel, S.J.; Oden, P.I.; Jacobson, K.B.; Woodward, J.; Doktycz, M.J. Comparison of Techniques for Enzyme Immobilization on Silicon Supports. Enzyme Microb. Technol. 1999, 24, 26–34. [Google Scholar] [CrossRef]
  39. Tawil, N.; Sacher, E.; Mandeville, R.; Meunier, M. Surface Plasmon Resonance Detection of E. Coli and Methicillin-Resistant S. Aureus Using Bacteriophages. Biosens. Bioelectron. 2012, 37, 24–29. [Google Scholar] [CrossRef]
  40. Tchinda, R.; Tutsch, A.; Schmid, B.; Süssmuth, R.D.; Altintas, Z. Recognition of Protein Biomarkers Using Epitope-Mediated Molecularly Imprinted Films: Histidine or Cysteine Modified Epitopes? Biosens. Bioelectron. 2019, 123, 260–268. [Google Scholar] [CrossRef]
  41. Department of Health & Social Care. Asymptomatic Testing for SARS-CoV-2 Using Antigen-Detecting Lateral Flow Devices. Performance Data from October 2020 to May 2021, Published on 7 July 2021. Available online: https://assets.publishing.service.gov.uk/government/uploads/system/uploads/attachment_data/file/999866/asymptomatic-testing-for-SARS-CoV-2-using-antigen-detecting-lateral-flow-devices-evidence-from-performance-data-Oct-2020-to-May-2021.pdf (accessed on 31 July 2022).
  42. Zhao, H.; Liu, F.; Xie, W.; Zhou, T.C.; OuYang, J.; Jin, L.; Li, H.; Zhao, C.Y.; Zhang, L.; Wei, J.; et al. Ultrasensitive Supersandwich-Type Electrochemical Sensor for SARS-CoV-2 from the Infected COVID-19 Patients Using a Smartphone. Sens. Actuators B Chem. 2021, 327, 128899. [Google Scholar] [CrossRef]
  43. Perdomo, S.A.; Ortega, V.; Jaramillo-botero, A.; Mancilla, N.; Mosquera-delacruz, J.H.; Valencia, D.P.; Quimbaya, M.; Contreras, J.D.; Velez, G.E.; Loaiza, O.A.; et al. SenSARS: A Low-Cost Portable Electrochemical Diagnostics of SARS-CoV-2 Infections. IEEE Trans. Instrum. Meas. 2021, 70, 4007710. [Google Scholar] [CrossRef] [PubMed]
  44. Chen, P.H.; Huang, C.C.; Wu, C.C.; Chen, P.H.; Tripathi, A.; Wang, Y.L. Saliva-Based COVID-19 Detection: A Rapid Antigen Test of SARS-CoV-2 Nucleocapsid Protein Using an Electrical-Double-Layer Gated Field-Effect Transistor-Based Biosensing System. Sens. Actuators B Chem. 2022, 357, 131415. [Google Scholar] [CrossRef] [PubMed]
  45. Chen, F.E.; Lee, P.W.; Trick, A.Y.; Park, J.S.; Chen, L.; Shah, K.; Mostafa, H.; Carroll, K.C.; Hsieh, K.; Wang, T.H. Point-of-Care CRISPR-Cas-Assisted SARS-CoV-2 Detection in an Automated and Portable Droplet Magnetofluidic Device. Biosens. Bioelectron. 2021, 190, 113390. [Google Scholar] [CrossRef] [PubMed]
  46. Rodriguez-Manzano, J.; Malpartida-Cardenas, K.; Moser, N.; Pennisi, I.; Cavuto, M.; Miglietta, L.; Moniri, A.; Penn, R.; Satta, G.; Randell, P.; et al. Handheld Point-of-Care System for Rapid Detection of SARS-CoV-2 Extracted RNA in under 20 Min. ACS Cent. Sci. 2021, 7, 307–317. [Google Scholar] [CrossRef] [PubMed]
  47. Sharma, P.K.; Kim, E.S.; Mishra, S.; Ganbold, E.; Seong, R.S.; Kaushik, A.K.; Kim, N.Y. Ultrasensitive and Reusable Graphene Oxide-Modified Double-Interdigitated Capacitive (DIDC) Sensing Chip for Detecting SARS-CoV-2. ACS Sens. 2021, 6, 3468–3476. [Google Scholar] [CrossRef] [PubMed]
  48. Kumar, D.; Bodily, T.; Karkisaval, A.G.; Dong, Y.; Natani, S. Rapid Self-Test of Unprocessed Viruses of SARS-CoV-2 and Its Variants in Saliva by Portable Wireless Graphene Biosensor. Proc. Natl. Acad. Sci. USA 2022, 119, e2206521119. [Google Scholar] [CrossRef]
  49. Altintas, Z. Surface Plasmon Resonance Based Sensor for the Detection of Glycopeptide Antibiotics in Milk Using Rationally Designed NanoMIPs. Sci. Rep. 2018, 8, 11222. [Google Scholar] [CrossRef] [Green Version]
  50. Sharma, P.S.; Dabrowski, M.; Noworyta, K.; Huynh, T.P.; KC, C.B.; Sobczak, J.W.; Pieta, P.; D’Souza, F.; Kutner, W. Fullerene Derived Molecularly Imprinted Polymer for Chemosensing of Adenosine-5′-Triphosphate (ATP). Anal. Chim. Acta. 2014, 844, 61–69. [Google Scholar] [CrossRef]
  51. Sehit, E.; Drzazgowska, J.; Buchenau, D.; Yesildag, C.; Lensen, M.; Altintas, Z. Ultrasensitive Nonenzymatic Electrochemical Glucose Sensor Based on Gold Nanoparticles and Molecularly Imprinted Polymers. Biosens. Bioelectron. 2020, 165, 112432. [Google Scholar] [CrossRef]
  52. Umpleby, R.J.; Baxter, S.C.; Chen, Y.; Shah, R.N.; Shimizu, K.D. Characterization of Molecularly Imprinted Polymers with the Langmuir—Freundlich Isotherm. Anal. Chem. 2001, 73, 4584–4591. [Google Scholar] [CrossRef]
Figure 1. Detailed schematic of solid-phase synthesis of nanoMIPs for SARS-CoV-2 virus.
Chemosensors 10 00459 g001
Figure 2. Major steps involved in the immobilization of nanoMIPs and detection of the virus.
Chemosensors 10 00459 g002
Figure 3. (a) Hydrodynamic size distribution of nanoMIPs specific for SARS-CoV-2 (n = 3). (b) Quality of DLS measurement (correlation fit). (c). Average zeta potential measurement centered at −24.79 mV (n = 3).
Chemosensors 10 00459 g003
Figure 4. (a) Real-time nanoMIP immobilization onto the SPR chip surface. (b) Real-time SPR sensorgram of cumulative SARS-CoV-2 detection assay. (c) Overall results of concentration-dependent virus binding assays using the nanoMIP-SPR sensor (n = 3). The error bars are determined by the standard deviation of several measurements taken on separate sensor chips at each particular concentration. (d) Virus detection on three individual sensor chips.
Chemosensors 10 00459 g004aChemosensors 10 00459 g004b
Figure 5. AFM images of (a) bare silicon wafer, (b) drop-casted SARS-CoV-2 nanoMIPs at 1 µm × 1 µm and (c) 3 µm × 3 µm scales.
Chemosensors 10 00459 g005
Figure 6. (a) Surface topography (height images) and (b) phase analysis of different steps involved in nanoMIPs immobilization and SARS-CoV-2 binding.
Chemosensors 10 00459 g006
Figure 7. Average root-mean-square roughness at each step of immobilization and virus binding (n = 10).
Chemosensors 10 00459 g007
Figure 8. (a) CV and (b) square-wave voltammograms recorded for immobilization of SARS-CoV-2 nanoMIPs on MUDA-coated gold wires. All measurements were taken with 10 mM K3(Fe(CN)6) in 0.1 M KCl at room temperature. Each voltammogram represents the average results of three measurements.
Chemosensors 10 00459 g008
Figure 9. (a) Binding isotherms fitted to the relative response of experimental results from specific binding. (b) Fitting parameters obtained for Langmuir, Freundlich and Langmuir–Freundlich binding models.
Chemosensors 10 00459 g009
Figure 10. (a) Sensogram of SARS-CoV-2 and HAdV binding at two different concentrations, (b) Overall comparison of relative SPR signal for target non-specific virus species, (c) Cartoon of coronavirus and (d) adenovirus.
Chemosensors 10 00459 g010
Table 1. The list of existing sensor methods for COVID-19 diagnosis.
Sensor TypeSARS-CoV-2 BiomarkerDetection
Method
Concentration RangeLODSample VolumeDetection TimeRef
CRISPR/Cas12a and aptamers as receptorNucleocapsid protein (Np)Fluorescence0.19–2.98 fM of Np0.17 fM
(~2 copies μL−1)
1 μL20 min[19]
LAMP-based Electrochemical sensorNp and ORF1ab geneSWV0.001–10,000 × 10−3 ng μL−138 × 10−6 ng μL−150 μL30 min[20]
Nanoenzyme-linked Immunochromatographic sensorNpColorimetric0.01563–8 ng mL−1 (linear range: 0.05–1.6 ng mL−1)0.026 ng mL−1100 μL10 min[21]
MIP-based Electrochemical sensorSpike protein subunit S1 (ncovS1)SWV26.7–194 fM15 fM in PBS and 64 fM in nasopharyngeal samples-15 min[22]
AuNano-cyc/ACE2 on cotton swab (COLOR)Spike proteinColorimetric10−12–10−6 g mL−10.154 pg mL−1-5 min[23]
Zwitterionic peptide-assisted AuNP aggregationProteaseColorimetric3.2–55.3 μM33.4 nM120 μL10 min[24]
Plasmonic Fiberoptic Absorbance Biosensors (P-FABs)NpAbsorbance0.1–10,000 ng mL−1 (linear range: 0.1–100 ng mL−1)2.5 ng mL−125 μL10 min[25]
Plasmonic (No-core Fiber-based optical transducer)Spike proteinSpectral interrogation100–104 ng mL−18.49 ng mL−1100 μL5 min[26]
Graphene-based Electrochemical sensorSpike protein (S1)SWV260,520 and 1040 nM260 nM (20 μg mL−1)10 μL45 min[27]
Magnetic bar-embedded droplet microfluidic sensorNpSERS0–10,000 PFU mL−10.22 PFU mL−130 μL10 min[28]
Magneto-assay based on disposable Electrochemical sensorSpike proteinsDPV0.0009–360 fg mL−10.35 ag mL−130 μL60 min[29]
Abbreviations: Loop-mediated isothermal amplification (LAMP), Molecularly imprinted polymer (MIP), Surface-enhanced Raman spectroscopy (SERS), Plaque forming unit (PFU), Square-wave voltammetry (SWV), Differential pulse voltammetry (DPV), Limit of detection (LOD).
Table 2. The list of various portable sensors of SARS-CoV-2 reported in the literature as well as the current work.
Portable DeviceSARS-CoV-2 BiomarkerConcentration
Range
Limit of Detection (LOD)Sample VolumeDetection TimeRef
MIP-based miniaturized angular SPRWhole virus0.25–1.75 × 10⁶ particles mL−13.15 × 10⁴ virus particles100 μL20 minThis
work
Screen printed electrochemical sensor using smartphoneRNA10−17–10−12 M3 aM (200 copies mL−1 in real samples)10 μL<10 s[42]
Portable electrochemical sensor (SenSARS)Spike protein1–50 fg mL−11.065 fg mL−10.3 μL10 min[43]
Electrical-double-layer gated field-effect transistor-basedNp0.4–400 ng mL−10.34 ng mL−1 (7.44 pM) in PBS and 0.14 ng mL−1 (2.96 pM)500 nL30 min[44]
CRISPR-Cas-assisted droplet magnetofluidic deviceRNA1 and 100 genome 100 μL−11 genome μL−1100 μL<30 min[45]
LAMP-based rapid detection using handheld POC deviceNp gene101–09 RNA copies μL−110 RNA copies4 μL (extracted RNA)20 min[46]
Gox-modified interdigitated capacitive (DIDC) sensingSpike protein S11.0 mg mL−1
−1.0 fg mL−1
1 fg mL−14 μL3 s[47]
Wireless aptamer-based graphene field-effect transistorSpike (S) and nucleocapsid (Np) protein0–200 nM of S and 0–100 nM for N protein1.28 PFU mL−1 for S and 1.45 PFU mL−1 for Np protein-20 min[48]
Publisher’s Note: MDPI stays neutral with regard to jurisdictional claims in published maps and institutional affiliations.

