Article

Determination of Pb(II) Ions in Water by Fluorescence Spectroscopy Based on Silver Nanoclusters

1
Department of Industrial Engineering, University of Rome Tor Vergata, Via del Politecnico 1, 00133 Rome, Italy
2
Prolabin & Tefarm S.r.l., 06134 Perugia, Italy
*
Author to whom correspondence should be addressed.
Chemosensors 2022, 10(10), 385; https://doi.org/10.3390/chemosensors10100385
Submission received: 2 August 2022 / Revised: 9 September 2022 / Accepted: 20 September 2022 / Published: 23 September 2022

Abstract

:
In this work, a method to determine Pb(II) ions in model water is presented; the method is based on the fluorescence emission of a silver nanoclusters (AgNCs) colloidal solution, which is sensitive to lead ions. The presence of Pb(II) ions causes a photoemission enhancement of the AgNCs solution dependent on the pollutant concentration. The functional dependence is logarithmic in the range from 2.5 to 40 µM, and through the linearization of the calibration points, a linear function is determined and exploited for the extrapolation of the test Pb(II) concentrations with a precision estimated by relative standard deviation (RSD) ranging from 21% to 10% from the highest to the lowest Pb(II) quantity, respectively. Finally, inductively coupled plasma–optical emission spectroscopy (ICP-OES) successfully validated the described method. The accuracy of the method is also studied for intentionally polluted mineral waters, revealing the same trend of the model water: the lower the concentration, the higher the precision of the method.

1. Introduction

Heavy metal pollution is becoming a severe problem all over the world, since these toxic metals enter into the environment either by natural phenomena or due to extensive industrialization. The discharged effluents containing toxic heavy metals mix with soil/water and change their natural composition [1], reaching living beings through the food chain and causing damage to their health. One of the most common metal pollutants is the Pb(II) [2], which is able to cause many serious health issues such as anemia, kidney damage, reproductive/fertility problems and brain or nervous system damage [3,4].
The evaluation of lead contamination quickly and accurately represents a challenge. Analytical techniques with high selectivity and sensitivity are employed to detect water pollutants, such as atomic absorption spectroscopy [5,6], atomic emission spectroscopy [7,8], chromatography [9,10], or mass spectrometry [11,12], but these methods are expensive and time consuming, mainly due to the sample preparation [13].
Optical methods based on a change in UV/VIS absorption [14,15] and/or fluorescence [16,17] spectra induced by the presence of pollutants can be valid and complementary alternatives to the above-mentioned analytical methods. In particular, nanomaterials, presenting specific optical features, such as noble metal nanostructures [18,19,20,21,22] or quantum dots [23,24], have been recently investigated. The photonic approach shows many advantages with respect to the analytical ones, such as low costs in terms of instrumentations, no pre-treatments of samples (for instance, pre-concentration processes) and the ease of readout.
In this work, we report a complementary method based on the fluorescence spectroscopy to reveal the presence of Pb(II) in model waters. Silver nanoclusters (AgNCs) stabilized by poly(methacrylic acid) (PMAA) have been employed as fluorescent species responsive to the presence of Pb(II) ions, since the emission from AgNCs is enhanced if the colloidal solution is kept in contact with lead ions [25].
A calibration curve (monitoring the photoluminescence of the AgNCs solution) was accomplished, by changing the Pb(II) concentration in the colloidal system in the range 2.5–40 µM. A linear behavior is observed in the plot of the ratio (F/F0) between the fluorescence emission in presence (F) and in absence (F0) of Pb(II) ions as a function of the logarithm of lead concentrations, and a linear regression function has been calculated by a fitting procedure of the experimental points. By measuring the photoemission of AgNCs polluted with different Pb(II) concentrations as tests and exploiting the linear function, it was possible to extrapolate the lead quantities in water. Finally, inductively coupled plasma–optical emission spectroscopy (ICP-OES) was employed to validate this protocol. The test concentrations obtained by this technique were in good agreement with those extrapolated by the fluorescence spectroscopy, especially for the low lead quantities. The final scope of this paper is the evaluation of the precision of our protocol.

2. Materials and Methods

2.1. Chemicals

Silver nitrate (AgNO3), poly(methacrylic acid) sodium salt solution (MW = 9400, 30% wt. in water), ethanol (>99.8%) and nitric acid HNO3 (70%) were purchased from Merck. Table 1 shows the list of the metal ions investigated. All metal precursors were purchased from Merck. All reagents were used without any further purifications. All the water solutions were prepared with deionized water with resistivity equal to 18.2 MΩ/cm2 (Semplicity® UV, Merck, Germany).

2.2. Synthesis of Pb(II) Ions Sensor (AgNCs-PMAA)

Silver nanoclusters were synthesized according to the protocol presented in previous papers [25,26,27]: in brief, a fresh water solution of AgNO3 and PMAA solution were mixed and the pH was adjusted to 4.00 by adding HNO3, giving the right structural conformation to polymer chains and preventing the aggregation of the future AgNCs. The solution was exposed to the UV radiation for 6 min (300 W, Newport, Oriel Instruments, Irvine, CA, USA) to trigger the reduction of Ag+ to Ag0. During all the UV exposition, nitrogen gas was fluxed on the solution surface to hamper the oxidation of the growing AgNCs.
A centrifugation process (20 min at 10,000 rpm, Thermo Scientific, Heraeus Megafuge 8, Waltham, MA, USA) was applied to the solution and the supernatant was collected to improve the mono-dispersion of the AgNCs. The final solution was kept in the dark, at T = 4 °C. Subsequently, the colloidal solution was diluted 10-fold to avoid optical reabsorption processes during fluorescence measurements and to have an adequate sensitivity to the lead presence, and it was left at room temperature in the dark for 2–3 days to stabilize the fluorescence emission before use in the tests.

2.3. Optical Characterization

The photoemission of the AgNCs solution was investigated in order to evaluate the response stability as a function of time, temperature, and in presence of Pb(II) ions. The stability was evaluated under four different conditions. The signal intensity was monitored every 5 min for 60 min under continuous LED excitation (430 nm at 60 μW) and without any optical excitation. The temperature stability of the solution was also checked monitoring the signal before and after a warming up (from room temperature (RT) to Tfinal = 50 °C) and a cooling down process (from T = 50 °C to RT). The solution was checked for a cooling down (from RT to Tfinal = 8 °C), and a subsequent warming-up process to RT. The emission signals were also monitored in the following three days (except for the sample under continuous LED beam, for practical reasons). Finally, the initial AgNCs solution was polluted with 2.5 and 30 μM of Pb(II), and the fluorescence intensity was studied for three days, to evaluate the interaction rate between the lead ions and the silver nanoclusters. Due to the slow interaction rate of the lead ions and the AgNCs, a stabilization time of 24 h was necessary, and this time was set as the standard one for calibration and sample measurements (see Section 3).

2.4. Selectivity and Interferogram in Presence of Different Metal Ions

The selectivity of the AgNCs-PMAA was performed with different metal ions, listed in Table 1. One solution for each metal ion was synthesized in deionized water with a concentration of 2.5 µM as test quantity. The fluorescence of the polluted AgNCs solutions was recorded after 24 h of interaction. An AgNCs solution without any contamination was used as signal reference.
The interference of other metal ions versus Pb(II) was also investigated, by mixing Pb(II) water solution with another metal ion with the ratio 1:1. The concentration of each of ion was 2.5 µM. The emission spectra of the samples were measured after 24 h of interaction. Each test was repeated in triplicate.
The results are shown in the supporting information; the AgNCs-PMAA solution showed a good selectivity towards Pb(II) and Hg(II) ions, increasing and decreasing the emission of AgNCs-PMAA, respectively. The interference tests have shown that only in the presence of a possible contamination of the water by mercury could the method lead to an erroneous detection of the quantity of Pb(II).

2.5. System Calibration, Test Solutions, and Tests in Real Waters

A water solution of Pb(II) with a concentration of 6000 μM was prepared; this solution has been called Reference. To determine the calibration curve, different volumes of Reference solution were injected in different cuvettes containing 3 mL of AgNCs solution, with the aim to vary the concentration of Pb(II) inside the cuvettes in the range 2.5–40 μM and, at the same time, to reduce possible errors related to the preparation of different lead solutions, starting always from the lead nitrate powder. The calibration curve was obtained from six experimental points corresponding to the concentrations of 2.5, 5, 10, 20, 30, and 40 µM.
The validity of the calibration curve was checked using four solutions (Test solutions) with different initial concentrations (0.57, 3.72, 8.27 and 13.7 mM). These solutions were prepared by dissolving the desired amount of Pb(NO3)2 precursor salt in deionized water and adding it to the AgNCs solution and testing the relative fluorescence intensity.
Tests in real water were also performed, by using two different mineral waters (purchased in local market), which were intentionally polluted with different initial concentrations (from 0.57 to 13.7 mM). The same procedure of the Test solution was applied.

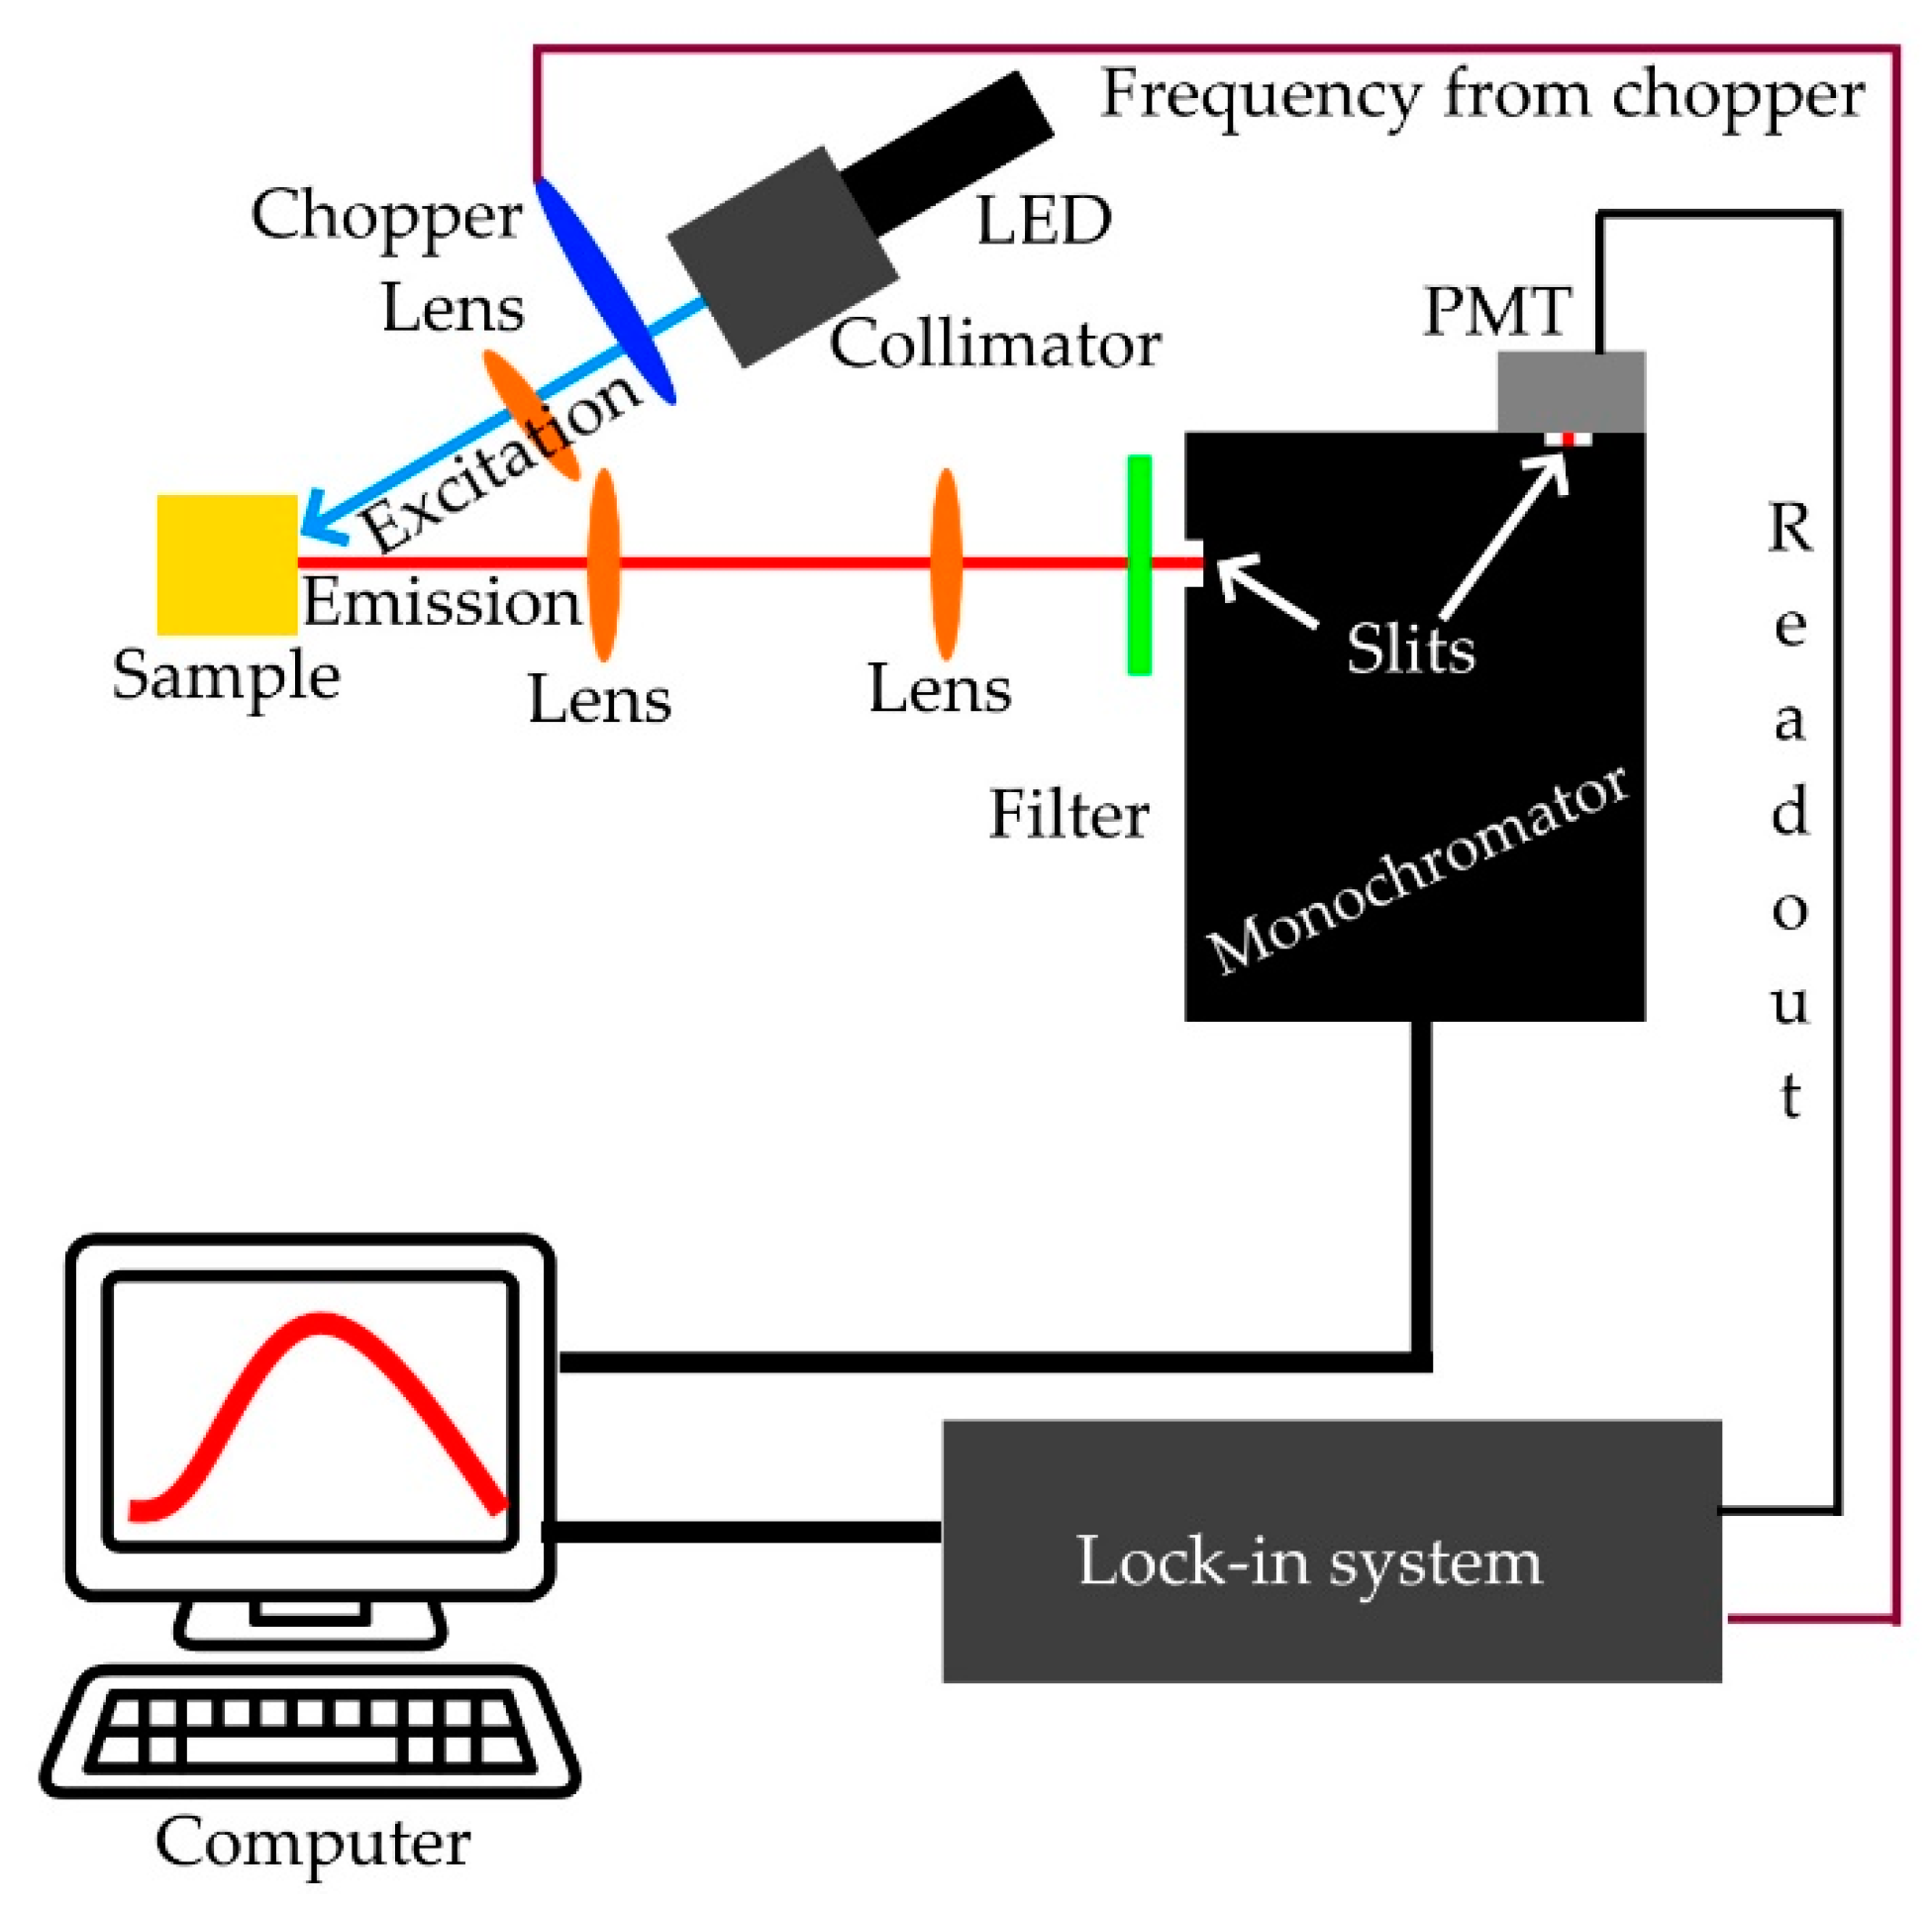
2.6. Instrumentation

A schematic drawing of the set-up for photoluminescence measurements is shown in Figure 1. A LED source with a maximum at 430 nm and 17 nm bandwidth (Thorlabs, M430L4) was used as excitation source. The light passes through an adjustable collimation adapter (Thorlabs, SM2F32-A), a mechanical chopper (frequency 224 Hz) and a lens (f = 80 mm), to focalize the beam on a small spot. The light strikes the quartz cuvette (optical path 10 mm) filled with the specimen, excites the colloidal solution and the emission was collected by a system of lenses that focalizes on the entrance slit of the monochromator (ARC, SpectraPro-300i). A long pass filter at 500 nm (Melles Groit, 03LWP003) was placed before the entrance slit to cut the excitation wavelength. All spectra were collected using a grating with 600 grids/mm. A photomultiplier tube (R2949, Hamamatsu Photonic Corp., Hamamatsu, Japan) was used for the detection. A lock-in amplifier analyzed the output signal, and a PC running a LabView application controlled the set-up.
The power of the LED was set at 60.4 ± 0.2 μW and monitored during all the measurements, and the power was stable throughout the experimental sessions. For all measurements, an integration time of 1 s was set; the value of each point is the average of three consecutive measurements recorded by instrumentation. Three consecutive spectra were collected and averaged for each sample. Finally, the AgNCs solution relative to the point at 30 μM was measured again to estimate the experimental error on the calibration curve (the full description is reported in the SI).
The inductively coupled plasma–optical emission spectroscopy (ICP-OES Perkin Elmer Avio 200) was employed to measure the actual concentrations of samples. The final values of Pb(II) concentrations correspond to an average of three independent measurements.

3. Results and Discussion

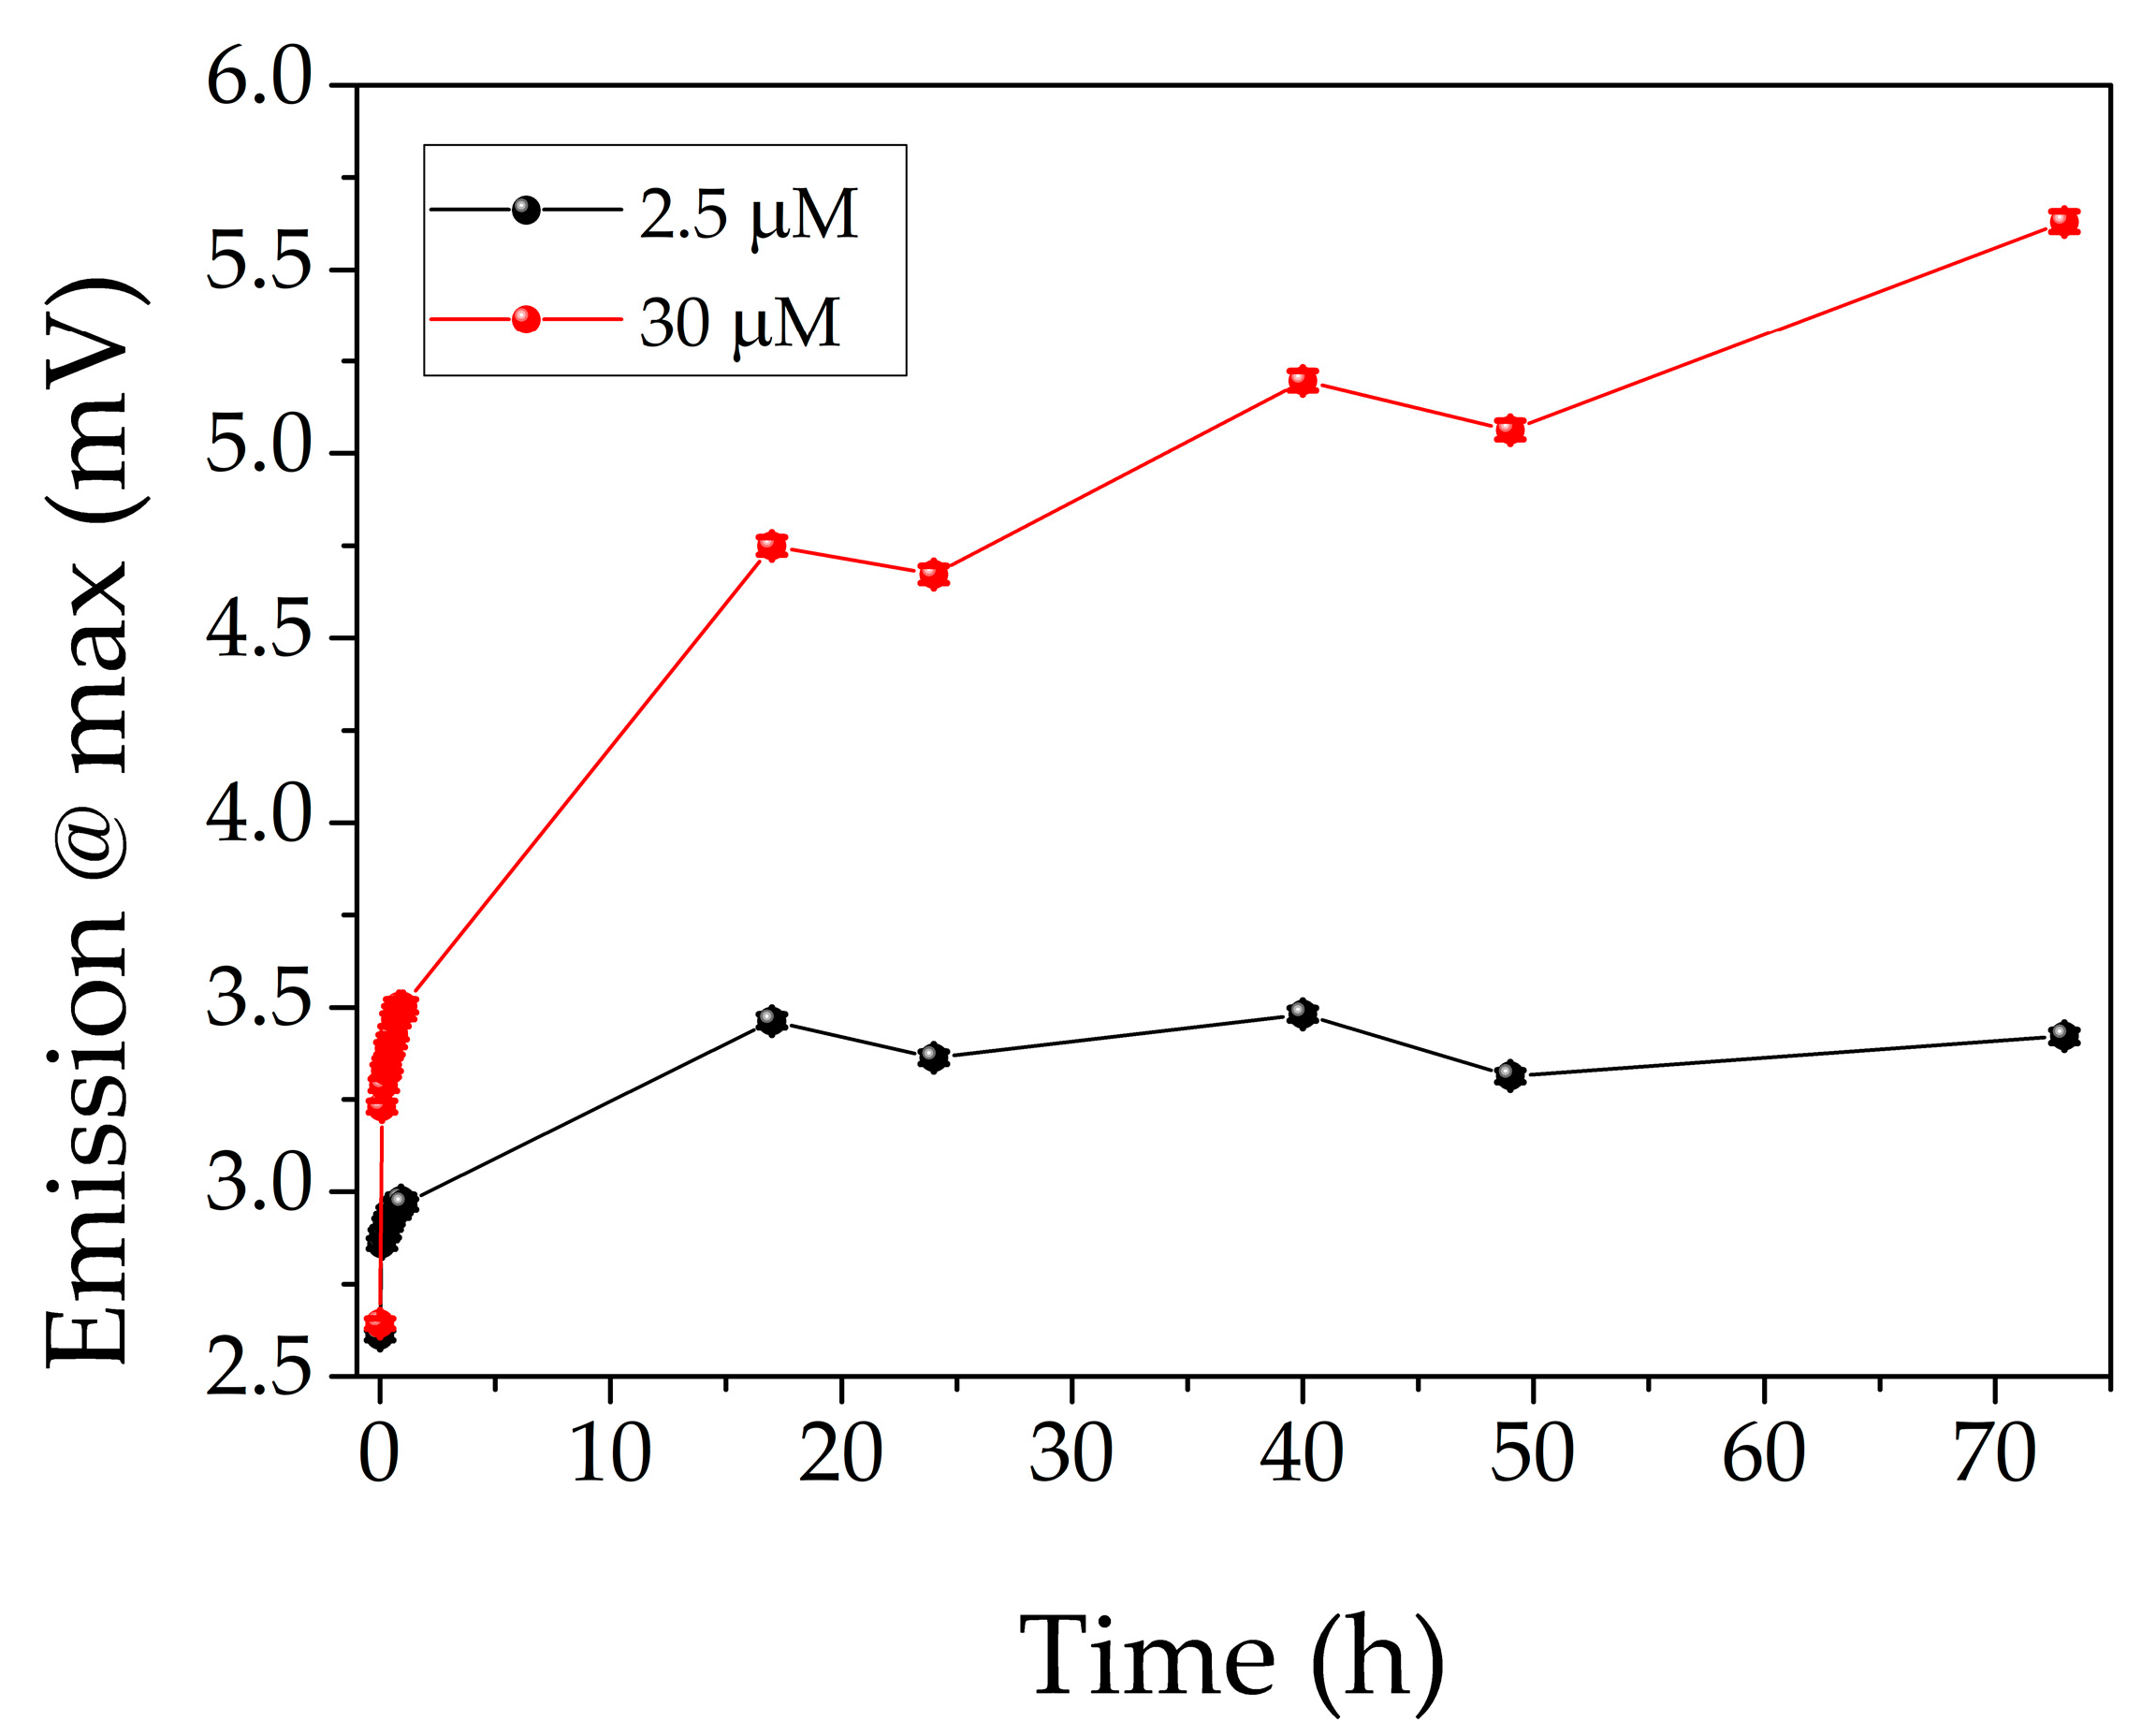
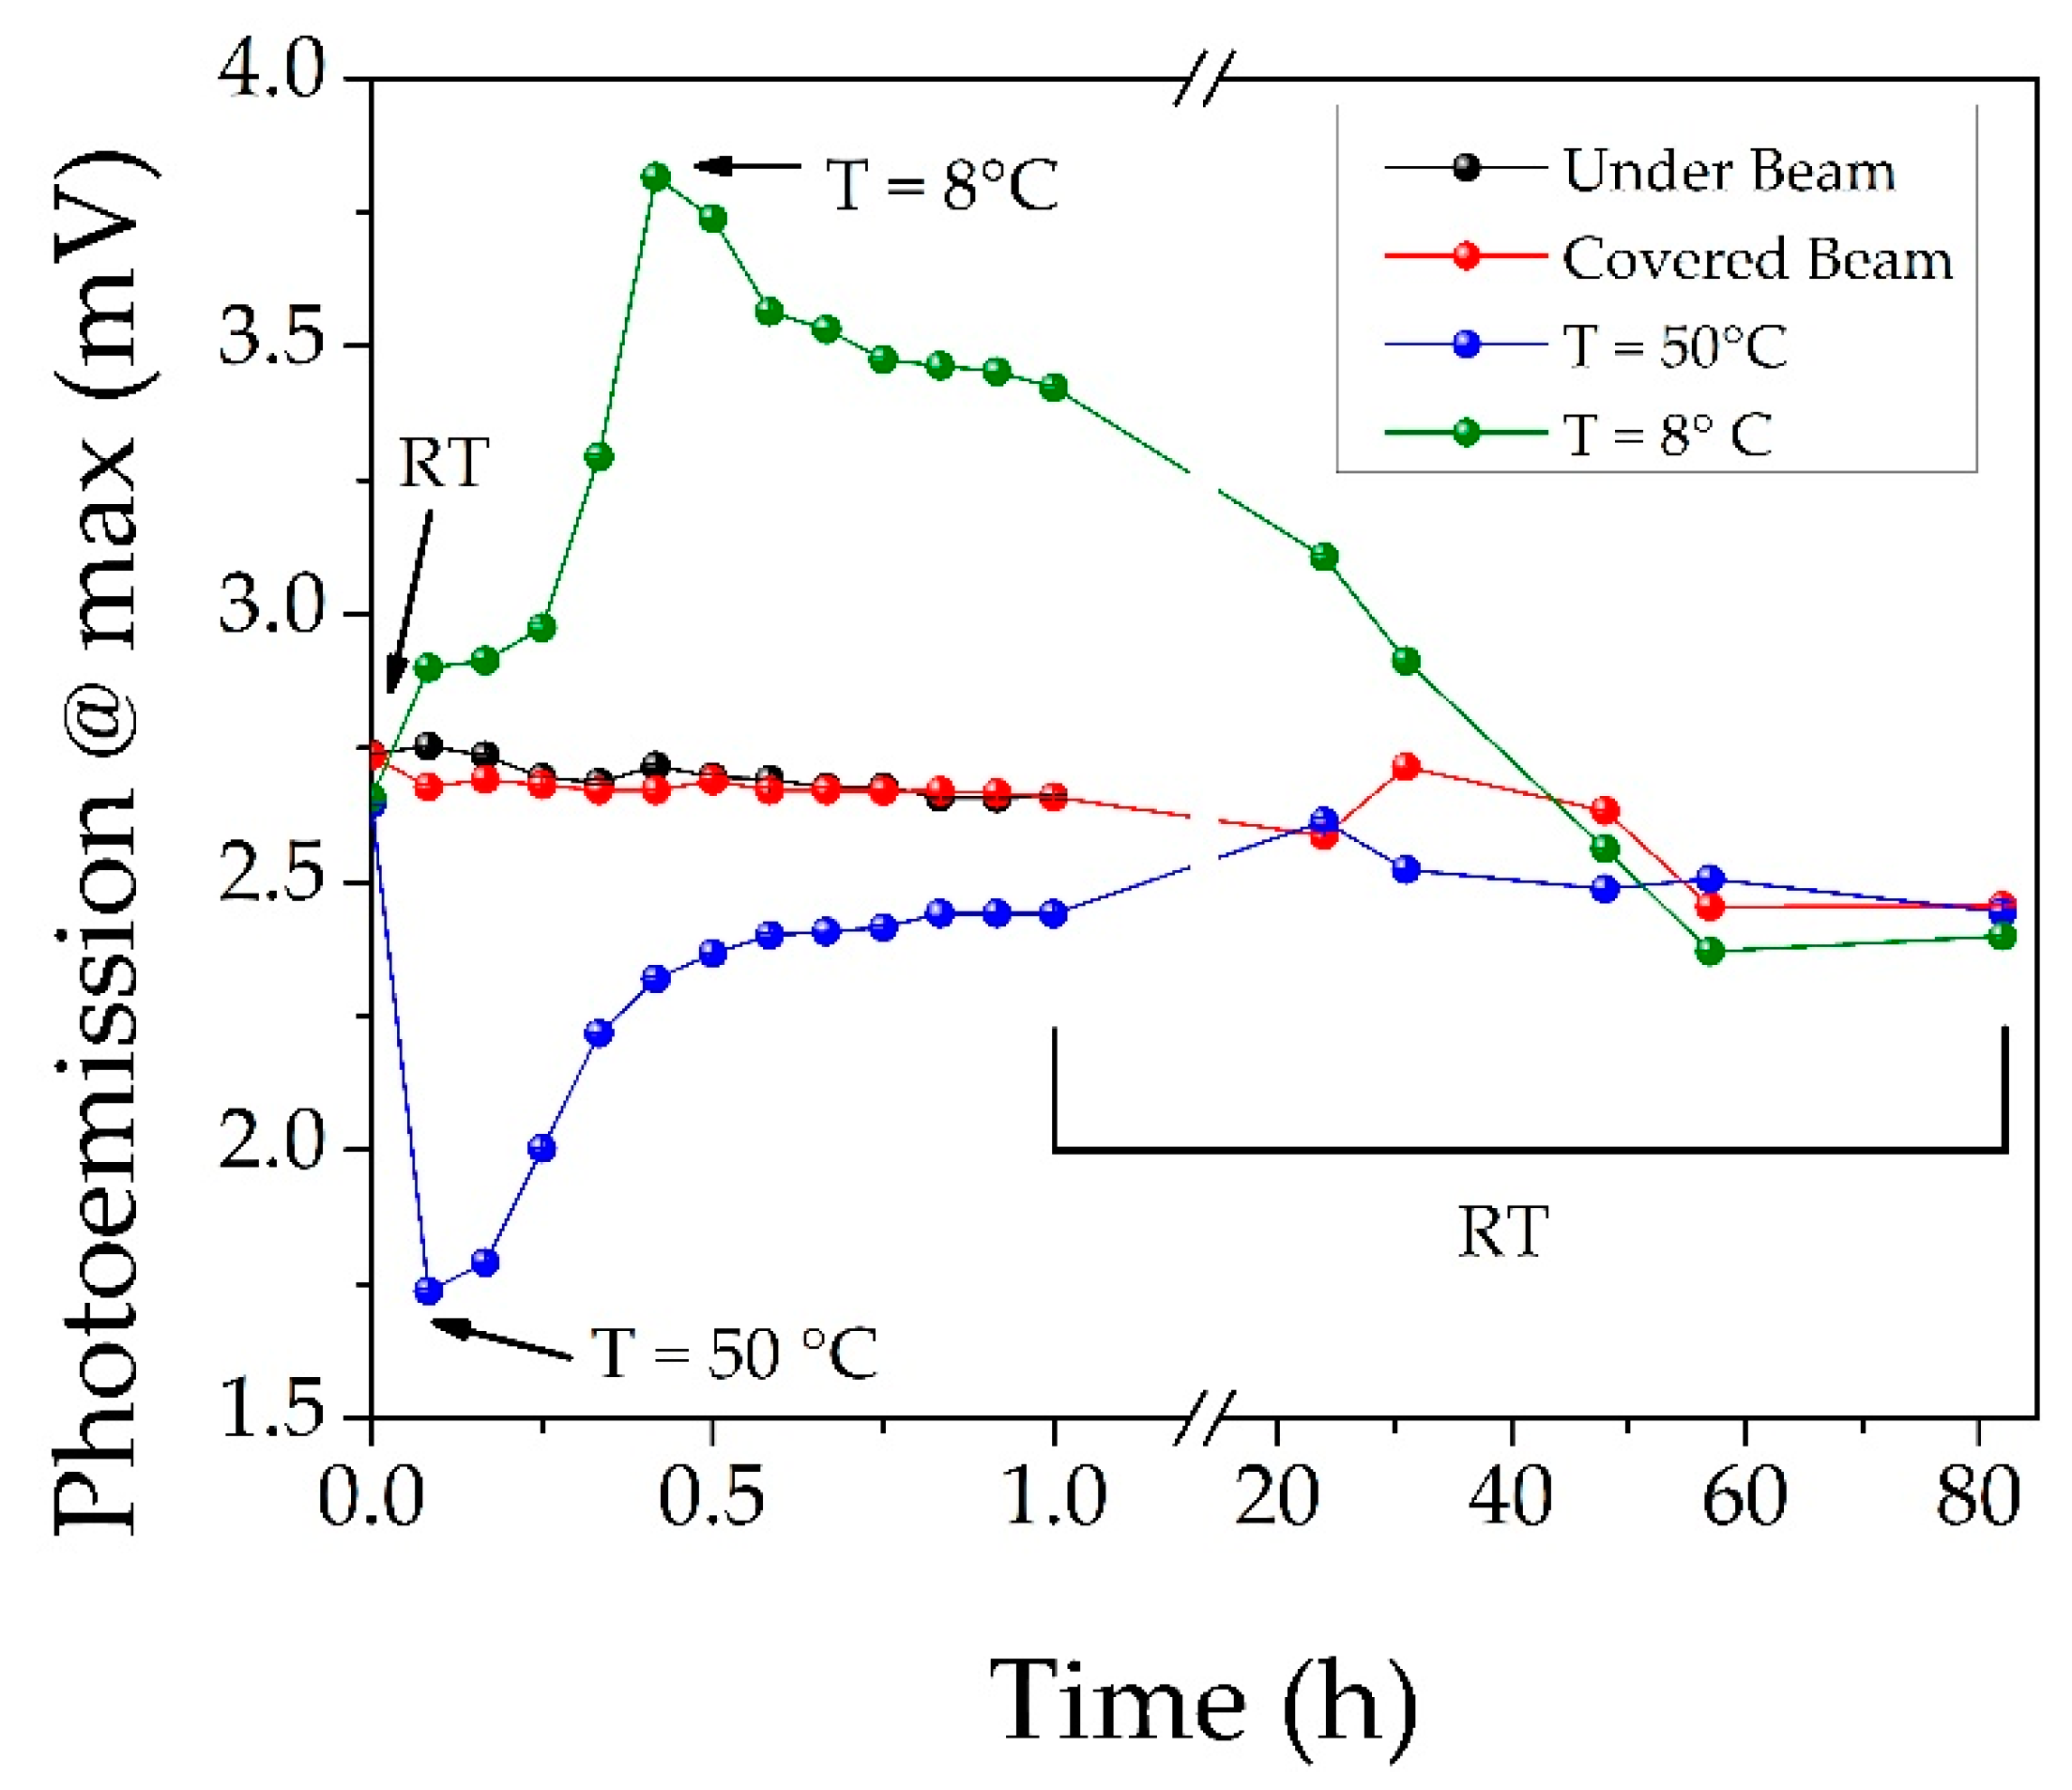
3.1. Evaluation of AgNCs Stability

Figure 2 reports the maximum value of the emission intensity (at about 660–665 nm) as a function of time, under different experimental conditions. The black curve refers to the AgNCs solution exposed to a continuous excitation for 60 min. The intensity decreases slowly, with a total loss of signal equal to 0.08 mV, indicating an absence of photo bleaching. The red line represents the fluorescence of AgNCs solution sample, when it is not continuously exposed to the LED beam. In this case, a loss of signal of the same amount of the previous case was registered, indicating that the colloidal solution remains stable within the time range. The warming up to 50 °C (blue curve) causes a rapid decrease in the signal (in the first 5 min); subsequently, the emission recovers the photoemission value of untreated sample in about 20 h; meanwhile, the cooling down process (green line) produces an increase in the emission intensity with a subsequent decrease, and the intensity recovers the values of the untreated AgNCs in about 50 h. In both cases, the effect of the temperature treatments carried out in the protocol are reversible. The thermal behavior can be easily understood in terms of radiative and non-radiative decay channels. When the LED excites the AgNCs solution, electrons are promoted to an excited state, and two competitive de-excitation processes can follow; the electrons can decay radiatively to the ground state or can transfer their energy to non-radiative intermediate states, returning to the fundamental state by a thermally induced relaxation. As the temperature increases, the probability of thermal relaxations will increase, and the non-radiative processes will be promoted to the detriment of the fluorescence. On the contrary, by decreasing the temperature, the probability of radiative decay will be much higher, and the fluorescence emission will be more intense.
For longer times, an overall slight degradation of AgNCs solution in terms of emission signal was noted; indeed, a loss of signal of about 0.2 mV was registered after 80 h. This aspect affects not only the error sources, but also the possibility to exploit a single AgNCs solution as standard to plot the calibration curve for different measurement sessions.
The time dependence of the photoemission peak value of the AgNCs solution in the presence of Pb(II) (2.5 and 30 μM) during the 3 days is shown in Figure 3. Here, the maximum of the emission for 2.5 μM reaches a plateau value after 24 h, while in the case of 30 μM, the signal continues to increase even after 70 h. The interaction rate is slow in both cases. A simple qualitative description of the process was reported in Figure 4, where the gray spheres are the AgNCs, which are stabilized by the carboxyl groups of PMAA (green points in Figure 4a). The –COOH groups play a double function: they stabilize the silver cores and interact with Pb(II) ions (if any) through a ion–dipole interaction [25] (Figure 4b). As reported in the literature [28,29,30], in acidic conditions, the PMAA chains acquire a supercoiled structure, exposing part of the active sites outside the coils and the rest of those inside them. The inner and outer –COOH groups will be differently accessible for lead ions, affecting the dynamic of the adsorption process. The Pb(II) ions are captured mainly and quickly by the active sites outside of the nano-structure, and a fast increase in fluorescence is registered. The inner sites can be reached by diffusion with a longer time within the supercoiled structure, and as a result, an additional increase in the fluorescence signal is recorded in subsequent times. The saturation of the AgNCs by ions occurs when the photoemission signal reaches the plateau. Figure 4c provides a rough sketch of the different active sites. The saturation time is dependent on the concentration of Pb(II), as found from the measurements in Figure 3. The higher the concentration, the higher the time to obtain the plateau value. For practical reasons, the interaction time for all the concentrations was set to 24 h.

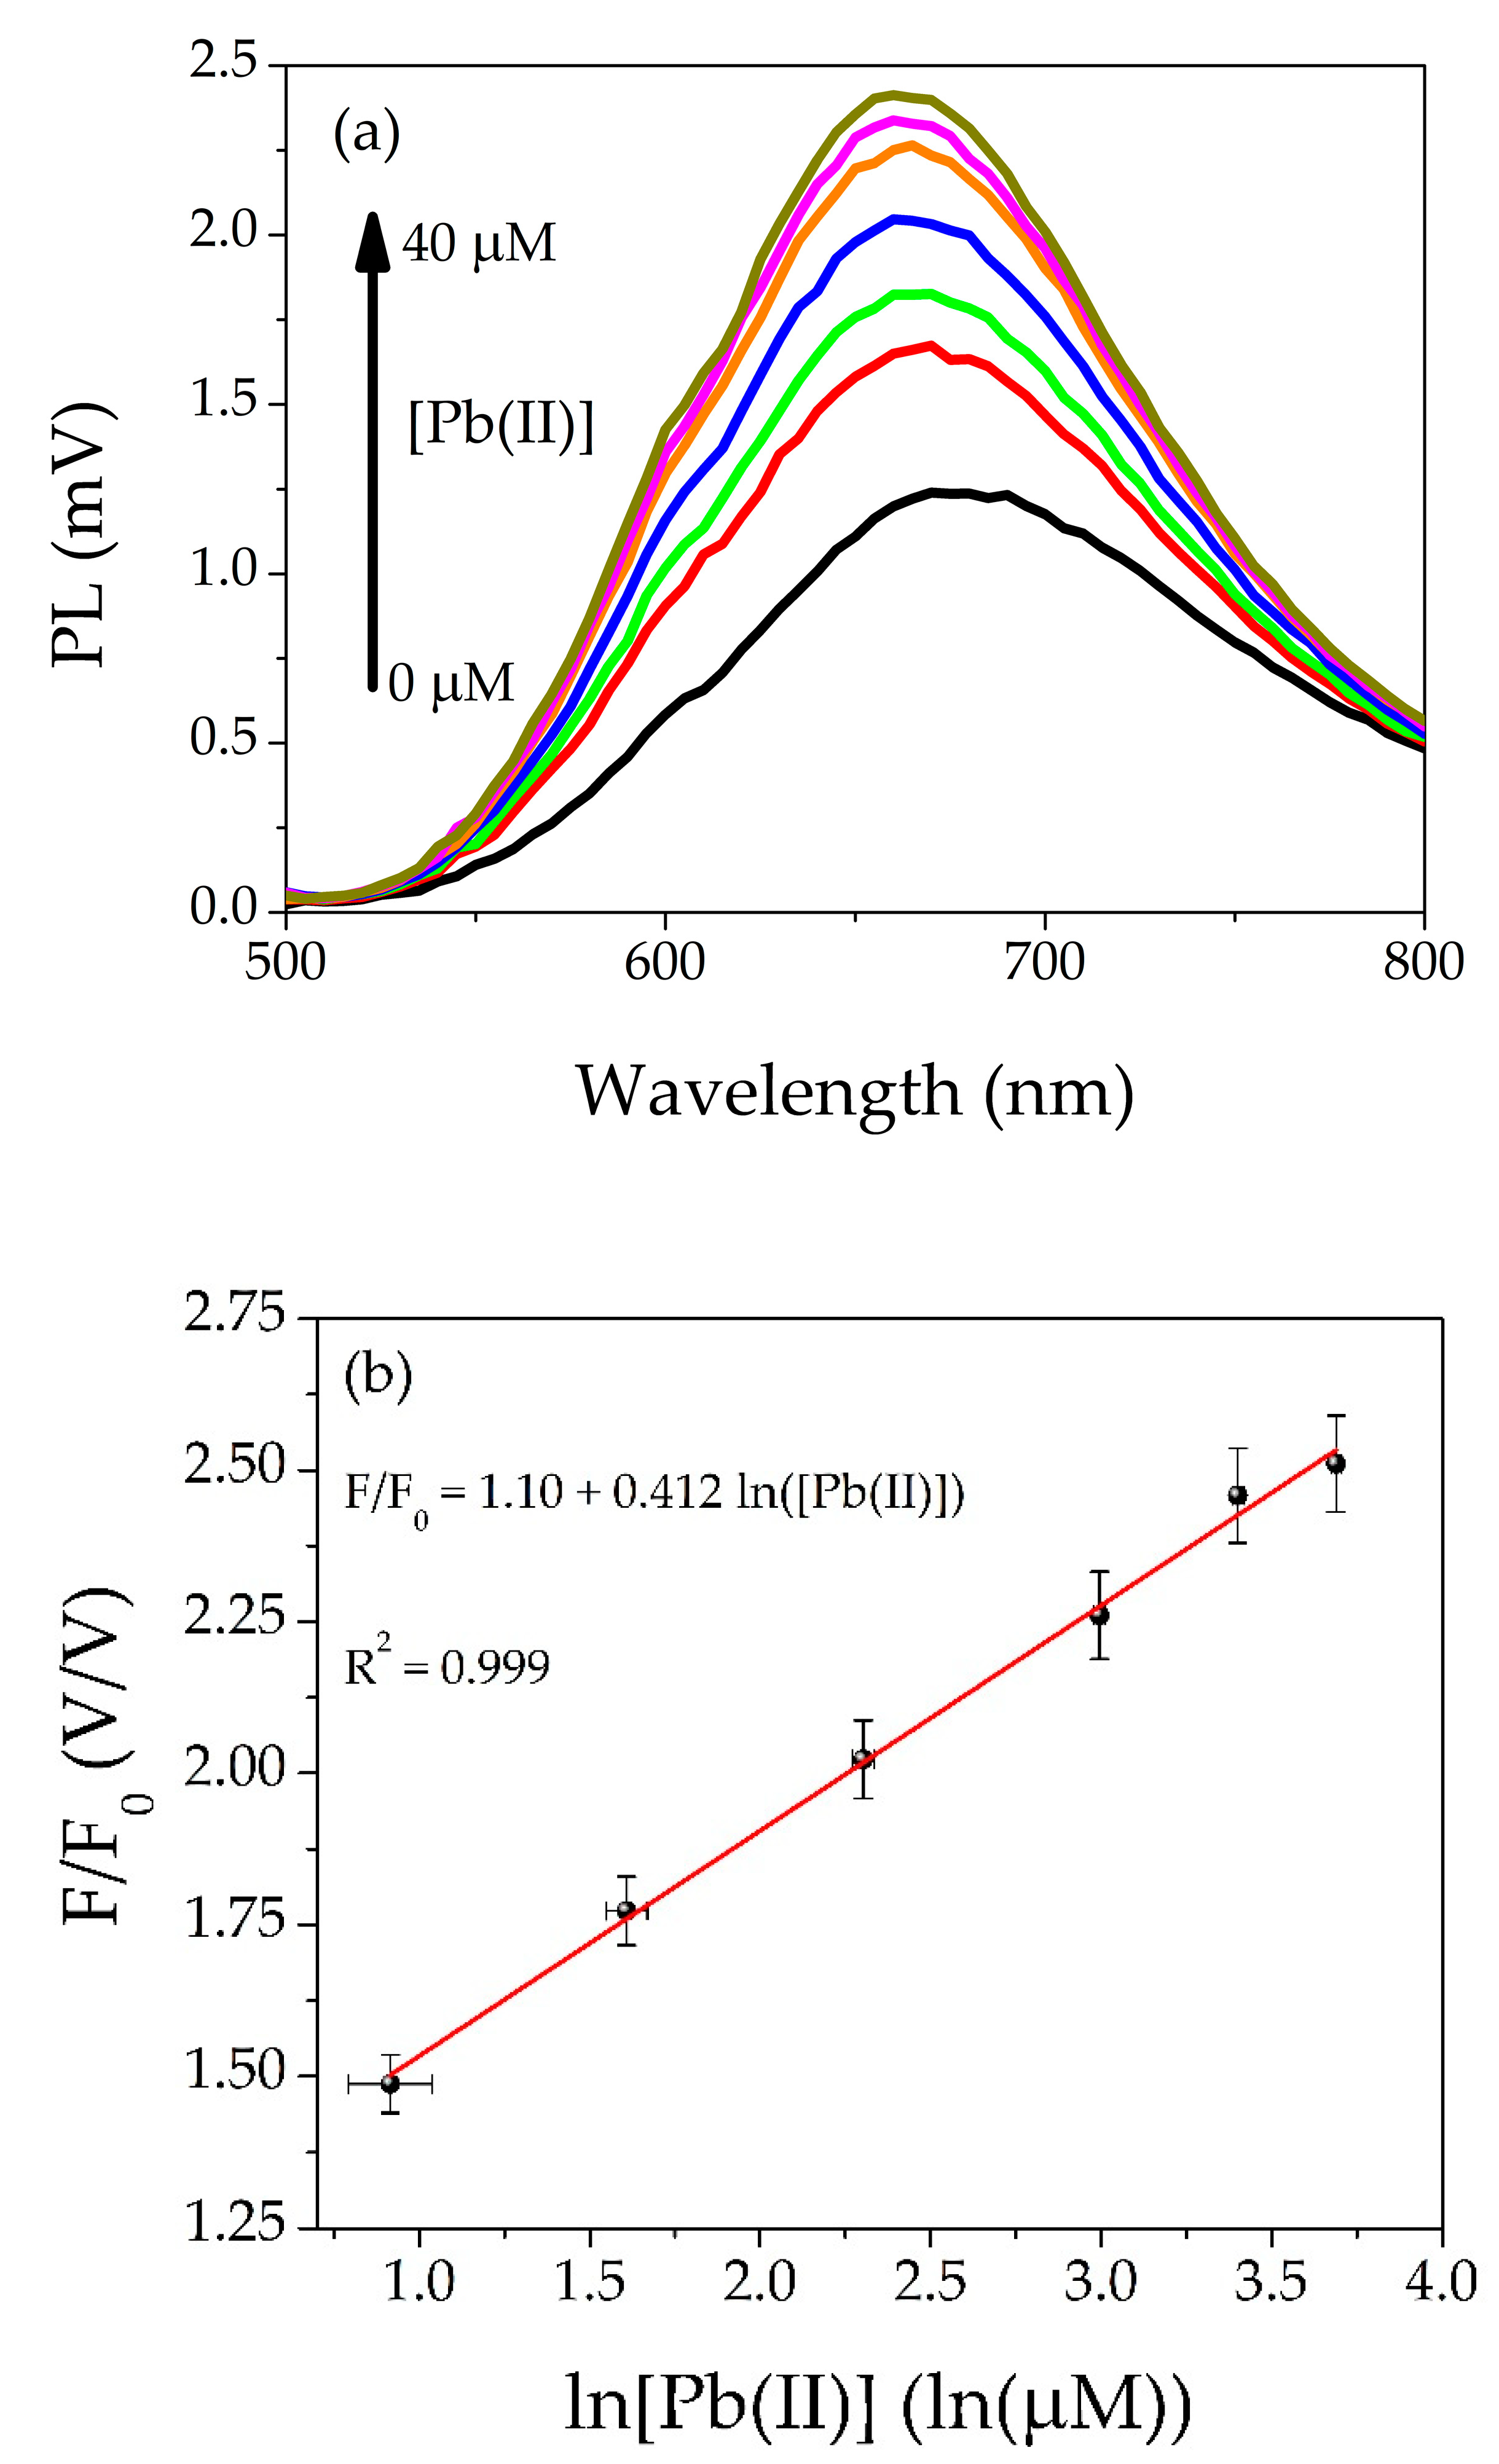
3.2. Calibration Curve

The calibration curve was accomplished varying the concentration of Pb(II) ions inside the cuvettes with the AgNCs solution. The cuvettes were stored at room temperature and in the dark for 24 h before the test. Table 2 shows the concentrations of Pb(II) and the volumes employed in cuvettes, respectively (see SI Sections S5 and S6 for error analysis). The photoemission spectra of AgNCs solution in presence of lead ions are shown in Figure 5a: the increase in emission is proportional to the Pb(II) concentration. An example of the calibration curve is shown in Figure 5b, where the ratio F/F0 as a function of logarithm of Pb(II) concentration is plotted; F and F0 represent the maximum value of the AgNCs emission with and without Pb(II) ions, respectively. In Figure 5b, the best fit of experimental data is also reported, in red color. The values of the fitting coefficients and R2 are reported in Table S2.
The quantum yield (QY) of AgNCs-PMAA solution with and without lead pollution was also measured, by using an indirect method based on 430 nm as excitation wavelength and Rhodamine B as reference [31,32]. A QY of 0.2% was found for neat AgNCs solution and 0.4% for the case of 30 μM of Pb(II). The description of the results is reported in the supporting information (Section S7).

3.3. Test Solutions

Four different Test solutions have been prepared inside and outside the range of calibration curve to test the ability of the procedure to detect the sample concentration of Pb(II). By using the linear fit and the measured emission of the silver nanoclusters solution contaminated by the Test solutions, it was possible to determine the lead concentration inside the cuvette as follows:
[ P b ] = e ( F F 0 a ) / b ,
where a and b represent the intercept and the slope of the linear fit, respectively. The initial concentrations of Test solutions before the dilution in the cuvettes were calculated by the simple dilution formula:
Ci = Cf × Vf/Vi,
where Vi is the volume injected into the cuvette, Vf is the final volume in the cuvette, and Cf is [Pb(II)], calculated by applying formula (1). Ci is the concentration of the Test solution to be determined.
Table 3 shows the Test solutions with the nominal concentrations (second column) and the concentrations extrapolated by the fluorescence method and the effective ones measured by ICP-OES. The estimated values obtained from our procedure are in good agreement with the nominal initial concentrations and with the measured concentrations by ICP-OES method considering the experimental errors (see the SI Section S8 for the detailed analysis). For the highest concentrations of the Test (A and B samples), the fluorescence method underestimates the real values. We ascribed this behavior to the adsorption dynamics mentioned above in the text. At high concentrations, the two types of adsorption sites (inner and external sites, see Figure 4) play a role in the kinetics of interaction, each with its characteristic time and the 24 h of interaction time between the pollutant ions and the probing AgNCs could possibly not be long enough to reach an equilibrium. On the contrary, for the low concentrations (sample C and D), the faster adsorption rate for the external sites dominates the kinetics.
The precision (or relative standard deviation, RSD) is defined as the relative error of a measurement [33], whereby a low relative error means a good precision (and vice versa). In our method, the precision is concentration dependent; indeed, for the higher Test concentrations, it was calculated as 21% and 19% for samples A and B, respectively; meanwhile, for samples C and D, the values of 15% and 10% were found, respectively. A more precise evaluation for samples A and B can be obtained by interacting Pb(II) ions with AgNCs solution for a longer time. The discrepancy of a measurement also has to be considered, which is the difference between the measured values (fluorescence method) and the reference ones (ICP-OES) [33]; it is clear from Table 3 that the discrepancy again depends on the concentrations of Test samples, the overall behaviour underlines low discrepancy values for low concentrations, and conversely for samples with high concentrations. In all cases, the discrepancies are not significant; indeed, the values and the estimated errors by our fluorescent method overlap the ICP-OES values.

3.4. Real Water Tests

Two different mineral waters (W1 and W2) were purchased and contaminated with specific concentration of Pb(II). The same fluorescent method described for the Test solutions was applied. The main trend reflects the results found in model water, the underestimation of high contaminant concentrations (samples W1-A, W1-B, W2-A and W2-B) with a less precision, and for low Pb(II) quantities (sample W1-C, W1-D, W2-C and W2-D) a more precise estimation. The results are shown in Table 4. For sake of clarity, the adding of not Pb(II)-polluted mineral waters to the AgNCs solution does not produce any detectable changes in the emission of the nanoclusters.
In this framework, it is important to underline that the lower concentration range is more interesting in practical environmental applications, since for waters to be considered as drinkable, the World Health Organization suggests an upper limit of Pb(II) equal to 50 nM [34]. In general, the concentration of the emissive species can affect the sensitivity to pollutants; indeed, in this study, by diluting 10-fold the mother solution of AgNCs-PMAA, a LOD (limit of detection) of 800 nM was obtained, while in our previous work [25], a LOD = 60 nM was reached, when the dilution was set at 20-fold. This indicates that this method can be tuned in accordance to the desired range of study. Finally, the results show the overall protocol is more precise when the Pb(II) ions are present in low concentrations, and therefore, its applicability in real waters can be taken into account.
The precision of our protocol (especially at low concentrations) is inside the range (from 2% to 13%) of those found in the literature [35,36,37,38,39,40], that exploit fluorescence spectroscopy and photoactive materials. A comparative table with the literature is shown in the supporting information (Table S4).
A final point to be underlined is that the synthesis of AgNCs-PMAA is easy and cheap compared with sophisticated procedures, multi-step and expensive materials as reported in the literature [41,42,43,44,45,46]. This is a strength of our method since the ease of synthesis makes the process scalable on large quantities and even on an industrial scale.

4. Conclusions

In this paper, we reported an experimental protocol to determine the Pb(II) concentration in model waters. The method is based on the fluorescence spectroscopy using a colloidal solution of AgNCs as a standard sensible element to Pb(II) ions. Such a solution increases its emission in a well-defined way in the presence of a specific amount of the pollutant. Through a calibration curve of the fluorescence intensity of silver nanoclusters solution as a function of lead ions present in the solutions, it was possible to determine the concentrations of ad hoc-prepared Pb(II) solutions and in intentionally polluted mineral waters.
The interaction time is a limiting aspect especially for high concentrations, since it affects the overall precision of the method. Despite this limit, the obtained results were compared with an ICP-OES analysis, and the agreement between the results of the two analyses confirmed the validity of the proposed protocol. A precision of 10% was found for the lowest Pb(II) concentration, while for high concentrations, the precision was a bit smaller, but in line with the literature. We discussed this behavior in terms of partial stabilization among the AgNCs solution and Pb(II) ions depending on the interaction times.

Supplementary Materials

The following supporting information can be downloaded at: https://www.mdpi.com/article/10.3390/chemosensors10100385/s1, Figure S1: Selectivity tests on the AgNCs-PMAA solution. Figure S2: Interference tests on the AgNCs-PMAA solution. Table S1: Pb(II) concentrations and their errors, in normal and logarithm forms. Table S2: Parameters calculated by the fitting process. Table S3: Parameters for the determination of quantum yield of the AgNCs samples. Figure S3: Concentrations of the Tests determined by synthesis (red bars), fluorescence method (green bars) and ICP-OES (blue bars). Table S4: Composition of commercial mineral waters. Table S5: Comparative table about the precision (RSD) of different fluorescent materials.

Author Contributions

Methodology, resources, software, data curation, formal analysis, visualization: L.B. and V.M. ICP-OES analysis: E.N. and M.S. Conceptualization, investigation, validation: L.B. and V.M. Writing—original draft preparation: L.B. Writing—review and editing: P.P., F.D.M. and R.F. Supervision, project administration, funding acquisition: P.P. All authors have read and agreed to the published version of the manuscript.

Funding

The project A0375-2020-36521 (CUP: E85F21002440002) FACS (Filtraggio acque contaminate tramite sistemi nanostrutturati) has received funding from the Regione Lazio (Italy) by “Gruppi di ricerca 2020”—POR FESR Lazio 2014-2020.

Institutional Review Board Statement

Not applicable.

Informed Consent Statement

Not applicable.

Data Availability Statement

Not applicable.

Acknowledgments

The authors gratefully acknowledge Maria Bastianini of the Prolabin & Tefarm Company for the ICP-OES measurements.

Conflicts of Interest

The authors declare no conflict of interest. The funders had no role in the design of the study, in the collection, analyses, or interpretation of data, in the writing of the manuscript, or in the decision to publish the results.

References

  1. Ramamurthy, A.S.; Memarian, R. Phytoremediation of Mixed Soil Contaminants. Water Air Soil Pollut. 2012, 223, 511–518. [Google Scholar] [CrossRef]
  2. Hansda, A.; Kumar, V.; Usmani, Z. Phytoremediation of heavy metals contaminated soil using plant growth promoting rhizobacteria (PGPR): A current perspective. Recent Res. Sci. Technol. 2014, 6, 131–134. [Google Scholar]
  3. Govind, P.; Madhuri, S. Heavy metals causing toxicity in humans, animals and environment. Res. J. Anim. Vet. Fish. Sci. 2014, 2, 17–23. [Google Scholar]
  4. Raj, D.; Maiti, S.K. Sources, bioaccumulation, health risks and remediation of potentially toxic metal(loid)s (As, Cd, Cr, Pb and Hg): An epitomised review. Environ. Monit. Assess. 2020, 192, 108–208. [Google Scholar] [CrossRef]
  5. Islam, A.; Zaidi, N.; Ahmad, H.; Kumar, S. Functionalized carbon nanotubes for dispersive solid-phase extraction and atomic absorption spectroscopic determination of toxic metals ions. Int. J. Environ. Sci. Technol. 2019, 16, 707–718. [Google Scholar] [CrossRef]
  6. Vojoudi, H.; Badiei, A.; Amiri, A.; Banaei, A.; Ziarani, G.M.; Schenk-Joß, K. Pre-concentration of Zn(II) ions from aqueous solutions using meso-porous pyridine-enrobed magnetite nanostructures. Food Chem. 2018, 257, 189–195. [Google Scholar] [CrossRef]
  7. Jiang, Y.; Liu, C.; Huang, A. EDTA-Functionalized Covalent Organic Framework for the Removal of Heavy-Metal Ions. ACS Appl. Mater. Interfaces 2019, 11, 32186–32191. [Google Scholar] [CrossRef]
  8. Wang, Y.; Liu, R. H2O2 treatment enhanced the heavy metals removal by manure biochar in aqueous solutions. Sci. Total Environ. 2018, 629, 1139–1148. [Google Scholar] [CrossRef]
  9. Thirumalai, M.; Kumar, S.N.; Prabhakaran, D.; Sivaraman, N.; Maheswari, M.A. Dynamically modified C18 silica monolithic column for the rapid determinations of lead, cadmium and mercury ions by reversed-phase high-performance liquid chromatography. J. Chromatogr. A 2018, 1569, 62–69. [Google Scholar] [CrossRef]
  10. Michalski, R. Ion Chromatography Applications in Wastewater Analysis. Separations 2018, 5, 16. [Google Scholar] [CrossRef]
  11. Fan, H.; Ma, X.; Zhou, S.; Huang, J.; Liu, Y.; Liu, Y. Highly efficient removal of heavy metal ions by carboxymethyl cellulose-immobilized Fe3O4 nanoparticles prepared via high-gravity technology. Carbohydr. Polym. 2019, 213, 39–49. [Google Scholar] [CrossRef]
  12. Xu, J.; Liu, C.; Hsu, P.C.; Zhao, J.; Wu, T.; Tang, J.; Liu, K.; Cui, Y. Remediation of heavy metal contaminated soil by asymmetrical alternating current electrochemistry. Nat. Commun. 2019, 10, 2440. [Google Scholar] [CrossRef] [Green Version]
  13. Farrukh, M.A. Atomic Absorption Spectroscopy, 1st ed.; Akhyar Farrukh, M., Ed.; InTech: London, UK, 2012; ISBN 978-953-307-817-5. [Google Scholar]
  14. Zhou, F.; Li, C.; Zhu, H.; Li, Y. A novel method for simultaneous determination of zinc, nickel, cobalt and copper based on UV–vis spectrometry. Optik 2019, 182, 58–64. [Google Scholar] [CrossRef]
  15. Alorabi, A.Q.; Abdelbaset, M.; Zabin, S.A. Colorimetric Detection of Multiple Metal Ions Using Schiff Base 1-(2-Thiophenylimino)-4-(N-dimethyl)benzene. Chemosensors 2020, 8, 1. [Google Scholar] [CrossRef]
  16. Burratti, L.; Ciotta, E.; De Matteis, F.; Prosposito, P. Metal Nanostructures for Environmental Pollutant Detection Based on Fluorescence. Nanomaterials 2021, 11, 276. [Google Scholar] [CrossRef]
  17. Wang, Z.; Xiao, X.; Zou, T.; Yang, Y.; Xing, X.; Zhao, R.; Wang, Z.; Wang, Y. Citric Acid Capped CdS Quantum Dots for Fluorescence Detection of Copper Ions (II) in Aqueous Solution. Nanomaterials 2018, 9, 32. [Google Scholar] [CrossRef]
  18. Bi, J.; Li, T.; Ren, H.; Ling, R.; Wu, Z.; Qin, W. Capillary electrophoretic determination of heavy-metal ions using 11-mercaptoundecanoic acid and 6-mercapto-1-hexanol co-functionalized gold nanoparticle as colorimetric probe. J. Chromatogr. A 2019, 1594, 208–215. [Google Scholar] [CrossRef]
  19. Oluwafemi, O.S.; Anyik, J.L.; Zikalala, N.E.; Sakho, E.H.M. Biosynthesis of silver nanoparticles from water hyacinth plant leaves extract for colourimetric sensing of heavy metals. Nano-Struct. Nano-Objects 2019, 20, 100387–100391. [Google Scholar] [CrossRef]
  20. Xiao, N.; Dong, J.X.; Liu, S.G.; Li, N.; Fan, Y.Z.; Ju, Y.J.; Li, N.B.; Luo, H.Q. Multifunctional fluorescent sensors for independent detection of multiple metal ions based on Ag nanoclusters. Sens. Actuators B Chem. 2018, 264, 184–192. [Google Scholar] [CrossRef]
  21. Gao, P.; Wu, S.; Chang, X.; Liu, F.; Zhang, T.; Wang, B.; Zhang, K.-Q. Aprotinin Encapsulated Gold Nanoclusters: A Fluorescent Bioprobe with Dynamic Nuclear Targeting and Selective Detection of Trypsin and Heavy Metal. Bioconjug. Chem. 2018, 29, 4140–4148. [Google Scholar] [CrossRef] [PubMed]
  22. Bolli, E.; Mezzi, A.; Burratti, L.; Prosposito, P.; Casciardi, S.; Kaciulis, S. X-ray and UV photoelectron spectroscopy of Ag nanoclusters. Surf. Interface Anal. 2020, 52, 1017–1022. [Google Scholar] [CrossRef]
  23. Singh, J.; Kaur, S.; Lee, J.; Mehta, A.; Kumar, S.; Kim, K.-H.; Basu, S.; Rawat, M. Highly fluorescent carbon dots derived from Mangifera indica leaves for selective detection of metal ions. Sci. Total Environ. 2020, 720, 137604–137612. [Google Scholar] [CrossRef]
  24. Yarur, F.; Macairan, J.-R.; Naccache, R. Ratiometric detection of heavy metal ions using fluorescent carbon dots. Environ. Sci. Nano 2019, 6, 1121–1130. [Google Scholar] [CrossRef]
  25. Burratti, L.; Ciotta, E.; Bolli, E.; Kaciulis, S.; Casalboni, M.; De Matteis, F.; Garzón-Manjón, A.; Scheu, C.; Pizzoferrato, R.; Prosposito, P. Fluorescence enhancement induced by the interaction of silver nanoclusters with lead ions in water. Colloids Surfaces A Physicochem. Eng. Asp. 2019, 579, 123634–123642. [Google Scholar] [CrossRef]
  26. Burratti, L.; Ciotta, E.; Bolli, E.; Casalboni, M.; De Matteis, F.; Francini, R.; Casciardi, S.; Prosposito, P. Synthesis of fluorescent silver nanoclusters with potential application for heavy metal ions detection in water. AIP Conf. Proc. 2019, 2145, 020007–020012. [Google Scholar]
  27. Shang, L.; Dong, S. Facile preparation of water-soluble fluorescent silver nanoclusters using a polyelectrolyte template. Chem. Commun. 2008, 9, 1088–1090. [Google Scholar] [CrossRef]
  28. Ruiz-Pérez, L.; Pryke, A.; Sommer, M.; Battaglia, G.; Soutar, I.; Swanson, L.; Geoghegan, M. Conformation of poiy(methacrylic acid) chains in dilute aqueous solution. Macromolecules 2008, 41, 2203–2211. [Google Scholar] [CrossRef]
  29. de Groot, G.W.; Santonicola, M.G.; Sugihara, K.; Zambelli, T.; Reimhult, E.; Vörös, J.; Vancso, G.J. Switching Transport through Nanopores with pH-Responsive Polymer Brushes for Controlled Ion Permeability. ACS Appl. Mater. Interfaces 2013, 5, 1400–1407. [Google Scholar] [CrossRef]
  30. Wang, X.; Ye, X.; Zhang, G. Investigation of pH-induced conformational change and hydration of poly(methacrylic acid) by analytical ultracentrifugation. Soft Matter 2015, 11, 5381–5388. [Google Scholar] [CrossRef]
  31. Weber, G.; Teale, F.W.J. Determination of the absolute quantum yield of fluorescent solutions. Trans. Faraday Soc. 1957, 53, 646–651. [Google Scholar] [CrossRef]
  32. Casalboni, M.; De Matteis, F.; Prosposito, P.; Quatela, A.; Sarcinelli, F. Fluorescence efficiency of four infrared polymethine dyes. Chem. Phys. Lett. 2003, 373, 372–378. [Google Scholar] [CrossRef]
  33. Taylor, J.R. An Introduction to Error Analysis. The Study of Uncertainties in Physical Measurements, 2nd ed.; University Science Books: Sausalito, CA, USA, 1982; ISBN 9780935702750. [Google Scholar]
  34. WHO. Chemical aspects. In Guideline for Drinking Water, 4th ed.; World Health Organization: Geneva, Switzerland, 2017; pp. 155–201. [Google Scholar]
  35. Jiang, X.; Zhang, H.; Yang, C.; Xia, J.; Liu, G.; Luo, X. A novel electrostatic drive strategy to prepare glutathione-capped gold nanoclusters embedded quaternized cellulose membranes fluorescent colorimetric sensor for Pb(II) and Hg(II) ions detection. Sensors Actuators B Chem. 2022, 368, 132046. [Google Scholar] [CrossRef]
  36. Li, S.; Li, G.; Shi, H.; Yang, M.; Tan, W.; Wang, H.; Yang, W. A fluorescent probe based on tryptophan-coated silver nanoclusters for copper (II) ions detection and bioimaging in cells. Microchem. J. 2022, 175, 107222. [Google Scholar] [CrossRef]
  37. Mao, A.; Wei, C. Cytosine-rich ssDNA-templated fluorescent silver and copper/silver nanoclusters: Optical properties and sensitive detection for mercury(II). Microchim. Acta 2019, 186, 541. [Google Scholar] [CrossRef]
  38. Wang, L.; Cao, H.-X.; He, Y.-S.; Pan, C.-G.; Sun, T.-K.; Zhang, X.-Y.; Wang, C.-Y.; Liang, G.-X. Facile preparation of amino-carbon dots/gold nanoclusters FRET ratiometric fluorescent probe for sensing of Pb2+/Cu2+. Sens. Actuators B Chem. 2019, 282, 78–84. [Google Scholar] [CrossRef]
  39. Ghosh, S.; Bhamore, J.R.; Malek, N.I.; Murthy, Z.V.P.; Kailasa, S.K. Trypsin mediated one-pot reaction for the synthesis of red fluorescent gold nanoclusters: Sensing of multiple analytes (carbidopa, dopamine, Cu2+, Co2+ and Hg2+ ions). Spectrochim. Acta Part A Mol. Biomol. Spectrosc. 2019, 215, 209–217. [Google Scholar] [CrossRef]
  40. Liu, J.; Xue, H.; Liu, Y.; Bu, T.; Jia, P.; Shui, Y.; Wang, L. Visual and fluorescent detection of mercury ions using a dual-emission ratiometric fluorescence nanomixture of carbon dots cooperating with gold nanoclusters. Spectrochim. Acta Part A Mol. Biomol. Spectrosc. 2019, 223, 117364. [Google Scholar] [CrossRef]
  41. Yonesato, K.; Ito, H.; Itakura, H.; Yokogawa, D.; Kikuchi, T.; Mizuno, N.; Yamaguchi, K.; Suzuki, K. Controlled Assembly Synthesis of Atomically Precise Ultrastable Silver Nanoclusters with Polyoxometalates. J. Am. Chem. Soc. 2019, 141, 19550–19554. [Google Scholar] [CrossRef]
  42. Zhang, Y.; Lv, M.; Gao, P.; Zhang, G.; Shi, L.; Yuan, M.; Shuang, S. The synthesis of high bright silver nanoclusters with aggregation-induced emission for detection of tetracycline. Sens. Actuators B Chem. 2021, 326, 129009. [Google Scholar] [CrossRef]
  43. Shah, P.; Nagda, R.; Jung, I.L.; Bhang, Y.J.; Jeon, S.-W.; Lee, C.S.; Do, C.; Nam, K.; Kim, Y.M.; Park, S.; et al. Noncanonical Head-to-Head Hairpin DNA Dimerization Is Essential for the Synthesis of Orange Emissive Silver Nanoclusters. ACS Nano 2020, 14, 8697–8706. [Google Scholar] [CrossRef] [PubMed]
  44. Yang, X.; Wang, L.; Pang, L.; Fu, S.; Qin, X.; Chen, Q.; Man, C.; Jiang, Y. A novel fluorescent platform of DNA-stabilized silver nanoclusters based on exonuclease III amplification-assisted detection of Salmonella Typhimurium. Anal. Chim. Acta 2021, 1181, 338903. [Google Scholar] [CrossRef] [PubMed]
  45. Liu, K.-G.; Gao, X.-M.; Liu, T.; Hu, M.-L.; Jiang, D. All-Carboxylate-Protected Superatomic Silver Nanocluster with an Unprecedented Rhombohedral Ag 8 Core. J. Am. Chem. Soc. 2020, 142, 16905–16909. [Google Scholar] [CrossRef] [PubMed]
  46. Lee, C.-Y.; Lin, S.-W.; Wu, Y.-H.; Hsieh, Y.-Z. Combining DNA-stabilized silver nanocluster synthesis with exonuclease III amplification allows label-free detection of coralyne. Anal. Chim. Acta 2018, 1042, 86–92. [Google Scholar] [CrossRef] [PubMed]
Figure 1. Schematic representation of fluorescence spectroscopy set-up.
Chemosensors 10 00385 g001
Figure 2. Stability of the AgNCs solution under different conditions: continuous lighting (black line, only for the first hour), covering the light beam (red curve), warming up process (blue line), cooling down treatment (green curve). The lines are only guides for the eye connecting the experimental points. The errors are included in the points, but are small and not visible on this scale.
Chemosensors 10 00385 g002
Figure 3. Time dependence of AgNCs solution polluted with Pb(II) at 2.5 μM (black points) and 30 μM (red points).
Chemosensors 10 00385 g003
Figure 4. Schematic representation of AgNCs with active sites and hypothesis of Pb(II) adsorption process: (a) AgNCs (grey spheres) surrounded by PMAA chains (orange lines) before the interaction, the active sites are indicated with green spots; (b) the lead(II) ions (red spots) mainly interact with the external sites (green dots), and subsequently with the inner ones (blue and purple dots); (c) spatial differentiation of active sites.
Chemosensors 10 00385 g004
Figure 5. (a) Photoemission spectra of AgNCs solution as a function of different concentrations of Pb(II) from 0 to 40 µM; (b) an example of linear fit of experimental points.
Chemosensors 10 00385 g005
Table 1. Metal ions tested in the selectivity and interference experiments.
Metal PrecursorIon in SolutionMetal PrecursorIon in Solution
AsO2NaAs(III)Hg(NO3)2Hg(II)
HAsO4Na2As(V)KClO4K(I)
Ca(ClO4)2*4H2OCa(II)Mg(ClO4)2Mg(II)
Cd(NO3)2*4H2OCd(II)NaNO2Na(I)
CoCl2*6H2OCo(II)NiCl2*6H2ONi(II)
CrCl3*6H2OCr(III)Pb(NO3)2Pb(II)
Cu(NO3)2*H2OCu(II)Zn(NO3)2*6H2OZn(II)
FeCl3*6H2OFe(III)
Table 2. Calibration points: concentrations and respective volumes injected from Reference solution.
Concentration of Pb(II) in Cuvette (μM)Volume from Reference Solution (μL)
2.5 ± 0.31.25 ± 0.14
5.0 ± 0.32.50 ± 0.14
10.0 ± 0.45.00 ± 0.14
20.0 ± 0.410.00 ± 0.14
30.0 ± 0.515.00 ± 0.20
40.0 ± 0.620.00 ± 0.20
Table 3. Test solutions with different initial concentration of ions.
SampleBy Synthesis (mM)Fluorescence Method (mM)ICP-OES (mM)RSD
A13.7 ± 0.112.7 ± 2.714.6 ± 0.321%
B8.27 ± 0.087.4 ± 1.48.670 ± 0.00519%
C3.72 ± 0.063.9 ± 0.63.890 ± 0.00515%
D0.57 ± 0.050.50 ± 0.050.535 ± 0.00210%
Table 4. Real water contaminated by Pb(II).
SampleBy Synthesis (mM)Fluorescence Method (mM)RSD
W1-A13.7 ± 0.111.2 ± 2.724%
W1-B8.27 ± 0.087.0 ± 1.521%
W1-C3.72 ± 0.063.0 ± 0.620%
W1-D0.57 ± 0.050.52 ± 0.0713%
W2-A13.7 ± 0.113.0 ± 3.023%
W2-B8.27 ± 0.088.0 ± 1.721%
W2-C3.72 ± 0.063.0 ± 0.620%
W2-D0.57 ± 0.050.50 ± 0.0714%
Publisher’s Note: MDPI stays neutral with regard to jurisdictional claims in published maps and institutional affiliations.

