Article

Spermine and Spermidine Detection through Restricted Intramolecular Rotations in a Tetraphenylethylene Derivative

1
Instituto Interuniversitario de Investigación de Reconocimiento Molecular y Desarrollo Tecnológico (IDM), Universitat Politècnica de València, Universitat de València, C/Doctor Moliner, 50, 46100 Valencia, Spain
2
CIBER de Bioingeniería, Biomateriales y Nanomedicina (CIBER-BBN), 28029 Madrid, Spain
*
Author to whom correspondence should be addressed.
Chemosensors 2022, 10(1), 8; https://doi.org/10.3390/chemosensors10010008
Submission received: 30 November 2021 / Revised: 16 December 2021 / Accepted: 23 December 2021 / Published: 25 December 2021

Abstract

:
Biogenic polyamines, especially spermine and spermidine, are associated with cell growth and development. These amines can be found at high concentrations in the tumor cells, tissues, and urine of cancer patients. In contrast, spermidine levels drop with age, and a possible connection between low endogenous spermidine concentrations and age-related deterioration has been suggested. Thus, the quantification of these amines in body fluids like urine could be used in the diagnosis of different pathological situations. Here a new fluorescent molecular probe based on a tetraphenylethylene derivative is reported. This probe is able to selectively detect these amines through the enhancement of the fluorescence emission of the resulting complex. This fluorescence enhancement may be related to restricted intramolecular rotations of TPE phenyl rings induced by the analyte. Theoretical studies were carried out to shed light on the observed selectivity. Finally, the detection of these amines in urine was performed with limits of detection of 0.70 µM and 1.17 µM for spermine and spermidine, respectively.

1. Introduction

The development of chromogenic or fluorogenic chemosensors for detecting biologically active molecules is a continuously progressing research area. The expansion of this field is related to the many advantages of these chemosensors, such as real-time detection, low cost, easy usage protocols, and naked-eye detection, among others [1,2,3]. Most chemosensors are designed using the binding site signaling unit approach, in which two subunits, one able to interact with the analyte and the other with chromogenic or fluorogenic properties, are covalently bound. The structure of the molecule must guarantee the analyte complexation at the binding site, inducing a change in the optical properties of the signaling unit. This, in turn, will lead to variations in the color or fluorescence emission of the chemosensor [4,5]. In this way, the information at the molecular level (presence of the analyte) is amplified at a macroscopic level (signaling event). Even though chromogenic probes are very appealing, fluorescent systems usually allow lower limits of detection to be obtained [6]. In this sense, many fluorescent organic units, such as coumarins [7], dansyl derivatives [8], cyanines [9], and BODIPYs [10], among others, have been used. Another interesting approach is to use fluorophores with aggregation-induced emission (AIE) properties [11,12]. Molecules containing molecular rotors, such as archetypal luminogen tetraphenylethene (TPE), exhibit this AIE behavior, which is generally accepted to be caused by restricted intramolecular rotations (RIR). It is well known that intramolecular rotations can nonradiatively deactivate excited states, which leads to the quenching of fluorescence. Thus, if these intramolecular rotations are inhibited by either aggregation or an interaction with a certain analyte, enhancement of the fluorescence of the fluorophore will be observed. Although some examples of fluorescent chemosensors that display RIR-induced emissions have been reported [13,14], there are fewer publications than those based on conventional fluorophores. Of the structures displaying AIE behavior, tetraphenylethylene (TPE) derivatives have many demonstrated applications [15,16,17,18]. This versatility is related to the different possible functionalizations that can be introduced into the parent compound [19].
Biogenic polyamines, such as spermine (Spm), spermidine (Spd), putrescine (Put), and cadaverine (Cad), are aliphatic amines found in nearly all living cells. They are synthesized from arginine, ornithine, proline, and methionine [20], and are involved in multiple biological processes [21,22], like cell growth, gene regulation, differentiation, development, and immunity [23]. Intracellular polyamine levels are regulated by a complex mechanism that involves biosynthetic, catabolic, and transport processes to ensure that the concentration in cells remains within strictly controlled limits [23,24,25]. Being associated with cell growth and development, these amines can also be found at high concentrations in the tumor cells, tissues, and urine of cancer patients [26,27]. High levels of polyamines have been associated with breast, colon, lung, prostate, skin, and ovarian cancers [25,28,29,30,31,32,33]. In humans, spermidine levels drop with age, and a possible connection between low endogenous spermidine concentrations and age-related deterioration has been suggested [34].
Following our interest in developing chromogenic and fluorescent chemosensors for the detection of relevant disease biomarkers [15,35,36,37], we decided to explore the utility of a new TPE derivative in the fluorescence sensing of Spm and Spd through a RIR-induced emission mechanism. As shown in Figure 1, chemosensor 1 consists of a TPE that incorporates two carboxylic acids with a cleft disposition (Figure 1).

2. Results and Discussion

2.1. Synthesis of Chemosensor 1

The preparation of chemosensor 1 was carried out as shown in Scheme 1. Compound 2 was prepared from the reaction of 4,4´-dimethoxybenzophenone with diphenylmethane in the presence of n-BuLi [38]. The treatment of 2 with BBr3 in dichloromethane transformed the ether groups into the corresponding hydroxyl groups to give rise to compound 3 [39]. The reaction of 3 with 2 equiv of propargyl bromide in a basic medium allowed the isolation of 4. When this compound was made to react with azide 5 under the typical conditions of a “click” reaction, compound 6 was obtained. Finally, the hydrolysis of 6 led to chemosensor 1.
Compound 1 was fully characterized using 1HNMR, 13CNMR, and MS. Chemosensor 1 shows an absorption band at 341 nm (10−4 M in acetonitrile). When irradiated at 340 nm in acetonitrile, the compound was practically nonfluorescent.

2.2. Detection Studies

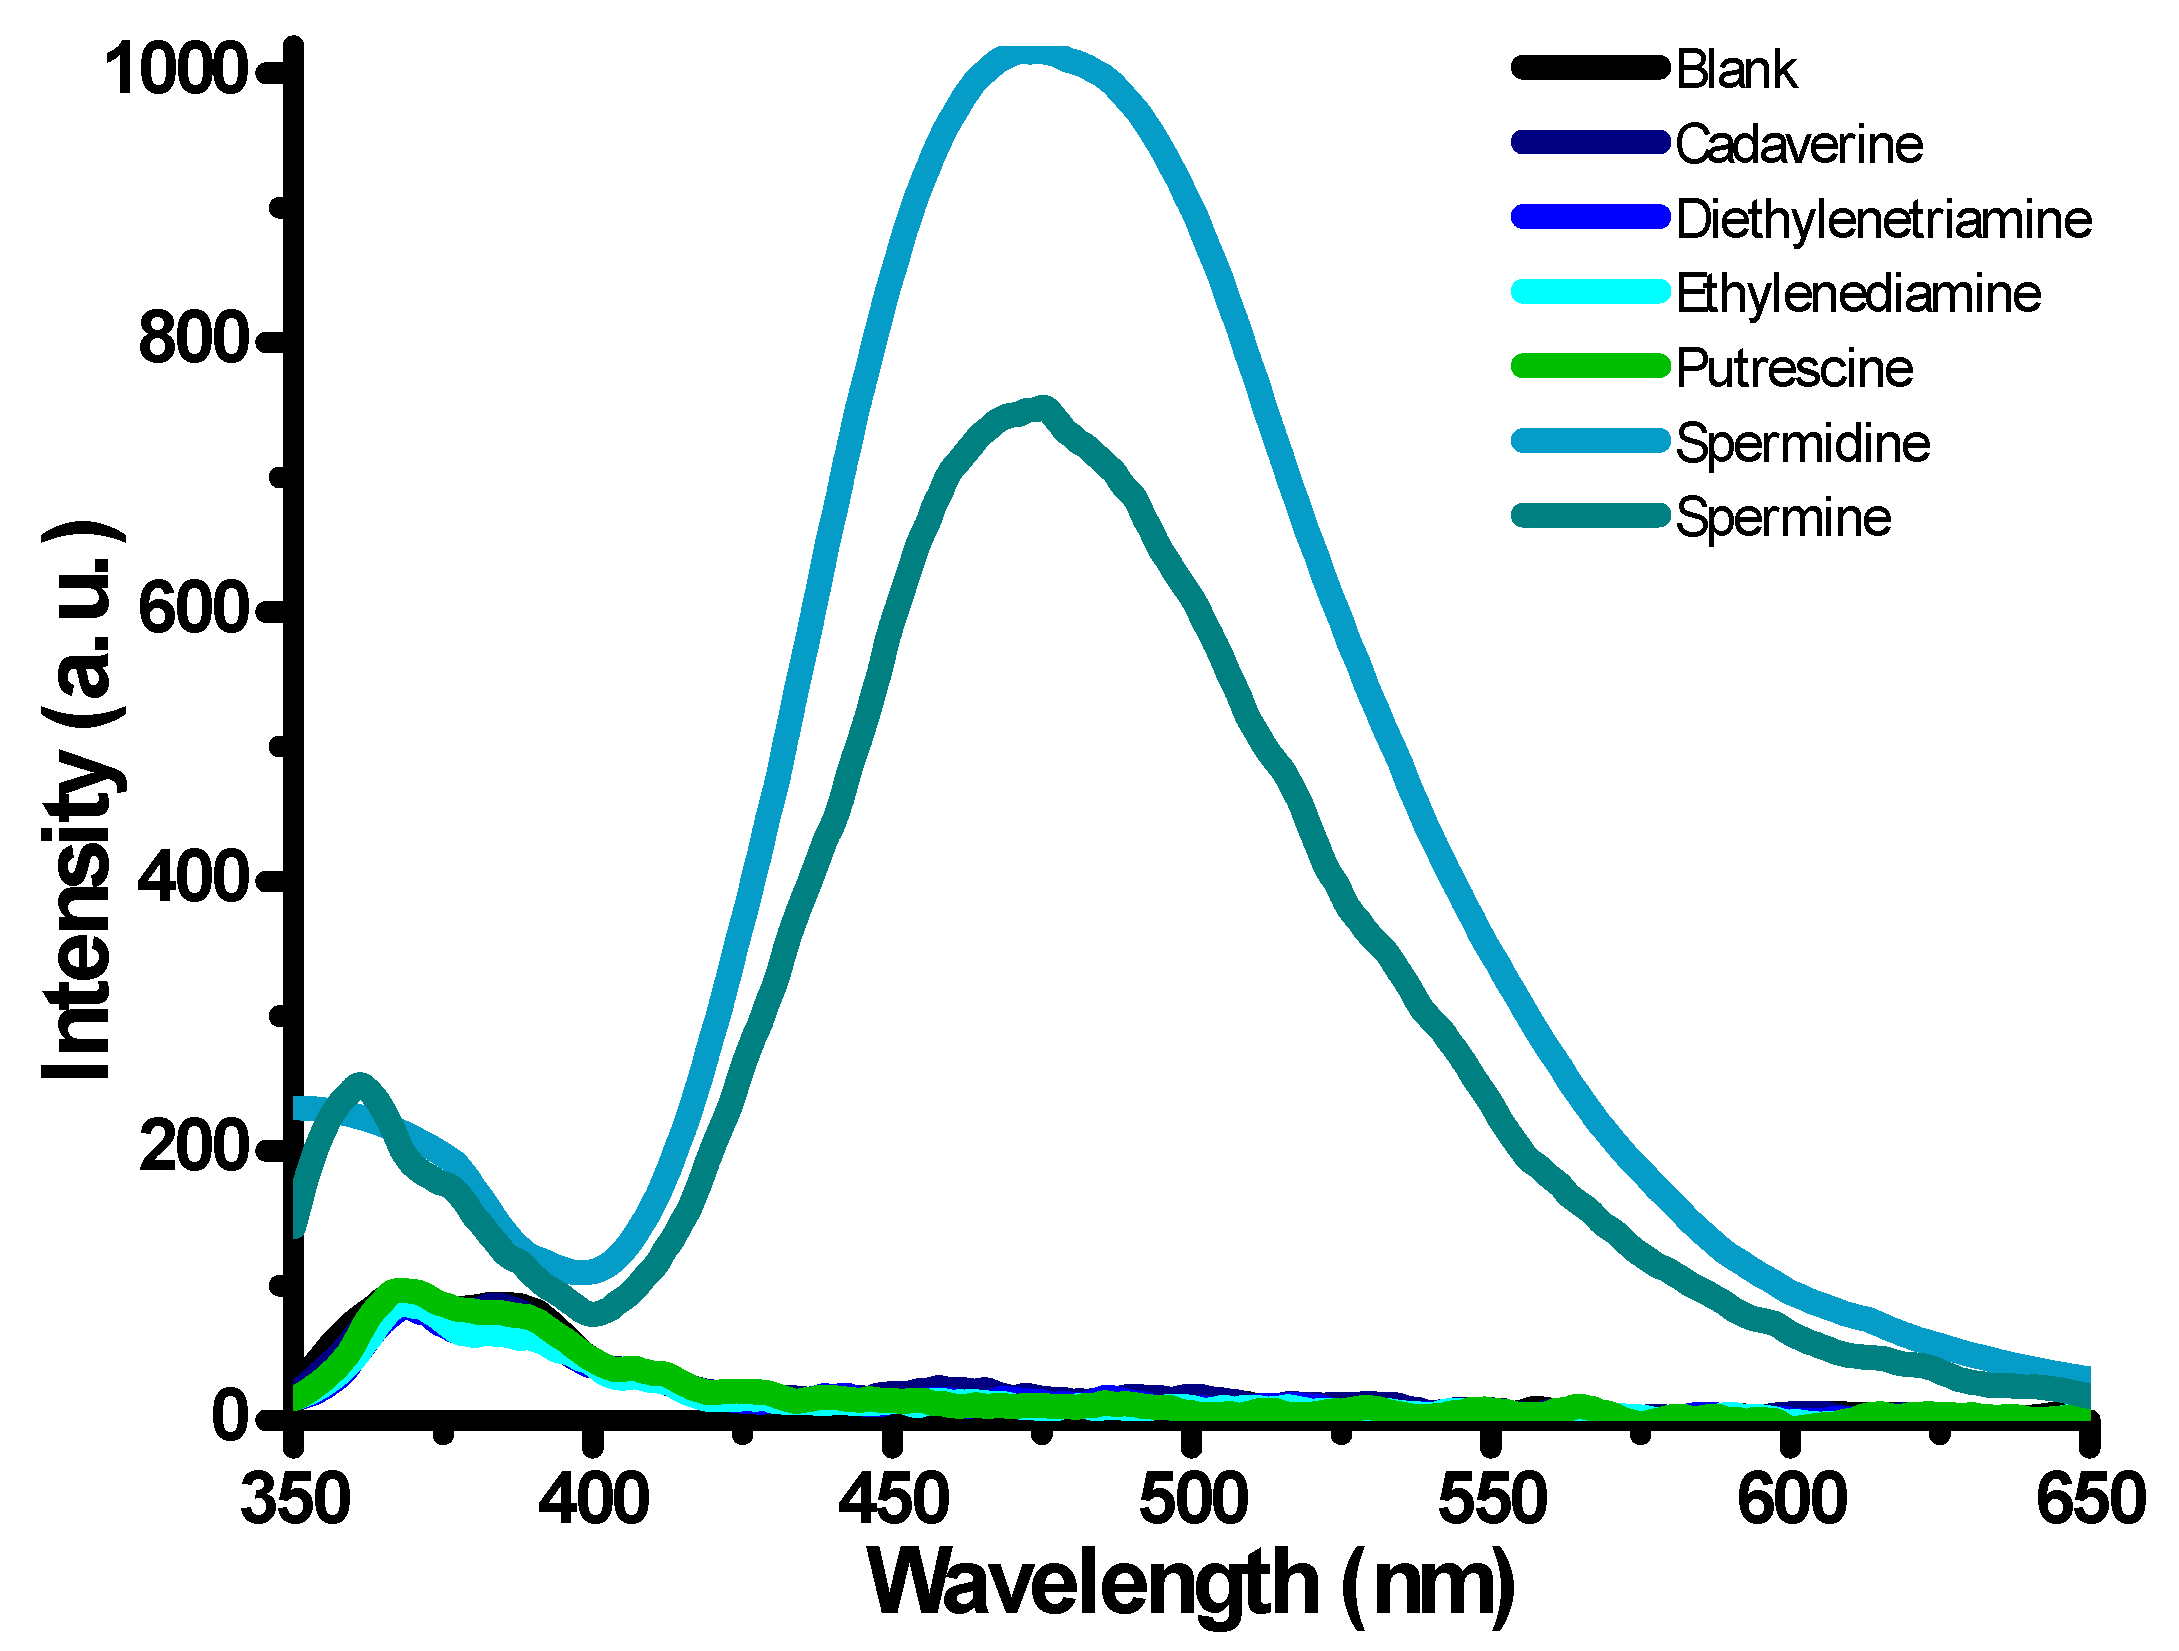
The “molecular cleft” structure of compound 1 suggested a possible double interaction with α,ω-aliphatic diamines through electrostatic and hydrogen bonding interactions between the carboxylates and the cationic ammonium groups of the amines at physiological pH. We expected this interaction to lead to significant restrictions in the intramolecular motions of the chemosensor, resulting in changes in its fluorescence emission. For this reason, the interactions between 1 and the aliphatic polyamines, ethylenediamine (ED), diethylenetriamine (Det), cadaverine (Cad), putrescine (Put), spermine (Spm), and spermidine (Spd), were evaluated. For the detection studies, two equivalents of the corresponding polyamines in buffered aqueous solutions (10−2 M in phosphate buffer, pH = 7.4) were added to a solution of compound 1 in acetonitrile (50 µM) and the emission was immediately measured. The experimental procedure was carried out in such a way that the composition of the solvent mixture was acetonitrile:water 98:2 for all the measurements. This protocol was used to avoid fluorescence modifications induced by changes in solvent polarity. As seen in Figure 2, Cad, Put, ED, and Det did not induce any significant change in the fluorescence emission of 1exc = 340 nm). Conversely, in the presence of Spm or Spd, the fluorescence emission of the sensor was remarkably enhanced at 473 nm when it was irradiated at 340 nm (ca. 60-fold increase for Spm and 80-fold increase for Spd). This strong increase in the fluorescence emission can be assigned to the restricted intramolecular rotations in 1 as a result of polyamine complexation, which gives rise to an emissive complex.

2.3. Selectivity Studies

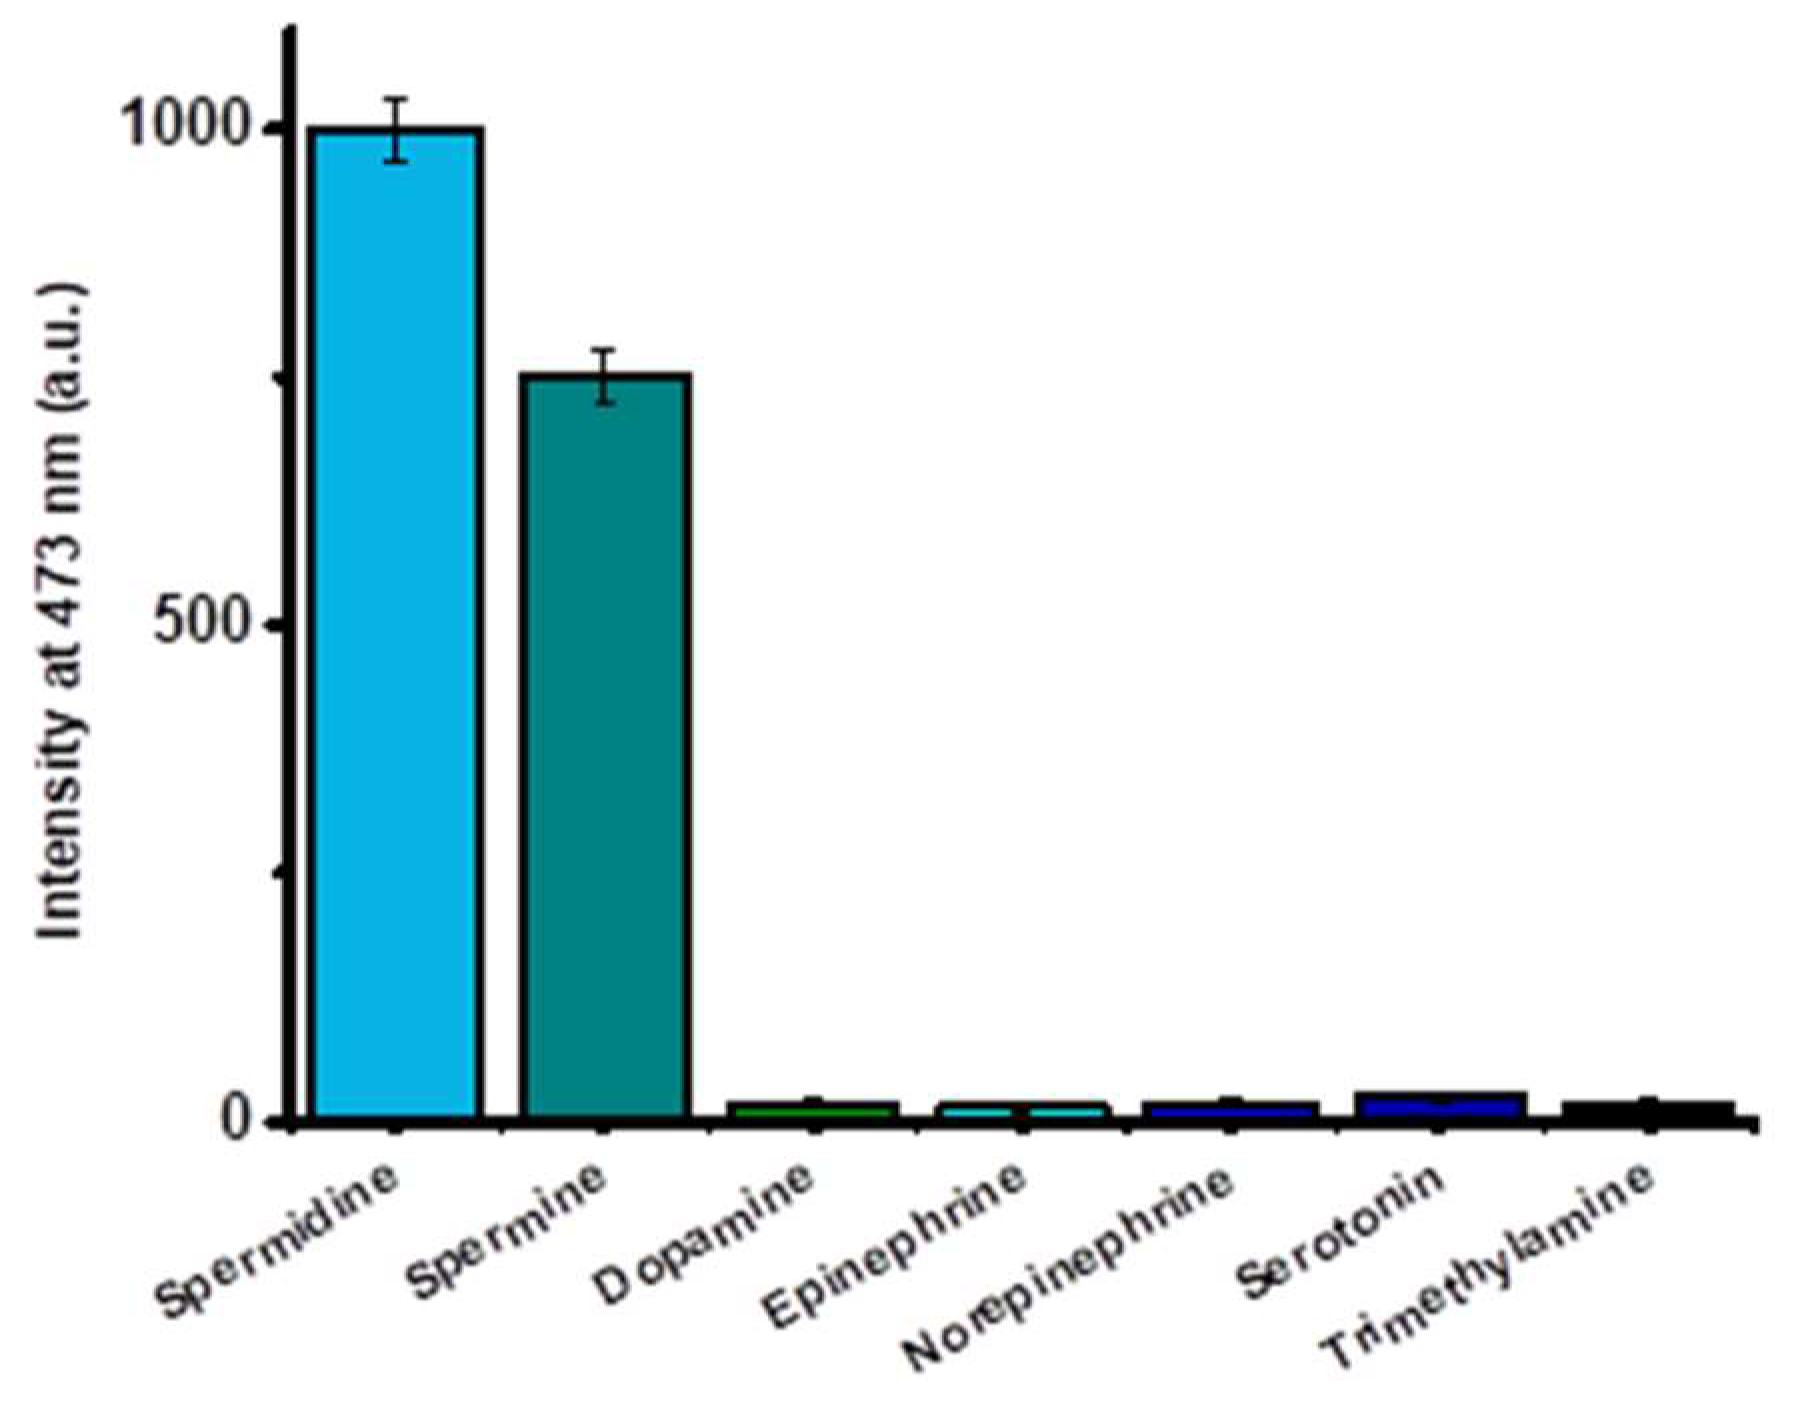
Other types of amines, such as biogenic amine neurotransmitters, can be found in body fluids. Therefore, to evaluate the selectivity of sensor 1 vs. Spm and Spd, its fluorescence response was also studied in the presence of the neurotransmitters serotonin (Stn), dopamine (Dop), epinephrine (Epi), and norepinephrine (Nor), as well as trimethylamine. A 50 µM solution of compound 1 in acetonitrile was prepared and amines were prepared in phosphate buffer following the previously described procedure. As seen in Figure 3, sensor 1 only became strongly fluorescent when it was irradiated at 340 nm in the presence of Spm and Spd, and remained silent with the other studied biomarkers. These and the previous data clearly indicate that chemosensor 1 was able to selectively detect Spm and Spd in buffered aqueous media in the presence of biogenic amine neurotransmitters and other biogenic aliphatic amines.

2.4. Sensitivity Studies in Urine

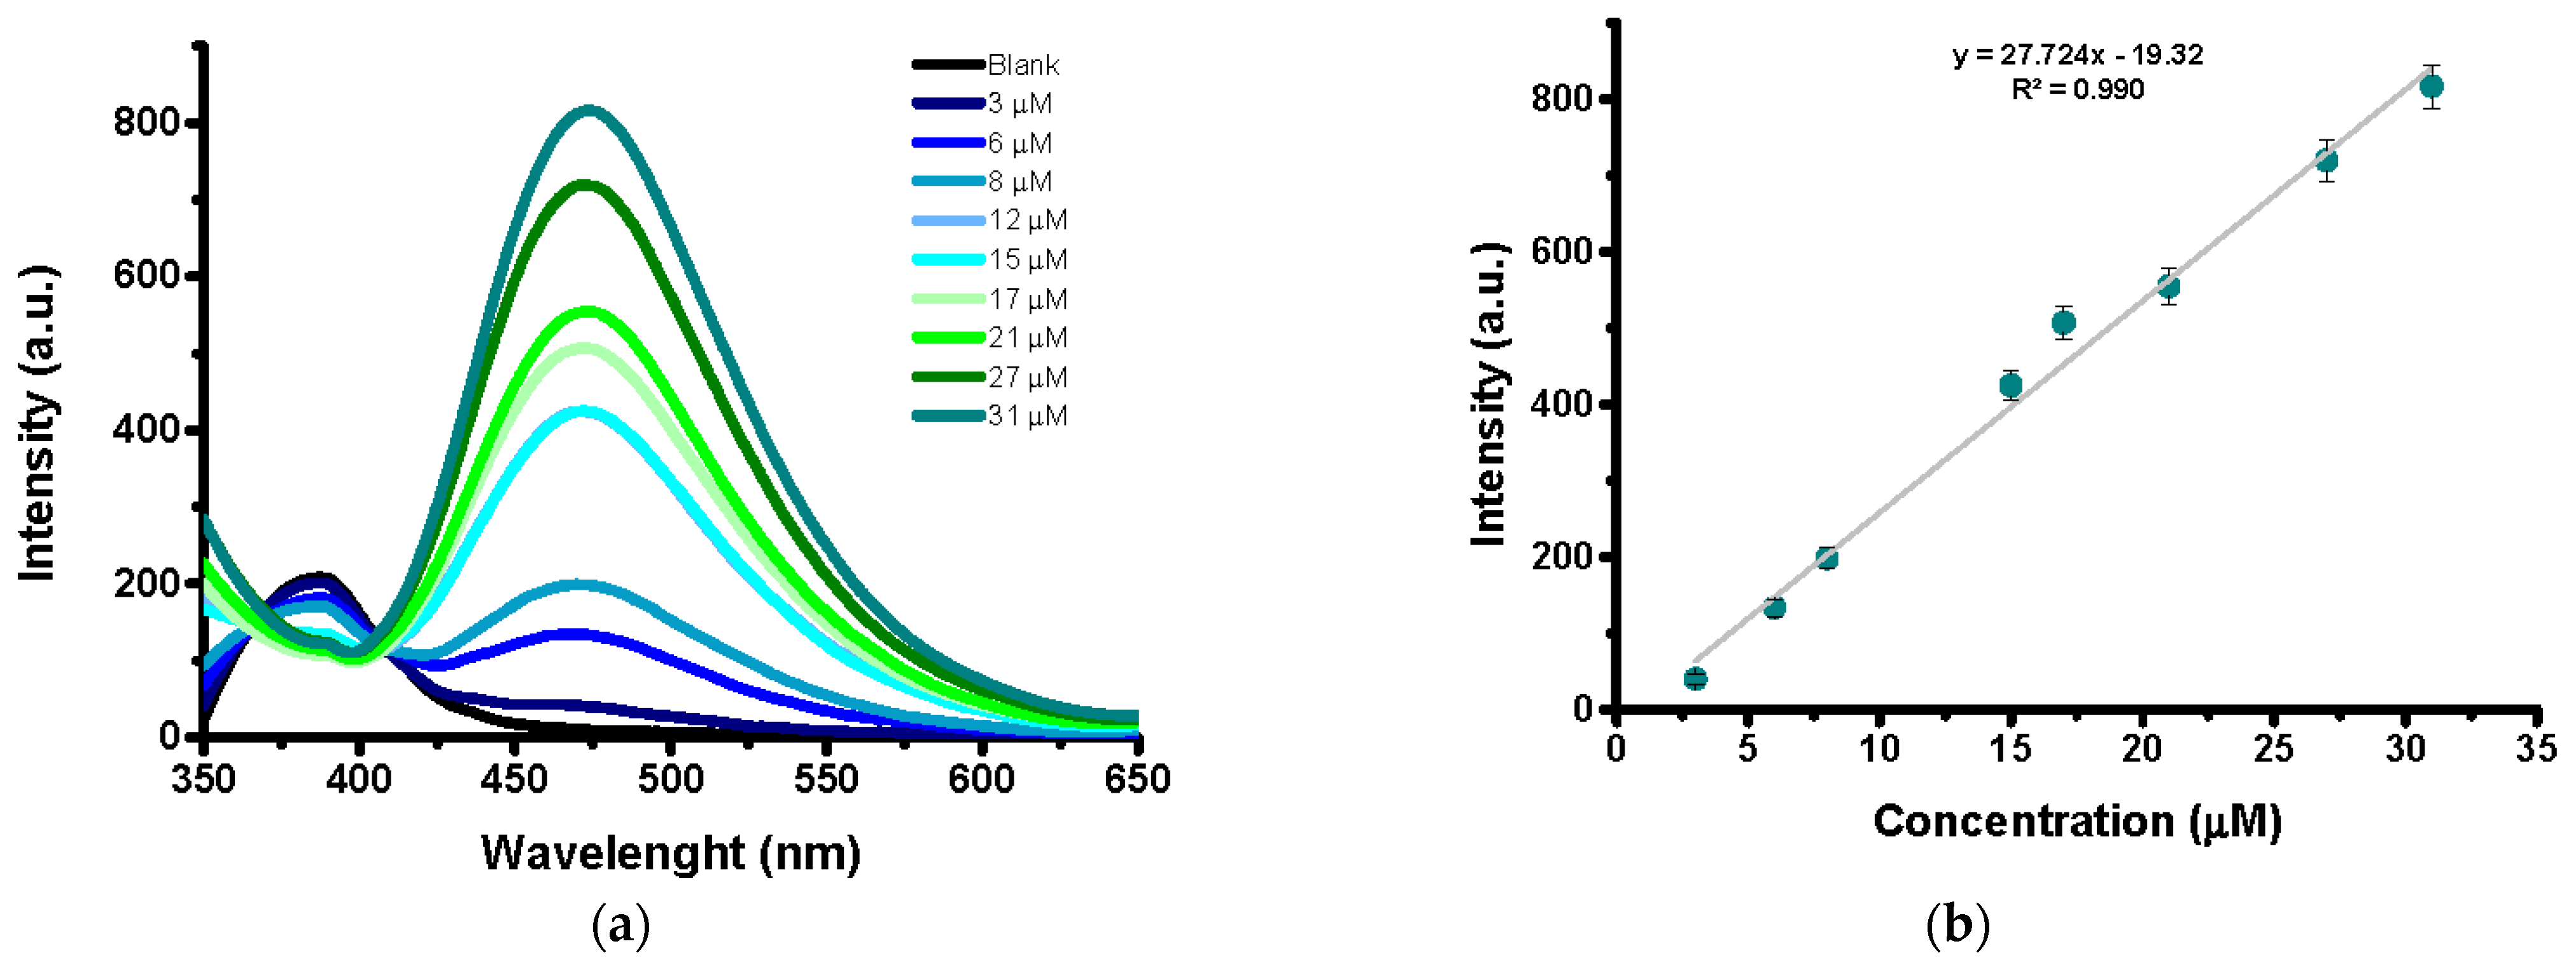
As previously commented, abnormally high amounts of these biogenic polyamines are found in the urine of cancer patients. To evaluate the sensitivity of sensor 1 during the detection of Spm and Spd as biomarkers in urine, fluorescence titration experiments were carried out in this medium. In a typical experiment, increasing amounts of Spm or Spd in urine were added to an acetonitrile solution of sensor 1 (50 µM), always maintaining a 98:2 acetonitrile:urine solvent mixture ratio, and the corresponding fluorescence spectra were recorded (Figure 4 for Spm. For Spd, see the Supporting Information). As seen in Figure 4b, the normalized fluorescence intensities at 473 nm vs. Spm concentration showed a linear response in urine in the 1–31 μM concentration range. The limits of detection (LoD) for both compounds were determined as 3·Sb/m, where Sb was the blank standard deviation and m the slope obtained during titration, which was 0.70 µM and 1.17 µM for Spm and Spd, respectively. The normal level of Spm and Spd in the urine of healthy adults is ca. 1.2–1.3 μM, whereas in cancer patients with certain solid tumors these concentrations are much higher (higher than 8 and 26 μM for Spm and Spd, respectively) [11]. Thus, the LoDs determined for these amines are low enough to detect pathological situations, such as ovarian tumors, where the concentration in urine is around 40 µM [40,41]. The recovery experiments carried out with Spm and Spd are summarized in Table S2.

2.5. Theoretical Calculations

To propose a binding mode capable of explaining the observed selectivity of chemosensor 1 to Spm and Spd, an exhaustive two-stage computational simulation study was carried out. Given the flexibility of chemosensor side chains over TPE moiety and the linear structure of the biogenic polyamines, a 50 ns molecular dynamics simulation of the sensor, together with each studied biogenic aliphatic amine and the amine neurotransmitters acting as possible interferences, was first carried out. These simulations allowed us to obtain representative structures of the interaction between TPE moiety and the tested amines. In a second stage, and by taking these representative structures as a starting point, they were further optimized using high-level quantum calculations to analyze the stabilization of the different complexes formed by chemosensor 1 in solution in the presence of the biogenic aliphatic amines and neurotransmitters.

2.5.1. Molecular Dynamics Simulations

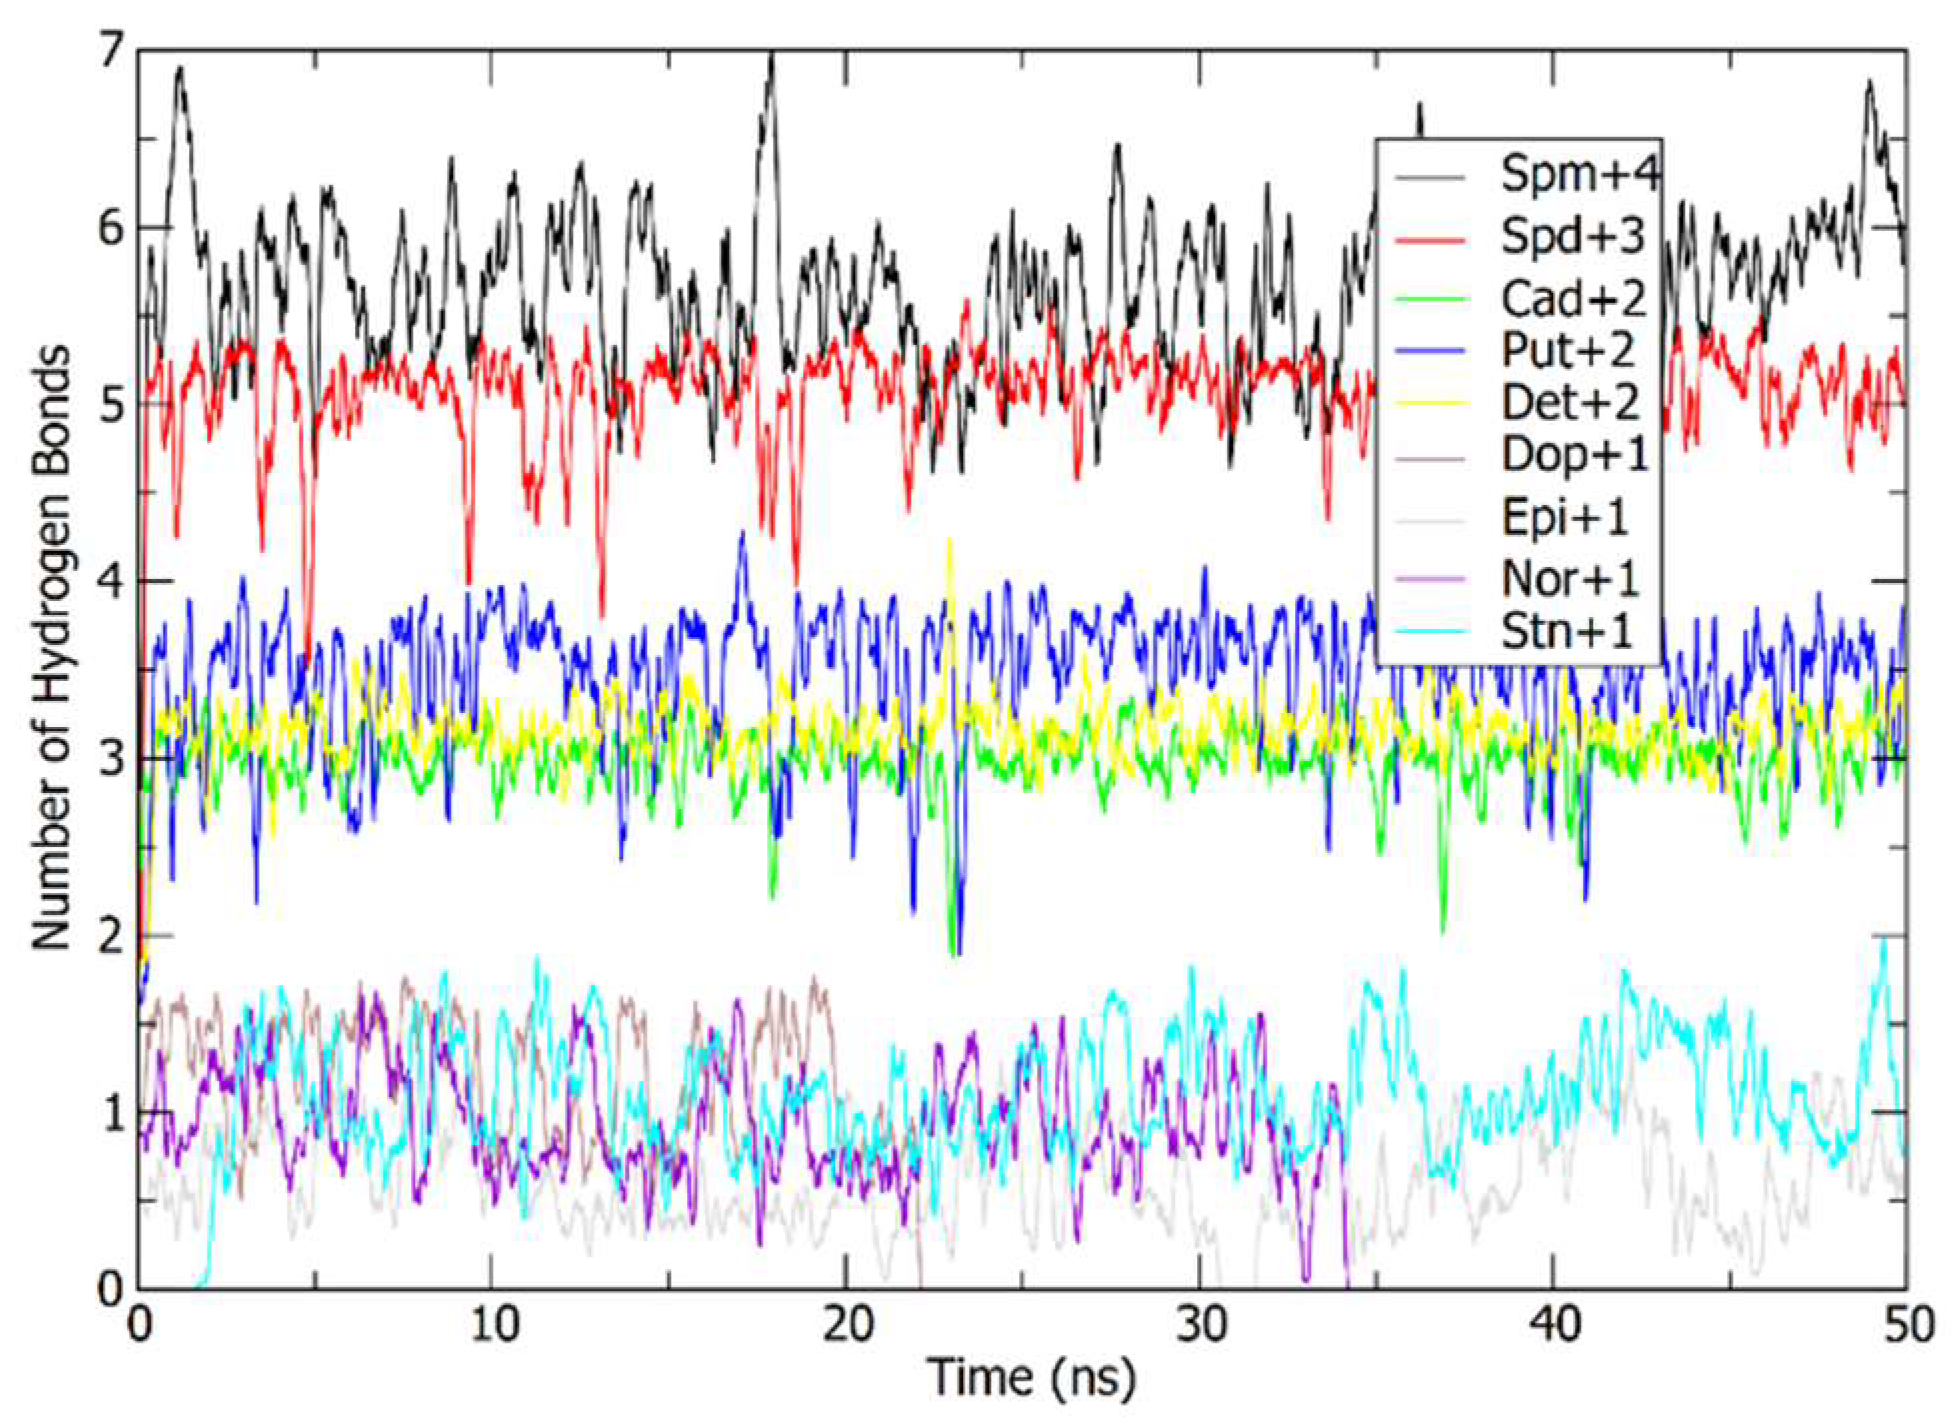
The protonation state of amines was obtained with the Chemicalize tool [42] by ChemAxon. The main species obtained for each amine at pH 7.4 during the experimental tests is shown in the legend of Figure 5. All the molecules under study were parametrized using AMBER following the protocol described in the Supporting Information section to obtain a molecular dynamics trajectory simulation of every sensor:amine complex formed by 50,000 snapshots. For most amines, the interaction with the sensor remained stable throughout the simulated time. Only some of the amines with a single positive charge were able to break this interaction and were released to the solvent.
The amine with the largest number of hydrogen bonds and electrostatic interactions was Spm, which formed an average of 5.66 hydrogen bonds with 1 over the 50,000 analyzed structures. Spd had an average of 5.06 hydrogen bonds with chemosensor 1. In terms of hydrogen bonding, a second differentiated group was found to include the polyamines with two protonated amino groups, such as Put, Det, and Cad, with an average of 3.50, 3.15, and 2.99 hydrogen bonds, respectively, during the simulation time. A third group showing the lowest hydrogen bond binding indices included the amines with only one protonated amino group, such as Stn and Epi, with an average of 1.07 and 0.63 hydrogen bonds with chemosensor 1, respectively. Finally, Dop and Nor broke the interaction during simulation and were released to the solvent at 22 and 34 ns, respectively.
To obtain accurate geometry and the binding energy of each sensor:amine complex, the cluster command of the ptraj program of Amber12 [43] was used to process the 50,000 snapshots of the molecular dynamics trajectories, which gave 250 representative structures that were submitted to a binding energy calculation.

2.5.2. DFT Calculations

Further optimization of the complexes formed between chemosensor 1 and the biogenic amines/neurotransmitters, which remained hydrogen-bonded during the molecular dynamics simulation (i.e., Det, Cad, Put, Spm, Spd, and Dop), and the corresponding isolated species, was performed at M062X/6-31+G(2d,p)/PCM(acetonitrile) [44,45] by taking into account the empirical dispersion through the D3 version of Grimme’s dispersion parametrization and the original D3 damping function [46] using the Gaussian16 Rev. A.03 package [47] (see the computational details in the Supporting Information section. The atomic coordinates of this and other complexes are found in the Supplementary Material).

2.5.3. Complexes’ Geometry Description

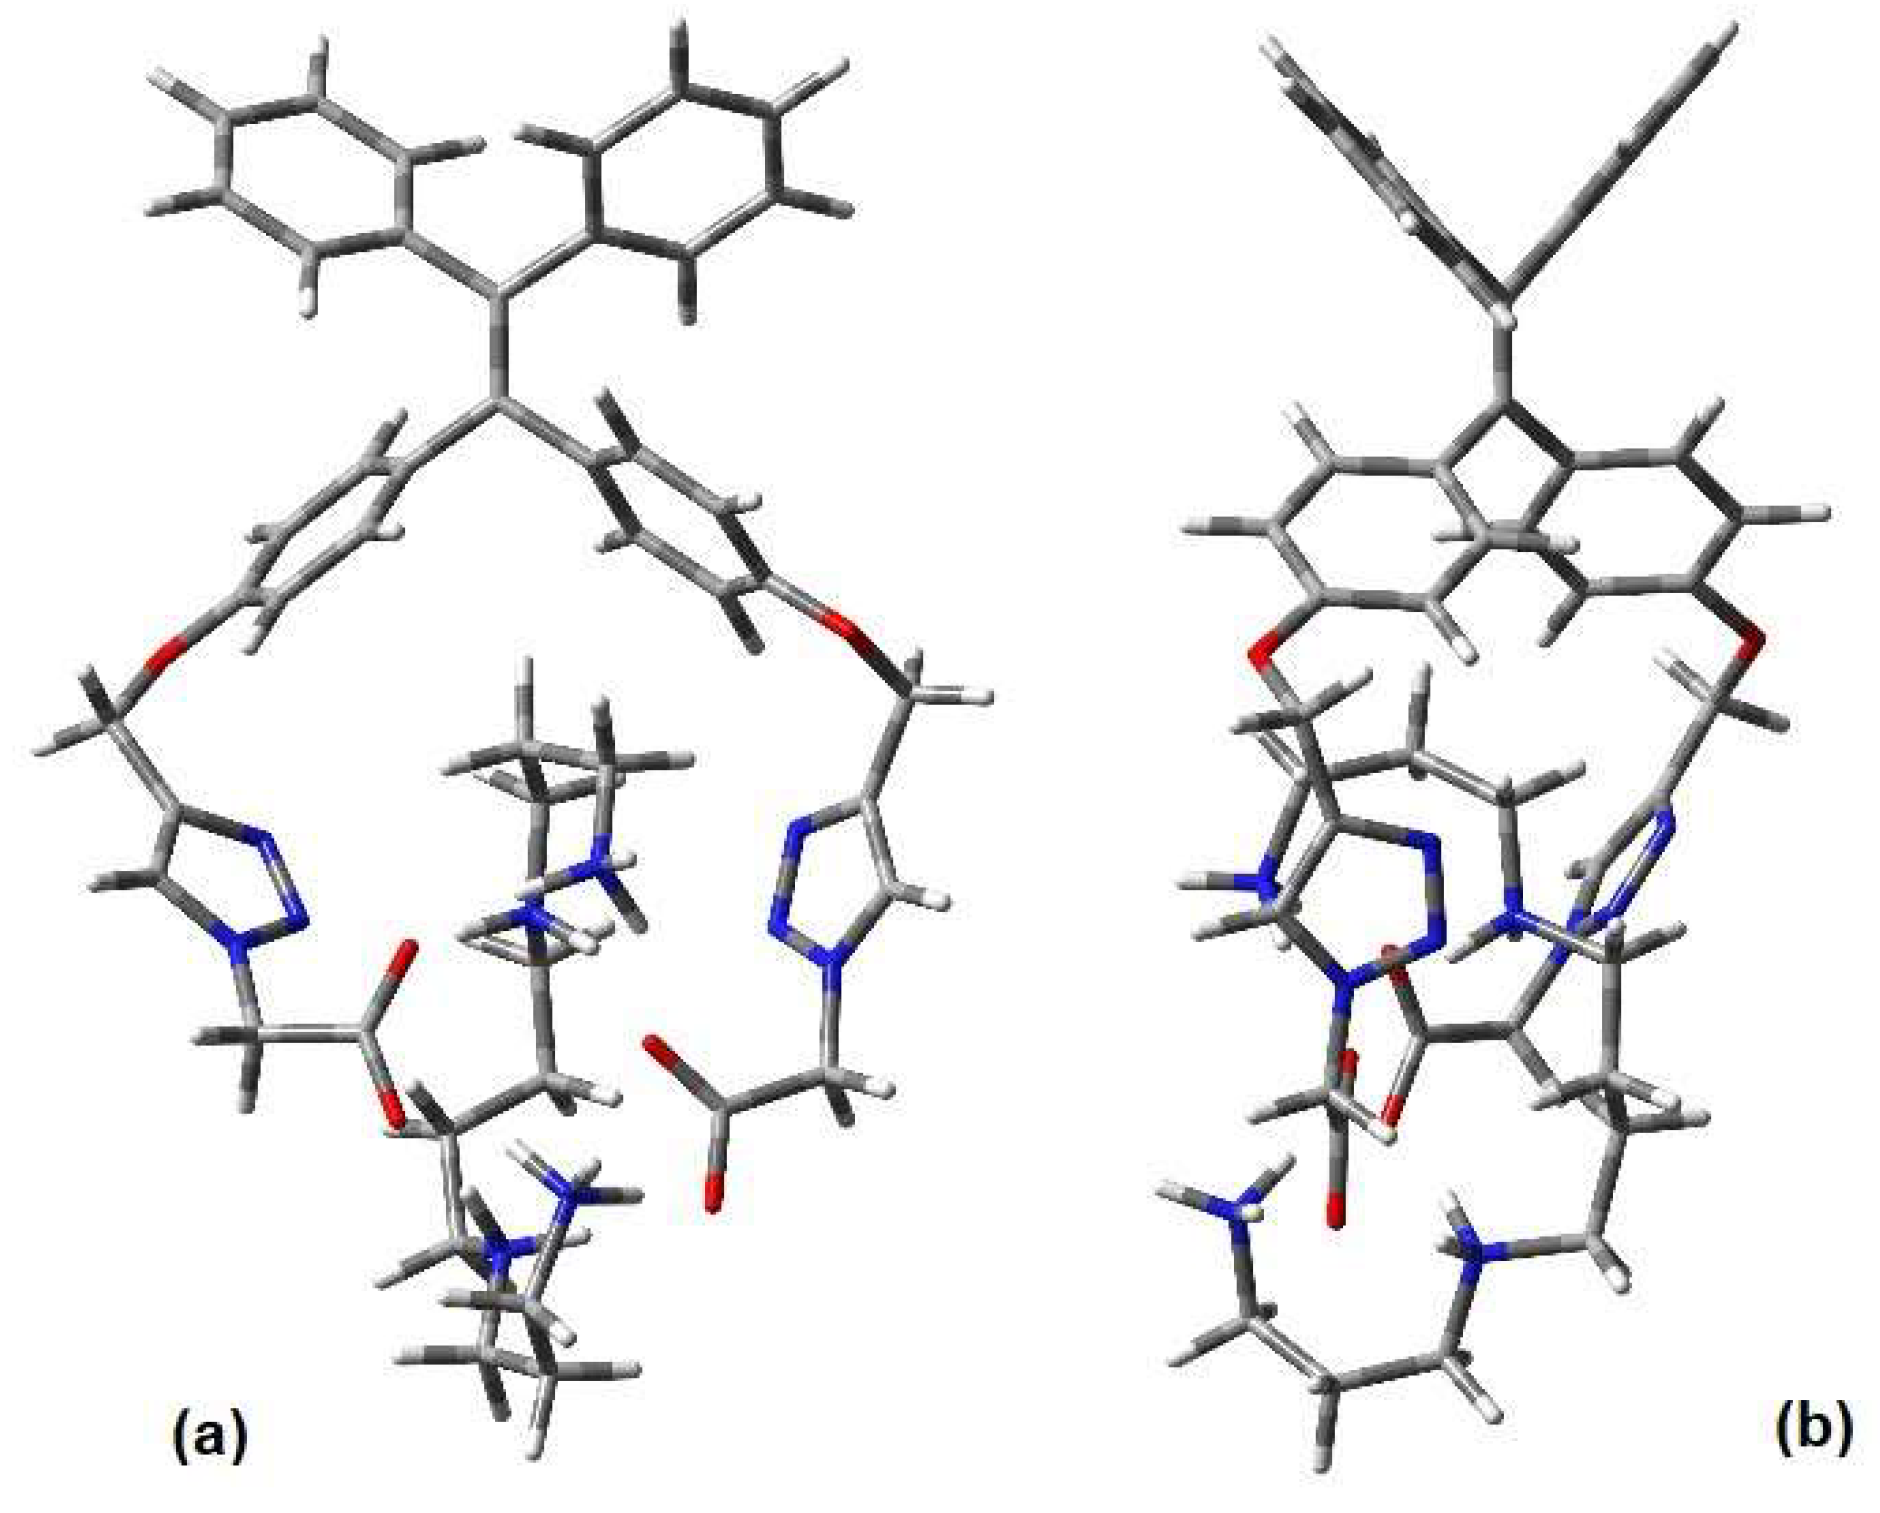
The optimized structure of the 1-Spm system revealed how the Spm chain came close to the carboxylate groups of the chemosensor, almost as if they were two closed shackles in a chain (see Figure 6). This arrangement promoted the formation of seven hydrogen bonds between the protonated amino groups of the polyamine and the two carboxylate groups of the sensor, and an additional one between an internal amine N-H group and the central nitrogen of the triazole ring of the sidechain of the sensor. Therefore, only one of the 10 available hydrogen atoms of the amino groups of Spm was unable to interact with the sensor and be accessible to the solvent. The distance between these hydrogen-bonded amine hydrogen atoms and the carboxylate oxygen atoms ranged from 1.70 to 1.90 Å, whereas the distance between N-H and triazole nitrogen was 2.15 Å. For Spd, the structure of the 1: Spd complex showed six simultaneous hydrogen bonds, in which the distance between the oxygen atoms of the sensor and the amine hydrogen atoms of the analyte were between 1.66 and 1.95 Å.
The stable structure of the complexes of the TPE-based sensor with the amines that carried two protonated nitrogens (Cad, Put, Det) looked similar to that reported for Spm and Spd due to the formation of an extensive hydrogen-bond network. The terminal amino groups of Det were protonated at pH 7.4, whereas the central one remained unchanged. Therefore, its complex with sensor 1 only exhibited hydrogen-bond interactions through the two protonated amines. One of these protonated amino groups specifically interacted with the two carboxylates by keeping together the side chains of the sensor, whereas the other terminal protonated amino group interacted simultaneously with both the carboxylate group and the central nitrogen of imidazole moiety of the same side chain. The distance between the amino hydrogen atoms and the oxygen of the carboxylate groups was between 1.57 and 1.74 Å, and the hydrogen-bond distance between the protonated amino group and the imidazole nitrogen atom was 2.34 Å, which suggests a weak hydrogen-bond interaction. Finally, the optimized structure of chemosensor 1 and Put and Cad was similar and showed a hydrogen-bond network between their terminal protonated amino groups and the TPE carboxylate groups. The distance of these bonds ranged from 1.62 to 1.82 Å for Put, and from 1.62 to 1.75 Å for Cat.

2.5.4. Binding Energy Analysis

The ΔG thermochemical calculations at the same theory level at 298.15 K and 1 atm (scale factor 0.952 [48]), as seen in Tables S3 and S4, show that the stabilization of the different complexes lay between 29.7 kcal/mol (1: Cad (2+) complex) and 61.5 kcal/mol (1: Spm (4+) complex). When these free-energy results were divided by the number of nitrogens with a positive charge over the biogenic amines/neurotransmitters, the stabilization average was around 15 kcal/mol (see the last column in Table S4) except in two cases, where a stabilization of around 18 kcal/mol was recorded: Dop(1+) (18.5 kcal/mol stabilization for its only positively charged nitrogen atom) and Spm(3+) (18.0 kcal/mol stabilization for three of its four nitrogen atoms with a positive charge). In both cases, this fact was easily explained by looking at the recorded interactions in both optimized structures: In the Dop(1+) complex with 1, the positively charged nitrogen interacted with one of the carboxylate end groups of the TPE sensor, whereas the other noncharged nitrogen was hydrogen-bonded to the two phenol groups of the molecule; for the 1:Spm(3+) complex, the nonpositively charged nitrogen atom was hydrogen-bonded to one of the two 1,2,3-triazole groups of the sensor moiety.
Therefore, the hydrogen bonds that sensor 1 was able to establish at the selected pH with the different biogenic amines/neurotransmitters was the driving force of stabilization and, thus, of its selectivity.

3. Materials and Methods

The reagents and solvents employed in the syntheses were purchased from Sigma-Aldrich and were used without further purification. Drug-free human urine was supplied by Thermo Scientific. 1H NMR and 13C NMR spectra were recorded in a Bruker Avance 300 spectrophotometer and referenced to the solvent peak. Fluorescence measures were taken with a Cary Eclipse Spectrofluorometer (Santa Clara, CA, USA) using a 1 cm path-length cuvette.

3.1. Preparation of 4,4’-(2,2-Diphenylethene-1,1-diyl)bis(methoxybenzene) (2)

Diphenylmethane (2 mL, 12 mmol) dissolved in dry THF (40 mL) in an argon atmosphere was cooled to −78 °C. nBuLi (2.2 M in hexane solution, 5.0 mL, 11 mmol) was injected dropwise and stirred at RT for 4 h. The reaction was cooled to −78 °C again and 4,4-dimethoxybenzophenone (2.42 g, 10 mmol) dissolved in THF (10 mL) was added to the reaction and then stirred at RT overnight. NH4Cl (sat.) was added and stirred at RT for 1 h. THF was evaporated, and the crude was extracted with DCM. Then p-toluenesulfonic acid (385 mg, 2 mmol) in toluene (80 mL) was added and refluxed at 155 °C overnight with a Dean–Stark apparatus to remove water. Once cooled, it was extracted with NaHCO3 (sat.) and brine. After filtration, the solvent was evaporated and the product was purified by silica column chromatography using hexane: ethyl acetate (9:1) as an eluent. Compound 2 was isolated as a yellow solid (2.08 g; 53%). 1H RMN (300 MHz, CDCl3) δ (ppm) 7.15–7.06 (m, 6H); 7.06–7.00 (m, 4H); 6.95 (d; J = 8.9 Hz; 4H); 6.64 (d; J = 8.8 Hz; 4H); 3.74 (s, 6H). 13C NMR (75 MHz, DMSO-d6) δ (ppm). 158; 144; 141; 125–135; 114; 55.

3.2. Synthesis of 4,4’-(2,2-Diphenylethene-1,1-diphenyl) Diphenol (3)

Compound 2 (1.758 g, 4.5 mmol) was dissolved in dry DCM (12 mL) and cooled to 0 °C in an argon atmosphere. BBr3 (17 mL, 18 mmol) was added dropwise and then the ice bath was removed. The mixture was stirred overnight at RT. Deionized water (20 mL) was added and the solution was extracted with AcOEt. The organic phase was washed with brine and dried with anhydrous MgSO4. The organic solvent was evaporated to give compound 3 as a brown solid (1.54 g; 83%). 1H RMN (300 MHz, DMSO-d6) δ (ppm) 9.30 (s, 2H); 7.17–7.02 (m, 6H); 6.95–6.91 (m, 4H); 6.74 (d; J = 8.6 Hz; 4H); 6.48 (d; J = 8.6 Hz; 4H). 13C RMN (75 MHz, DMSO-d6) δ (ppm) 156; 1446; 141; 138; 134; 132; 131; 128; 126; 115.

3.3. Synthesis of 4,4’-(2,2-Diphenylethene-1,1-diyl)bis((prop-2-yn-1-yloxy) Benzene) (4)

In a reflux apparatus set up in an argon atmosphere, compound 3 (400 mg, 1.1 mmol) was dissolved in acetone (15 mL) and solid potassium carbonate (334 mg, 2.4 mmol) was added. Afterward, 3-bromo-1-propyne (80% in toluene, 0.2 mL, 2.4 mmol) was injected dropwise. The mixture was refluxed at 70 °C overnight. Deionized water (20 mL) was added, and the mixture was cooled to RT and then extracted with AcOEt. The organic phase was washed with brine and dried with anhydrous MgSO4. After filtration and solvent evaporation, compound 4 was isolated as a yellow amorphous solid (307 mg; 99%). 1H RMN (300 MHz, DMSO-d6) δ (ppm) 7.19–7.07 (m, 6H); 7.00–6.92 (m, 4H); 6.88 (d; J = 8.7 Hz; 4H); 6.73 (d; J = 8.8 Hz; 4H); 4.71 (d; J = 2.4 Hz; 4H); 3.54 (t; J = 2.3 Hz; 2H). 13C RMN (75 MHz, DMSO-d6) δ (ppm) 156; 144; 140; 139; 136; 132; 131; 128; 126; 114; 79; 78; 55.

3.4. Synthesis of tert-Butyl 2-Azidoacetate (5)

tert-Butyl 2-bromoacetate (2.3 mL; 15 mmol) was dissolved in dimethylformamide (20 mL). Then, sodium azide (1.20 g; 18.4 mmol) was added and the mixture was stirred for 12 h at 60 °C. Then, water (100 mL) was added and the solution was extracted with ethyl acetate. The organic phase was washed with brine and dried with anhydrous MgSO4. After filtration and solvent evaporation, compound 5 was isolated as a colorless liquid (2.40 g; 99%). 1H RMN (300 MHz, DMSO-d6) δ (ppm) 3.95 (s, 2H); 1.45 (s, 9H).

3.5. Azide-Click CuAAC Synthesis of Di-terc-butyl 2,2’-((((((2,2-Diphenylethene-1,1-diyl)bis(4,1-phenylene)bis(oxy))bis(methylene))bis(1H-1,2,3-triazole-4,1-diyl)diacetate (6)

Compound 5 (368 mg, 0.76 mmol) was added to a stirred solution of 4 (468 mg, 1.1 mmol) in THF (30 mL). Two catalytic solutions, A and B, were prepared, where A was copper acetate (44 mg) in water (15 mL) and B was sodium ascorbate (94 mg) in water (15 mL). Solution A was poured over B and the mixture was immediately poured into the reaction vessel and was left to stir at RT overnight. Brine (120 mL) was added and extracted with DCM. The organic phase was washed with brine and dried with anhydrous MgSO4. When the solvent was evaporated, a yellow oil was obtained. Toluene was added to the obtained oil and a white precipitate formed, which was isolated by centrifugation to give compound 6 pure (118 mg; 46%). 1H RMN (300 MHz, DMSO-d6) δ (ppm) 8.17 (s, 2H), 7.17–7.05 (m, 6H), 6.99–6.94 (m, 4H), 6.88 (d, J = 8.8 Hz, 4H), 6.80 (d, J = 8.9 Hz, 4H), 5.28 (s, 4H), 5.06 (s, 4H), 1.43 (s, 18H). 13C RMN (75 MHz, DMSO-d6) δ (ppm) 166; 157; 144; 143; 140; 139; 136; 132; 131; 128; 127; 126; 114; 82; 61; 51; 28.

3.6. Synthesis of Compound 1

Compound 6 (73 mg, 0.1 mmol) was dissolved in DCM (6 mL). TFA (1.5 mL) was added and was left to stir at RT overnight. DCM was evaporated at low pressure and the product was obtained as pure (55 mg; 89%). 1H RMN (300 MHz, DMSO-d6) δ (ppm) δ 13.36 (s wide, 2H); 8.17 (s, 2H); 7.19–7.04 (m, 6H); 7.00–6.94 (m, 4H); 6.89 (d; J = 8.8 Hz; 4H); 6.81 (d; J = 8.9 Hz; 4H); 5.28 (s, 4H); 5.06 (s, 4H). 13C RMN (75 MHz, DMSO-d6) δ (ppm) 169; 157; 144; 143; 140; 139; 136; 132; 131; 128; 126; 114; 61; 51. HRMS: m/z calculated for C36H30N6O6 (M + H): 643.2305 found 643.2283 [M+H]+.

3.7. Fluorescence Measurements

Fluorescence measurements were taken in 3 mL cuvettes with 2940 µL of the sensor in acetonitrile (50 µM) in the presence of two equivalents of the analytes (10−2 M in phosphate buffer). To maintain the 98:2 ratio (CH3CN : H2O), corresponding volumes of water were added. Samples were irradiated with a wavelength of 340 nm.

3.8. Fluorescence Titrations

Thirteen different solutions were prepared in 3 mL cuvettes with 2940 µL of the sensor in acetonitrile (50 µM) in the presence of increasing concentrations of the analytes (3–50 µM) in urine. To maintain the 98:2 ratio (CH3CN : H2O), corresponding volumes of water were added. Samples were irradiated with a wavelength of 340 nm.

4. Conclusions

A new chemosensor 1 to selectively detect Spm and Spd was prepared. The probe is based on a TPE moiety with “molecular cleft” structure. The two branches ending with carboxylic acids allow it to strongly interact with the longer biogenic aliphatic polyamines. The interaction gives rise to an important and easily observed fluorescence emission enhancement. The new probe responds to Spm and Spd, but keeps silent for other aliphatic polyamines and several neurotransmitters that could interfere with biological fluids. Theoretical studies suggest that coordination strength is related to the positive charges of the amine under the applied experimental conditions (pH = 7.4). Coordination can induce a restriction in the TPE aromatic rings, which is responsible for the fluorescence enhancement. Finally, detection can be also carried out in urine with LoDs of 0.70 µM and 1.17 µM for Spm and Spd, respectively. These values suggest that 1 can be used as a biomarker to detect Spm and Spm in the urine of patients with different cancer types.

Supplementary Materials

The following are available online at https://www.mdpi.com/article/10.3390/chemosensors10010008/s1, Table S1: Comparison of the sensing properties of the different Spm/Spd selective optical probes, Figures S1–S11: The 1H and 13C NMR spectra of compounds 16, Figure S12: The fluorescence titration spectra with Spd in urine, Table S2: Recovery and accuracy of the method, Computational methods for theoretical calculations, Tables S3 and S4: Energy results for the DFT calculations, Cartesian coordinates of the optimized DFT structures.

Author Contributions

Conceptualization, A.M.C. and P.G.; data curation, M.B., P.A. and J.A.S.; formal analysis, P.A., J.A.S. and S.G.; funding acquisition, A.M.C. and P.G.; investigation, M.B., S.C., P.A. and J.A.S.; methodology, M.P. and S.G.; supervision, M.P. and P.G.; writing original draft, M.B., P.A., J.A.S., M.P. and S.G.; writing, review and editing, A.M.C. and P.G. All authors have read and agreed to the published version of the manuscript.

Funding

This research was funded by MCIN/AEI/ 10.13039/501100011033 and by “ERDF A way of making Europe” from the European Union (Grant RTI2018-100910-B-C42). M.B. thanks the Generalitat Valenciana for her Grisolia Grant.

Acknowledgments

SCSIE (Universitat de València) is gratefully acknowledged for all the employed equipment. NMR was registered at the U26 facility of ICTS “NANBIOSIS” at the Universitat of València. P.A.M. thanks F. Javier Luque Garriga (University of Barcelona) for his advice and resources.

Conflicts of Interest

The authors declare no conflict of interest.

References

  1. Zhu, H.; Fan, J.; Wang, B.; Peng, X. Fluorescent, MRI, and colorimetric chemical sensors for the first-row d-block metal ions. Chem. Soc. Rev. 2015, 44, 4337–4366. [Google Scholar] [CrossRef] [Green Version]
  2. Upadhyay, S.; Singh, A.; Sinha, R.; Omer, S.; Negi, K. Colorimetric chemosensors for d-metal ions: A review in the past, present and future prospect. J. Mol. Struct. 2019, 1193, 89–102. [Google Scholar] [CrossRef]
  3. Bryan, A.J.; De Silva, A.P.; De Silva, S.A.; Rupasinghe, R.D.; Sandanayake, K.S. Photo-induced electron transfer as a general design logic for fluorescent molecular sensors for cations. Biosensors 1989, 4, 169–179. [Google Scholar] [CrossRef]
  4. Martínez-Máñez, R.; Sancenón, F. Fluorogenic and Chromogenic Chemosensors and Reagents for Anions. Chem. Rev. 2003, 103, 4419–4476. [Google Scholar] [CrossRef]
  5. Martínez-Máñez, R.; Sancenón, F. Chemodosimeters and 3D Inorganic Functionalised Hosts for the Fluoro-Chromogenic Sensing of Anions. Coord. Chem. Rev. 2006, 250, 3081–3093. [Google Scholar] [CrossRef]
  6. Mao, L.; Liu, Y.; Yang, S.; Li, Y.; Zhang, X.; Wei, Y. Recent Advances and Progress of Fluorescent Bio-/Chemosensors Based on Aggregation-Induced Emission Molecules. Dyes Pigm. 2019, 162, 611–623. [Google Scholar] [CrossRef]
  7. Cao, D.; Liu, Z.; Verwilst, P.; Koo, S.; Jangjili, P.; Kim, J.S.; Lin, W. Coumarin-based small-molecule fluorescent chemosensors. Chem. Rev. 2019, 119, 10403–10519. [Google Scholar] [CrossRef]
  8. Chae, J.B.; Yun, D.; Lee, H.; Lee, H.; Kim, K.T.; Kim, C. Highly Sensitive Dansyl-Based Chemosensor for Detection of Cu2+ in Aqueous Solution and Zebrafish. ACS Omega 2019, 4, 12537–12543. [Google Scholar] [CrossRef] [PubMed] [Green Version]
  9. Kim, T.I.; Kim, Y. Analyte-directed formation of emissive excimers for the selective detection of polyamines. Chem. Commun. 2016, 52, 10648–10651. [Google Scholar] [CrossRef]
  10. VanDenburgh, K.L.; Liu, Y.; Sadhukhan, T.; Benson, C.R.; Cox, N.M.; Erbas-Cakmak, S.; Flood, A.H. Multi-state amine sensing by electron transfers in a BODIPY probe. Org. Biomol. Chem. 2020, 18, 431–440. [Google Scholar] [CrossRef]
  11. Satrijo, A.; Swager, T.M. Anthryl-doped conjugated polyelectrolytes as aggregation-based sensors for nonquenching multicationic analytes. J. Am. Chem. Soc. 2007, 129, 16020–16028. [Google Scholar] [CrossRef] [PubMed]
  12. Bao, B.; Yuwen, L.; Zheng, X.; Weng, L.; Zhu, X.; Zhan, X.; Wang, L. A fluorescent conjugated polymer for trace detection of diamines and biogenic polyamines. J. Mater. Chem. 2010, 20, 9628–9634. [Google Scholar] [CrossRef]
  13. Mei, J.; Hong, Y.; Lam, J.W.Y.; Qin, A.; Tang, Y.; Tang, B.Z. Aggregation-Induced Emission: The Whole Is More Brilliant than the Parts. Adv. Mater. 2014, 26, 5429–5479. [Google Scholar] [CrossRef]
  14. Liu, Y.; Deng, C.; Tang, L.; Qin, A.; Hu, R.; Sun, J.Z.; Tang, B.Z. Specific Detection of D-Glucose by a Tetraphenylethene-Based Fluorescent Sensor. J. Am. Chem. Soc. 2011, 133, 660–663. [Google Scholar] [CrossRef] [PubMed]
  15. Rodriguez-Nuevalos, S.; Parra, M.; Ceballos, S.; Gil, S.; Costero, A.M. A nitric oxide induced “click” reaction to trigger the aggregation induced emission (AIE) phenomena of a tetraphenyl ethylene derivative: A new fluorescent probe for NO. J. Photochem. Photobiol. 2020, 388, 112132. [Google Scholar] [CrossRef]
  16. Pan, Y.Q.; Xu, X.; Zhang, Y.; Zhang, Y.; Dong, W.K. A highly sensitive and selective bis (salamo)-type fluorescent chemosensor for identification of Cu2+ and the continuous recognition of S2−, Arginine and Lysine. Spectrochim. Acta A Mol. Biomol. Spectrosc. 2020, 229, 117927. [Google Scholar] [CrossRef] [PubMed]
  17. Wang, Y.; Liu, H.; Chen, Z.; Pu, S. Aggregation-induced emission enhancement (AIEE)-active tetraphenylethene (TPE)-based chemosensor for CN−. Spectrochim. Acta A Mol. Biomol. Spectrosc. 2021, 245, 118928. [Google Scholar] [CrossRef]
  18. Liu, Y.; Yu, Y.; Lam, J.W.; Hong, Y.; Faisal, M.; Yuan, W.Z.; Tang, B.Z. Simple Biosensor with High Selectivity and Sensitivity: Thiol-Specific Biomolecular Probing and Intracellular Imaging by AIE Fluorogen on a TLC Plate through a Thiol–Ene Click Mechanism. Chem. Eur. J. 2010, 16, 8433–8438. [Google Scholar] [CrossRef] [PubMed]
  19. Han, K.; Cho, B.K. Chain-dependent emission color codes of extended tetraphenylethylene derivatives: Discrimination between water and methanol. RSC. Adv. 2015, 5, 9510–9517. [Google Scholar] [CrossRef]
  20. Lenis, Y.Y.; Elmetwally, M.A.; Maldonado-Estrada, J.G.; Bazer, F.W. Physiological importance of polyamines. Zygote. 2017, 25, 244–255. [Google Scholar] [CrossRef]
  21. Sagar, N.A.; Tarafdar, S.; Agarwal, S.; Tarafdar, A.; Sharma, S. Polyamines: Functions, Metabolism, and Role in Human Disease Management. Med. Sci. 2021, 9, 44. [Google Scholar] [CrossRef] [PubMed]
  22. Tabor, C.W.; Tabor, H. Polyamines. Ann. Rev. Biochem. 1984, 53, 749–790. [Google Scholar] [CrossRef] [PubMed]
  23. Bae, D.H.; Lane, D.J.; Jansson, P.J.; Richardson, D.R. The old and new biochemistry of polyamines. Biochim. Biophys. Acta. Gen. Subj. 2018, 1862, 2053–2068. [Google Scholar] [CrossRef] [PubMed]
  24. Morgan, D.M. Polyamines. Mol. Biotechnol. 1999, 11, 229–250. [Google Scholar] [CrossRef] [PubMed]
  25. Nowotarski, S.L.; Woster, P.M.; Casero, R.A., Jr. Polyamines and cancer: Implications for chemotherapy and chemoprevention. Expert Rev. Mol. Med. 2013, 15, e3. [Google Scholar] [CrossRef] [PubMed] [Green Version]
  26. Damiani, E.; Wallace, H.M. Polyamines and Cancer. In Polyamines. Methods and Protocols; Alcázar, R., Tiburcio, A., Eds.; Humana Press: New York, NY, USA, 2018; Volume 1694, pp. 469–488. [Google Scholar] [CrossRef]
  27. Gerner, E.W.; Meyskens, F.L. Polyamines and cancer: Old molecules, new understanding. Nat. Rev. Cancer. 2004, 4, 781–792. [Google Scholar] [CrossRef] [Green Version]
  28. Wallace, H.M.; Duthie, J.; Evans, D.M.; Lamond, S.; Nicoll, K.M.; Heys, S.D. Alterations in polyamine catabolic enzymes in human breast cancer tissue. Clin. Cancer. Res. 2000, 6, 3657–3661. [Google Scholar]
  29. Ignatenko, N.A.; Gerner, E.W.; Besselsen, D.G. Defining the role of polyamines in colon carcinogenesis using mouse models. J. Carcinog. 2011, 10, 10. [Google Scholar] [CrossRef]
  30. Min, J.Z.; Matsumoto, A.; Li, G.; Jiang, Y.Z.; Yu, H.F.; Todoroki, K.; Toyo’oka, T. A quantitative analysis of the polyamine in lung cancer patient fingernails by LC-ESI-MS/MS. Biomed. Chromatogr. 2014, 28, 492–499. [Google Scholar] [CrossRef] [PubMed]
  31. Schipper, R.G.; Romijn, J.C.; Cuijpers, V.M.J.I.; Verhofstad, A.A.J. Polyamines and prostatic cancer. Biochem. Soc. Trans. 2003, 31, 375–380. [Google Scholar] [CrossRef] [PubMed]
  32. Gilmour, S.K. Polyamines and nonmelanoma skin cancer. Toxicol. Appl. Pharmacol. 2007, 224, 249–256. [Google Scholar] [CrossRef] [PubMed] [Green Version]
  33. Niemi, R.J.; Roine, A.N.; Häkkinen, M.R.; Kumpulainen, P.S.; Keinänen, T.A.; Vepsäläinen, J.J.; Mäenpää, J.U. Urinary polyamines as biomarkers for ovarian cancer. Int. J. Gynecol. Cancer. 2017, 27, 1360–1366. [Google Scholar] [CrossRef] [Green Version]
  34. Madeo, F.; Bauer, M.A.; Carmona-Gutierrez, D.; Kroemer, G. Spermidine: A physiological autophagy inducer acting as an anti-aging vitamin in humans? Autophagy 2019, 15, 165–168. [Google Scholar] [CrossRef] [PubMed]
  35. Godoy-Reyes, T.M.; Llopis-Lorente, A.; García-Fernández, A.; Gaviña, P.; Costero, A.M.; Martínez-Máñez, R.; Sancenón, F. Acetylcholine-responsive cargo release using acetylcholinesterase-capped nanomaterials. Chem. Commun. 2019, 55, 5785–5788. [Google Scholar] [CrossRef]
  36. Godoy-Reyes, T.M.; Llopis-Lorente, A.; García-Fernández, A.; Gaviña, P.; Costero, A.M.; Villalonga, R.; Martínez-Máñez, R.A. L-glutamate-responsive delivery system based on enzyme-controlled self-immolative arylboronategated nanoparticles. Org. Chem. Front. 2019, 6, 1058–1063. [Google Scholar] [CrossRef]
  37. Godoy-Reyes, T.M.; Costero, A.M.; Gaviña, P.; Martínez-Máñez, R.; Sancenón, F. A Colorimetric Probe for the Selective Detection of Norepinephrine Based on a Double Molecular Recognition with Functionalized Gold Nanoparticles. ACS Appl. Nano Mater. 2019, 2, 1367–1373. [Google Scholar] [CrossRef]
  38. Ramakrishnam Raju, M.V.; Lin, H.C. Self-assembly of Tetraphenylethene-based [2]catenane driven by acid–base-controllable molecular switching and its enabled aggregation-induced emission. Org. Lett. 2014, 16, 5564–5567. [Google Scholar] [CrossRef] [PubMed]
  39. Ma, Y.; Zeng, Y.; Liang, H.; Ho, C.L.; Zhao, Q.; Huang, W.; Wong, W.Y. A water-soluble tetraphenylethene based probe for luminescent carbon dioxide detection and its biological application. J. Mater. Chem. 2015, 3, 11850–11856. [Google Scholar] [CrossRef]
  40. Russell, D.H. Increased polyamine concentrations in the urine of human cancer patients. Nat. Cell Biol. 1971, 233, 144–145. [Google Scholar] [CrossRef] [PubMed]
  41. Jiang, X. Determination of polyamines in urine of normal human and cancer patients by capillary gas chromatography. Biomed. Chromatogr. 1990, 4, 73–77. [Google Scholar] [CrossRef] [PubMed]
  42. Chemicalize. Available online: https://chemicalize.com/ (accessed on 31 March 2021).
  43. Case, D.A.; Darden, T.A.; Cheatham, T.E., III; Simmerling, C.L.; Wang, J.; Duke, R.E.; Luo, R.; Walker, R.C.; Zhang, W.; Merz, K.M.; et al. AMBER 12; University of California: San Francisco, CA, USA, 2012. [Google Scholar]
  44. Zhao, Y.; Truhlar, D.G. The M06 suite of density functionals for main group thermochemistry, thermochemical kinetics, nonscovalent interactions, excited states, and transition elements: Two new functionals and systematic testing of four M06-class functionals and 12 other functionals. Theor. Chem. Acc. 2008, 120, 215–241. [Google Scholar] [CrossRef] [Green Version]
  45. Ditchfield, R.; Hehre, W.J.; People, J.A. Self-Consistent Molecular Orbital Methods. 9. Extended Gaussian-type basis for molecular-orbital studies of organic molecules. J. Chem. Phys. 1971, 54, 724. [Google Scholar] [CrossRef]
  46. Grimme, S.; Antony, J.; Ehrlich, S.; Krieg, H. A consistent and accurate ab initio parameterization of density functional dispersion correction (DFT-D) for the 94 elements H-Pu. J. Chem. Phys. 2010, 132, 154104. [Google Scholar] [CrossRef] [PubMed] [Green Version]
  47. Frisch, M.J.; Trucks, G.W.; Schlegel, H.B.; Scuseria, G.E.; Robb, M.A.; Cheeseman, J.R.; Scalmani, G.; Barone, V.; Petersson, G.A.; Nakatsuji, H.; et al. Gaussian 16; Revision A.03; Gaussian, Inc.: Wallingford, CT, USA, 2016. [Google Scholar]
  48. Computational Chemistry Comparison and Benchmark DataBase. Available online: https://cccbdb.nist.gov/vibscalejustx.asp (accessed on 31 March 2021).
Figure 1. Structure of fluorescent chemosensor 1 and some aliphatic biogenic amines.
Chemosensors 10 00008 g001
Scheme 1. Synthetic pathway for the preparation of chemosensor 1.
Chemosensors 10 00008 sch001
Figure 2. Fluorescence emission spectra of sensor 1 (50 µM in acetonitrile) in the absence and presence of 2 equiv. of different amines (phosphate buffer, pH = 7.4) (λexc = 340 nm).
Chemosensors 10 00008 g002
Figure 3. A total of 50 µM of the sensor in acetonitrile in the presence of 2 equiv. of different amines (in phosphate buffer = 7.4) (solvent mixture acetonitrile:water 98:2) (λem at 473 nm, λexc = 340 nm).
Chemosensors 10 00008 g003
Figure 4. (a) Fluorescence titration of sensor 1 (50 µM in acetonitrile) with Spm in urine (final solvent acetonitrile:water 98:2); (b) calibration curve: emission at λem = 473 nm.
Chemosensors 10 00008 g004
Figure 5. Tracking the hydrogen bonds between chemosensor 1 and the biogenic aliphatic amines and the amine neurotransmitters during the simulation time (50 ns). For the sake of clarity, the average of every 20 points was plotted. The charge of each amine is included in the legend of the plot.
Chemosensors 10 00008 g005
Figure 6. Front view (a) and side view (b) of the 1: Spm (4+) complex selected structure.
Chemosensors 10 00008 g006
Publisher’s Note: MDPI stays neutral with regard to jurisdictional claims in published maps and institutional affiliations.