Abstract
The excessive growth of cyanobacteria in freshwater sources produces the development of toxic blooms mainly due to the production of cyanotoxins. Here, a novel impedimetric biosensor based on a three-dimensional interdigitated electrode array (3D-IDEA) for detection of cyanobacteria cells is reported. The 3D-IDEA sensor surface biofunctionalization was performed by means of the layer-by-layer method using polyethyleneimine (PEI) as the anchoring layer and concanavalin A (Con A) as the bioreceptor to lipopolysaccharides of cyanobacteria cells. The developed PEI-Con A 3D-IDEA sensors show a linear response (R2 = 0.992) of the impedance changes (RS) versus the logarithm of cyanobacteria concentrations in the range of 102–105 cells·mL−1 with the detection limit of 100 cells·mL−1. Moreover, to prevent the interference from components that may be present in real water samples and minimize a possible sample matrix effect, a filtration methodology to recover cyanobacterial cells was developed. The proposed methodology allows 91.2% bacteria recovery, permitting to obtain results similar to controlled assays. The developed system can be used in aquatic environments to detect cyanobacteria and consequently to prevent the formation of blooms and the production of cyanotoxins. Con A can bind to most polysaccharides and so react with other types of bacteria. However, currently, on the market, it is not possible to find specific biorecognition elements for cyanobacteria. Taking into consideration the specificity of samples to be analyzed (natural water resources), it is difficult to expect high concentration of other bacteria. In this sense, the developed methodology may be used as an alarm system to select samples for more thorough and precise laboratory analysis.
1. Introduction
Blue-green algae, also known as Cyanobacteria, are a type of photosynthetic Gram-negative bacteria and are extremely common in various ecosystems due to their high adaptability to various environmental conditions. They play an important role in the biochemical cycles of oxygen, nitrogen, and carbon synthesis in nature [1,2,3]. However, under uncontrolled growth, they cause a rapid bloom of water sources, leading to a sharp decrease in water quality [4,5,6].
Cyanobacterial blooms may induce hypoxia or anoxia creating the death of fish or benthic invertebrates, and also produce taste and odor compounds prejudicing the recreational functions of lakes and rivers and their use as reservoirs for drinking water [7]. However, the main problem of cyanobacterial blooms is related with the production of toxic secondary metabolites known as cyanotoxins [8,9].
Depending on their action, cyanobacteria metabolites are divided into hepatotoxins, neurotoxins, cytotoxins, and dermatoxins, and according to this classification affect the vital systems of various organisms, including humans, animals, and plants [8]. Additionally, another group of potential toxins are cyanobacterial lipopolysaccharides (LPS), also known as cyanobacterial endotoxins, can produce various diseases [10,11,12]. In that sense, detection of cyanobacteria is quite demanding to prevent the presence of cyanotoxins and guarantee water safety for different needs.
Numerous works published in the last years indicate that eutrophication process, added to the increase in CO2 and global warming, increases the intensity and duration of cyanobacterial blooms in aquatic environments [13,14]. The World Health Organization (WHO) has evaluated different alert levels to correlate the cell concentrations of cyanobacteria in water and the related health risk [15,16]. The first level, the vigilance level, corresponds to the stage of cyanobacteria bloom development in which the concentration is between 500 and 2000 cells·mL−1. Even though the probability of adverse health effects at this level is relatively low, it is important to detect low concentrations to prevent the appearance of blooms and, in consequence, of cyanotoxins.
Most commonly, detection of cyanobacteria is performed by cell counting using microscopy. Along with this, modern bioanalytical techniques, such as flow cytometry, molecular-based methods, or taxonomic analysis [17,18], may be used. However, these methods use expensive high-precision instruments and require specially prepared qualified staff. The existing situation with the blooming of water sources urgently requires the development of small portable devices capable of monitoring water quality in real time. In this case, the use of biosensors greatly simplifies the task of such control. A high number of recent publications and reviews reports applications of different biosensors for detection of toxins and cyanotoxins in water using various biorecognition elements and transducers supports [19,20,21,22,23,24,25,26]. Nevertheless, the performance of these biosensors is focused on the detection of cyanotoxins and not the cyanobacteria cells. Taking into consideration that the release of cyanotoxins is mainly produced after the growth of cyanobacterial blooms [5], it is reasonable to consider that, to prevent the contamination of water environments with cyanotoxins, the detection of bacterial cells should be performed at low concentrations.
Among different types of biosensors for bacteria, detection impedimetric biosensors are distinguished as versatile analytical devices with high sensitivity and accuracy [27], allowing to perform the detection in a label-free mode [28]. Sensors of this type register changes in the interfacial electrical properties of metal electrodes caused by the interaction between the biochemical recognition element on the electrode surface and the analyte in solution. Thus, the electrochemical impedance method allows you to control the changes caused by various chemical and biochemical reactions at the electrode/liquid interface [29].
Impedance measurements can be carried out directly in electrolyte solutions in a non-faradaic mode in the absence of redox pair. In this case, the flowing current between the electrodes will depend on the interfacial capacitance and the conductivity of the surrounding solution [30]. Among the different types of electrodes that may be used for impedance measurements, interdigital electrode arrays (IDEAs) have significant advantages over other types of sensors in terms of small device size, fast equilibrium, and high signal-to-noise ratio [31]. We have previously proposed a method for increasing the sensitivity of traditional planar IDEA transducers by separating two comb-like electrodes by silicon oxide insulating barriers [32]. The resulting electrodes have a three-dimensional (3D-IDEA) structure and due to this, they respond with increased sensitivity to the redistribution of electric charges on the surface caused by chemical and biochemical reactions on the barrier surface which permits the label-free determination of bacteria.
In this work, 3D-IDEA transducers are used as impedimetric biosensors for the detection of cyanobacteria cells. Hence, we present an approach to perform a fast and sensitive system for the detection of low concentration of cyanobacteria in a short time in liquid samples. This methodology can be applied for preventing the growth of cyanobacteria in aquatic environments and, consequently, to avoid the release of cyanotoxins.
The methodology employed is based on the use of a layer-by-layer technique to functionalize the surface of 3D-IDEA devices with polyethyleneimine (PEI), a positively charged polycation used for the formation of multilayers, employed as the anchoring layer, and lectin, concanavalin A (Con A), as the bioreceptor molecule [33]. Con A, a carbohydrate-binding protein that specifically recognizes α -D-glucose and α-D-mannose groups, has been used for biosensors development due to its ability to bind carbohydrates, including lipopolysaccharides (LPS) (endotoxins) [34,35]. Taking into consideration that cyanobacterial endotoxins are present on the external membrane of the cell, here the use of Con A as a biorecognition element is proposed to selectively detect whole cyanobacteria by means of the specific reaction between Con A and LPS.
In the present study, the biofunctionalization process of 3D-IDEA surface, as well as the detection of various concentrations of cyanobacteria, were monitored by means of impedance measurements in non-faradaic conditions, considered more amenable for biosensing applications [30]. The sensor surface modification strategy used in this work is schematically presented in Figure 1. To prevent a possible interference often registered in natural samples, a filtration system and a method of bacteria cells recovery were developed for the biosensor application in real samples. The proposed biosensing approach shows the possibility to detect low concentrations of cyanobacteria and the system may be regarded as a potential tool to be employed as alarm system in aquatic environments to prevent the growth of cyanobacterial blooms and cyanotoxins.
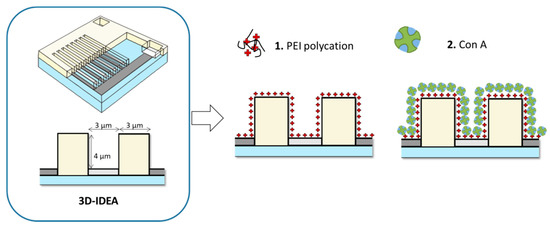
Figure 1.
Schematic representation of 3D-IDEA and surface sensor biofunctionalization steps.
2. Materials and Methods
2.1. Sensor Fabrication
3D-IDEA were fabricated using standard microelectronic processes presented in detail elsewhere [32,35]. The fabrication of the electrode array was performed using silicon wafers coated with a 2.5 µm layer of thermal silicon oxide as a substrate. Highly conducting tantalum silicide, TaSi2, was deposited as an electrode material by magnetron sputtering. The electrode pattern was developed using standard lithography technique resulting in the interdigitated array with 216 electrode digits. Individual digits are 3 µm wide separated one from another by 3 µm. To form the barriers, the wafer with patterned electrode arrays was coated with a 4 µm thick silicon dioxide layer using low pressure chemical vapor deposition (LPCVD). After that, deep reactive ion etching (DRIE) was used to open electrode digits for sensing and contact pads for wiring. In this way, a three-dimensional array structure was obtained with 4 µm high insulating barriers with practically vertical walls separating the electrode digits.
2.2. Reagents, Solutions, and Materials
Cationic polyethyleneimine (PEI, branched, average molecular weight 25,000, water-free) was dissolved in deionized water at 1.5 mg·mL−1 according to published recommendations [36]. The lectin concanavalin A (Con A, from jack bean—Canavalia ensiformis), employed here as the biorecognition element, was prepared at different concentrations (1000, 100, 50, 25, and 10 μg·mL−1 in 0.05 M Tris-HCl buffer (pH = 7.4). Poly (sodium 4-styrenesulfonate) (PSS, average molecular weight 70,000, water-free) was prepared at 2 mg· mL−1 in deionized water.
In all experiments, deionized water was used to prepare buffers and solutions for sensor modification and impedance measurements. The chemical reagents were provided by Sigma-Aldrich (Barcelona, Spain) Synechocystis sp. PCC 6803, the strain BEA ID: 1138B, were provided by Spanish Bank of Algae (La Palma, Spain) (Banco Español de Algas, Canarias).
2.3. D-IDEA Sensors Functionalization with PEI-Con A
Before modification, the electrodes were kept in ethanol for 10 min and dried with nitrogen. The initial layer of polyethyleneimine (PEI) was deposited on the sensors’ surface by exposing them to an aqueous solution of the polymer for 20 min. This PEI layer is formed by electrostatic interaction between the negatively charged silicon oxide surface and the positively charged polycation chains. At the next stage, thus modified sensors were treated with Con A solutions of various concentrations. The reaction time was 60 min. After each modification step, the 3D-IDEA sensors were rinsed with distilled water to remove non-attached molecules. At pH 7.4, Con A is negatively charged acting as a polyanion which helps its immobilization by the layer-by-layer method over PEI layer.
2.4. Cyanobacteria Cultivation and Detection Assays
Synechocystis sp. PCC 6803 was employed as a model cyanobacteria to perform the detection experiments. Synechocystis sp. PCC 6803 was cultivated in the BG-11 medium (Sigma-Aldrich) containing trace metals mix A5 (Sigma-Aldrich). Being photosynthetic bacteria, cyanobacteria need day/night cycles for their optimal growth. Thus, the cultures were maintained under dark and light (6082 lux) conditions for 12 h, respectively, at a constant temperature of 18 °C.
To prepare cyanobacteria samples, the cells were harvested by centrifugation at 8000 g for 5 min, washed three times in sterile KCl 10−5 M, and finally re-suspended in 1 mL of the same solution. Then, 0.02 mL of a cyanobacteria sample was placed in a counting chamber and the concentration was quantified by fluorescence microscopy using a Zeiss Imager M2 microscope. The concentration in terms of number of cells per milliliter was calculated according Equation (1).
where no cells is the average of cells number counted at different areas of the container, analyzed area is the area where the sample is spread over, microscope field is the area observed by the microscope (40 X = 0.08 mm2), V is the sample volume (in mL) placed in the container, and DF is the dilution factor of the initial culture.
The detection of bacteria was carried out as follows: PEI-Con A modified electrodes were placed into an electrochemical cell with 50 mL of 10−5 M KCl containing suspension of cyanobacteria. The studied bacteria concentration was in the range from 10 to 104 cells·mL−1. As a control, we investigated a sensor immersed in a potassium chloride solution without cyanobacteria and an unmodified electrode in contact with the highest concentration of 104 cells·mL−1. All measurements were carried out under constant solutions, stirring in order to maintain homogeneous distribution of bacteria throughout the volume of the measured cell. Similarly, the behavior of sensors modified only with polyethyleneimine was studied in order to study the electrostatic interaction between cyanobacteria and the polycation on the sensor surface.
2.5. Cyanobacteria Recovery Methodology
From a growth culture of Synechocystis sp., different serial dilutions were performed to obtain a final concentration about 104 cells·mL−1. First, 1 mL was inoculated in a final volume of 15 mL of KCl 10−5 M and the resulting samples were filtered through 25 mm diameter polycarbonate (PC) membranes (Whatman Nuclepore Track-Etched Polycarbonate, GE Healthcare Life science) with a pore size of 0.2 µm. For the filtration of a 15 mL sample, the pump system requires around 1 min. Subsequently, filter membranes with retained cyanobacteria were transferred to a sterile tube with 50 mL of KCl 10−5 M and were vortexed for 1 min to extract the cells from the filter surface to the solution. Finally, the cyanobacteria re-suspended in the 50 mL of solution were incubated with the sensors, as described previously, to perform a detection assay. In parallel, a detection assay with the proposed methodology described in Section 2.4 was done to compare the response obtained in initial and recovered samples.
2.6. Impedance Measurements
The impedance measurements were carried out in 10−5 M KCl solutions under constant room temperature in a non-faradaic mode using a precision QuadTech 7600 Plus analyzer. The studied frequency range was 100 Hz–100 kHz with test voltage of 100 mV. For the impedance data treatment and equivalent circuit fitting, the Z-Plot/Z-View software package was applied (Scribner Associates, Southern Pines, NC, USA). All experiments, unless otherwise indicated, were performed in triplicate. Bulk solution conductivity of 10−5 M KCl used for impedance measurements was controlled with a commercial conductimeter Crison EC-3 to maintain it constant at 2.50 µS/cm and a fresh portion of solution for each single measurement was used.
3. Results
3.1. Sensor Characterization
The use of 3D-IDEA sensors for the development of different biosensing applications was widely studied in previous works [35,37]. The electrochemical impedance spectroscopy (EIS) is a robust method that allows monitoring the phenomena that are occurring on the device surface as well as changes in the bulk proprieties of the medium in contact. Therefore, using EIS, it is possible to easily control the electrode surface modifications steps at all biosensor development stages.
In highly conductive electrolyte solutions, the impedance of IDEA transducers measured in a non-faradaic mode mainly depends on the bulk solution conductivity and the capacitance at the electrode surface. However, when the impedance of an IDEA is measured in solutions with low electrolyte concentrations, the surface conductivity within the spacing between the electrodes starts to play a significant role due to the presence of surface charges at the SiO2 surface. This effect is much higher in the case of 3D-IDEA [38] due to the fact that the main part of the current flowing between adjacent electrodes passes along the surface of the barriers. In this case, the sensitivity of three-dimensional structures in comparison with planar structures is significantly increased and makes it possible to fairly accurately control the processes of surface modification of electrodes and to use them for detection of different analytes.
The impedance of the studied 3D-IDEA transducers may be well represented by the equivalent circuit (EC) shown in Figure 2. Its components have the following physical meaning: Rc—resistance of contact wires and intrinsic resistance of thin film electrodes; CG—the stray (geometrical) capacitance of an electrode array; RS—electrical resistance between two electrodes in a water solution and a constant phase element, CPED, representing the capacitance at the metal/water solution interface. In an earlier work [38], we showed that RS is a parallel combination of the bulk solution resistance RBULK and the surface resistance RSURF. Taking into consideration that all the experiments are performed in 10−5 M KCl solutions, the bulk solution resistance remains high and constant through the experiments, all detected changes in RS are referred to the surface resistance variation due to the surface charge modification produced by surface reactions.
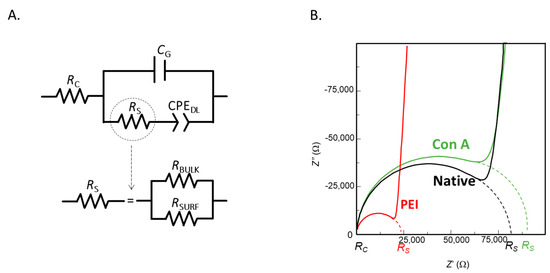
Figure 2.
(A) Electrical equivalent circuit and (B) Nyquist plot of 3D-IDEA measured in 10−5 M KCl solution with bare electrodes and functionalized with PEI and PEI-Con A.
Figure 2B presents the impedance spectra of sensors after each step of surface modification. The semicircle at high frequencies appears due to the parallel combination of RS and CG. Intercept of the semicircle on the right side gives the value of RS, which is a parallel combination of RBULK and RSURF. At low frequencies, the linear response is due to the CPE of the interfacial capacitance.
The impedance spectra observed in the Nyquist plot (Figure 2B) shows the formation of a semicircle at high frequencies, which corresponds to the RS in parallel with the geometrical capacitance CG. The intercept with the Z′ axis on the left side gives the RC values, while the intercept on the right side gives the value of RC + RS, where RS is the parallel combination of RBULK and RSURF. The linear response at low frequencies in the Nyquist plot is produced by a CPE of the interfacial capacitance.
3.2. Sensor Surface Biofunctionalization
In order to perform the biofunctionalization of the 3D-IDEA surface, the sensors were first modified with PEI. PEI molecules are highly positively charged, which allows their strong interaction with negatively charged silicon dioxide surface [39]. The presence of positive charges at the modified sensor surface results in the increase the surface conductivity and, as a consequence, adsorption of PEI on the surface produces a decrease in the RS values with subsequent impedance spectra changes that can be observed in the Nyquist plot. In that sense, PEI can be employed as an anchoring layer to perform immobilization of negatively charged components by layer-by-layer method. Here, PEI was employed for the immobilization of Con A as the bioreceptor molecule for detection of cyanobacteria.
Particularly, negative charges are typically present on the bacteria external membrane, which can be attributed to different ionizable components such as proteins, polysaccharides, phospholipids, lipopolysaccharides, etc. [40]. Hence, polyethyleneimine may interact by electrostatic attraction with bacteria cells present in samples.
Figure 3 presents the response of PEI modified sensors in the presence of bacteria which confirms the non-specific interaction of cyanobacteria with 3D-IDEA functionalized with PEI. It can be observed that after different incubation times, the impedance response, here represented as changes in RS, is increasing progressively, reaching a saturation phase after 2 h. In the case of 3D-IDEA sensors with PEI in absence of cyanobacteria, the response remains stable in time.
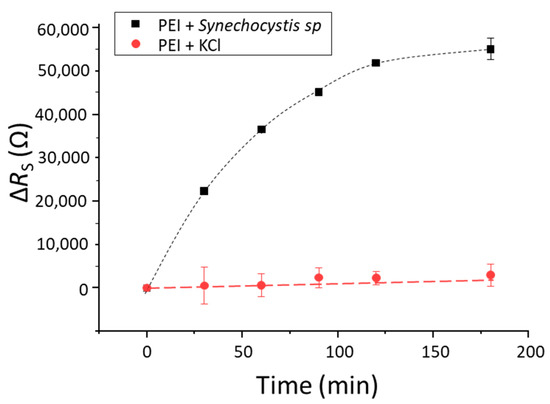
Figure 3.
Impedance response (RS) in time of PEI modified electrodes with cyanobacteria at 104 cells/mL (black squares) and in absence of cyanobacteria (red circles). Error bars show standard deviation (n = 3).
To obtain the required specificity of the sensor to bacteria, sensors covered with PEI layer were modified with Con A as a biorecognition element. It is important to guarantee that the response of PEI-Con A modified 3D-IDEA electrodes originates from the selective reaction between Con A and the LPS on the surface of cyanobacteria and not from non-specific electrostatic interaction between PEI and bacteria. In that sense, it is crucial to optimize the concentration of Con A immobilized on the 3D-IDEA sensor to ensure that PEI is completely covered and its positive charges are completely blocked. In that mode, it can be assumed that the reaction between Con A as the biorecognition element and cyanobacteria lipopolysaccharides is achieved selectively.
To study the screening effect of Con A over the PEI, layer sensors were treated in solutions of Con A at concentrations of 10, 25, 50, 100, and 1000 µg·mL−1. The test was performed by reaction of the PEI-Con A modified sensors with polystyrene sulfonate (PSS) polyanion. It is generally known that PSS, employed for assembling different layers using the layer-by-layer methods [36], readily reacts with PEI by electrostatic interactions reversing the surface charge to negative [41]. PEI-Con A 3D-IDEA sensors were immersed in a 2 mg·mL−1 PSS solution for 20 min and, after a washing step, their impedance was measured in 10−5 M KCl.
Figure 4 presents changes in RS observed after sensors modification with Con A at different concentrations (from 25 to 1000 µg·mL−1). On the same graph, mean RS values of electrodes modified only with PEI after the addition PSS are shown. At low concentrations of Con A (10, 25 and 50 µg·mL−1), after the addition of PSS, a significant increase in RS was observed (not shown on the graph due to high standard deviation of RS absolute values obtained on 3 different sensors used in each experiment), demonstrating that PEI charges were still exposed on the sensor surface. However, in the case of 100 and 1000 µg·mL−1 after the addition of PSS, the response remained almost stable and no significant changes were observed. This demonstrates that PEI was completely screened by Con A molecules and no reaction with PSS was produced. Thus, these Con A concentrations can be used for surface modifications of 3D-IDEA with PEI-Con A to perform the detection assays with cyanobacteria without interference of PEI. Considering that both concentrations of Con A were optimal for the detection of cyanobacteria, the lowest, 100 µg·mL−1, was selected in further experiments.
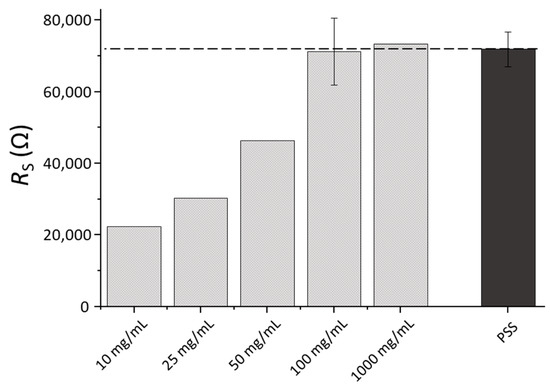
Figure 4.
RS values of 3D-IDEA modified with PEI and different concentrations of Con A (10, 25, 50, 100, and 1000 µg·mL−1) and after the addition of PSS.
Accordingly, the reproducibility in 3D-IDEA sensors surface modification with PEI and Con A was evaluated in terms of their RS values after the modification. In this case, a high reproducibility of 89.6% was achieved.
3.3. Cyanobacteria Detection with PEI-Con A 3D-IDEA Sensors
Once the optimal conditions of sensors biofunctionalization with PEI and Con A were established, the biosensors were used to study the response to the presence of cyanobacteria. Therefore, to demonstrate the applicability of developed biosensors, the sensitivity and the limit of detection were evaluated as the main parameters [42].
The impedance response of a sensor within cyanobacteria detection experiments was expressed as changes in RS, according to the Equation (2):
where RSPEI-Con A is the resistance of 3D-IDEA biofunctionalized with PEI and Con A in the absence of bacteria and RSCyanobacteria is the resistance values after the sensor exposure to Synechocystis cyanobacteria at different concentrations.
As presented in the experimental section, cyanobacteria detection assays were performed in Synechocystis sp. suspensions in 10−5 M KCl solution at different concentrations (101, 102, 103 and 104 cells·mL−1). After 60 min of the sensors’ incubation, their impedance response was measured in 10−5 M KCl solution. As controls, PEI-Con A modified 3D-IDEA sensors were immersed in KCl solution without cyanobacteria for the same period of time to guarantee the stability of the sensors in terms of surface modifications and impedance response. In addition, non-functionalized 3D-IDEA were employed to demonstrate the no adsorption of bacteria on native SiO2 surface occurs.
Figure 5 presents a semi-logarithmic plot of the variation of the impedance response (ΔRS) versus the concentration of Synechocystis sp. (in cells·mL−1). The sensors’ response shows a good linear correlation of ΔRS = R0 + S · logC with a correlation coefficient (R2) of 0.992 and a sensitivity of S = 5.96 kOhm per cyanobacteria concentration decade. The limit of detection (LoD) of the proposed biosensor was calculated using the method reported by Shrivastava et al. [43] as LoD = Xb1 + 3Sb1. Here, Xb1 is the mean signal value (RS) measured in the absence of bacteria, and Sb1 is the standard deviation in the blank. Thus, the determined limit of detection (LoD) of the proposed biosensor is equal to 100 cells·mL−1.
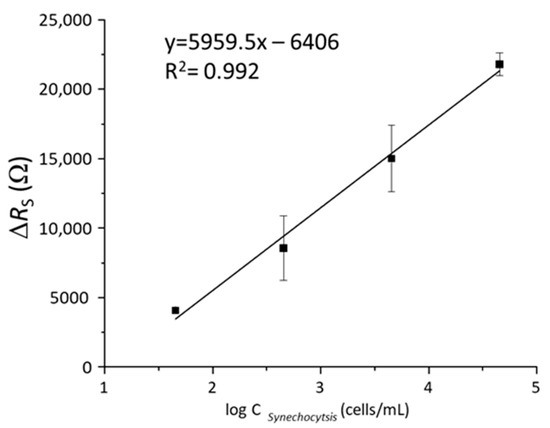
Figure 5.
Linear calibration curve of impedance changes, ΔRS, as function of the logarithmic concentration of Syenchocystis sp. cyanobacteria from 101 to 104 cells mL−1.
In that sense, the limit of detection is of great relevance considering that the WHO indicates that early stages in cyanobacteria blooms development is produced at concentrations lower than 2000 cells·mL−1 [15]. Therefore, the proposed biosensing approach may be regarded as a real alternative method for detection of cyanobacteria in liquid samples with certain advantages over standard procedures, especially in terms of sensitivity and rapid detection time [17,18].
3.4. Cyanobacteria Recovery for Liquid Samples Analysis
As previously commented, it is essential to guarantee, from a microbiological point of view, the quality of water for different uses [5]. Therefore, for real natural samples analysis it is required to consider possible interference from other components that may be present in water, apart from the different bacterial strains. In that sense, the use of methodologies to prevent the possibility matrix effect of real samples on the sensor response is a crucial point. Here, we propose a filtration system to recover cyanobacteria cells as a strategy to reduce the possible matrix effect. Moreover, this approach may also help to concentrate bacteria present in large volume samples, which is a usual problem in quality water control.
After filtration process detailed in the experimental section, cyanobacteria retained in the filter were transferred to a controlled volume of KCl solution to perform the detection assays with PEI-Con A 3D-IDEA biosensors. In parallel, to quantify the bacteria recovery process, the same measurements were performed in the samples with the same concentration of cyanobacteria directly obtained by centrifugation from the cultures. Obtained results presented as changes in impedance (ΔRS) after both detection assays are shown in Figure 6. In both cases, the response is almost of the same magnitude, though slightly higher in the case of the direct assay. This is plausible considering that after the recovery process, a few bacteria may be retained on the filter.
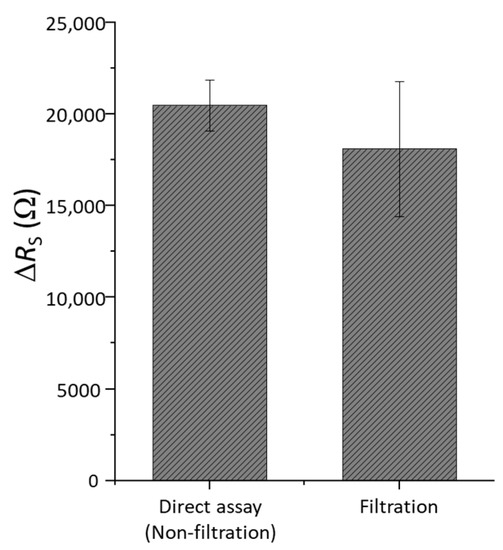
Figure 6.
Impedance changes (ΔRS) of 3D-IDEA functionalized with PEI-Con A in a standard detection assay and with cyanobacteria recovered after the filtration process.
In order to evaluate the efficiency of cells recuperation after filtering process, the recovery rate was determined. Using RS values obtained in two experiments the logarithm of cyanobacteria concentration was determined from the calibration plot (Figure 5). These values constituted 4.11 cells·mL−1 after filtration and recovery and 4.51 cells·mL−1 obtained in the initial sample used for filtration. The recovery rate was calculated by equation 3.
In this case, the resulting recovery was about 91.2% of cyanobacteria. Therefore, the proposed method may be successfully used for real sample analysis in order to reduce the effect of contaminants found in water and to avoid interferences on the sensor response. Accordingly, it is possible to ensure the specific response of the biosensor to bacteria.
It is necessary to remark that the use of specific antibodies or aptamers in this kind of sensor would permit to achieve high selectivity in comparison to Con A, which may react with other types of bacteria. Earlier, we reported interaction of Con A modified IDEA sensors with E. coli [40] and bacteria endotoxins [35]. However, currently, on the market, it is not possible to find truly specific biorecognition elements for cyanobacteria. Taking into consideration the specificity of samples to be analyzed (natural water resources), it is difficult to expect high concentration of other bacteria. In this sense, the developed methodology may be used as an alarm system to select samples for more thorough and precise laboratory analysis.
4. Conclusions
In the present work, the development of a novel biosensing tool using impedimetric sensors based on three dimensional interdigitated electrodes (3D-IDEA) for detection of cyanobacteria cells is reported. The proposed system allows detection of cyanobacteria at low concentrations, which can be used in aquatic environments to prevent the formation of blooms and the production of cyanotoxins.
The 3D-IDEA sensor surface biofunctionalization was performed by means of the layer-by-layer method using polyethyleneimine (PEI) as the anchoring layer and concanavalin A (Con A) as the bioreceptor to cyanobacteria cells. Con A interacts specifically with lipopolysaccharides (LPS/endotoxins) which are present on the external membrane of cyanobacteria cells. The development process was controlled by EIS technique to register the changes in sensors impedance after each modification step. Impedance measurements were also used for the detection of cyanobacteria. To prevent non-specific adsorption of cyanobacteria on a PEI-covered sensor surface, Con A concentration used for immobilization was optimized to guarantee blocking of the PEI layer and achieve high reproducibility of the immobilization procedure.
The developed PEI-Con A 3D-IDEA sensors show a linear response (R2 = 0.992) of the impedance changes (RS) versus logarithm of cyanobacteria concentrations with the detection limit of 100 cells·mL−1. Moreover, to prevent the interference from components that may be present in real water samples and minimize a possible sample matrix effect, a filtration methodology to recover cyanobacterial cells has been tested. The proposed methodology allows 91.2% of bacteria recovery, permitting to obtain results similar to control assays. Therefore, this technology is really promising to be employed as an alarm system in water analysis, which could be improved in terms of selectivity by using other biorecognition elements, such as specific antibodies or aptamers, when they are available.
Author Contributions
Conceptualization, A.B. and S.B.-O.; methodology, N.U.; validation, N.A. and N.U.; formal analysis, S.B.-O.; investigation, J.J.E. and S.C.-A.; data curation, S.B.-O.; writing—original draft preparation, S.B.-O.; writing—review and editing, A.B.; supervision, A.B. All authors have read and agreed to the published version of the manuscript.
Funding
This research was funded by SMARTECOPONIC Project (PCIN-2017-031) from WATERWORKS15 ERA-NET and by INTRAMURAL Project (201850E071) from CSIC.
Conflicts of Interest
The authors declare no conflict of interest.
References
- Mazard, S.; Penesyan, A.; Ostrowski, M.; Paulsen, I.T.; Egan, S. Tiny Microbes with a Big Impact: The Role of Cyanobacteria and Their Metabolites in Shaping Our Future. Mar. Drugs 2016, 14, 97. [Google Scholar] [CrossRef] [Green Version]
- Farrokh, P.; Sheikhpour, M.; Kasaeian, A.; Asadi, H.; Bavandi, R. Cyanobacteria as an eco-friendly resource for biofuel production: A critical review. Biotechnol. Prog. 2019, 35, e2835. [Google Scholar] [CrossRef] [PubMed]
- Sharma, N.K.; Tiwari, S.P.; Tripathi, K.; Rai, A.K. Sustainability and cyanobacteria (blue-green algae): Facts and challenges. J. Appl. Phycol. 2010, 23, 1059–1081. [Google Scholar] [CrossRef]
- Paerl, H.W.; Otten, T.G. Harmful Cyanobacterial Blooms: Causes, Consequences, and Controls. Microb. Ecol. 2013, 65, 995–1010. [Google Scholar] [CrossRef] [PubMed]
- Huisman, J.; Codd, G.A.; Paerl, H.W.; Ibelings, B.W.; Verspagen, J.M.H.; Visser, P.M. Cyanobacterial blooms. Nat. Rev. Genet. 2018, 16, 471–483. [Google Scholar] [CrossRef]
- Plaas, H.E.; Paerl, H.W. Toxic Cyanobacteria: A Growing Threat to Water and Air Quality. Environ. Sci. Technol. 2020, 55, 44–64. [Google Scholar] [CrossRef] [PubMed]
- Rabalais, N.N.; Díaz, R.J.; Levin, L.A.; Turner, R.E.; Gilbert, D.; Zhang, J. Dynamics and distribution of natural and human-caused hypoxia. Biogeosciences 2010, 7, 585–619. [Google Scholar] [CrossRef] [Green Version]
- Cirés, S.; Casero, M.C.; Quesada, A. Toxicity at the Edge of Life: A Review on Cyanobacterial Toxins from Extreme Environments. Mar. Drugs 2017, 15, 233. [Google Scholar] [CrossRef] [PubMed]
- Merel, S.; Walker, D.; Chicana, R.; Snyder, S.; Baurès, E.; Thomas, O. State of knowledge and concerns on cyanobacterial blooms and cyanotoxins. Environ. Int. 2013, 59, 303–327. [Google Scholar] [CrossRef] [PubMed]
- Stewart, I.; Schluter, P.J.; Shaw, G.R. Cyanobacterial lipopolysaccharides and human health—A review. Environ. Health 2006, 5, 7. [Google Scholar] [CrossRef] [Green Version]
- Durai, P.; Batool, M.; Choi, S. Structure and Effects of Cyanobacterial Lipopolysaccharides. Mar. Drugs 2015, 13, 4217–4230. [Google Scholar] [CrossRef] [PubMed]
- Du, X.; Liu, H.; Yuan, L.; Wang, Y.; Ma, Y.; Wang, R.; Chen, X.; Losiewicz, M.D.; Guo, H.; Zhang, H. The Diversity of Cyanobacterial Toxins on Structural Characterization, Distribution and Identification: A Systematic Review. Toxins 2019, 11, 530. [Google Scholar] [CrossRef] [Green Version]
- Visser, P.M.; Verspagen, J.M.; Sandrini, G.; Stal, L.J.; Matthijs, H.C.; Davis, T.W.; Paerl, H.W.; Huisman, J. How rising CO2 and global warming may stimulate harmful cyanobacterial blooms. Harmful Algae 2016, 54, 145–159. [Google Scholar] [CrossRef] [Green Version]
- Chapra, S.C.; Boehlert, B.; Fant, C.; Bierman, J.V., Jr.; Henderson, J.; Mills, D.; Mas, D.M.L.; Rennels, L.; Jantarasami, L.; Martinich, J.; et al. Climate Change Impacts on Harmful Algal Blooms in U.S. Freshwaters: A Screening-Level Assessment. Environ. Sci. Technol. 2017, 51, 8933–8943. [Google Scholar] [CrossRef] [PubMed]
- Chorus, I.; Bartram, J. Toxic cyanobacteria in water. In A Guide to Their Public Health Consequences, Monitoring and Management; Chorus, I., Bertram, J., Eds.; E&FN Spon on behalf of the World Health; St. Edmundbary Press: Suffolk, UK, 1999. [Google Scholar]
- Guidelines for Safe Recreational Water Environments. In Coastal and Fresh Waters; World Health Organization: Malta, 2003; Volume 1, Available online: https://apps.who.int/iris/bitstream/handle/10665/42591/9241545801.pdf?sequence=1 (accessed on 21 September 2021).
- Meriluoto, J.; Spoof, L.; Codd, G.A. Handbook of Cyanobacterial Monitoring and Cyanotoxin Analysis; John Wiley & Sons: Hoboken, NJ, USA, 2017. [Google Scholar]
- Poniedziałek, B.; Falfushynska, H.I.; Rzymski, P. Flow cytometry as a valuable tool to study cyanobacteria: A mini-review. Limnol. Rev. 2017, 17, 89–95. [Google Scholar] [CrossRef] [Green Version]
- Cunha, I.; Biltes, R.; Sales, M.; Vasconcelos, V. Aptamer-Based Biosensors to Detect Aquatic Phycotoxins and Cyanotoxins. Sensors 2018, 18, 2367. [Google Scholar] [CrossRef] [PubMed] [Green Version]
- Zhang, K.; Ma, H.; Yan, P.; Tong, W.; Huang, X.; Chen, D.D. Electrochemical detection of microcystin-LR based on its deleterious effect on DNA. Talanta 2018, 185, 405–410. [Google Scholar] [CrossRef] [PubMed]
- Zhang, W.; Dixon, M.B.; Saint, C.P.; Teng, K.S.; Furumai, H. Electrochemical Biosensing of Algal Toxins in Water: The Current State-of-the-Art. ACS Sens. 2018, 3, 1233–1245. [Google Scholar] [CrossRef] [PubMed]
- Bickman, S.R.; Campbell, K.; Elliott, C.; Murphy, C.; O’Kennedy, R.; Papst, P.; Lochhead, M.J. An Innovative Portable Biosensor System for the Rapid Detection of Freshwater Cyanobacterial Algal Bloom Toxins. Environ. Sci. Technol. 2018, 52, 11691–11698. [Google Scholar] [CrossRef] [PubMed] [Green Version]
- Vogiazi, V.; De La Cruz, A.; Mishra, S.; Shanov, V.; Heineman, W.R.; Dionysiou, D.D. A Comprehensive Review: Development of Electrochemical Biosensors for Detection of Cyanotoxins in Freshwater. ACS Sens. 2019, 4, 1151–1173. [Google Scholar] [CrossRef] [PubMed]
- Kordasht, H.K.; Hassanpour, S.; Baradaran, B.; Nosrati, R.; Hashemzaei, M.; Mokhtarzadeh, A.; de la Guardia, M. Biosensing of microcystins in water samples; recent advances. Biosens. Bioelectron. 2020, 165, 112403. [Google Scholar] [CrossRef] [PubMed]
- Ogungbile, A.O.; Ashur, I.; Icin, I.; Shapiro, O.H.; Vernick, S. Rapid detection and quantification of microcystins in surface water by an impedimetric immunosensor. Sens. Actuators B Chem. 2021, 348, 130687. [Google Scholar] [CrossRef]
- Serrano, P.C.; Nunes, G.E.; Avila, L.B.; Reis, C.P.; Gomes, A.M.; Reis, F.T.; Sartorelli, M.L.; Melegari, S.P.; Matias, W.G.; Bechtold, I.H. Electrochemical impedance biosensor for detection of saxitoxin in aqueous solution. Anal. Bioanal. Chem. 2021, 413, 6393–6399. [Google Scholar] [CrossRef] [PubMed]
- Furst, A.; Francis, M.B. Impedance-Based Detection of Bacteria. Chem. Rev. 2018, 119, 700–726. [Google Scholar] [CrossRef] [PubMed]
- Daniels, J.S.; Pourmand, N. Label-Free Impedance Biosensors: Opportunities and Challenges. Electroanalysis 2007, 19, 1239–1257. [Google Scholar] [CrossRef]
- Katz, E.; Willner, I. Probing Biomolecular Interactions at Conductive and Semiconductive Surfaces by Impedance Spectroscopy: Routes to Impedimetric Immunosensors, DNA-Sensors, and Enzyme Biosensors. Electroanalysis 2003, 15, 913–947. [Google Scholar] [CrossRef]
- Berggren, C.; Bjarnason, B.; Johansson, G. Capacitive biosensors. Electroanalysis 2001, 13, 173–180. [Google Scholar] [CrossRef]
- Varshney, M.; Li, Y. Interdigitated array microelectrodes based impedance biosensors for detection of bacterial cells. Biosens. Bioelectron. 2009, 24, 2951–2960. [Google Scholar] [CrossRef] [PubMed]
- Bratov, A.; Ramón-Azcón, J.; Abramova, N.; Merlos, A.; Adrian, J.; Sánchez-Baeza, F.; Marco, M.-P.; Dominguez, C. Three-dimensional interdigitated electrode array as a transducer for label-free biosensors. Biosens. Bioelectron. 2008, 24, 729–735. [Google Scholar] [CrossRef] [PubMed]
- Kolasińska, M.; Krastev, R.; Warszyński, P. Characteristics of polyelectrolyte multilayers: Effect of PEI anchoring layer and posttreatment after deposition. J. Colloid Interface Sci. 2007, 305, 46–56. [Google Scholar] [CrossRef] [PubMed]
- da Silva, J.S.; Oliveira, M.D.; de Melo, C.P.; Andrade, C.A. Impedimetric sensor of bacterial toxins based on mixed (Concanavalin A)/polyaniline films. Colloids Surf. B Biointerfaces 2014, 117, 549–554. [Google Scholar] [CrossRef] [PubMed]
- Brosel-Oliu, S.; Galyamin, D.; Abramova, N.; Muñoz-Pascual, F.-X.; Bratov, A. Impedimetric label-free sensor for specific bacteria endotoxin detection by surface charge registration. Electrochim. Acta 2017, 243, 142–151. [Google Scholar] [CrossRef] [Green Version]
- Lvov, Y.; Ariga, K.; Ichinose, I.; Kunitake, T. Molecular film assembly via layer-by-layer adsorption of oppositely charged macromolecules (linear polymer, protein and clay) and concanavalin A and glycogen. Thin Solid Films 1996, 284, 797–801. [Google Scholar] [CrossRef]
- Brosel-Oliu, S.; Mergel, O.; Uria, N.; Abramova, N.; van Rijn, P.; Bratov, A. 3D impedimetric sensors as a tool for monitoring bacterial response to antibiotics. Lab. Chip 2019, 19, 1436–1447. [Google Scholar] [CrossRef] [Green Version]
- Bratov, A.; Abramova, N. Response of a microcapillary impedimetric transducer to changes in surface conductance at liquid/solid interface. J. Colloid Interface Sci. 2013, 403, 151–156. [Google Scholar] [CrossRef]
- Mészáros, R.; Thompson, L.; Bos, M.; de Groot, P. Adsorption and Electrokinetic Properties of Polyethylenimine on Silica Surfaces. Langmuir 2002, 18, 6164–6169. [Google Scholar] [CrossRef]
- Brosel-Oliu, S.; Abramova, N.; Bratov, A.; Vigués, N.; Mas, J.; Muñoz, F.-X. Sensitivity and Response Time of Polyethyleneimine Modified Impedimetric Transducer for Bacteria Detection. Electroanalysis 2015, 27, 656–662. [Google Scholar] [CrossRef]
- Ai, H.; Jones, S.A.; Lvov, Y.M. Biomedical Applications of Electrostatic Layer-by-Layer Nano-Assembly of Polymers, Enzymes, and Nanoparticles. Cell Biophys. 2003, 39, 23–44. [Google Scholar] [CrossRef]
- Zourob, M.; Elwary, S.; Turner, A.P.F. Principles of bacterial detection. In Biosensors, Recognition Receptors and Microsystems; Springer Science & Business Media: Cham, Switzerland, 2008. [Google Scholar]
- Shrivastava, A.; Gupta, V.B. Methods for the determination of limit of detection and limit of quantitation of the analytical methods. Chron. Young Sci. 2011, 2, 21–25. [Google Scholar] [CrossRef]
Publisher’s Note: MDPI stays neutral with regard to jurisdictional claims in published maps and institutional affiliations. |
© 2021 by the authors. Licensee MDPI, Basel, Switzerland. This article is an open access article distributed under the terms and conditions of the Creative Commons Attribution (CC BY) license (https://creativecommons.org/licenses/by/4.0/).