
Feasibility of a Portable Electronic Nose for Detection of Oral Squamous Cell Carcinoma in Sudan

 and
and
Abstract
:1. Introduction
2. Materials and Methods
2.1. Study Cohort
2.2. Study Design
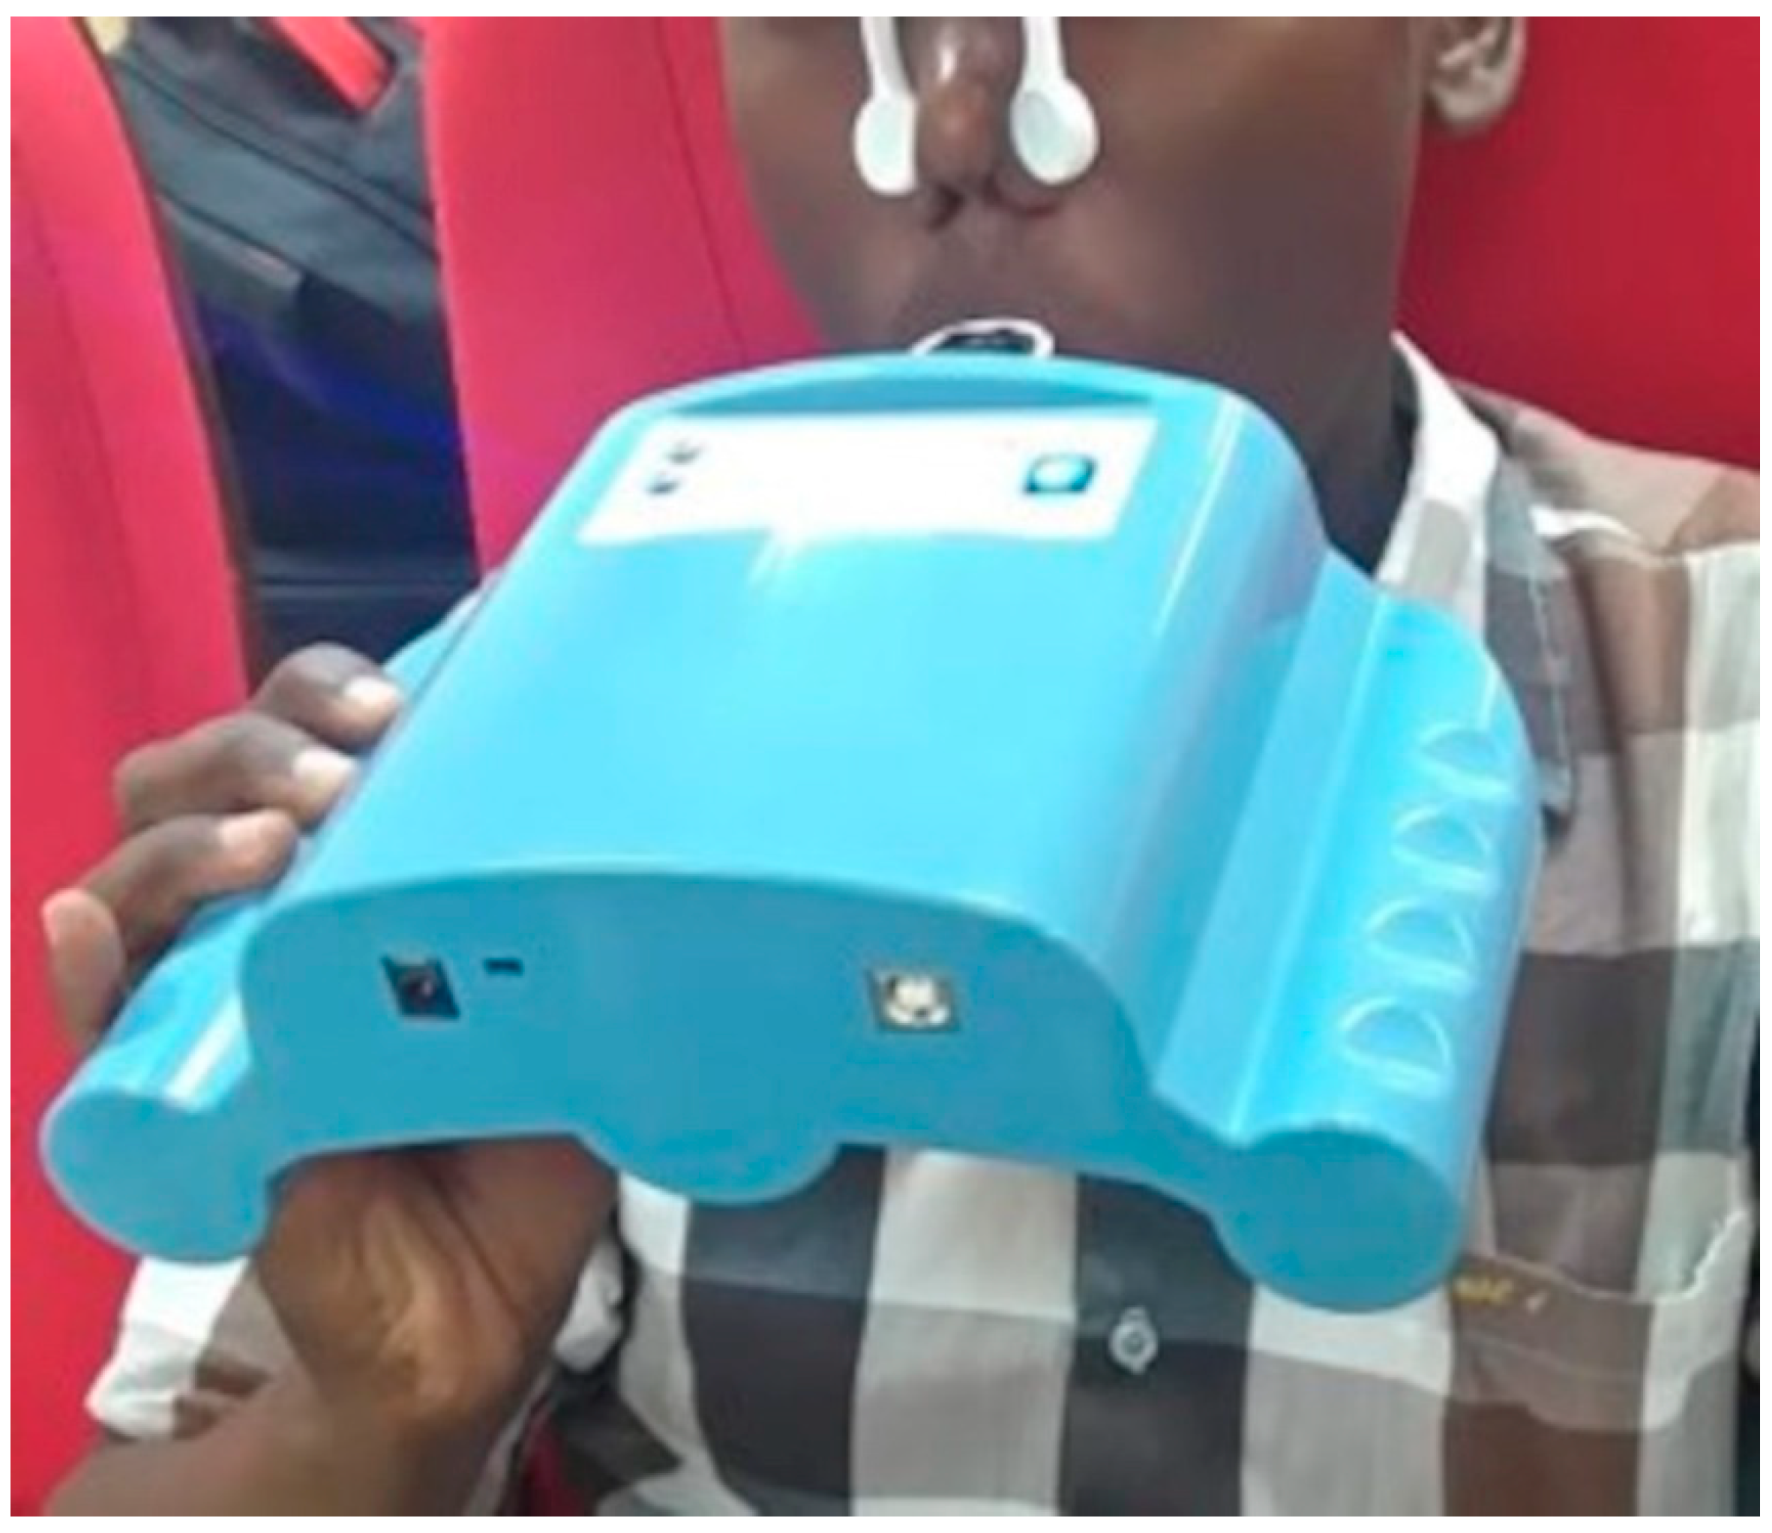
2.3. Materials
2.4. Statistical Analysis
3. Results
3.1. Cohort Characteristics
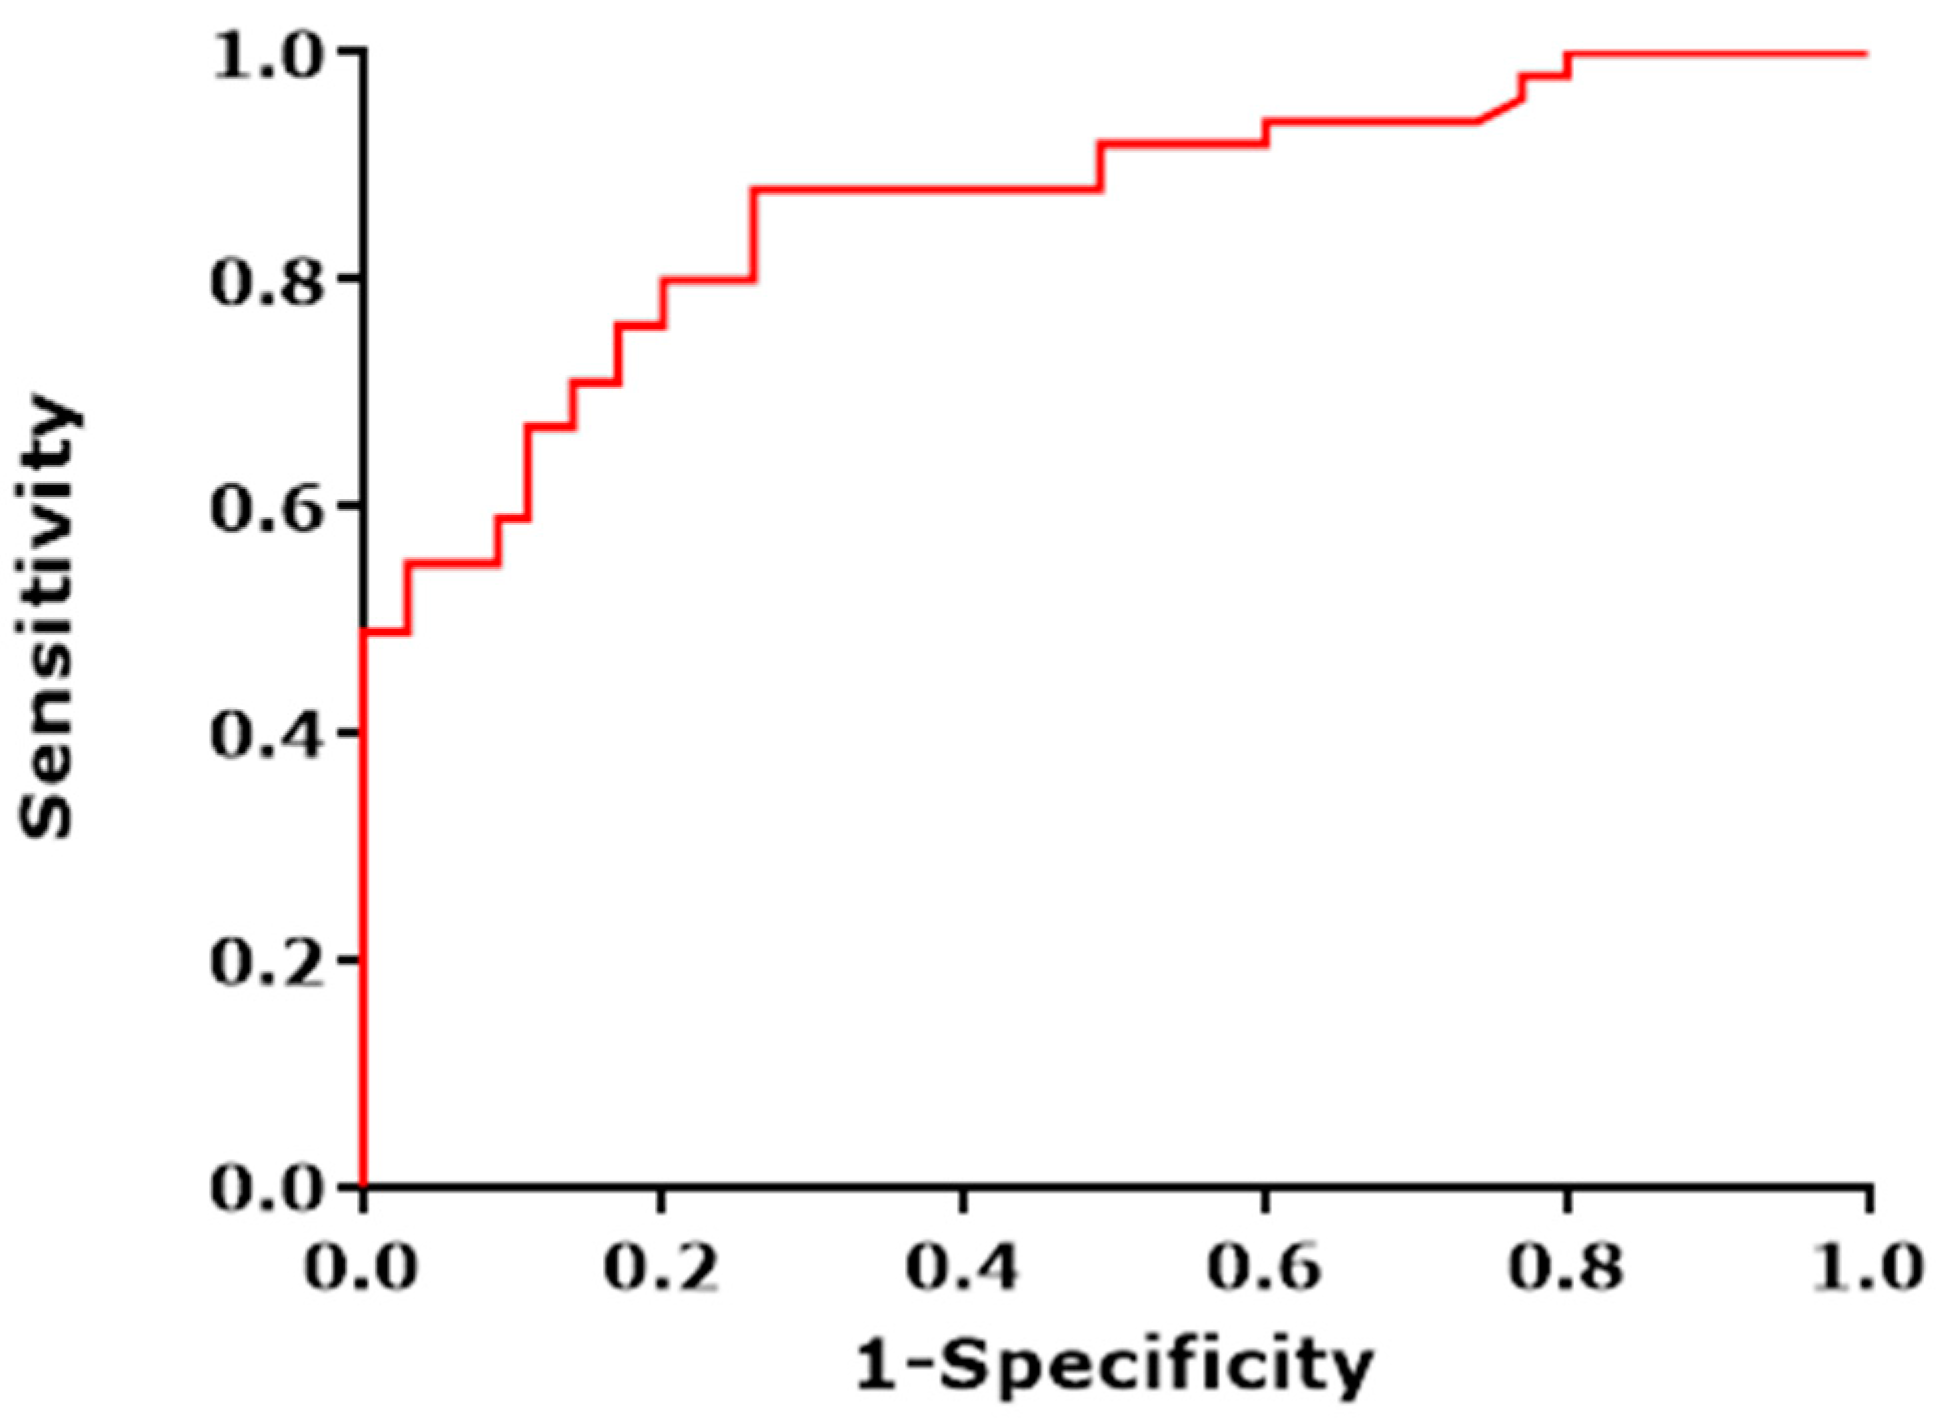
3.2. Feasibility Analysis of E-Nose Measurements
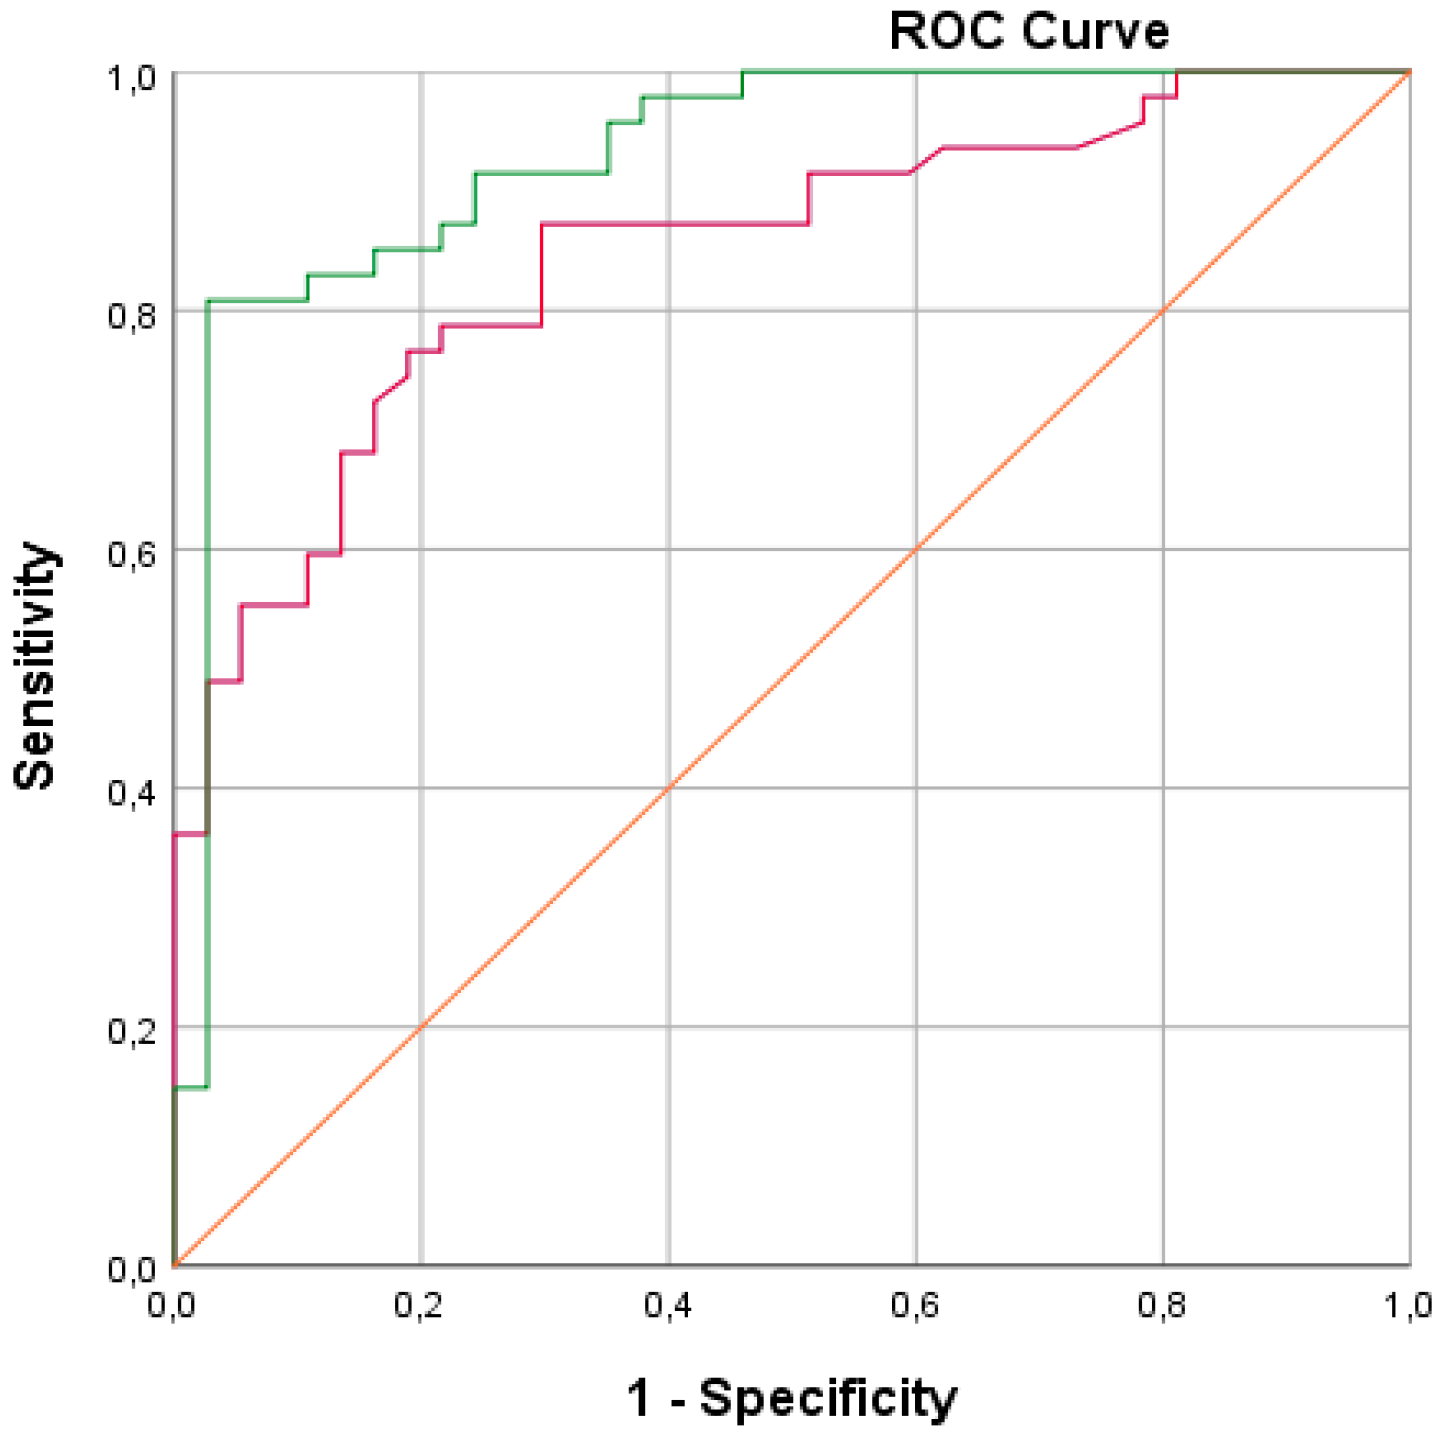
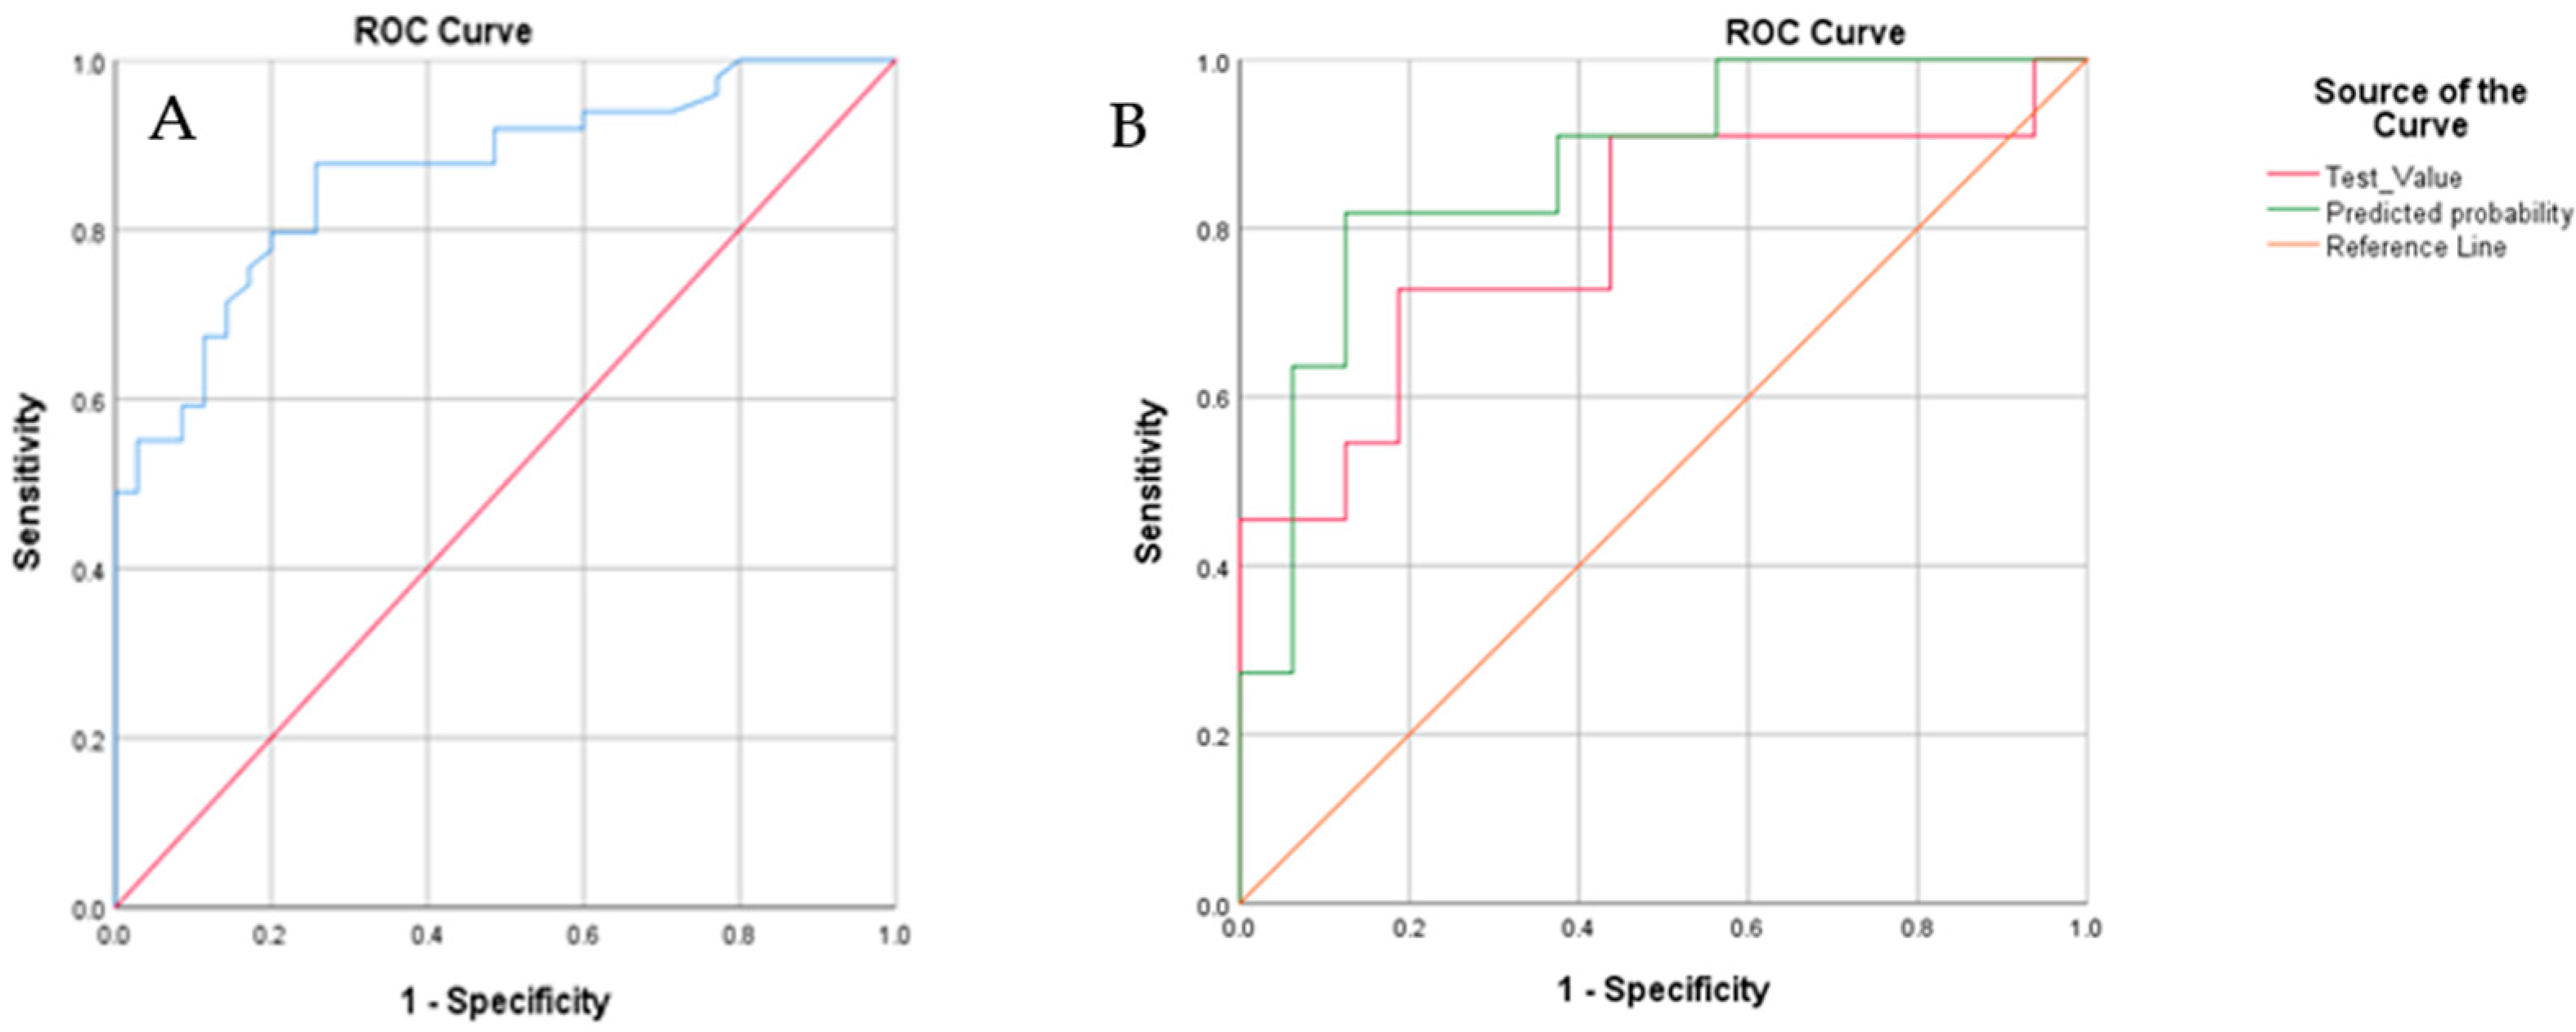
3.3. Blinded Control Group
4. Discussion
5. Conclusions
Supplementary Materials
Author Contributions
Funding
Institutional Review Board Statement
Informed Consent Statement
Data Availability Statement
Acknowledgments
Conflicts of Interest
References
- Amann, A.; Costello, B.D.L.; Miekisch, W.; Schubert, J.; Buszewski, B.; Pleil, J.; Ratcliffe, N.; Risby, T. The human volatilome: Volatile organic compounds (VOCs) in exhaled breath, skin emanations, urine, feces and saliva. J. Breath Res. 2014, 8, 034001. [Google Scholar] [CrossRef] [PubMed]
- Bruins, M.; van Belkum, A.; Bos, A. The Use of Electronic Nose Devices in Clinical Microbiology; Hays, J.P., van Leeuwen, W.B., Eds.; Bentham Science Publishers Ltd.: Bentham, UK, 2012; pp. 90–101. [Google Scholar]
- Pauling, L.; Robinson, A.B.; Teranishi, R.; Cary, P. Quantitative Analysis of Urine Vapor and Breath by Gas-Liquid Partition Chromatography. Proc. Natl. Acad. Sci. USA 1971, 68, 2374–2376. [Google Scholar] [CrossRef] [Green Version]
- Rattray, N.J.; Hamrang, Z.; Trivedi, D.K.; Goodacre, R.; Fowler, S.J. Taking your breath away: Metabolomics breathes life in to personalized medicine. Trends Biotechnol. 2014, 32, 538–548. [Google Scholar] [CrossRef] [PubMed]
- Beale, D.J.; Jones, O.A.H.; Karpe, A.V.; Dayalan, S.; Oh, D.Y.; Kouremenos, K.A.; Ahmed, W.; Palombo, E.A. A Review of Analytical Techniques and Their Application in Disease Diagnosis in Breathomics and Salivaomics Research. Int. J. Mol. Sci. 2016, 18, 24. [Google Scholar] [CrossRef] [PubMed] [Green Version]
- Buszewski, B.; Grzywiński, D.; Ligor, T.; Stacewicz, T.; Bielecki, Z.; Wojtas, J. Detection of volatile organic compounds as biomarkers in breath analysis by different analytical techniques. Bioanalysis 2013, 5, 2287–2306. [Google Scholar] [CrossRef] [PubMed]
- Turner, A.P.; Magan, N. Electronic noses and disease diagnostics. Nat. Rev. Genet. 2004, 2, 161–166. [Google Scholar] [CrossRef]
- Garbacz, M.; Malec, A.; Duda-Saternus, S.; Suchorab, Z.; Guz, Ł.; Łagód, G. Methods for Early Detection of Microbiological Infestation of Buildings Based on Gas Sensor Technologies. Chemosensors 2020, 8, 7. [Google Scholar] [CrossRef] [Green Version]
- Wilson, A.D.A.D. Recent progress in the design and clinical development of electronic-nose technologies. Nanobiosens. Dis. Diagn. 2016, 5, 15–27. [Google Scholar] [CrossRef] [Green Version]
- Wilson, A.D.; Baietto, M. Applications and Advances in Electronic-Nose Technologies. Sensors 2009, 9, 5099–5148. [Google Scholar] [CrossRef]
- Rusinek, R.; Jelen, H.; Malaga-Tobola, U.; Molenda, M.; Gancarz, M. Influence of Changes in the Level of Volatile Compounds Emitted during Rapeseed Quality Degradation on the Reaction of MOS Type Sensor-Array. Sensors 2020, 20, 3135. [Google Scholar] [CrossRef] [PubMed]
- Slimani, S.; Bultel, E.; Cubizolle, T.; Herrier, C.; Rousselle, T.; Livache, T. Opto-Electronic Nose Coupled to a Silicon Micro Pre-Concentrator Device for Selective Sensing of Flavored Waters. Chemosens. 2020, 8, 60. [Google Scholar] [CrossRef]
- Kim, J.-H.; Mirzaei, A.; Kim, H.W.; Kim, H.J.; Vuong, P.Q.; Kim, S.S. A Novel X-Ray Radiation Sensor Based on Networked SnO2 Nanowires. Appl. Sci. 2019, 9, 4878. [Google Scholar] [CrossRef] [Green Version]
- Szulczyński, B.; Gębicki, J. Currently Commercially Available Chemical Sensors Employed for Detection of Volatile Organic Compounds in Outdoor and Indoor Air. Environment 2017, 4, 21. [Google Scholar] [CrossRef] [Green Version]
- Gancarz, M.; Malaga-Toboła, U.; Oniszczuk, A.; Tabor, S.; Oniszczuk, T.; Gawrysiak-Witulska, M.; Rusinek, R. Detection and measurement of aroma compounds with the electronic nose and a novel method for MOS sensor signal analysis during the wheat bread making process. Food Bioprod. Process. 2021, 127, 90–98. [Google Scholar] [CrossRef]
- Natale, C.D.; Ostheymer, G. Data analysis for chemical sensor arrays. In Advances in Sensing with Security Applications; Springer: Dordrecht, The Netherlands, 2006. [Google Scholar]
- Distante, C.; Leo, M.; Siciliano, P.; Persaud, K.C. On the study of feature extraction methods for an electronic nose. Sensors Actuators B Chem. 2002, 87, 274–288. [Google Scholar] [CrossRef]
- Craven, M.; Gardner, J.; Bartlett, P. Electronic noses—Development and future prospects. TrAC Trends Anal. Chem. 1996, 15, 486–493. [Google Scholar] [CrossRef]
- Wilson, A.D. Applications of Electronic-Nose Technologies for Noninvasive Early Detection of Plant, Animal and Human Diseases. Chemosensors 2018, 6, 45. [Google Scholar] [CrossRef] [Green Version]
- Queralto, N.; Berliner, A.N.; Goldsmith, B.; Martino, R.; Rhodes, P.; Lim, S.H. Detecting cancer by breath volatile organic compound analysis: A review of array-based sensors. J. Breath Res. 2014, 8, 027112. [Google Scholar] [CrossRef] [PubMed]
- Haick, H.; Broza, Y.Y.; Mochalski, P.; Ruzsanyi, V.; Amann, A. Assessment, origin, and implementation of breath volatile cancer markers. Chem. Soc. Rev. 2014, 43, 1423–1449. [Google Scholar] [CrossRef] [PubMed] [Green Version]
- van de Goor, R.; van Hooren, M.R.; Henatsch, D.; Kremer, B.; Kross, K.W. Detecting head and neck squamous carcinoma using a portable handheld electronic nose. Head Neck 2020, 42, 2555–2559. [Google Scholar] [CrossRef] [PubMed]
- Siegel, R.; Ward, E.; Brawley, J.; Ahmedin, J. Cancer statistics, 2011: The impact of eliminating socioeconomic and racial disparities on premature cancer deaths. CA Cancer J. Clin. 2011, 61, 212–236. [Google Scholar] [CrossRef] [PubMed]
- Rai, V.; Mukherjee, R.; Ghost, A.K.; Routray, A.; Chakraborty, C. “Omics” in oral cancer: New approaches for biomarker discovery. Arch. Oral Biol. 2018, 87, 15–34. [Google Scholar] [CrossRef] [PubMed]
- Ferlay, J.E.M.; Lam, F.; Colombet, M.; Mery, L.; Piñeros, M.; Znaor, A.; Soerjomataram, I.; Bray, F. Global Cancer Observatory: Cancer Today. 2020. Available online: https://gco.iarc.fr/today/data/factsheets/populations/729-sudan-fact-sheets.pdf (accessed on 14 January 2021).
- Kujan, O.; Idrees, M.; Farah, C.S. Oral and Oropharyngeal Cancer in Arab Nations. In Handbook of Healthcare in the Arab World; Metzler, J.B., Ed.; Ismail Laher; Springer International Publishing: New York, NY, USA, 2019; pp. 1–24. [Google Scholar]
- Osman, T.; Satti, A.; Bøe, O.; Yang, Y.-H.; Ibrahim, S.; Suleiman, A.; Ta, O.; Aa, S.; Oe, B.; Yh, Y.; et al. Pattern of malignant tumors registered at a referral oral and maxillofacial hospital in Sudan during 2006 and 2007. J. Cancer Res. Ther. 2010, 6, 473–477. [Google Scholar] [CrossRef] [PubMed]
- Mendenhall, W.M.; Werning, J.W.; Pfister, D.G. Cancer of the Head and Neck. In Principles & Practice of Oncology (Cancer Principles and Practice of Oncology); DeVita, V.R., Rosenberg, S.A., Lawrence, T.S., Eds.; Wolters Kluwer: Philadelphia, PA, USA, 2014; pp. 422–450. [Google Scholar]
- Mehrotra, R.; Gupta, D.K. Exciting new advances in oral cancer diagnosis: Avenues to early detection. Head Neck Oncol. 2011, 3, 33. [Google Scholar] [CrossRef] [PubMed] [Green Version]
- Epstein, J.B.; Güneri, P.; Boyacioglu, H.; Abt, E. The limitations of the clinical oral examination in detecting dysplastic oral lesions and oral squamous cell carcinoma. J. Am. Dent. Assoc. 2012, 143, 1332–1342. [Google Scholar] [CrossRef] [PubMed]
- Kujan, O.; Khattab, A.; Oliver, R.J.; Roberts, S.A.; Thakker, N.; Sloan, P. Why oral histopathology suffers inter-observer variability on grading oral epithelial dysplasia: An attempt to understand the sources of variation. Oral Oncol. 2007, 43, 224–231. [Google Scholar] [CrossRef]
- Leunis, N.; Boumans, M.-L.; Kremer, B.; Din, S.; Stobberingh, E.; Kessels, A.G.H.; Kross, K.W. Application of an electronic nose in the diagnosis of head and neck cancer. Laryngoscope 2013, 124, 1377–1381. [Google Scholar] [CrossRef] [PubMed] [Green Version]
- Costea, D.E.; Lukandu, O.; Bui, L.; Ibrahim, J.; Lygre, R.; Neppelberg, E.; Ibrahim, S.O.; Vintemyr, O.K.; Johannessen, A.C. Adverse effects of Sudanese toombak vs. Swedish snuff on human oral cells. J. Oral Pathol. Med. 2010, 39, 128–140. [Google Scholar] [CrossRef]
- Reitsma, M.B.; Fullman, N.; Ng, M.; Salama, J.S.; Abajobir, A.; Abate, K.H.; Abbafati, C.; Abera, S.F.; Abraham, B.; Abyu, G.Y.; et al. Smoking prevalence and attributable disease burden in 195 countries and territories, 1990–2015: A systematic analysis from the Global Burden of Disease Study 2015. Lancet 2017, 389, 1885–1906. [Google Scholar] [CrossRef] [Green Version]
- Idris, A.M.; Ahmed, H.M.; Mukhtar, I.B.; Gadir, A.F.; El-Beshir, I.E. Descriptive epidemiology of oral neoplasms in Sudan 1970–1985 and the role of toombak. Int. J. Cancer 1995, 61, 155–158. [Google Scholar] [CrossRef]
- van Hooren, M.R.; Leonis, N.; Brandsma, D.S.; Dingemans, A.-M.; Kremmer, B.; Kross, K.W. Differentiating head and neck carcinoma from lung carcinoma with an electronic nose: A proof of concept study. Eur. Arch. Otorhinolaryngol. 2016, 273, 3897–3903. [Google Scholar] [CrossRef]
- van de Goor, R.; van Hooren, M.; Dingemans, A.-M.; Kremmer, B.; Kross, K. Training and Validating a Portable Electronic Nose for Lung Cancer Screening. J. Thorac. Oncol. 2018, 13, 676–681. [Google Scholar] [CrossRef] [Green Version]
- Bouza, M.; Gonzalez-Soto, J.; Pereiro, R.; De Vicente, J.C.; Sanz-Medel, A. Exhaled breath and oral cavity VOCs as potential biomarkers in oral cancer patients. J. Breath Res. 2017, 11, 016015. [Google Scholar] [CrossRef] [PubMed]
- Hakim, M.; Billan, S.; Tisch, U.; Peng, G.; Dvrokind, I.; Marom, O.; Abdah-Bortnyak, R.; Kuten, A.; Haick, H. Diagnosis of head-and-neck cancer from exhaled breath. Br. J. Cancer 2011, 104, 1649–1655. [Google Scholar] [CrossRef] [PubMed] [Green Version]
- Shigeyama, H.; Wang, T.; Ichinose, M.; Ansai, T.; Lee, S.-W. Identification of volatile metabolites in human saliva from patients with oral squamous cell carcinoma via zeolite-based thin-film microextraction coupled with GC–MS. J. Chromatogr. B 2019, 1104, 49–58. [Google Scholar] [CrossRef] [PubMed]
- Hartwig, S.; Raguse, J.D.; Pfitzner, D.; Preissner, R.; Paris, S.; Preissner, S. Volatile Organic Compounds in the Breath of Oral Squamous Cell Carcinoma Patients: A Pilot Study. Otolaryngol. Neck Surg. 2017, 157, 981–987. [Google Scholar] [CrossRef]
- Shield, K.D.; Ferlay, J.; Jemal, A.; Sankaranarayanan, R.; Chaturvedi, A.K.; Bray, F.; Soerjomataram, I. The global incidence of lip, oral cavity, and pharyngeal cancers by subsite in 2012. CA Cancer J. Clin. 2016, 67, 51–64. [Google Scholar] [CrossRef] [PubMed]


| Cohort Demographics | ||||||
|---|---|---|---|---|---|---|
| Non-OSCC Patients | OSCC Patients | |||||
| Number of individuals | 35 | 49 | ||||
| 82.9% males (29) | 49% males (24) | |||||
| 17.1% females (6) | 51% females (25) | |||||
| Age * | Males | 48.4 years (24–68 years) | 55.6 years (21–82 years) | |||
| Females | 33.5 years (27–64 years) | 52.2 years (27–80 years) | ||||
| Tobacco history and mean pack-years (PY) * | 65 | 35 | ||||
| Clinical findings for OSCC patients | ||||||
| Tumor location | Number of cases | Tumor stage | ||||
| Stage | Number (%) | |||||
| Buccal lower | 26.5% (13) | I | 2% (1) | |||
| Labial lower | 24.5% (12) | II | 2% (1) | |||
| Tongue | 14.3% (7) | III | 22.5% (11) | |||
| Palate | 8.2% (4) | IV | 63.3% (31) | |||
| Other sites | 12.2% (6) | Missing staging: 10.2% (5) | ||||
| Missing sites data | 14.3% (7) | |||||
Publisher’s Note: MDPI stays neutral with regard to jurisdictional claims in published maps and institutional affiliations. |
© 2021 by the authors. Licensee MDPI, Basel, Switzerland. This article is an open access article distributed under the terms and conditions of the Creative Commons Attribution (CC BY) license (https://creativecommons.org/licenses/by/4.0/).
Share and Cite
Mohamed, N.; van de Goor, R.; El-Sheikh, M.; Elrayah, O.; Osman, T.; Nginamau, E.S.; Johannessen, A.C.; Suleiman, A.; Costea, D.E.; Kross, K.W. Feasibility of a Portable Electronic Nose for Detection of Oral Squamous Cell Carcinoma in Sudan. Healthcare 2021, 9, 534. https://doi.org/10.3390/healthcare9050534
Mohamed N, van de Goor R, El-Sheikh M, Elrayah O, Osman T, Nginamau ES, Johannessen AC, Suleiman A, Costea DE, Kross KW. Feasibility of a Portable Electronic Nose for Detection of Oral Squamous Cell Carcinoma in Sudan. Healthcare. 2021; 9(5):534. https://doi.org/10.3390/healthcare9050534
Chicago/Turabian StyleMohamed, Nazar, Rens van de Goor, Mariam El-Sheikh, Osman Elrayah, Tarig Osman, Elisabeth Sivy Nginamau, Anne Christine Johannessen, Ahmed Suleiman, Daniela Elena Costea, and Kenneth W. Kross. 2021. "Feasibility of a Portable Electronic Nose for Detection of Oral Squamous Cell Carcinoma in Sudan" Healthcare 9, no. 5: 534. https://doi.org/10.3390/healthcare9050534
APA StyleMohamed, N., van de Goor, R., El-Sheikh, M., Elrayah, O., Osman, T., Nginamau, E. S., Johannessen, A. C., Suleiman, A., Costea, D. E., & Kross, K. W. (2021). Feasibility of a Portable Electronic Nose for Detection of Oral Squamous Cell Carcinoma in Sudan. Healthcare, 9(5), 534. https://doi.org/10.3390/healthcare9050534