
Temporal Changes in Electromyographic Activity and Gait Ability during Extended Walking in Individuals Post-Stroke: A Pilot Study


Abstract
1. Introduction
2. Materials and Methods
2.1. Subjects
2.2. Assessments
2.3. Data Analysis
2.4. Statistical Analysis
3. Results
3.1. Gait Performance
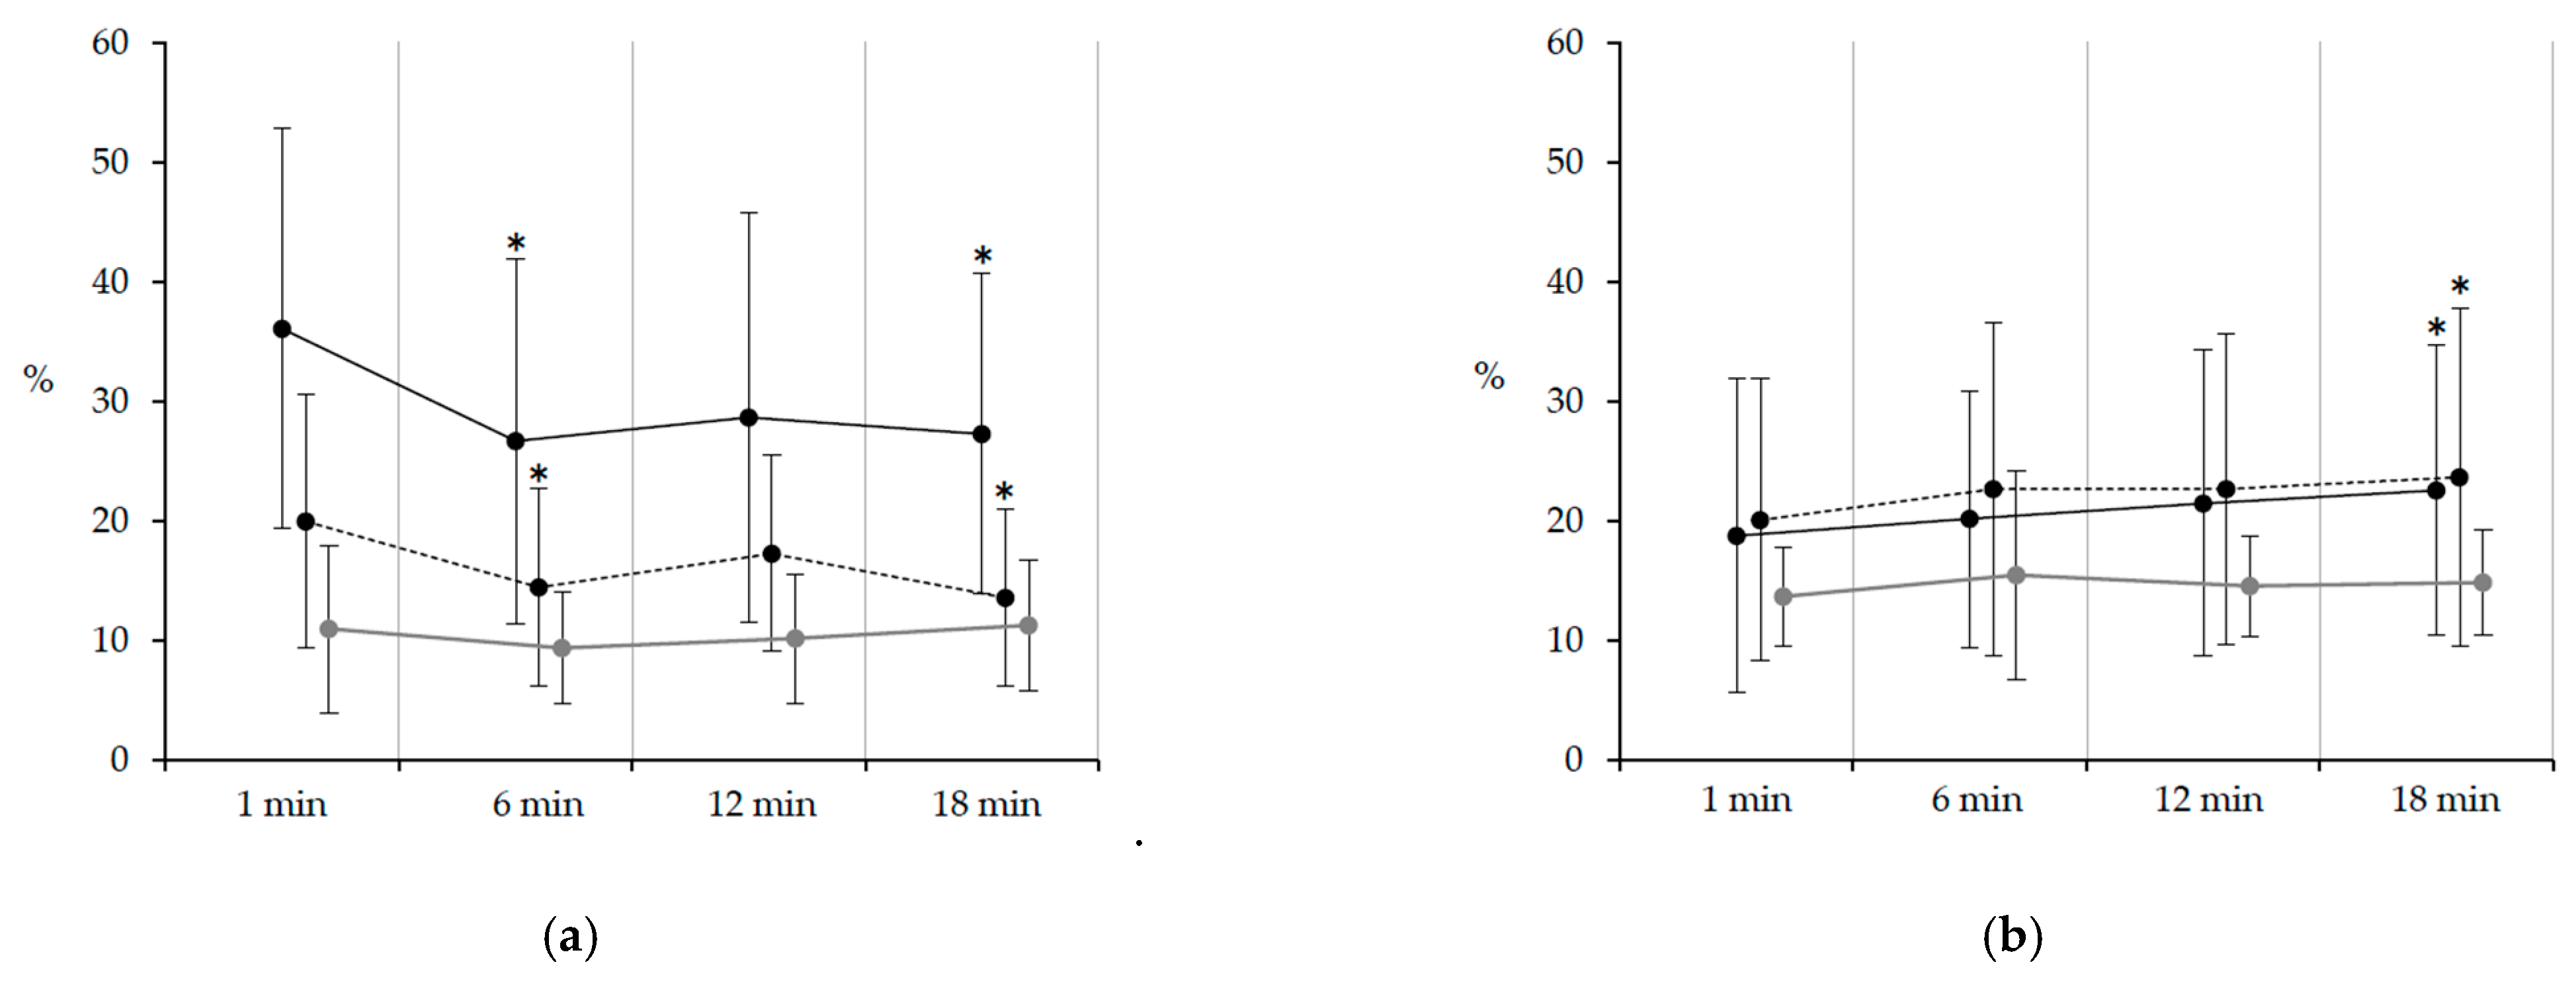
3.2. EMG Amplitude
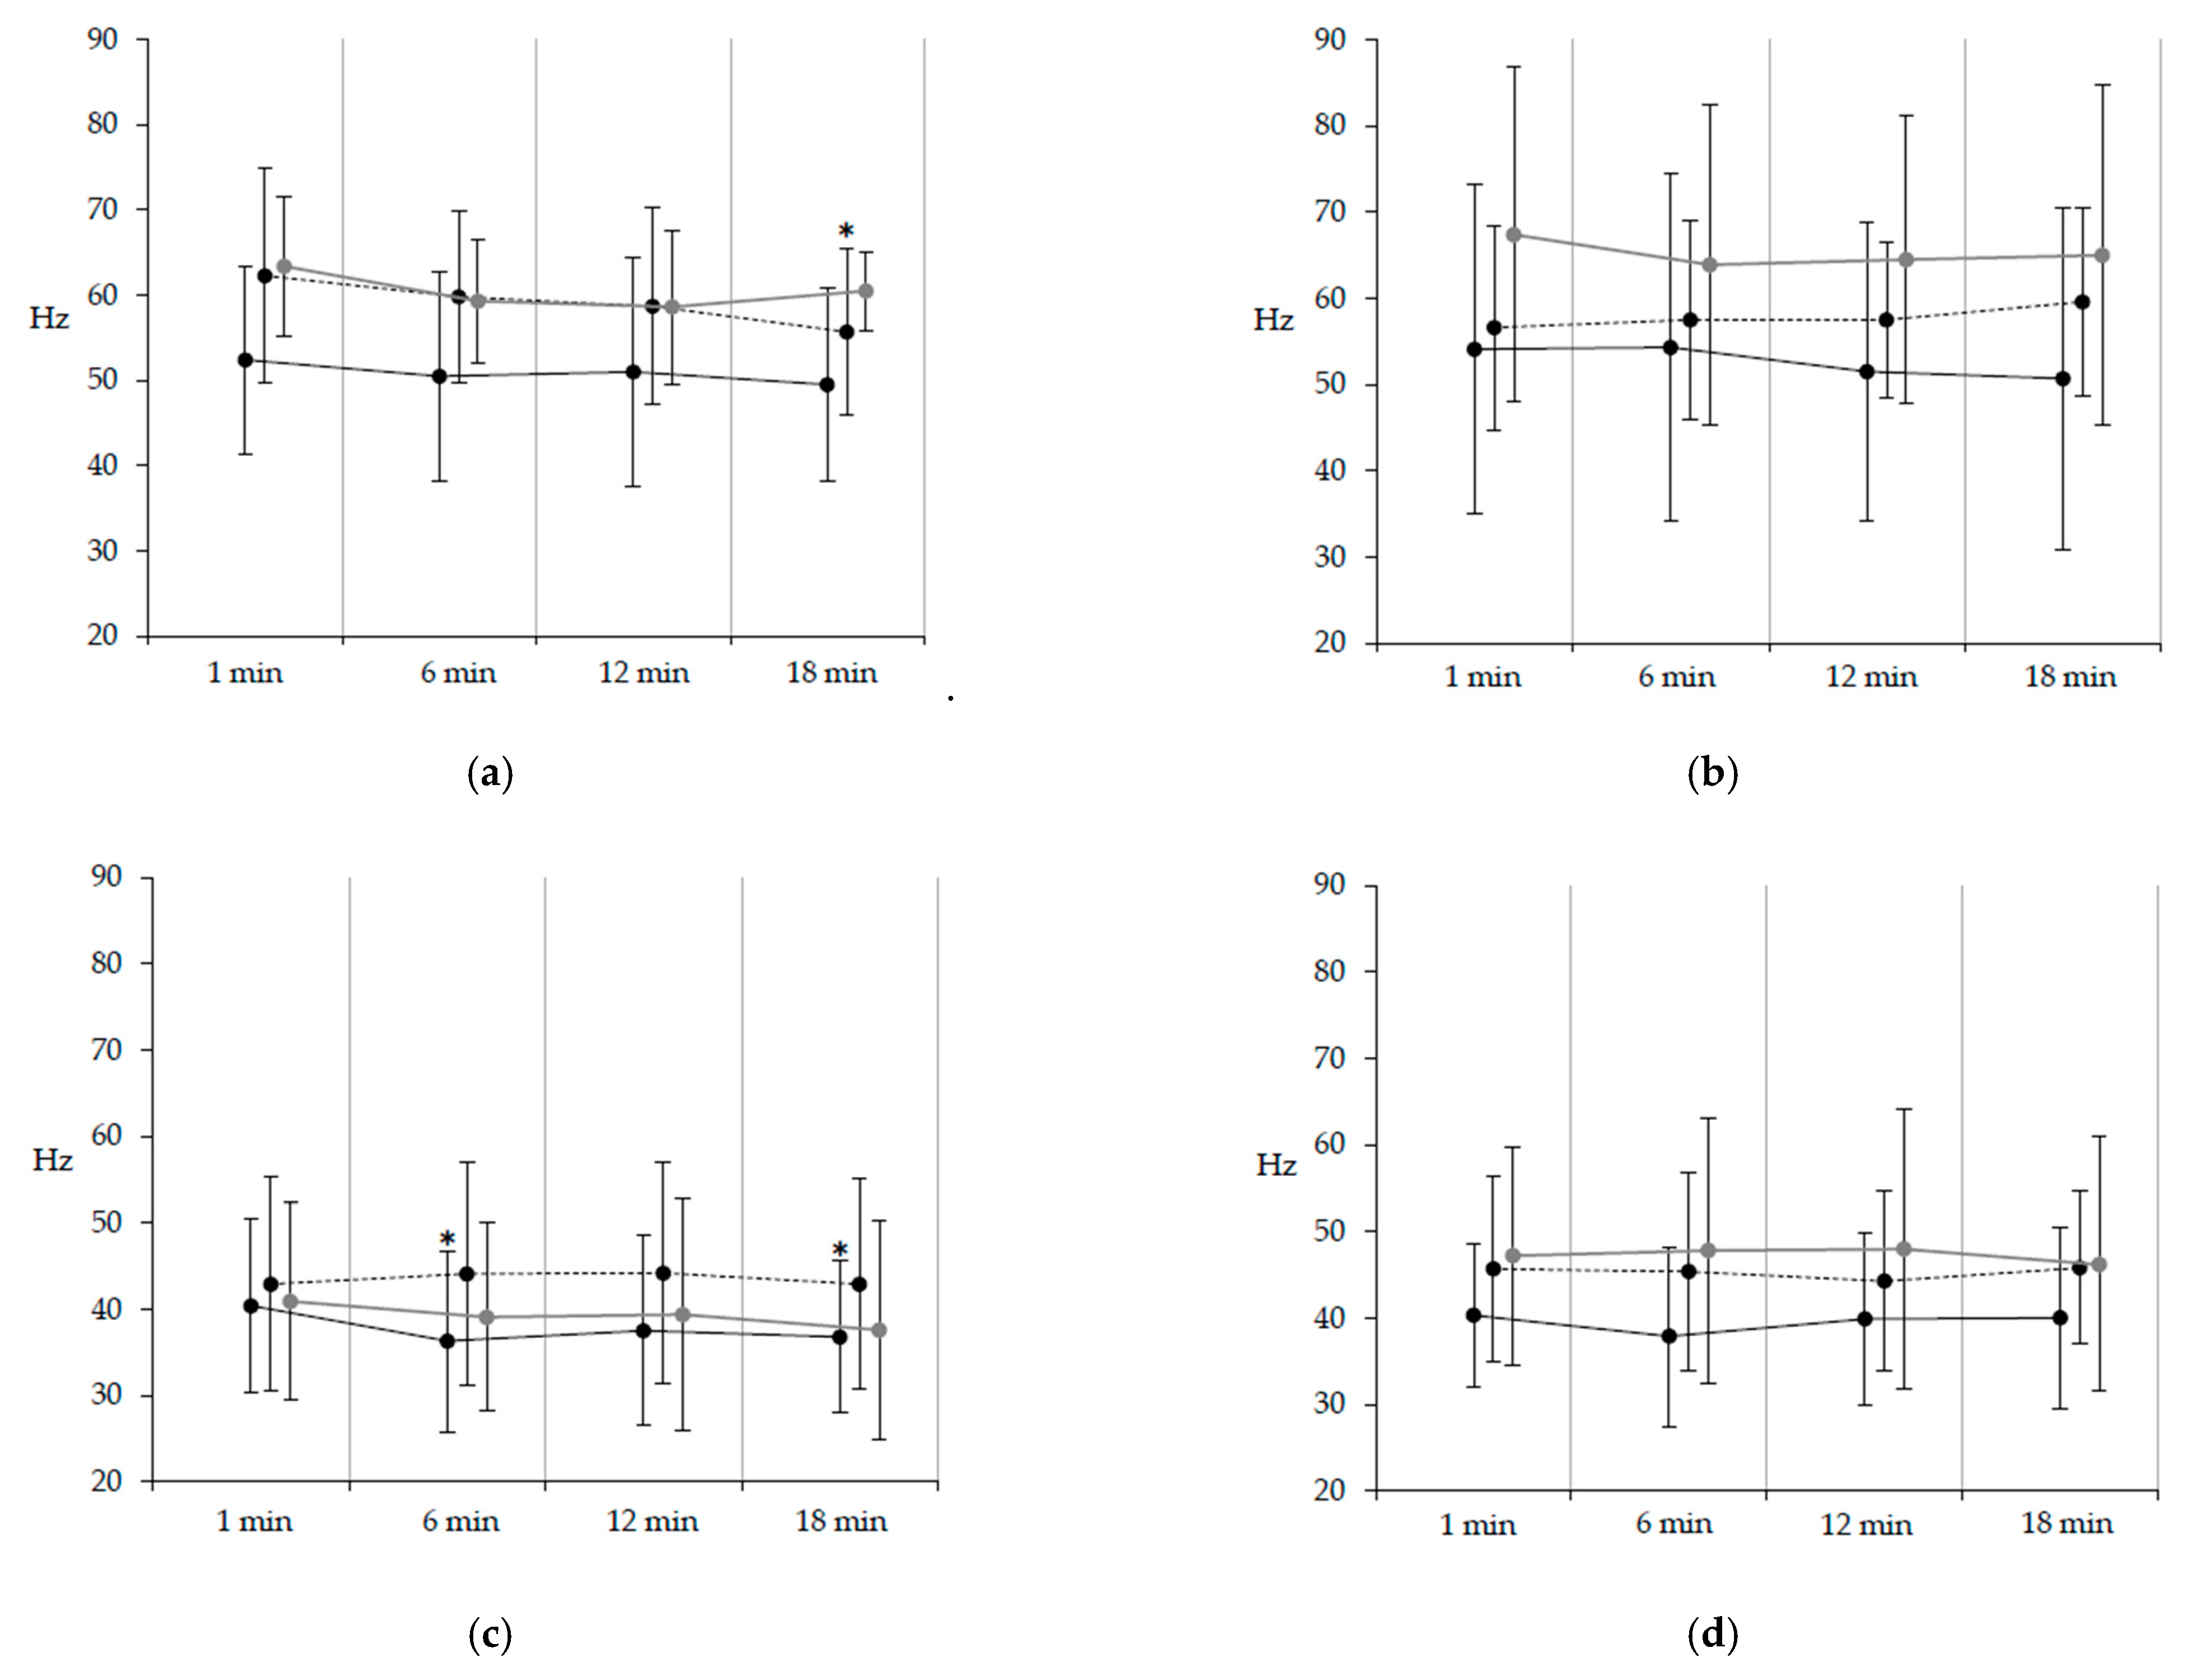
3.3. EMG Frequency
4. Discussion
5. Conclusions
Author Contributions
Funding
Institutional Review Board Statement
Informed Consent Statement
Data Availability Statement
Conflicts of Interest
References
- GBD 2016 Stroke Collaborators. Global, regional, and national burden of stroke, 1990–2016: A systematic analysis for the Global Burden of Disease Study 2016. Lancet Neurol. 2019, 18, 439–458. [Google Scholar] [CrossRef]
- Tørnes, M.; McLernon, D.; Bachmann, M.O.; Musgrave, S.D.; Day, D.J.; Warburton, E.A.; Potter, J.F.; Myint, P.K. Variations in rates of discharges to nursing homes after acute hospitalization for stroke and the influence of service heterogeneity: An Anglia Stroke Clinical Network Evaluation Study. Healthcare 2020, 8, 390. [Google Scholar] [CrossRef] [PubMed]
- Takashima, N.; Arima, H.; Kita, Y.; Fujii, T.; Tanaka-Mizuno, S.; Shitara, S.; Kitamura, A.; Sugimoto, Y.; Urushitani, M.; Miura, K.; et al. Long-term survival after stroke in 1.4 million Japanese population: Shiga stroke and Heart Attack Registry. J. Stroke 2020, 22, 336–344. [Google Scholar] [CrossRef] [PubMed]
- Sibley, K.M.; Tang, A.; Patterson, K.K.; Brooks, D.; McIlroy, W.E. Changes in spatiotemporal gait variables over time during a test of functional capacity after stroke. J. Neuroeng. Rehabil. 2009, 6, 27. [Google Scholar] [CrossRef] [PubMed]
- Carver, T.; Nadeau, S.; Leroux, A. Relation between physical exertion and postural stability in hemiparetic participants secondary to stroke. Gait Posture 2011, 33, 615–619. [Google Scholar] [CrossRef] [PubMed]
- Colle, F.; Bonan, I.; Gellez Leman, M.C.; Bradai, N.; Yelnik, A. Fatigue after stroke. Ann. Readapt Med. Phys. 2006, 49, 361–364. [Google Scholar] [CrossRef]
- Rudberg, A.S.; Berge, E.; Laska, A.C.; Jutterström, S.; Näsman, P.; Sunnerhagen, K.S.; Lundström, E. Stroke survivors’ priorities for research related to life after stroke. Top. Stroke Rehabil. 2020, 28, 153–158. [Google Scholar] [CrossRef] [PubMed]
- Rudroff, T.; Kindred, J.H.; Ketelhut, N.B. Fatigue in multiple sclerosis: Misconceptions and future research directions. Front. Neurol. 2016, 7, 122. [Google Scholar] [CrossRef]
- Knorr, S.; Rice, C.L.; Garland, S.J. Perspective on neuromuscular factors in poststroke fatigue. Disabil. Rehabil. 2012, 34, 2291–2299. [Google Scholar] [CrossRef]
- Sisson, R.A. Life after a stroke: Coping with change. Rehabil. Nurs. 1998, 23, 198–203. [Google Scholar] [CrossRef]
- Knorr, S.; Ivanova, T.D.; Doherty, T.J.; Campbell, J.A.; Garland, S.J. The origins of neuromuscular fatigue post-stroke. Exp. Brain Res. 2011, 214, 303–315. [Google Scholar] [CrossRef] [PubMed]
- Gandevia, S.C. Spinal and supraspinal factors in human muscle fatigue. Physiol. Rev. 2001, 81, 1725–1789. [Google Scholar] [CrossRef] [PubMed]
- Kirkendall, D.T. Mechanisms of peripheral fatigue. Med. Sci. Sports Exerc. 1990, 22, 444–449. [Google Scholar] [CrossRef] [PubMed]
- Fuglsang-Frederiksen, A.; Rønager, J. The motor unit firing rate and the power spectrum of EMG in humans. Electroencephalogr. Clin. Neurophysiol. 1988, 70, 68–72. [Google Scholar] [CrossRef]
- Hu, X.L.; Tong, K.Y.; Hung, L.K. Firing properties of motor units during fatigue in subjects after stroke. J. Electromyogr. Kinesiol. 2006, 16, 469–476. [Google Scholar] [CrossRef] [PubMed]
- Riley, N.A.; Bilodeau, M. Changes in upper limb joint torque patterns and EMG signals with fatigue following a stroke. Disabil. Rehabil. 2002, 24, 961–969. [Google Scholar] [CrossRef]
- Svantesson, U.M.; Sunnerhagen, K.S.; Carlsson, U.S.; Grimby, G. Development of fatigue during repeated eccentric-concentric muscle contractions of plantar flexors in patients with stroke. Arch. Phys. Med. Rehabil. 1999, 80, 1247–1252. [Google Scholar] [CrossRef]
- Fujita, K.; Miaki, H.; Hori, H.; Kobayashi, Y.; Nakagawa, T. How effective is physical therapy for gait muscle activity in hemiparetic patients who receive botulinum toxin injections? Eur. J. Phys. Rehabil. Med. 2019, 55, 8–18. [Google Scholar] [CrossRef]
- Fujita, K.; Kobayashi, Y.; Miaki, H.; Hori, H.; Tsushima, Y.; Sakai, R.; Nomura, T.; Ogawa, T.; Kinoshita, H.; Nishida, T.; et al. Pedaling improves gait ability of hemiparetic patients with stiff-knee gait: Fall prevention during gait. J. Stroke Cerebrovasc. Dis. 2020, 29, 105035. [Google Scholar] [CrossRef]
- Polese, J.C.; Ada, L.; Dean, C.M.; Nascimento, L.R.; Teixeira-Salmela, L.F. Treadmill training is effective for ambulatory adults with stroke: A systematic review. J. Physiother. 2013, 59, 73–80. [Google Scholar] [CrossRef]
- Scherbakov, N.; Von Haehling, S.; Anker, S.D.; Dirnagl, U.; Doehner, W. Stroke induced sarcopenia: Muscle wasting and disability after stroke. Int. J. Cardiol. 2013, 170, 89–94. [Google Scholar] [CrossRef]
- Johnson, M.A.; Polgar, J.; Weightman, D.; Appleton, D. Data on the distribution of fibre types in thirty-six human muscles. An autopsy study. J. Neurol. Sci. 1973, 18, 111–129. [Google Scholar] [CrossRef]
- Fujita, K.; Miaki, H.; Fujimoto, A.; Hori, H.; Fujimoto, H.; Kobayashi, Y. Factors affecting premature plantarflexor muscle activity during hemiparetic gait. J. Electromyogr. Kinesiol. 2018, 39, 99–103. [Google Scholar] [CrossRef]
- Pacific Supply Co., Ltd. Available online: https://www.p-supply.co.jp/products/index.php?act=detail&pid=9 (accessed on 6 January 2021).
- Al-Jarrah, M.; Shaheen, S.; Harries, N.; Kissani, N.; Molteni, F.; Bar Haim, S.; MESF Project. Individualized treadmill and strength training for chronic stroke rehabilitation: Effects of imbalance. Top. Stroke Rehabil. 2014, 21 (Suppl. 1), S25–S32. [Google Scholar] [CrossRef]
- Tang, A.; Sibley, K.M.; Thomas, S.G.; Bayley, M.T.; Richardson, D.; McIlroy, W.E.; Brooks, D. Effects of an aerobic exercise program on aerobic capacity, spatiotemporal gait parameters, and functional capacity in subacute stroke. Neurorehab. Neural Repair 2009, 23, 398–406. [Google Scholar] [CrossRef]
- Polk, J.D.; Stumpf, R.M.; Rosengren, K.S. Limb dominance, foot orientation and functional asymmetry during walking gait. Gait Posture 2017, 52, 140–146. [Google Scholar] [CrossRef]
- Boudarham, J.; Hameau, S.; Pradon, D.; Bensmail, D.; Roche, N.; Zory, R. Changes in electromyographic activity after botulinum toxin injection of the rectus femoris in patients with hemiparesis walking with a stiff-knee gait. J. Electromyogr. Kinesiol. 2013, 23, 1036–1043. [Google Scholar] [CrossRef]
- Bowden, M.G.; Balasubramanian, C.K.; Neptune, R.R.; Kautz, S.A. Anterior-posterior ground reaction forces as a measure of paretic leg contribution in hemiparetic walking. Stroke 2006, 37, 872–876. [Google Scholar] [CrossRef]
- Pilkar, R.; Ramanujam, A.; Nolan, K.J. Alterations in spectral attributes of surface electromyograms after utilization of a foot drop stimulator during post-stroke gait. Front. Neurol. 2017, 8, 449. [Google Scholar] [CrossRef]
- Cohen, J. A power primer. Psychol. Bull. 1992, 112, 155–159. [Google Scholar] [CrossRef]
- Faul, F.; Erdfelder, E.; Lang, A.G.; Buchner, A. G* Power 3: A flexible statistical power analysis program for the social, behavioral, and biomedical sciences. Behav. Res. Methods 2007, 39, 175–191. [Google Scholar] [CrossRef] [PubMed]
- Eng, J.J.; Chu, K.S.; Dawson, A.S.; Kim, C.M.; Hepburn, K.E. Functional walk tests in individuals with stroke: Relation to perceived exertion and myocardial exertion. Stroke 2002, 33, 756–761. [Google Scholar] [CrossRef] [PubMed]
- Ng, S.S.; Hui-Chan, C.W. Contribution of ankle dorsiflexor strength to walking endurance in people with spastic hemiplegia after stroke. Arch. Phys. Med. Rehabil. 2012, 93, 1046–1051. [Google Scholar] [CrossRef]
- Tang, A.; Rymer, W.Z. Abnormal force--EMG relations in paretic limbs of hemiparetic human subjects. J. Neurol. Neurosurg. Psychiatry 1981, 44, 690–698. [Google Scholar] [CrossRef] [PubMed]
- Enoka, R.M.; Stuart, D.G. Neurobiology of muscle fatigue. J. Appl. Physiol. 1992, 72, 1631–1648. [Google Scholar] [CrossRef] [PubMed]
- Edwards, R.G.; Lippold, O.C.J. The relation between force and integrated electrical activity in fatigued muscle. J. Physiol. 1956, 132, 677–681. [Google Scholar] [CrossRef] [PubMed]
- Yao, W.; Fuglevand, R.J.; Enoka, R.M. Motor-unit synchronization increases EMG amplitude and decreases force steadiness of simulated contractions. J. Neurophysiol. 2000, 83, 441–452. [Google Scholar] [CrossRef]
- Van Cutsem, M.; Duchateau, J.; Hainaut, K. Changes in single motor unit behaviour contribute to the increase in contraction speed after dynamic training in humans. J. Physiol. 1998, 513, 295–305. [Google Scholar] [CrossRef]
- Boudarham, J.; Roche, N.; Pradon, D.; Bonnyaud, C.; Bensmail, D.; Zory, R. Variations in kinematics during clinical gait analysis in stroke patients. PLoS ONE 2013, 8, e66421. [Google Scholar] [CrossRef]
- Granacher, U.; Wolf, I.; Wehrle, A.; Bridenbaugh, S.; Kressig, R.W. Effects of muscle fatigue on gait characteristics under single and dual-task conditions in young and older adults. J. Neuroeng. Rehabil. 2010, 7, 56. [Google Scholar] [CrossRef]
- Koikkalainen, J.; Hirvonen, J.; Nyman, M.; Lötjönen, J.; Hietala, J.; Ruotsalainen, U. Shape variability of the human striatum—effects of age and gender. Neuroimage 2007, 34, 85–93. [Google Scholar] [CrossRef] [PubMed]


| With Stroke (n = 12) | Healthy (n = 11) | p | ||
|---|---|---|---|---|
| Age | (years) | 54.7 ± 9.5 | 55.5 ± 7.9 | NS |
| Height | (cm) | 168.9 ± 7.9 | 168.5 ± 8.5 | NS |
| Weight | (kg) | 66.8 ± 12.6 | 65.0 ± 10.6 | NS |
| Sex | (female/male) | 3/9 | 3/8 | NS |
| Type of stroke | Putaminal hemorrhage Subcortical infarction Basal ganglia infarction | n = 10 n = 1 n = 1 | N/A | |
| Months since stroke onset | 60.4 ± 25.4 | N/A | ||
| Paretic side | (L/R) | 5/7 | N/A | |
| Assistive device | (None/AFO) | 8/4 | N/A | |
| Fugl–Meyer assessment LE | 21.3 ± 3.8 | N/A | ||
| Motricity index | ||||
| Hip flexors | 25 (8) | 33 (0) | <0.05 | |
| Knee extensors | 25 (8) | 33 (0) | <0.05 | |
| Ankle dorsiflexors | 19 (5) | 33 (0) | <0.05 | |
| Modified Ashworth scale | ||||
| Hip flexors | 1 (1) | N/A | ||
| Knee extensors | 1.5 (1) | N/A | ||
| Ankle plantar flexors | 2 (2) | N/A |
| With Stroke (n = 12) | Healthy (n = 11) | ||||||||
|---|---|---|---|---|---|---|---|---|---|
| 1 min | 6 min | 12 min | 18 min | 1 min | 6 min | 12 min | 18 min | ||
| Gait velocity | (m/sec) | 0.65 a | 0.68 | 0.69 | 0.73 † | 1.25 a | 1.25 | 1.28 | 1.29 |
| (0.22) | (0.23) | (0.24) | (0.25) | (0.15) | (0.17) | (0.16) | (0.15) | ||
| Stride length | (cm) | 83.7 a | 87.8 | 89.1 | 92.0 † | 132.2 a | 134.5 | 135.5 | 135.6 |
| (16.3) | (18.0) | (19.3) | (19.7) | (13.9) | (15.3) | (15.6) | (15.7) | ||
| Cadence | (steps/min) | 90.8 b | 90.5 | 91.4 | 93.2 | 113.2 b | 111.6 | 113.3 | 113.9 |
| (15.4) | (15.5) | (15.8) | (16.5) | (3.8) | (3.6) | (3.1) | (3.9) | ||
| LR period | (% GC) | 14.4 | 14.6 | 14.6 | 14.2 | 13.7 | 14.5 | 13.7 | 13.4 |
| (3.5) | (4.0) | (4.3) | (5.1) | (1.6) | (1.8) | (2.0) | (1.8) | ||
| SS period | (% GC) | 28.0 b | 28.3 | 28.0 | 28.5 | 36.6 b | 36.0 | 36.2 | 36.8 |
| (4.9) | (4.6) | (5.0) | (4.4) | (2.1) | (1.8) | (2.2) | (2.3) | ||
| PSw period | (% GC) | 17.1 b | 17.5 | 17.6 | 17.4 | 13.5 b | 13.8 | 13.7 | 13.1 |
| (5.1) | (4.8) | (4.7) | (4.2) | (2.1) | (1.9) | (2.0) | (2.5) | ||
| Sw period | (% GC) | 40.4 b | 39.6 | 39.8 | 39.8 | 36.2 b | 35.8 | 36.3 | 36.6 |
| (4.3) | (4.3) | (4.2) | (4.0) | (1.5) | (1.7) | (1.8) | (1.9) | ||
| AI for Sw period | (%) | 59.2 b | 58.4 | 58.9 | 58.4 | 49.7 b | 49.8 | 50.1 | 49.9 |
| (5.0) | (4.8) | (4.9) | (4.1) | (0.7) | (0.6) | (0.8) | (0.7) | ||
| AI for step length | (%) | 51.2 | 52.8 | 52.7 | 52.6 | 50.3 | 50.4 | 50.0 | 50.0 |
| (5.3) | (4.2) | (3.8) | (4.0) | (0.3) | (0.4) | (0.5) | (0.6) | ||
| Heart Rate | (beats/min) | 83.1 | 103.4 † | 110.1 † | 107.8 † | 84.0 | 93.9 † | 97.6 † ‡ | 100.2 † ‡ |
| (7.8) | (11.6) | (10.1) | (16.3) | (6.7) | (5.1) | (6.2) | (8.7) | ||
| RPE | 0 | 1 | 2 † | 3 † | 0 | 0.5 | 1 † | 2 † ‡ | |
| (0) | (0.5) | (1.5) | (2.5) | (0) | (0.75) | (1) | (1) | ||
| Paretic Side (n = 12) | Nonparetic Side (n = 12) | Healthy (n = 11) | |||||||||||
|---|---|---|---|---|---|---|---|---|---|---|---|---|---|
| 1 min | 6 min | 12 min | 18 min | 1 min | 6 min | 12 min | 18 min | 1 min | 6 min | 12 min | 18 min | ||
| TA | LR | 26.2 | 25.6 | 22.9 | 28.6 | 37.9 | 38.3 | 41.1 | 43.3 | 38.4 | 37.5 | 33.6 | 35.3 |
| (12.8) | (10.8) | (10.7) | (15.1) | (16.1) | (17.9) | (14.3) | (15.8) | (10.0) | (9.3) | (6.8) | (9.5) | ||
| SS | 16.3 b | 11.3 | 11.5 | 12.8 | 21.7 c | 21.6 | 21.7 | 17.5 | 5.4 b c | 5.3 | 5.1 | 6.5 | |
| (14.0) | (9.4) | (8.0) | (8.1) | (10.2) | (14.7) | (12.4) | (8.9) | (2.3) | (2.3) | (1.8) | (2.9) | ||
| PSw | 36.1 a b | 26.7 † | 28.7 | 27.3 † | 20.0 a | 14.5 † | 17.3 | 13.6 † | 11.0 b | 9.4 | 10.2 | 11.3 | |
| (16.7) | (15.2) | (17.1) | (13.4) | (10.6) | (8.3) | (8.2) | (7.4) | (7.0) | (4.7) | (5.4) | (5.5) | ||
| Sw | 27.7 | 23.2 | 25.3 | 26.6 | 26.5 | 22.9 | 23.9 | 24.8 | 22.4 | 21.0 | 22.2 | 24.0 | |
| (13.0) | (9.5) | (10.6) | (11.3) | (11.6) | (11.2) | (9.1) | (10.1) | (8.2) | (7.8) | (8.8) | (9.7) | ||
| Sol | LR | 30.9 a b | 28.5 | 30.5 | 32.1 | 17.9 a | 17.4 | 15.5 | 16.3 | 8.8 b | 10.1 | 9.1 | 10.4 |
| (12.1) | (8.5) | (8.3) | (10.2) | (10.5) | (12.0) | (10.3) | (10.6) | (5.6) | (9.2) | (5.5) | (7.7) | ||
| SS | 24.6 b | 21.7 | 23.1 | 25.1 | 29.1 | 25.9 | 26.1 | 29.8 | 37.5 b | 35.7 | 37.8 | 38.3 | |
| (13.1) | (9.3) | (9.6) | (11.1) | (10.3) | (8.6) | (10.2) | (10.8) | (12.3) | (11.5) | (11.2) | (11.6) | ||
| PSw | 14.2 | 14.0 | 15.7 | 15.8 | 23.1 c | 24.5 | 20.8 | 24.5 | 9.5 c | 8.9 | 9.5 | 9.3 | |
| (9.1) | (8.8) | (9.7) | 10.8) | (16.0) | (16.0) | (15.6) | (15.3) | (5.7) | (5.2) | (7.2) | (5.0) | ||
| Sw | 12.6 | 10.3 | 11.0 | 13.1 | 10.2 | 11.2 | 7.9 | 8.9 | 8.2 | 8.7 | 10.6 | 9.5 | |
| (8.1) | (6.0) | (7.0) | (9.5) | (8.1) | (9.6) | (7.5) | (7.0) | (4.5) | (4.3) | (7.1) | (5.4) | ||
| RF | LR | 32.8 | 34.5 | 32.5 | 34.9 | 34.3 | 31.8 | 36.8 | 35.5 | 39.1 | 40.1 | 42.4 | 47.0 |
| (15.9) | (12.6) | (14.9) | (17.0) | (12.2) | (13.1) | (14.9) | (14.9) | (16.7) | (16.5) | (16.9) | (20.4) | ||
| SS | 18.8 | 20.2 | 21.5 | 22.6 † | 20.1 | 22.7 | 22.7 | 23.7 † | 13.7 | 15.5 | 14.6 | 14.9 | |
| (13.1) | (10.7) | (12.8) | (12.1) | (11.8) | (13.9) | (13.0) | (14.1) | (4.1) | (8.7) | (4.2) | (4.4) | ||
| PSw | 22.6 | 19.8 | 20.4 | 21.3 | 13.8 | 16.9 | 17.2 | 16.3 | 21.4 | 23.5 | 25.3 | 22.1 | |
| (10.4) | (9.1) | (10.3) | (11.0) | (11.3) | (16.2) | (12.0) | (14.4) | (9.9) | (9.3) | (12.0) | (9.9) | ||
| Sw | 15.6 | 12.9 | 13.5 | 14.3 | 16.5 | 15.4 | 13.5 | 12.8 | 16.9 | 19.3 | 19.4 | 19.8 | |
| (10.1) | (6.8) | (8.3) | (8.1) | (10.3) | (8.3) | (7.3) | (4.4) | (3.5) | (7.1) | (7.2) | (7.1) | ||
| BF | LR | 34.0 | 33.1 | 33.4 | 34.5 | 32.9 | 27.1 | 31.1 | 29.6 | 23.5 | 28.5 | 26.5 | 26.3 |
| (12.6) | (14.7) | (11.9) | (14.3) | (15.1) | (13.0) | (12.1) | (13.9) | (8.8) | (10.2) | (5.7) | (7.6) | ||
| SS | 18.4 | 20.4 | 21.3 | 21.2 | 24.5 c | 20.6 | 20.2 | 22.0 | 12.5 c | 15.0 | 13.5 | 14.0 | |
| (9.4) | (12.9) | (14.3) | (10.9) | (14.0) | (11.8) | (12.2) | (13.9) | (7.0) | (7.5) | (5.0) | (6.3) | ||
| PSw | 9.9 | 10.0 | 10.0 | 8.3 | 16.2 | 16.2 | 15.0 | 16.4 | 7.5 | 8.6 | 8.3 | 8.8 | |
| (7.9) | (9.6) | (7.1) | (5.2) | (12.1) | (17.7) | (10.8) | (13.4) | (5.9) | (6.7) | (7.6) | (6.3) | ||
| Sw | 20.7 | 17.1 | 18.6 | 18.4 | 25.6 | 23.2 | 24.7 | 23.9 | 23.7 | 26.5 | 27.2 | 26.2 | |
| (11.9) | (6.7) | (8.1) | (7.1) | (11.0) | (10.5) | (11.1) | (10.8) | (8.7) | (7.6) | (8.3) | (6.6) | ||
Publisher’s Note: MDPI stays neutral with regard to jurisdictional claims in published maps and institutional affiliations. |
© 2021 by the authors. Licensee MDPI, Basel, Switzerland. This article is an open access article distributed under the terms and conditions of the Creative Commons Attribution (CC BY) license (https://creativecommons.org/licenses/by/4.0/).
Share and Cite
Fujita, K.; Kobayashi, Y.; Hitosugi, M. Temporal Changes in Electromyographic Activity and Gait Ability during Extended Walking in Individuals Post-Stroke: A Pilot Study. Healthcare 2021, 9, 444. https://doi.org/10.3390/healthcare9040444
Fujita K, Kobayashi Y, Hitosugi M. Temporal Changes in Electromyographic Activity and Gait Ability during Extended Walking in Individuals Post-Stroke: A Pilot Study. Healthcare. 2021; 9(4):444. https://doi.org/10.3390/healthcare9040444
Chicago/Turabian StyleFujita, Kazuki, Yasutaka Kobayashi, and Masahito Hitosugi. 2021. "Temporal Changes in Electromyographic Activity and Gait Ability during Extended Walking in Individuals Post-Stroke: A Pilot Study" Healthcare 9, no. 4: 444. https://doi.org/10.3390/healthcare9040444
APA StyleFujita, K., Kobayashi, Y., & Hitosugi, M. (2021). Temporal Changes in Electromyographic Activity and Gait Ability during Extended Walking in Individuals Post-Stroke: A Pilot Study. Healthcare, 9(4), 444. https://doi.org/10.3390/healthcare9040444