
The Political Legitimacy of the Healthcare System in Portugal: Insights from the European Social Survey


Abstract
1. Introduction
2. Theoretical Background: Citizens’ Support of the Health Care System and Predictors
2.1. The Self-Interest Hypothesis
2.2. Economic Performance
2.3. The Ideological Thesis
2.4. Political Trust Thesis
3. The Portuguese National Health System
3.1. A Dual Health Care System
3.2. The Impact of Austerity Measures on the Portuguese National Health System
3.3. Consequences of Crisis and Austerity on Inequalities
3.4. Predictors of Health Policy Legitimacy
4. Data, Variables and Methods
4.1. Data
4.2. Variables
4.3. Method
5. Results
5.1. Sample
5.2. Evaluations of Healthcare Services in Portugal
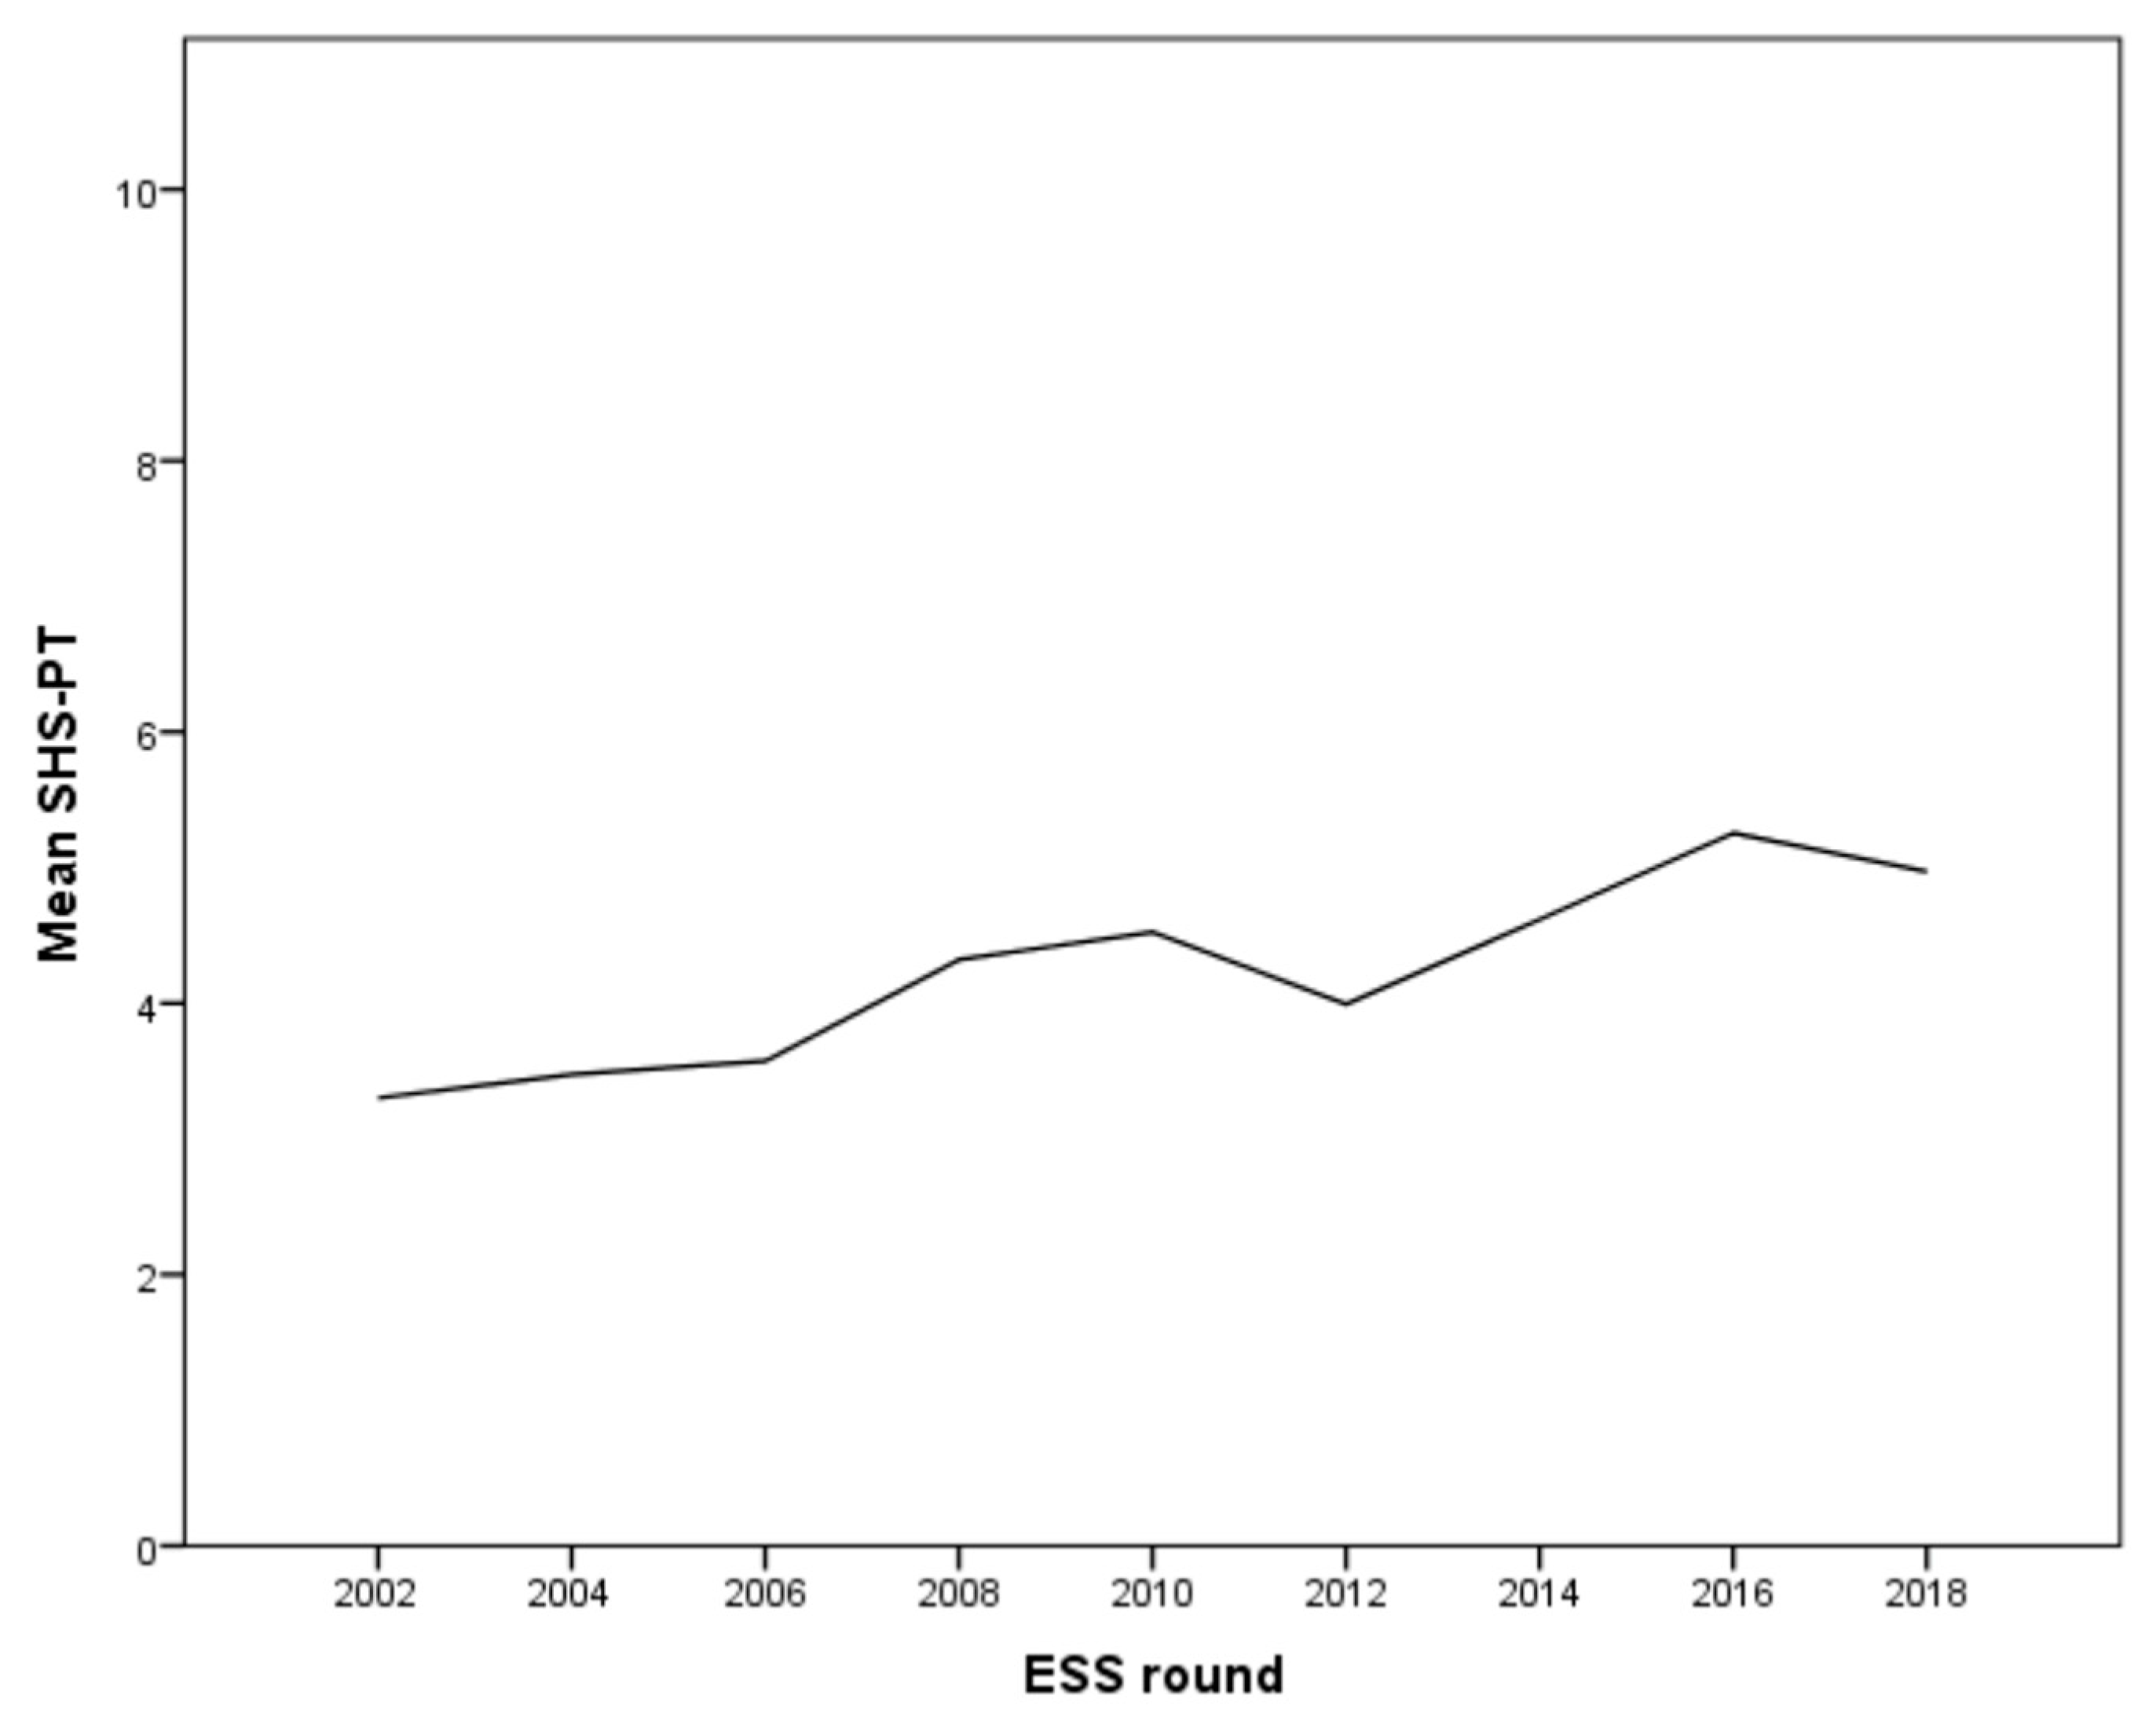
5.3. Evaluation of Healthcare Services in Portugal across Time
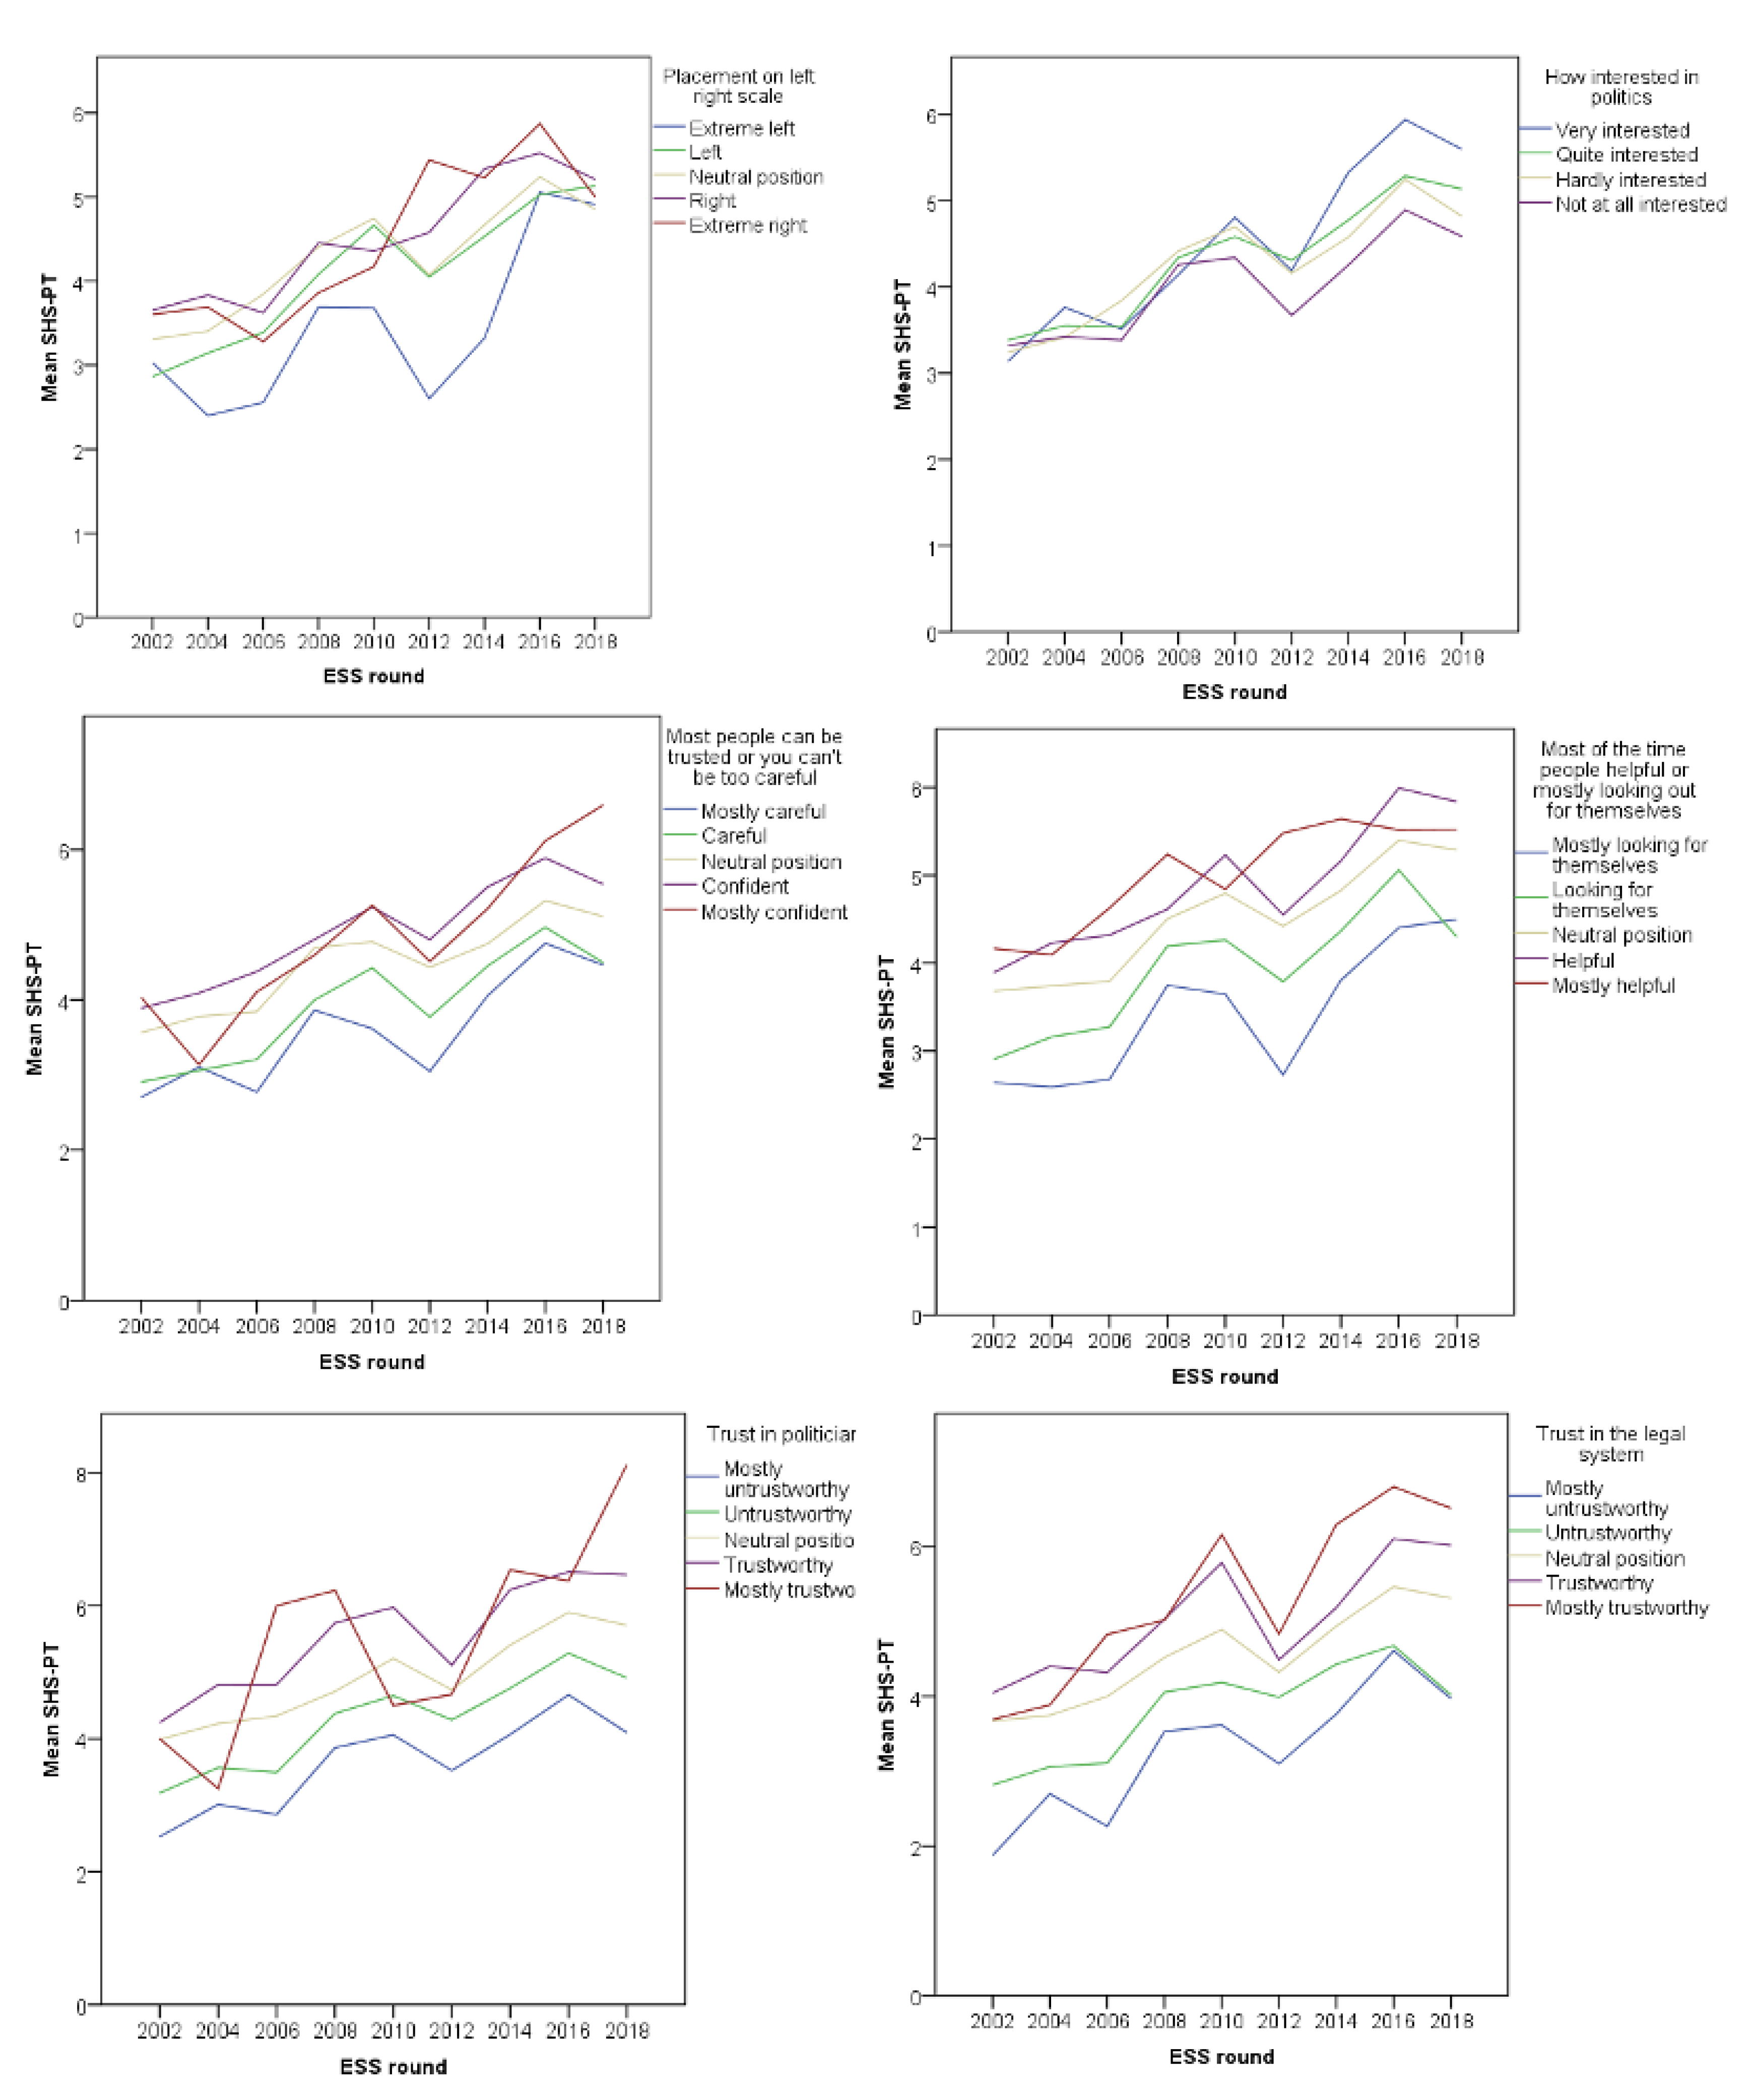
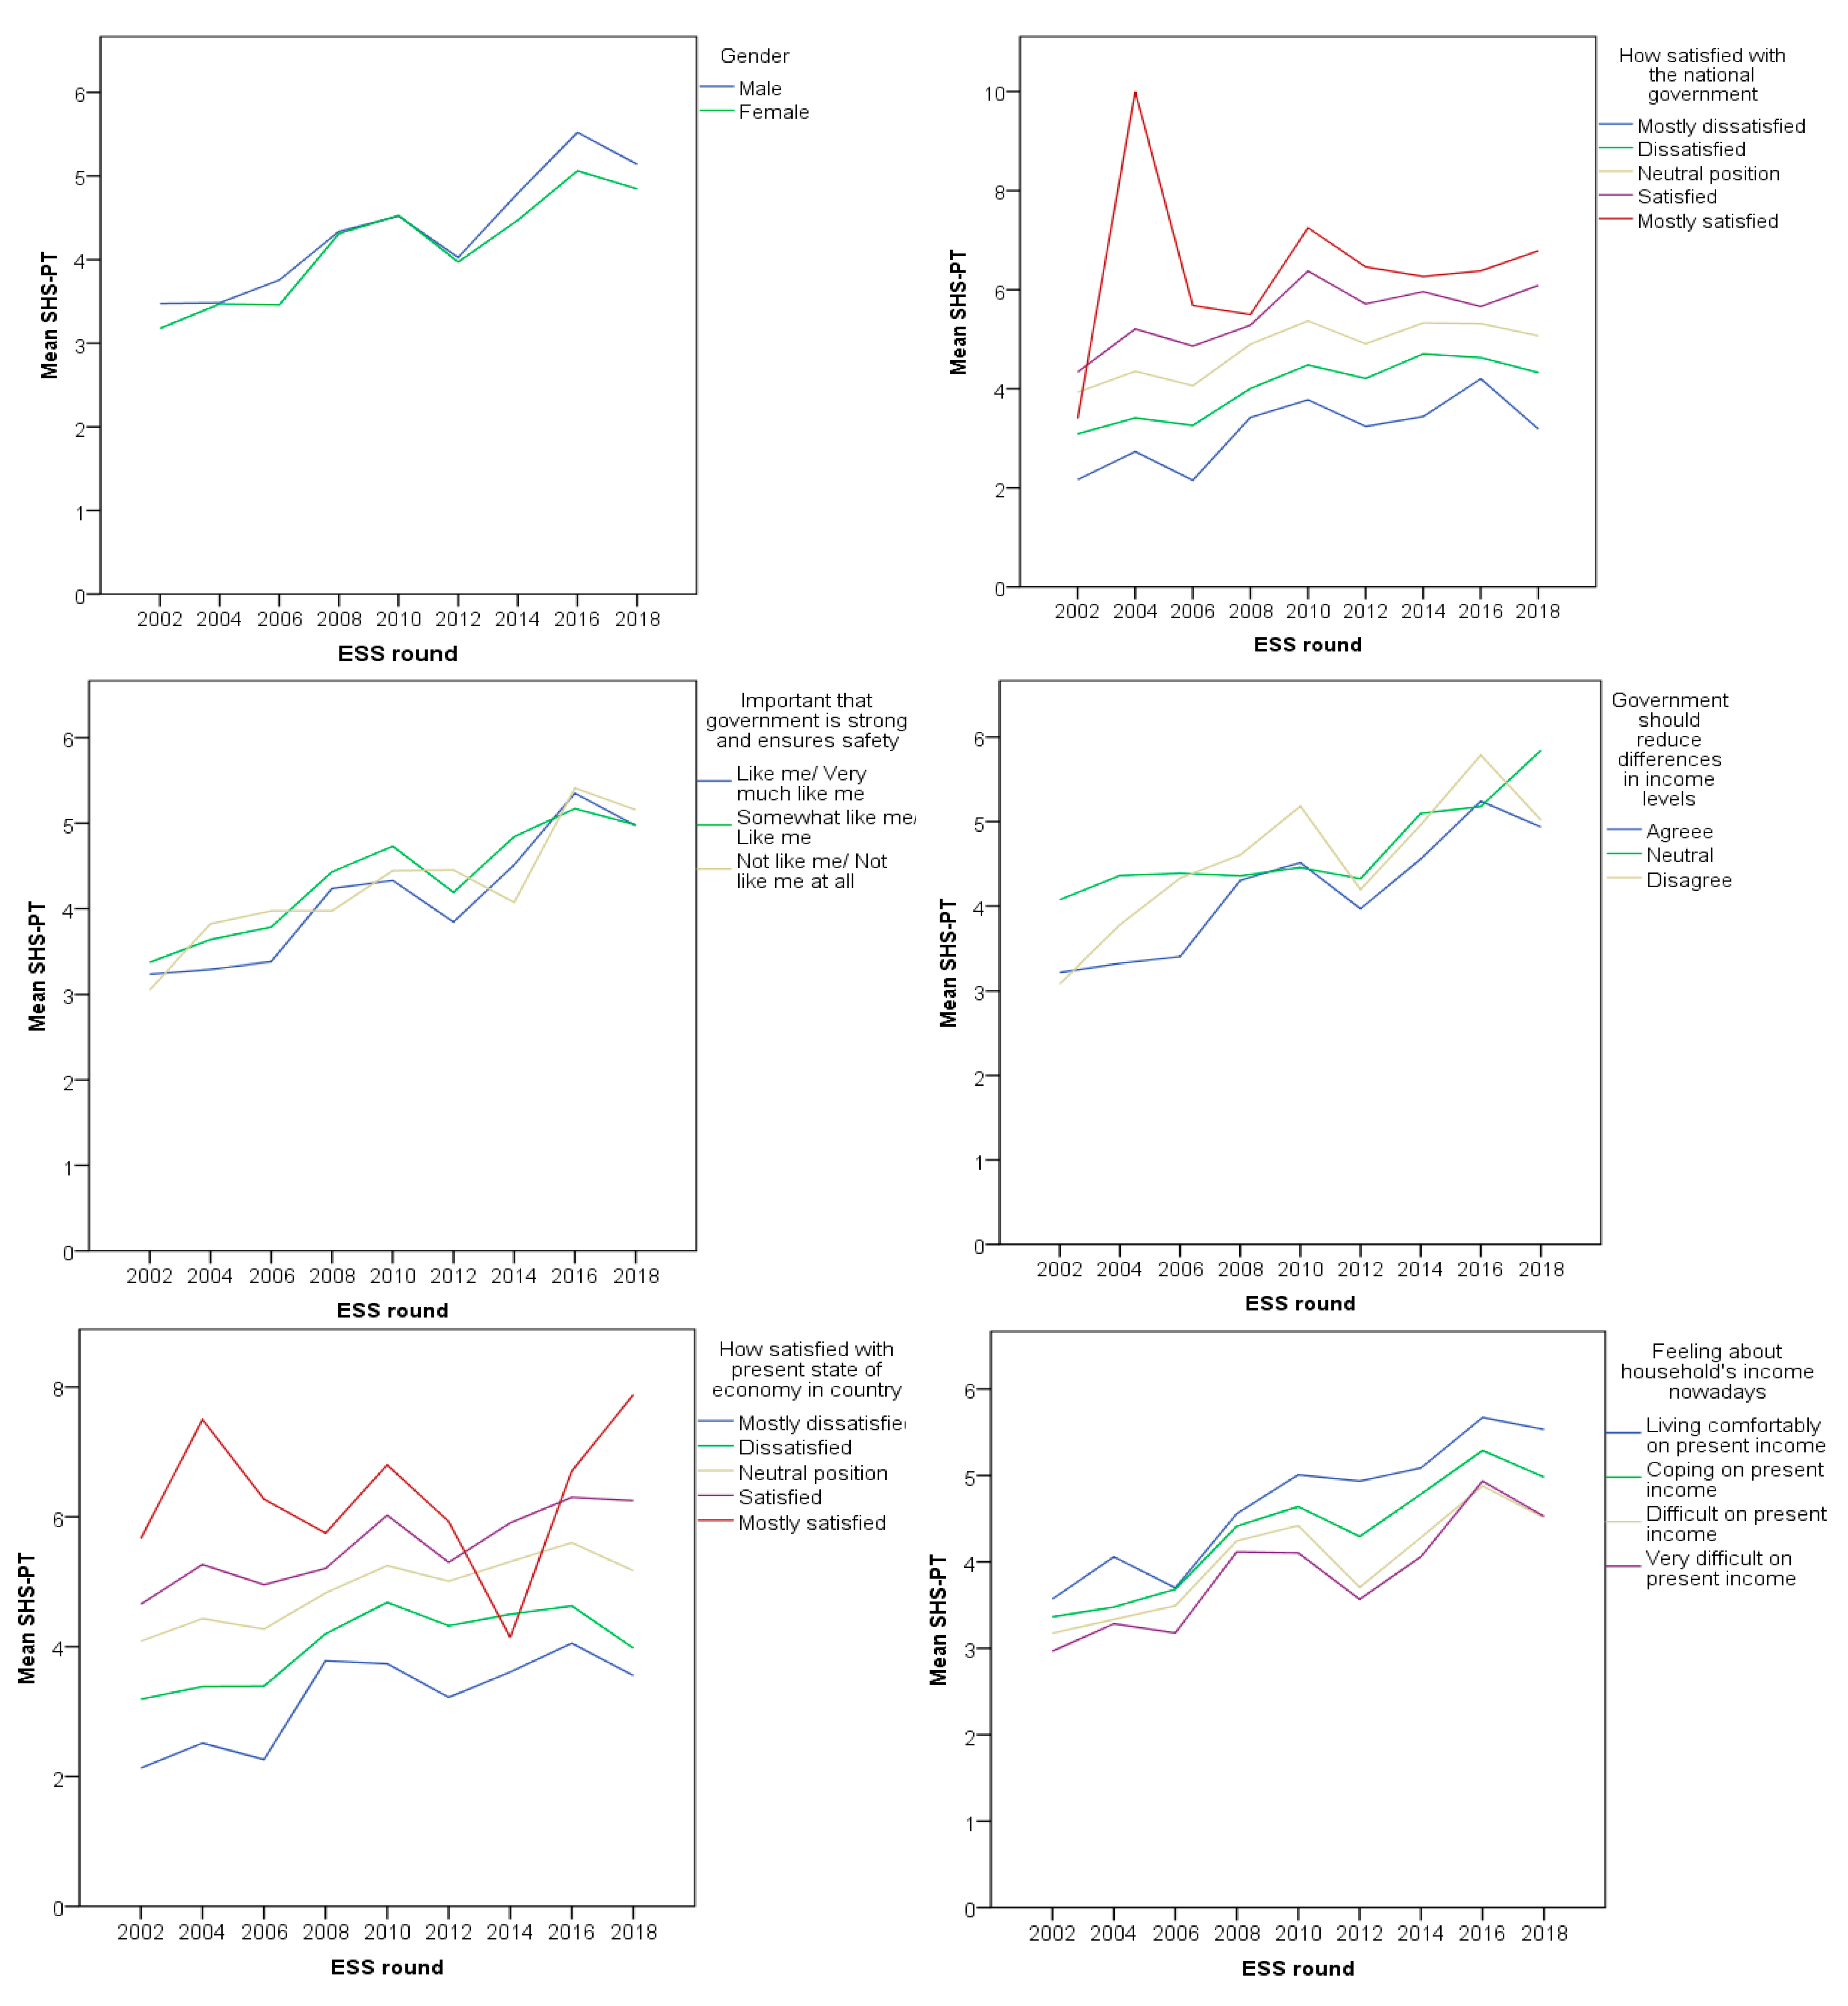
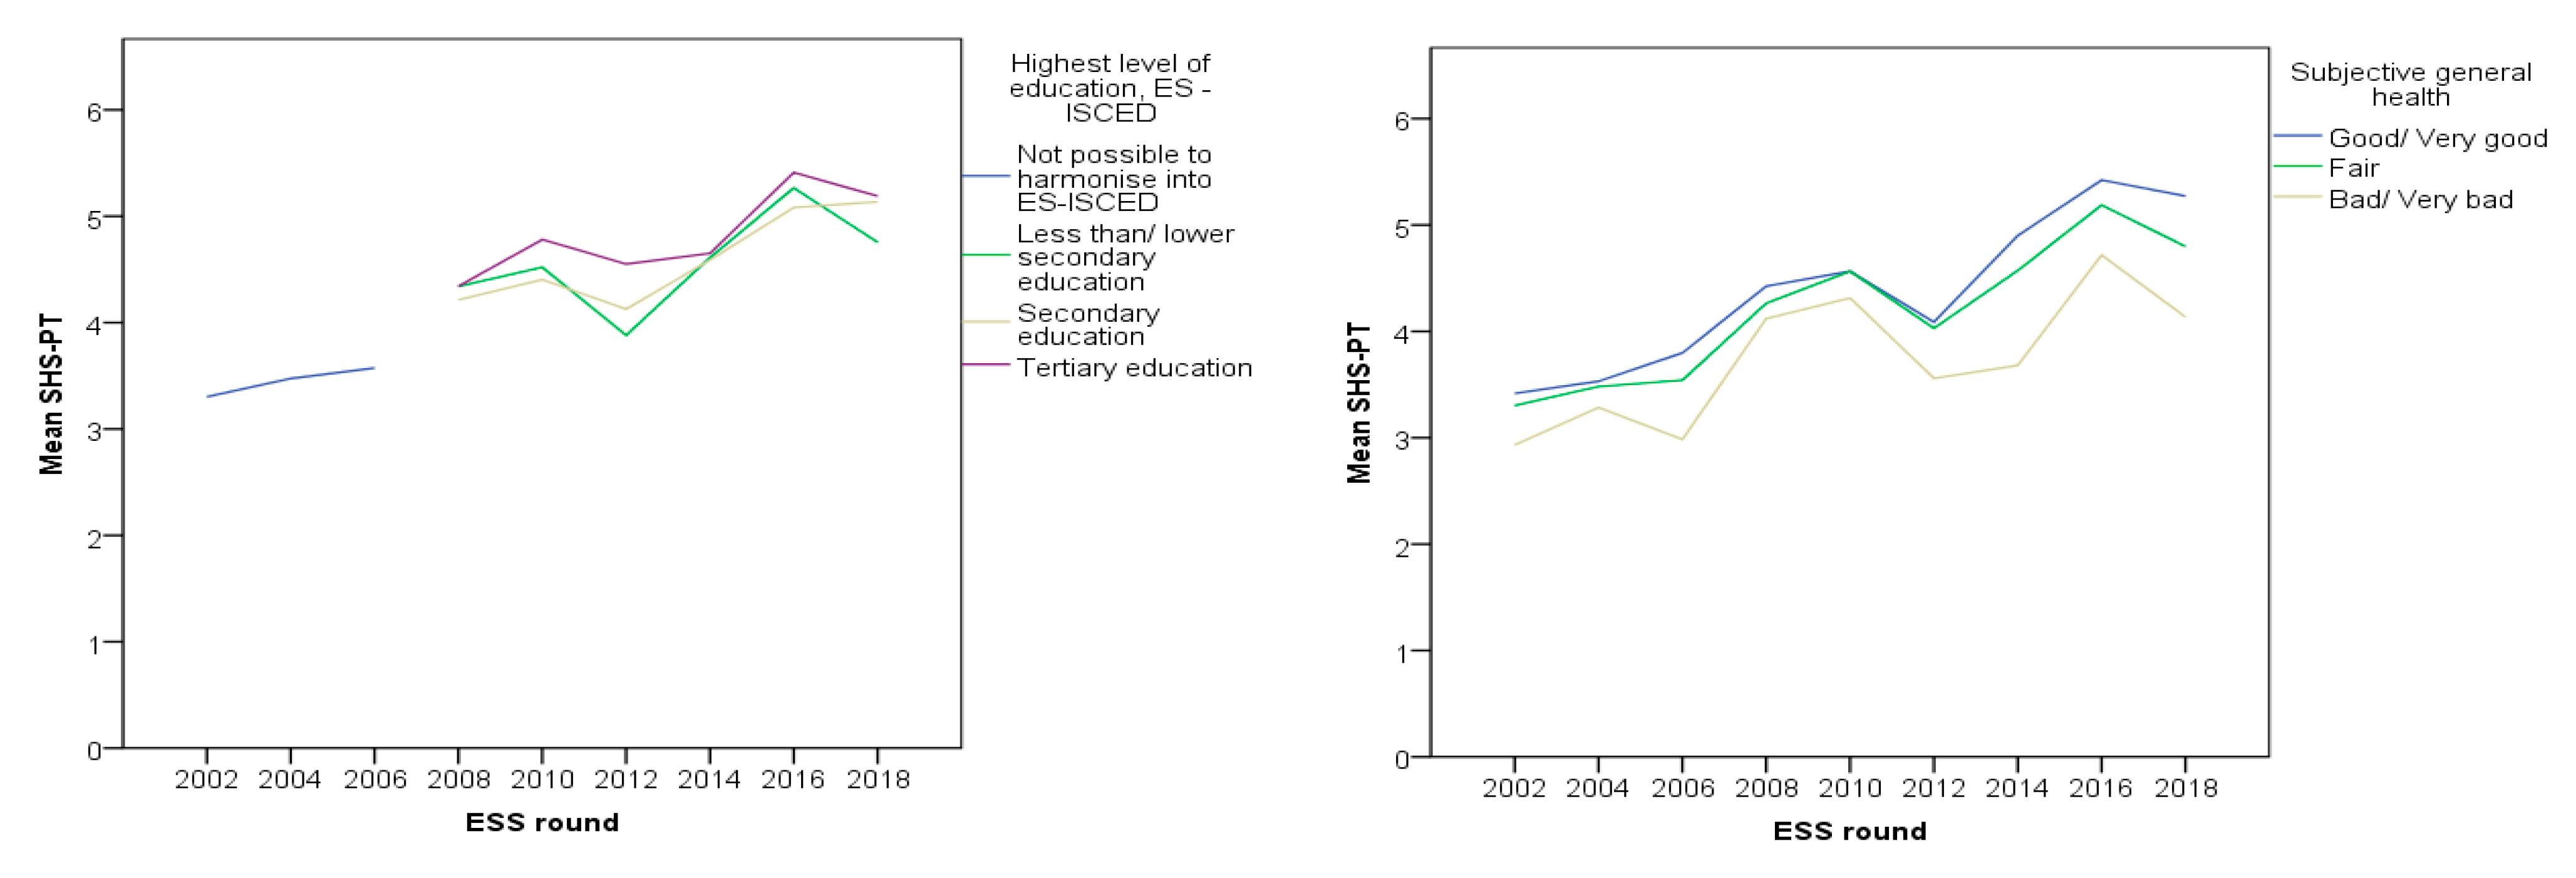
5.4. Healthcare Evaluations Associations
6. Discussion
7. Robustness Checks and Limitations
Funding
Institutional Review Board Statement
Informed Consent Statement
Data Availability Statement
Acknowledgments
Conflicts of Interest
References
- Svallfors, S. The End of Class Politics? Structural Cleavages and Attitudes to Swedish Welfare Policies. Acta Sociol. 1995, 38, 53–74. [Google Scholar] [CrossRef]
- Wendt, C.; Kohl, J.; Mischke, M.; Pfeifer, M. How Do Europeans Perceive Their Healthcare System? Patterns of Satisfaction and Preference for State Involvement in the Field of Healthcare. Eur. Sociol. Rev. 2010, 26, 177–192. [Google Scholar] [CrossRef]
- Taylor-Gooby, P. Public Opinion, Ideology, and State Welfare; Routledge: London, UK, 1985. [Google Scholar]
- Taylor-Gooby, P.; Leruth, B.; Chung, H. After Austerity: Welfare State Transformation in Europe after the Great Recession; Oxford University Press: Oxford, UK, 2017. [Google Scholar]
- Bonoli, G. Public Attitudes to Social Protection and Political Economy Traditions in Western Europe. Eur. Soc. 2000, 2, 431–452. [Google Scholar] [CrossRef]
- Asensio, M. Portugal. In Health Politics in Europe: A Handbook; Ellen, M.I., Anderson, K.M., Devitt, C., Popic, T., Eds.; Oxford University Press: Oxford, UK, 2021. [Google Scholar]
- Popic, T.; Schneider, S.M.; Asensio, M. Public Opinion on Healthcare in the Context of Economic Crisis: Evidence from Portugal. J. Soc. Policy 2018, 48, 741–764. [Google Scholar] [CrossRef]
- Jensen, C.; Petersen, M.B. The deservingness heuristic and the politics of health care. Am. J. Political Sci. 2017, 61, 68–83. [Google Scholar] [CrossRef]
- Van Oorschot, W.; Meuleman, B. Does Popular Support for Welfare States Depend on their Outcomes? In Contested Welfare States: Welfare Attitudes in Europe and Beyond; Svallfors, S., Ed.; Stanford University Press: Stanford, CA, USA, 2012. [Google Scholar]
- Moury, C.; Standring, A. ‘Going beyond the Troika’: Power and discourse in Portuguese austerity politics. Eur. J. Political Res. 2017, 56, 660–679. [Google Scholar] [CrossRef]
- Van Oorschot, W. Changing Principles in European Social Security. Eur. J. Soc. Secur. 2002, 4, 89–115. [Google Scholar]
- Gelissen, J. Worlds of Welfare, Worlds of Consent? Public Opinion on the Welfare State; Leiden: Brill, The Netherlands, 2002. [Google Scholar]
- Rothstein, B.; Steinmo, S. Restructuring the Welfare State: Political Institutions and Policy Change; Palgrave: New York, NY, USA, 2002. [Google Scholar]
- Jaeger, M.M. What Makes People Support Public Responsibility for Welfare Provision: Self-interest or Political Ideology? Acta Sociol. 2006, 49, 321–338. [Google Scholar] [CrossRef]
- Blekesaune, M. Economic conditions and public attitudes to welfare policies. Eur. Sociol. Rev. 2007, 23, 393–403. [Google Scholar] [CrossRef]
- Van Oorschot, W. Why pay for welfare: A sociological analysis of reasons for welfare solidarity, Netherlands. J. Soc. Sci. 2000, 36, 15–36. [Google Scholar]
- Blekesaune, M.; Quadagno, J. Public Attitudes toward Welfare State Policies. Eur. Sociol. Rev. 2003, 19, 415–427. [Google Scholar] [CrossRef]
- Mossialos, E. Citizens’ Views on Health Care Systems in the 15 Member States of the European Union. Health Econ. 1997, 6, 109–116. [Google Scholar] [CrossRef]
- Missinne, S.; Meuleman, B.; Bracke, P. The popular legitimacy of European healthcare systems: A multilevel analysis of 24 countries. J. Eur. Soc. Policy 2013, 23, 231–247. [Google Scholar] [CrossRef]
- Svallfors, S. Government Quality, Egalitarianism, and Attitudes to Taxes and Social Spending: A European Comparison. Eur. Political Sci. Rev. 2013, 5, 363–380. [Google Scholar] [CrossRef]
- Svallfors, S. Worlds of Welfare and Attitudes to Redistribution: A Comparison of Eight Western Nations. Eur. Sociol. Rev. 1997, 1, 233–304. [Google Scholar] [CrossRef]
- Rose, R.; Peters, B. Can Government Go Bankrupt? Basic Books: New York, NY, USA, 1978. [Google Scholar]
- Wilensky, H. The Welfare State and Equality: Structural and Ideological Roots of Public Expenditure; University of California Press: Berkeley, CA, USA, 1975. [Google Scholar]
- Galbraith, J. The Culture of Contentment; Penguin: Harmondsworth, UK, 1992. [Google Scholar]
- Naumann, E. Increasing conflict in times of retrenchment? Attitudes towards healthcare provision in Europe between 1996 and 2002. Int. J. Soc. Welf. 2014, 23, 276–286. [Google Scholar] [CrossRef]
- Hechter, M. Principles of Group Solidarity; University of California Press: Berkeley, CA, USA, 1987. [Google Scholar]
- Inglehart, R. Culture Shift in Advanced Society; Princeton University Press: Princeton, NJ, USA, 1990. [Google Scholar]
- Taylor-Gooby, P. Markets and Motives: Trust and Egoism in Welfare Markets. J. Soc. Policy 1999, 28, 97–114. [Google Scholar] [CrossRef]
- Edlund, J. Trust in government and welfare regimes: Attitudes to redistribution and financial cheating in the USA and Norway. Eur. J. Political Res. 1999, 35, 341–370. [Google Scholar] [CrossRef]
- Bean, C.; Papadakis, E. A Comparison of Attitudes Towards the Welfare States in Different Institutional Regimes, 1985–1990. Int. J. Public Opin. Res. 1998, 10, 211–236. [Google Scholar] [CrossRef]
- Hasenfeld, Y.; Rafferty, J.A. The Determinants of Public Attitudes Toward the Welfare State. Soc. Forces 1989, 67, 1027–1048. [Google Scholar] [CrossRef]
- Gevers, J.; Gelissen, J.; Arts, W.; Muffels, R. Public Health Care in the Balance: Exploring Popular Support for Health Care Systems in the European Union. Int. J. Soc. Welf. 2000, 9, 301–321. [Google Scholar] [CrossRef]
- Malat, J. Social distance and patients’ rating of healthcare providers. J. Health Soc. Behav. 2001, 42, 360–372. [Google Scholar] [CrossRef] [PubMed]
- Footman, K.; Roberts, B.; Mills, A.; Richardson, E.; McKee, M. Public satisfaction as a measure of health system performance: A study of nine countries in the former Soviet Union. Health Policy 2013, 112, 62–69. [Google Scholar] [CrossRef]
- Sitzia, J.; Wood, N. Patient Satisfaction: A Review of Issues and Concepts. Soc. Sci. Med. 1997, 45, 829–843. [Google Scholar] [CrossRef]
- Lee, S.Y.; Suh, N.K.; Song, J.K. Determinants of public satisfaction with the National Health Insurance in South Korea. Int. J. Health Plan. Manag. 2009, 24, 131–146. [Google Scholar] [CrossRef] [PubMed]
- Pavollini, E.; Guillén, A. Health Care Systems in Europe under Austerity: Institutional Reforms and Performance; Springer: London, UK, 2013. [Google Scholar]
- Traina, G.; Martinussen, P.E.; Feiring, E. Being Healthy, Being Sick, Being Responsible: Attitudes towards Responsibility for Health in a Public Healthcare System. Public Health Ethics 2019, 12, 145–157. [Google Scholar] [CrossRef] [PubMed]
- Huang, M.H.; Chang, Y.T.; Chu, Y.H. Identifying Sources of Democratic Legitimacy: A Multi-level Analysis. Elect. Stud. 2008, 27, 45–62. [Google Scholar] [CrossRef]
- Lühiste, K. Social Protection and Satisfaction with Democracy: A Multi-Level Analysis. Political Stud. 2014, 62, 784–803. [Google Scholar] [CrossRef]
- D’Anjou, L.; Steijn, A.; Van Aarsen, D. Social Position, Ideology, and Distributive Justice. Soc. Justice Res. 1995, 8, 351–384. [Google Scholar] [CrossRef]
- Misztal, B. Trust in Modern Societies: The Search for the Bases of Social Order; Wiley: Cambridge, UK, 1996. [Google Scholar]
- Van Oorschot, W. The Legitimacy of Welfare: A Sociological Analysis of the Motives for Contributing to Welfare Schemes, Paper 99; WORC/TISSER: Tilburg, The Netherlands, 1999. [Google Scholar]
- Bentes, M.; Dias, C.M.; Sakellarides, C.; Bankauskaite, V. Portugal: Health Care Systems in Transition; European Observatory on Healthcare Systems and Policies: Brussels, Belgium, 2004. [Google Scholar]
- Asensio, M.; Popic, T. Portuguese healthcare reforms in the context of crisis: External pressure or domestic choice? Soc. Policy Adm. 2019, 53, 1003–1017. [Google Scholar] [CrossRef]
- Barros, P.P.; Machado, S.; Simões, J. Portugal: Health Care System Review; European Observatory on Healthcare Systems and Policies: Brussels, Belgium, 2007. [Google Scholar]
- Simões, J.; Augusto, G.; Fronteira, I.; Hernández-Quevedo, C. Portugal. Health Systems Review. Health Syst. Transit. 2017, 19, 1–184. [Google Scholar]
- European Commission. Portugal: Memorandum of Understanding on Specific Economic and Policy Conditionality; European Commission: Brussels, Belgium, 2014. [Google Scholar]
- INE. Health Satellite Accounts–Base 2011; INE: Lisboa, Portugal, 2014. [Google Scholar]
- European Commission. Portugal: Memorandum of Understanding on Specific Economic and Policy Conditionality; European Commission: Brussels, Belgium, 2011. [Google Scholar]
- Thomson, S.; Figueras, J.; Evetovits, T.; Jowett, M.; Mladovsky, P.; Maresso, A.; Cylus, J.; Karanikolos, M.; Kluge, H. Health, Health Systems and Economic Crisis in Europe Impact and Policy Implications; WHO: Copenhagen, Denmark, 2014. [Google Scholar]
- Avram, S.; Figari, F.; Leventi, C.; Levy, H.; Navicke, J.; Matsaganis, M.; Militaru, E.; Paulus, A.; Rastringina, O.; Sutherland, H. The Distributional Effects of Fiscal Consolidation. EUROMOD Work. Pap. n.º EM 2/13; Institute of Social and Economic Re-search, Essex University: Colchester, UK, 2013; pp. 1–45. [Google Scholar]
- Serapioni, M. Economic Crisis and Inequalities in Health Systems in the Countries of Southern Europe. Cadernos de Saúde Pública 2017, 33, e00170116. [Google Scholar] [PubMed]
- OPSS–Observatório Português dos Sistemas de Saúde. Acesso aos Cuidados de saúde. Um Direito em Risco? Observatório Português dos Sistemas de Saúde. Relatório de Primavera: Coimbra, Portugal, 2015. [Google Scholar]
- Kohl, J.; Wendt, C. Satisfaction with Health Care Systems: A Comparison of EU Countries’. In Challenges for Quality of Life in the Contemporary World; Glatzer, W., Below, S.V., Stoffregen, M., Eds.; Kluwer Academic Publishers: Dordrecht, The Netherlands, 2004. [Google Scholar]
- Miller, A.H. Political issues and trust in government: 1964–1970. Am. Political Sci. Rev. 1974, 68, 951–972. [Google Scholar] [CrossRef]


| 2002–2010 R2 = 0.304; F = 194.93 (p < 0.001) | 2012–2018 R2 = 0.313; F = 169.55 (p < 0.001) | |||||||
|---|---|---|---|---|---|---|---|---|
| β | SE | p | 95% CI | β | SE | p | 95% CI | |
| Socio-Demographic Characteristics Female (0 = male) | −0.07 | 0.04 | p = 0.099 | −0.16; 0.01 | −0.27 | 0.06 | p < 0.001 * | −0.40; −0.15 |
| Age | ≈0 | ≈0 | p = 0.610 | −0.01; 0.01 | ≈0 | ≈0 | p = 0.827 | −0.01; 0.01 |
| Institutional Effectiveness Satisfaction with government | ||||||||
| Mostly dissatisfied | - | - | - | - | - | - | - | - |
| Dissatisfied | 0.71 | 0.06 | p < 0.001 * | 0.60; 0.82 | 1.04 | 0.09 | p < 0.001 * | 0.87; 1.21 |
| Neutral position | 1.46 | 0.06 | p < 0.001 * | 1.35; 1.57 | 1.78 | 0.09 | p < 0.001 * | 1.63; 1.94 |
| Satisfied | 2.00 | 0.10 | p < 0.001 * | 1.79; 2.20 | 2.43 | 0.11 | p < 0.001 * | 2.21; 2.65 |
| Mostly satisfied | 2.09 | 0.25 | p < 0.001 * | 1.60; 2.57 | 3.06 | 0.20 | p < 0.001 * | 2.67; 3.45 |
| Government strength and safety | ||||||||
| Like me/Very much like me | - | - | - | - | - | - | - | - |
| Somewhat like me/Like me | 0.28 | 0.04 | p < 0.001 * | 0.19; 0.36 | 0.16 | 0.06 | p = 0.013 * | 0.03; 0.28 |
| Not like me/Not like me at all | 0.07 | 0.11 | p = 0.498 | −0.14; 0.28 | 0.30 | 0.16 | p = 0.053 * | −0.04; 0.60 |
| Government policy for income equity | ||||||||
| Agree | - | - | - | - | - | - | - | - |
| Normal | 0.33 | 0.08 | p < 0.001 * | 0.17; 0.49 | 0.17 | 0.13 | p = 0.209 | −0.10; 0.43 |
| Disagree | 0.25 | 0.12 | p = 0.036 * | 0.02; 0.48 | 0.36 | 0.17 | p = 0.029 * | 0.04; 0.69 |
| Predictors | β | SE | p | 95% CI |
|---|---|---|---|---|
| Socio-Demographic Characteristics Female (0 = male) | −0.14 | 0.04 | p < 0.001 * | −0.21; −0.07 |
| Age | ≈0 | ≈0 | p = 0.729 | −0.01; 0.01 |
| Institutional Effectiveness Satisfaction with government | ||||
| Mostly dissatisfied | - | - | - | - |
| Dissatisfied | 0.82 | 0.05 | p < 0.001 * | 0.73; 0.92 |
| Normal position | 1.58 | 0.05 | p < 0.001 * | 1.49; 1.67 |
| Satisfied | 2.18 | 0.07 | p < 0.001 * | 2.03; 2.33 |
| Mostly satisfied | 2.65 | 0.15 | p < 0.001 * | 2.25; 2.94 |
| Government strength and safety | ||||
| Like me/Very much like me | - | - | - | - |
| Somewhat like me/Like me | 0.24 | 0.04 | p < 0.001 * | 0.17; 0.31 |
| Not like me/Not like me at all | 0.16 | 0.09 | p = 0.071 | −0.01; 0.33 |
| Government policy for income equity | ||||
| Agree | - | - | - | - |
| Neutral | 0.29 | 0.07 | p < 0.001 * | 0.15; 0.43 |
| Disagree | 0.29 | 0.10 | p = 0.003 * | 0.10; 0.48 |
| Stratification | ||||
| 2002–2010 | - | - | - | - |
| 2012–2018 | 0.61 | 0.04 | p < 0.001 * | 0.53; 0.68 |
| Predictors | 2002–2010 R2 = 0.284; F = 214.28 (p < 0.001) | 2012–2018 R2 = 0.130; F = 207.39 (p < 0.001) | ||||||
|---|---|---|---|---|---|---|---|---|
| β | SE | p | 95% CI | β | SE | p | 95% CI | |
| Socio-Demographic Characteristics Female (0 = male) | −0.07 | 0.04 | p = 0.115 | −0.16; 0.02 | −0.21 | 0.07 | p < 0.001 * | −0.33; −0.08 |
| Age | 0.01 | ≈0 | p = 0.001 * | 0.01; 0.01 | 0.01 | ≈0 | p = 0.096 | −0.01; 0.01 |
| Satisfaction with economy | ||||||||
| Mostly dissatisfied | - | - | - | - | - | - | - | - |
| Dissatisfied | 0.78 | 0.05 | p < 0.001 * | 0.67; 0.88 | 0.88 | 0.09 | p < 0.001 * | 0.71; 1.04 |
| Neutral position | 1.50 | 0.06 | p < 0.001 * | 1.38; 1.61 | 1.75 | 0.08 | p < 0.001 * | 1.59; 1.91 |
| Satisfied | 2.10 | 0.14 | p < 0.001 * | 1.83; 2.38 | 2.49 | 0.14 | p < 0.001 * | 2.22; 2.76 |
| Mostly satisfied | 3.21 | 0.37 | p < 0.001 * | 2.50; 3.93 | 2.80 | 0.30 | p < 0.001 * | 2.22; 3.38 |
| Subj. Household income (0 = living comfortably) | ||||||||
| Living comfortably on present income | - | - | - | - | - | - | - | - |
| Coping on present income | −0.19 | 0.08 | p = 0.024 * | −0.36; −0.03 | −0.41 | 0.10 | p < 0.001 * | −0.61; −0.22 |
| Difficult on present income | −0.26 | 0.09 | p = 0.003 * | −0.44; −0.09 | −0.76 | 0.11 | p < 0.001 * | −0.97; −0.55 |
| Very difficult on present income | −0.25 | 0.10 | p = 0.015 * | −0.45; −0.05 | −0.70 | 0.13 | p < 0.001 * | −1.00; −0.44 |
| Predictors | β | SE | p | 95% CI |
|---|---|---|---|---|
| Socio-Demographic Characteristics Female (0 = male) | −0.12 | 0.04 | p = 0.001 * | −0.19; −0.05 |
| Age | 0.01 | ≈0 | p < 0.001 * | 0.01; 0.01 |
| Satisfaction with economy | ||||
| Mostly dissatisfied | - | - | - | - |
| Dissatisfied | 0.82 | 0.05 | p < 0.001 * | 0.74; 0.90 |
| Normal position | 1.60 | 0.05 | p < 0.001 * | 1.51; 1.69 |
| Satisfied | 2.32 | 0.10 | p < 0.001 * | 2.14; 2.51 |
| Mostly satisfied | 2.88 | 0.23 | p < 0.001 * | 2.44; 3.33 |
| Subj. Household income (0 = living comfortably) | ||||
| Living comfortably on present income | - | - | - | - |
| Coping on present income | −0.32 | 0.06 | p < 0.001 * | −0.45; −0.30 |
| Difficult on present income | −0.50 | 0.07 | p < 0.001 * | −0.63; −0.36 |
| Very difficult on present income | −0.46 | 0.08 | p < 0.001 * | −0.61; −0.20 |
| Stratification | ||||
| 2002–2010 | - | - | - | - |
| 2012–2018 | 0.56 | 0.04 | p < 0.001 * | 0.49; 0.64 |
| Predictors | 2002–2010 R2 = 0.08; F = 10.81 (p < 0.001) | 2012–2018 R2 = 0.038; F = 46.30 (p < 0.001) | ||||||
|---|---|---|---|---|---|---|---|---|
| β | SE | p | 95% CI | β | SE | p | 95% CI | |
| Socio-Demographic Characteristics Female (0 = male) | −0.19 | 0.05 | p = 0.001 * | −0.29; −0.08 | −0.23 | 0.07 | p = 0.001 * | −0.37; −0.09 |
| Age | 0.01 | ≈0 | p = 0.043 * | 0.01; 0.01 | 0.01 | 0.01 | p = 0.372 | −0.01; 0.01 |
| Left-Right Schema | ||||||||
| Extreme left | - | - | - | - | - | - | - | - |
| Left | 0.59 | 0.14 | p < 0.001 * | 0.32; 0.86 | 0.70 | 0.15 | p < 0.001 * | 0.41; 0.98 |
| Centrist neutral position | 0.92 | 0.13 | p < 0.001 * | 0.66; 1.17 | 0.77 | 0.13 | p < 0.001 * | 0.52; 1.03 |
| Right | 0.91 | 0.14 | p < 0.001 * | 0.64; 1.18 | 1.15 | 0.15 | p < 0.001 * | 0.85; 1.44 |
| Extreme right | 0.65 | 0.18 | p < 0.001 * | 0.31; 1.00 | 1.46 | 0.18 | p < 0.001 * | 1.10; 1.82 |
| Interest in politics | ||||||||
| Very interested | - | - | - | - | - | - | - | - |
| Quite interested | ≈0 | 0.11 | p = 0.988 | −0.21; 0.21 | −0.47 | 0.13 | p < 0.001 * | −0.72; −0.22 |
| Hardly interested | 0.07 | 0.11 | p = 0.505 | −0.14; 0.29 | −0.70 | 0.13 | p < 0.001 * | −0.95; −0.44 |
| Not at all interested | −0.09 | 0.11 | p = 0.385 | −0.31; 0.12 | −1.15 | 0.13 | p < 0.001 * | −1.41; −0.89 |
| Predictors | β | SE | p | 95% CI |
|---|---|---|---|---|
| Socio-Demographic Characteristics Female (0 = male) | −0.20 | 0.04 | p < 0.001 * | −0.28; −0.11 |
| Age | 0.01 | ≈0 | p = 0.014 * | 0.01; 0.01 |
| Political mindset | ||||
| Extreme left | - | - | - | - |
| Left | 0.64 | 0.10 | p < 0.001 * | 0.45; 0.84 |
| Centrist position | 0.88 | 0.09 | p < 0.001 * | 0.70; 1.10 |
| Right | 1.01 | 0.10 | p < 0.001 * | 0.82; 1.21 |
| Extreme right | 1.04 | 0.13 | p < 0.001 * | 0.80; 1.29 |
| Interest in politics | ||||
| Very interested | - | - | - | - |
| Quite interested | −0.23 | 0.08 | p = 0.005 * | −0.40; −0.07 |
| Hardly interested | −0.28 | 0.08 | p = 0.001 * | −0.44; −0.12 |
| Not at all interested | −0.55 | 0.08 | p < 0.001 * | −0.72; −0.39 |
| Stratification | ||||
| 2002–2010 | - | - | - | - |
| 2012–2018 | 0.83 | 0.04 | p < 0.001 * | 0.74; 0.91 |
| Predictors | 2002–2010 R2 = 0.100; F = 174.52 (p < 0.001) | 2012–2018 R2 = 0.127; F = 132.75 (p < 0.001) | ||||||
|---|---|---|---|---|---|---|---|---|
| β | SE | p | 95% CI | β | SE | p | 95% CI | |
| Socio-Demographic Characteristics Female (0 = male) | −0.09 | 0.04 | p = 0.047 * | −0.17; −0.01 | −0.24 | 0.06 | p < 0.001 * | −0.37; −0.12 |
| Age | 0.01 | ≈0 | p = 0.037 * | 0.01; 0.01 | 0.01 | ≈0 | p = 0.005 * | 0.01; 0.01 |
| People trustworthiness | ||||||||
| Mostly careful | - | - | - | - | - | - | - | - |
| Careful | 0.08 | 0.07 | p = 0.232 | −0.05; 0.22 | 0.09 | 0.10 | p = 0.373 | −0.11; 0.29 |
| Neutral position | 0.35 | 0.07 | p < 0.001 * | 0.21; 0.48 | 0.42 | 0.09 | p < 0.001 * | 0.24; 0.61 |
| Confident | 0.52 | 0.09 | p < 0.001 * | 0.34; 0.70 | 0.71 | 0.12 | p < 0.001 * | 0.47; 0.95 |
| Mostly confident | 0.06 | 0.18 | p = 0.742 | −0.29; 0.40 | 0.74 | 0.23 | p < 0.001 * | 0.29; 1.19 |
| People helpfulness | ||||||||
| Mostly looking for themselves | - | - | - | - | - | - | - | - |
| Looking for themselves | 0.22 | 0.08 | p = 0.005 * | 0.07; 0.37 | 0.45 | 0.11 | p < 0.001 * | 0.23; 0.66 |
| Neutral position | 0.50 | 0.08 | p < 0.001 * | 0.35; 0.66 | 0.77 | 0.10 | p < 0.001 * | 0.57; 0.98 |
| Helpful | 0.76 | 0.10 | p < 0.001 * | 0.56; 0.95 | 0.97 | 0.14 | p < 0.001 * | 0.69; 1.24 |
| Mostly helpful | 1.13 | 0.19 | p < 0.001 * | 0.76; 1.50 | 1.33 | 0.24 | p < 0.001 * | 0.87; 1.79 |
| Trust in politicians | ||||||||
| Mostly untrustworthy | - | - | - | - | - | - | - | - |
| Untrustworthy | 0.18 | 0.06 | p = 0.001 * | 0.07; 0.29 | 0.42 | 0.08 | p < 0.001 * | 0.26; 0.58 |
| Neutral position | 0.58 | 0.06 | p < 0.001 * | 0.46; 0.70 | 0.86 | 0.09 | p < 0.001 * | 0.69; 1.04 |
| Trustworthy | 0.91 | 0.14 | p < 0.001 * | 0.63; 1.19 | 1.31 | 0.19 | p < 0.001 * | 0.93; 1.68 |
| Mostly trustworthy | 1.36 | 0.43 | p = 0.002 * | 0.52; 2.21 | 1.63 | 0.44 | p < 0.001 * | 0.76; 2.49 |
| Trust in the legal system | ||||||||
| Mostly untrustworthy | - | - | - | - | - | - | - | - |
| Untrustworthy | 0.31 | 0.07 | p < 0.001 * | 0.18; 0.45 | 0.22 | 0.11 | p = 0.026 * | 0.03; 0.41 |
| Neutral position | 0.76 | 0.07 | p < 0.001 * | 0.63; 0.90 | 0.56 | 0.10 | p < 0.001 * | 0.37; 0.75 |
| Trustworthy | 1.10 | 0.09 | p < 0.001 * | 0.93; 1.27 | 0.82 | 0.12 | p < 0.001 * | 0.58; 1.07 |
| Mostly trustworthy | 1.10 | 0.16 | p < 0.001 * | 0.79; 1.42 | 1.71 | 0.22 | p < 0.001 * | 1.27; 2.15 |
| Predictors | β | SE | p | 95% CI |
|---|---|---|---|---|
| Socio-Demographic Characteristics Female (0 = male) | −0.15 | 0.04 | p < 0.001 * | −0.22; −0.08 |
| Age | 0.01 | ≈0 | p = 0.001 * | 0.01; 0.01 |
| People trustworthiness | ||||
| Mostly careful | - | - | - | - |
| Careful | 0.10 | 0.06 | p = 0.084 | −0.01; 0.21 |
| Neutral position | 0.38 | 0.06 | p < 0.001 * | 0.27; 0.49 |
| Confident | 0.60 | 0.08 | p < 0.001 * | 0.45; 0.74 |
| Mostly confident | 0.35 | 0.14 | p = 0.011 * | −0.08; 0.63 |
| People helpfulness | ||||
| Mostly looking for themselves | - | - | - | - |
| Looking for themselves | 0.31 | 0.06 | p < 0.001 * | 0.19; 0.44 |
| Neutral position | 0.62 | 0.06 | p < 0.001 * | 0.49; 0.74 |
| Helpful | 0.84 | 0.08 | p < 0.001 * | 0.68; 1.00 |
| Mostly helpful | 1.18 | 0.15 | p < 0.001 * | 0.89; 1.47 |
| Trust in politicians | ||||
| Mostly untrustworthy | - | - | - | - |
| Untrustworthy | 0.27 | 0.05 | p < 0.001 * | 0.18; 0.36 |
| Neutral position | 0.69 | 0.05 | p < 0.001 * | 0.59; 0.79 |
| Trustworthy | 1.07 | 0.11 | p < 0.001 * | 0.84; 1.30 |
| Mostly trustworthy | 1.54 | 0.30 | p < 0.001 * | 0.95; 2.13 |
| Trust in the legal system | ||||
| Mostly untrustworthy | - | - | - | - |
| Untrustworthy | 0.28 | 0.06 | p < 0.001 * | 0.17; 0.39 |
| Neutral position | 0.69 | 0.06 | p < 0.001 * | 0.58; 0.80 |
| Trustworthy | 1.00 | 0.07 | p < 0.001 * | 0.86; 1.14 |
| Mostly trustworthy | 1.51 | 0.13 | p < 0.001 * | 1.10; 1.61 |
| Stratification | ||||
| 2002–2010 | - | - | - | - |
| 2012–2018 | 0.72 | 0.04 | p < 0.001 * | 0.65; 0.79 |
| Predictors | 2002–2010 R2 = 0.036; F = 93.41 (p < 0.001) | 2012–2018 R2 = 0.018; F = 26.20 (p < 0.001) | ||||||
|---|---|---|---|---|---|---|---|---|
| β | SE | p | 95% CI | β | SE | p | 95% CI | |
| Socio-Demographic Characteristics Female (0 = male) | −0.07 | 0.04 | p = 0.109 | −0.16; 0.02 | −0.22 | 0.07 | p = 0.001 * | −0.36; −0.09 |
| Age | ≈0 | ≈0 | p = 0.209 | 0.00; 0.01 | 0.01 | ≈0 | p < 0.001 * | 0.01; 0.01 |
| Education (0 = low education) | ||||||||
| Not possible to harmonize ES-ISCED | - | - | - | - | No data available | |||
| Less than/lower secondary education | 0.97 | 0.05 | p < 0.001 * | 0.88; 1.07 | - | - | - | - |
| Secondary education | 0.78 | 0.09 | p < 0.001 * | 0.61; 0.95 | 0.20 | 0.09 | p = 0.025 * | 0.03; 0.37 |
| Tertiary education | 0.99 | 0.10 | p < 0.001 * | 0.78; 1.19 | 0.51 | 0.10 | p < 0.001 * | 0.32; 0.70 |
| Health Status Subjective general health | ||||||||
| Good/Very good | - | - | - | - | - | - | - | - |
| Fair | −0.15 | 0.05 | p = 0.005 * | −0.25; −0.04 | −0.17 | 0.08 | p = 0.034 * | −0.32; −0.13 |
| Bad/Very bad | −0.45 | 0.07 | p < 0.001 * | −0.59; −0.30 | −0.88 | 0.12 | p < 0.001 * | −1.11; −0.65 |
| Predictors | β | SE | p | 95% CI |
|---|---|---|---|---|
| Socio-Demographic Characteristics Female (0 = male) | −0.12 | 0.04 | p = 0.001 * | −0.20; −0.04 |
| Age | 0.01 | ≈0 | p < 0.001 * | 0.01; 0.01 |
| Education (0 = low education) | ||||
| Not possible to harmonize ES-ISCED | - | - | - | - |
| Less than/lower secondary education | 0.90 | 0.05 | p < 0.001 * | 0.80; 0.99 |
| Secondary education | 0.92 | 0.07 | p < 0.001 * | 0.79; 1.05 |
| Tertiary education | 1.21 | 0.08 | p < 0.001 * | 1.06; 1.36 |
| Health Status Subjective general health | ||||
| Good/Very good | - | - | - | - |
| Fair | −0.16 | 0.04 | p < 0.001 * | −0.25; −0.07 |
| Bad/Very bad | −0.59 | 0.06 | p < 0.001 * | −0.72; −0.47 |
| Stratification | ||||
| 2002–2010 | - | - | - | - |
| 2012–2018 | 0.13 | 0.05 | p = 0.004 * | 0.04; 0.22 |
Publisher’s Note: MDPI stays neutral with regard to jurisdictional claims in published maps and institutional affiliations. |
© 2021 by the author. Licensee MDPI, Basel, Switzerland. This article is an open access article distributed under the terms and conditions of the Creative Commons Attribution (CC BY) license (http://creativecommons.org/licenses/by/4.0/).
Share and Cite
Asensio, M. The Political Legitimacy of the Healthcare System in Portugal: Insights from the European Social Survey. Healthcare 2021, 9, 202. https://doi.org/10.3390/healthcare9020202
Asensio M. The Political Legitimacy of the Healthcare System in Portugal: Insights from the European Social Survey. Healthcare. 2021; 9(2):202. https://doi.org/10.3390/healthcare9020202
Chicago/Turabian StyleAsensio, Maria. 2021. "The Political Legitimacy of the Healthcare System in Portugal: Insights from the European Social Survey" Healthcare 9, no. 2: 202. https://doi.org/10.3390/healthcare9020202
APA StyleAsensio, M. (2021). The Political Legitimacy of the Healthcare System in Portugal: Insights from the European Social Survey. Healthcare, 9(2), 202. https://doi.org/10.3390/healthcare9020202