Differential Diagnosis of Uterine Leiomyoma and Uterine Sarcoma Using Magnetic Resonance Images: A Literature Review

 , , ,
, , , 

Abstract
1. Introduction
2. MR Imaging Sequences Required for Evaluation
- T2-weighted images (T2WI) (sagittal, axial section)
- T1-weighted images (T1WI) (sagittal, axial section)
- Diffusion-weighted image (DWI) (sagittal or axial section) and apparent diffusion coefficient (ADC) map
- Optional: Gadolinium contrast-enhanced images including fat-suppression T1W1 and dynamic MRI
3. Procedures for the Interpretation of MR images
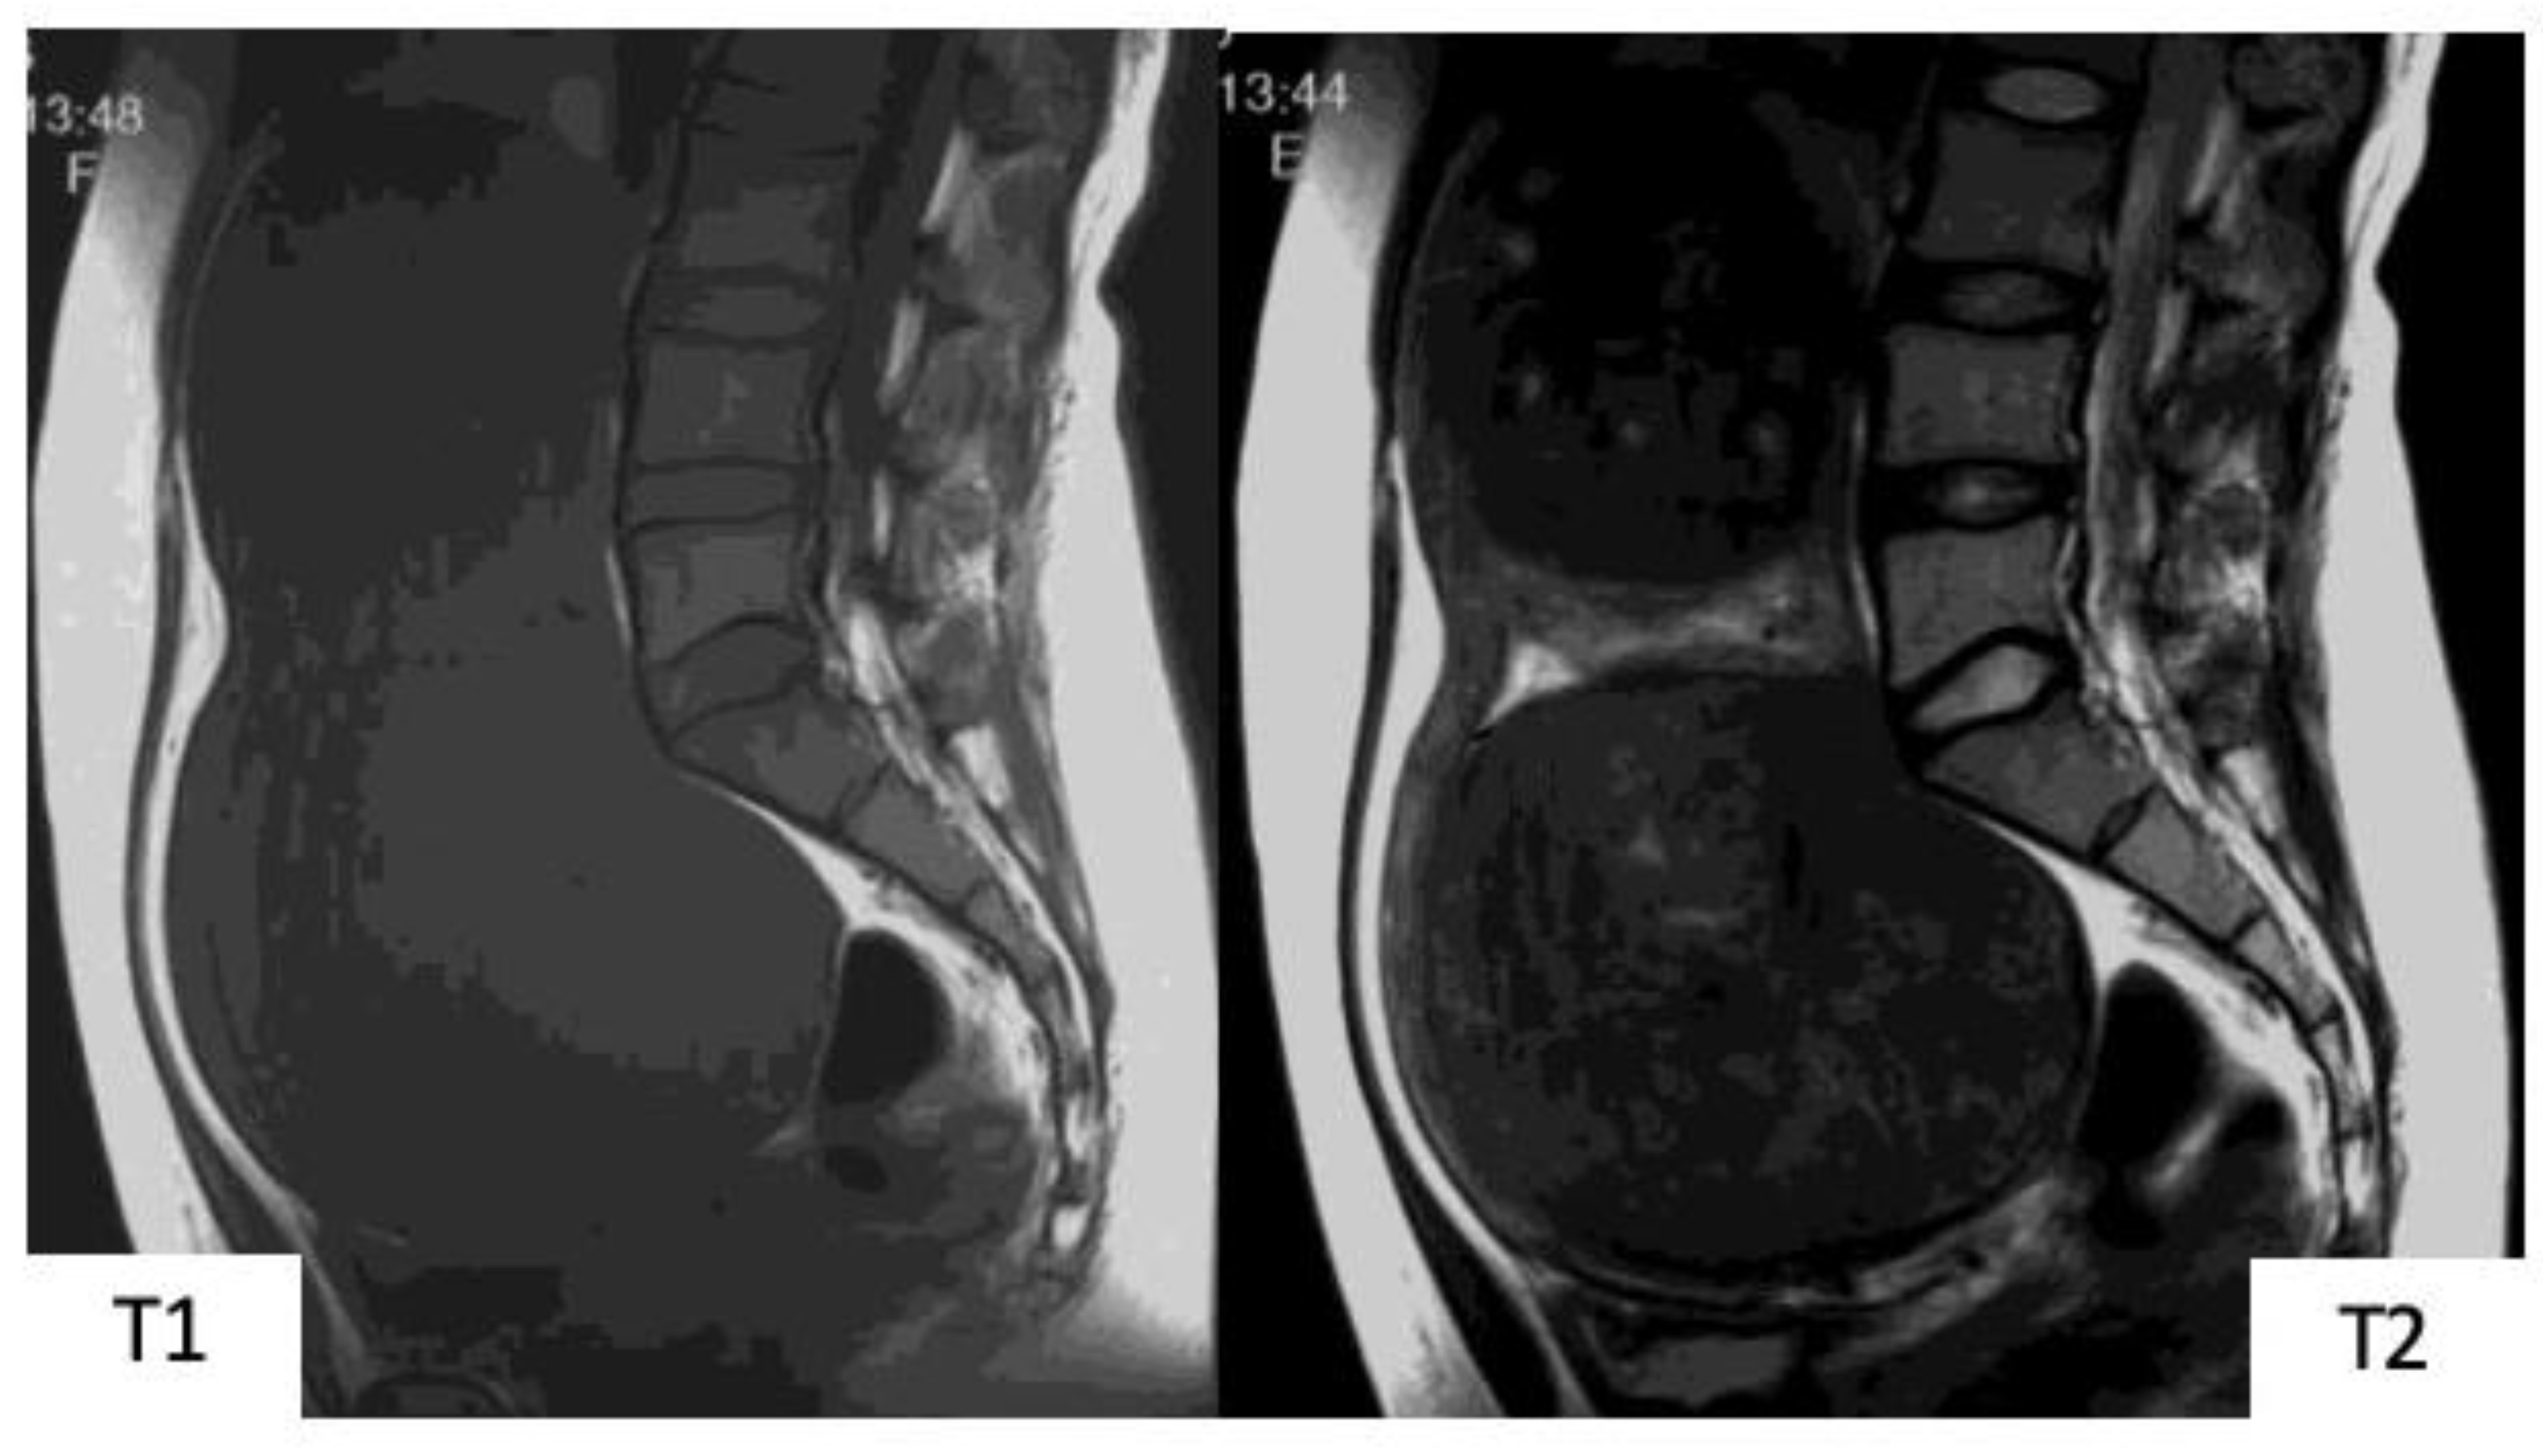
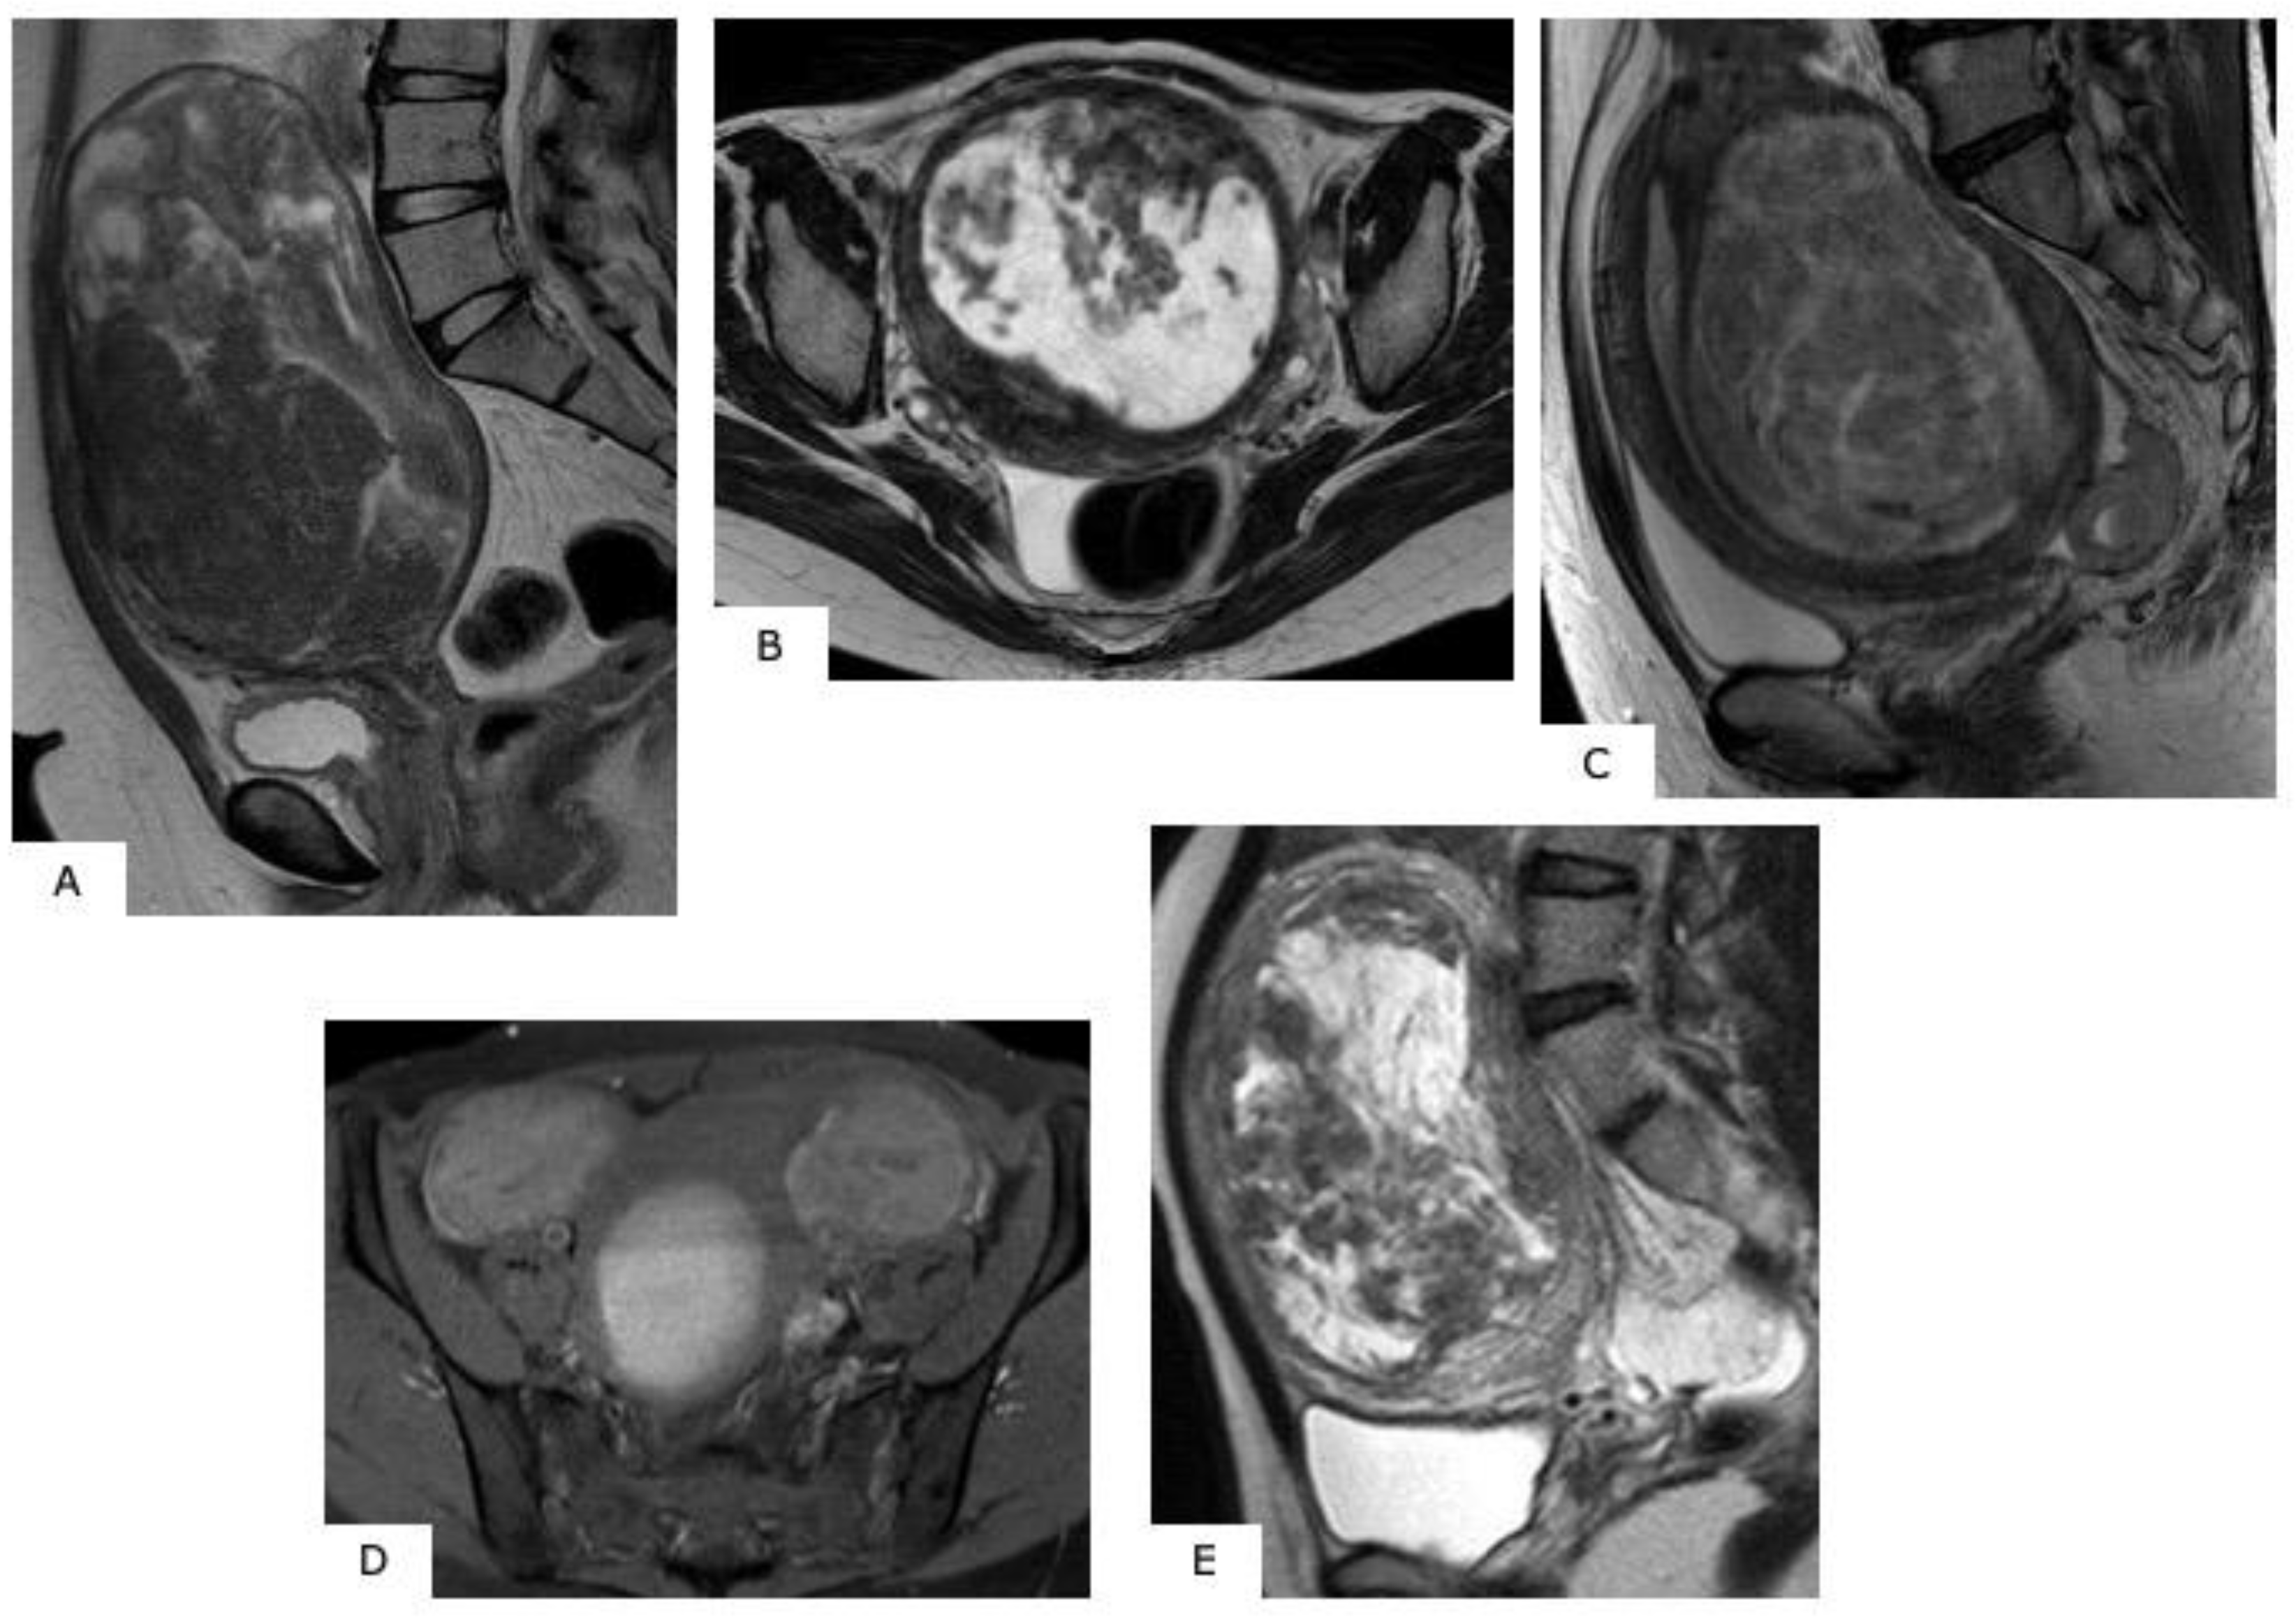
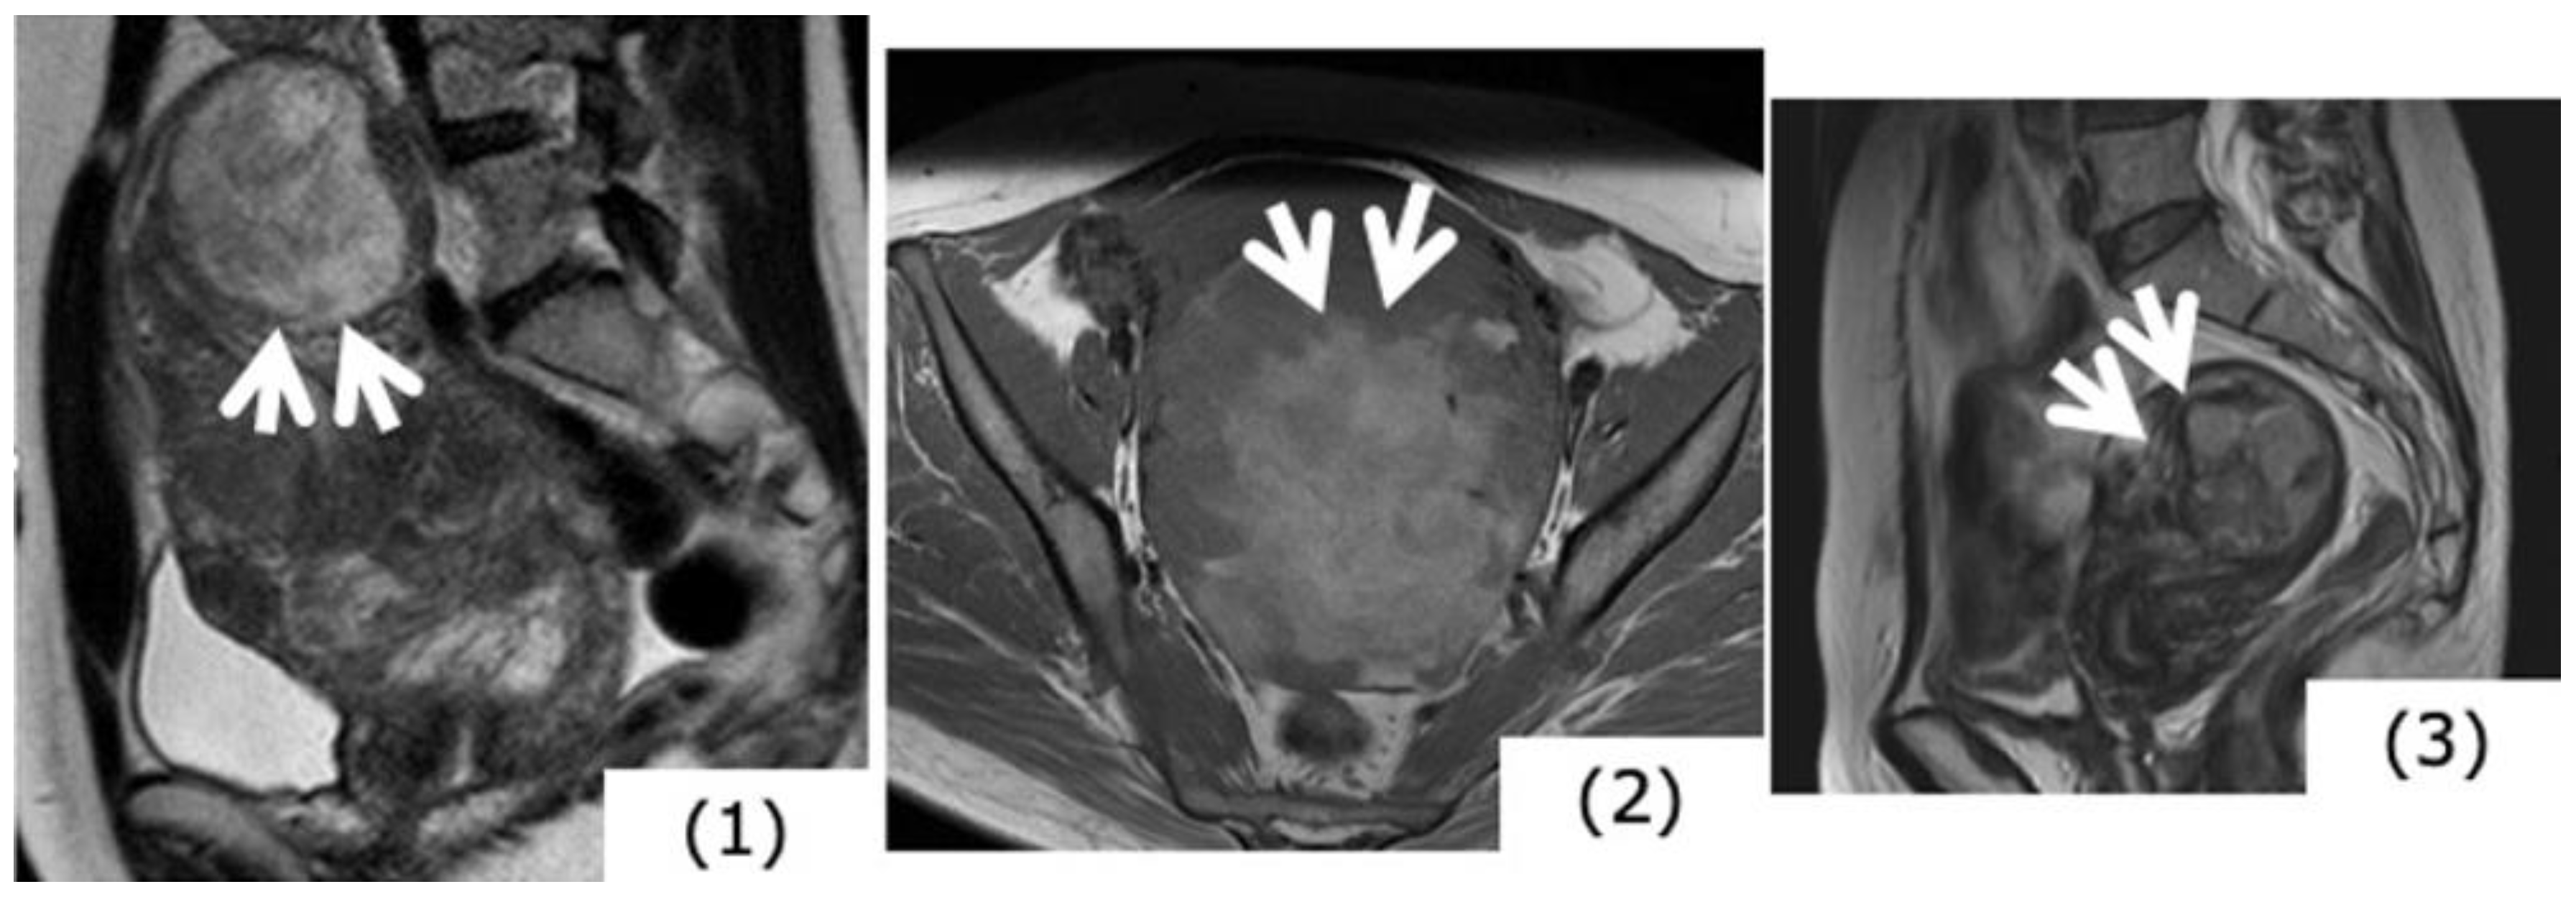
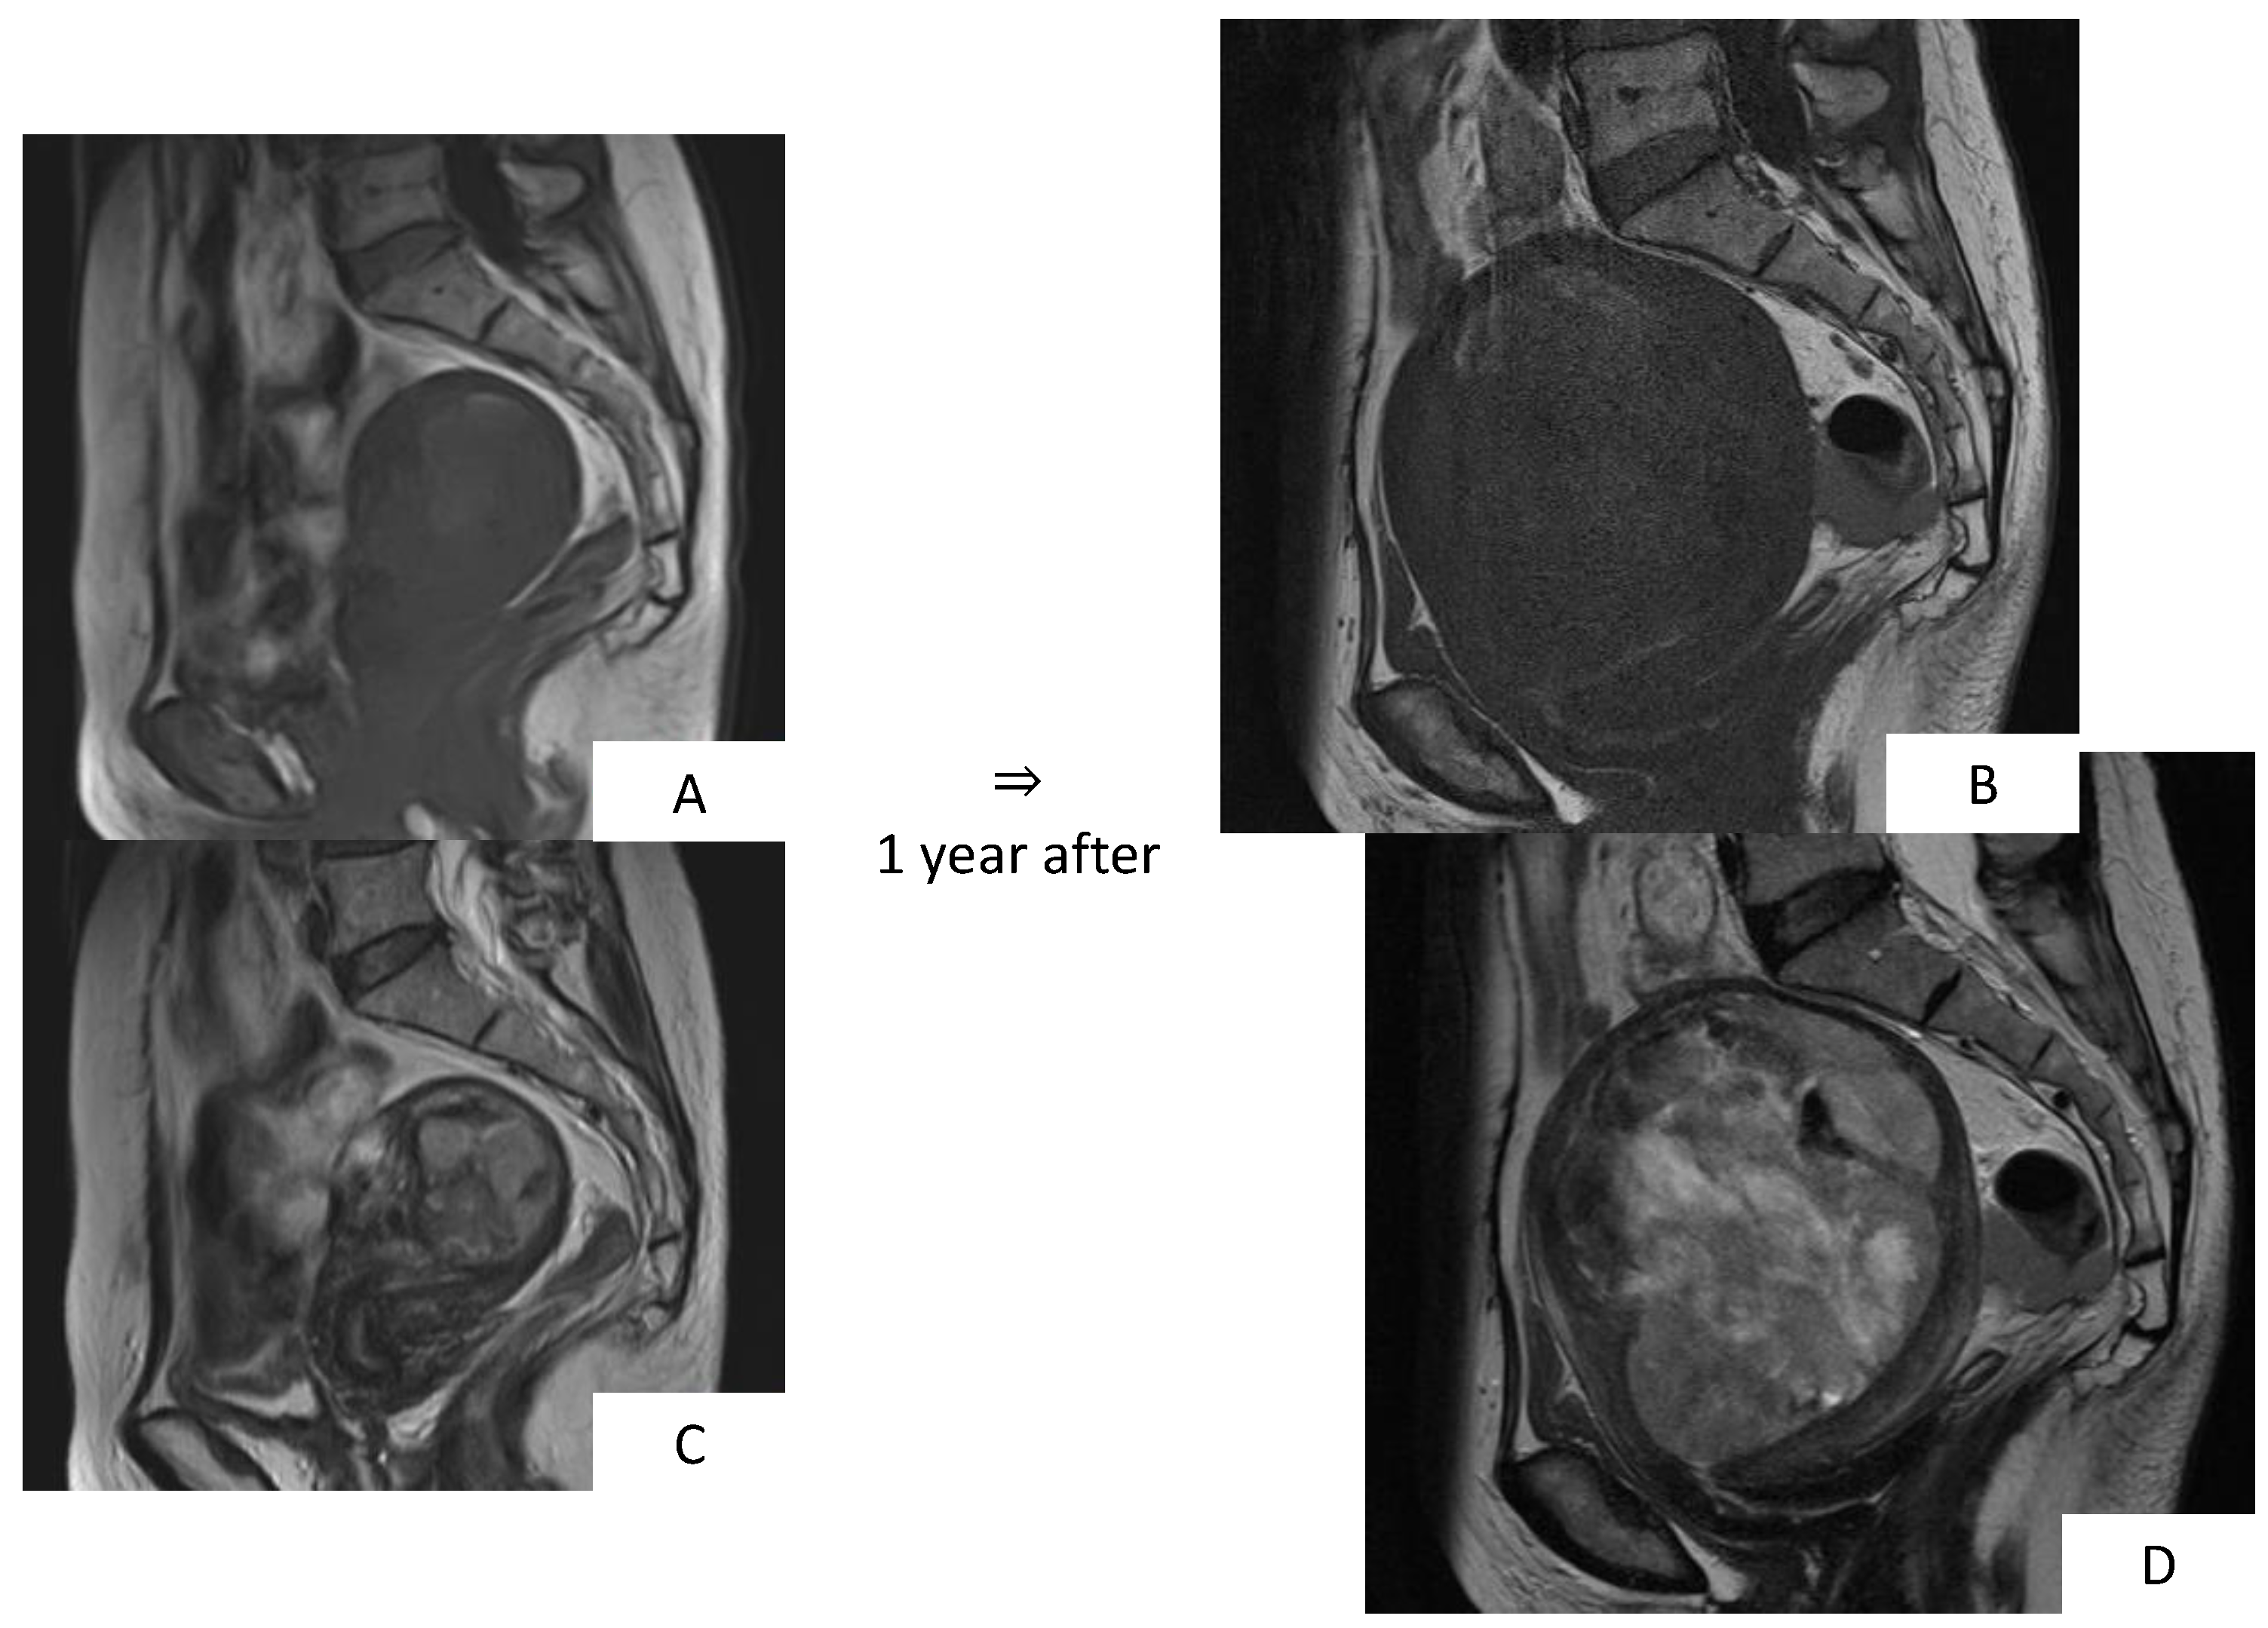
- In the T2WI, ascertain the mass signals. Are there mass signals in intermediate to high-signal areas? Typical uterine myoma is presented as low signals [3].
- In the T2WI, examine the mass borders. If the borders are ill-defined, this suggests infiltrative growth into the periphery, and sarcoma is suspected [3].
- Ascertain the contrast effect of the mass. While sarcoma shows a strong contrast effect from an early stage, in some cases, the contrast effect is insufficient, with an area presumed to be necrosis [4].
4. Modality of Evaluation Images
5. MR Image Findings
6. MR Images of Uterine Sarcoma
6.1. Characteristic MR Image Findings for Uterine Sarcoma
6.2. Leiomyosarcoma
6.3. Endometrial Stromal Sarcoma (ESS)
7. Differentiating between Uterine Myoma and Sarcoma
8. Update on Differential Diagnosis of Uterine Myoma and Sarcoma
9. Conclusions
Author Contributions
Funding
Conflicts of Interest
References
- Van den Bosch, T.; Coosemans, A.; Morina, M.; Timmerman, D.; Amant, F. Screening for uterine tumours. Best Pract. Res. Clin. Obstet. Gynaecol. 2012, 26, 257–266. [Google Scholar] [CrossRef] [PubMed]
- Koivisto-Korander, R.; Butzow, R.; Koivisto, A.M.; Leminen, A. Clinical outcome and prognostic factors in 100 cases of uterine sarcoma: Experience in Helsinki University Central Hospital 1990–2001. Gynecol. Oncol. 2008, 111, 74–81. [Google Scholar] [CrossRef] [PubMed]
- Barral, M.; Placé, V.; Dautry, R.; Bendavid, S.; Cornelis, F.; Foucher, R.; Guerrache, Y.; Soyer, P. Magnetic resonance imaging features of uterine sarcoma and mimickers. Abdom. Radiol. 2017, 42, 1762–1772. [Google Scholar] [CrossRef] [PubMed]
- Santos, P.; Cunha, T.M. Uterine sarcomas: Clinical presentation and MRI features. Diagn. Interv. Radiol. 2015, 21, 4–9. [Google Scholar] [CrossRef]
- Bonneau, C.; Thomassin-Naggara, I.; Dechoux, S.; Cortez, A.; Darai, E.; Rouzier, R. Value of ultrasonography and magnetic resonance imaging for the characterization of uterine mesenchymal tumors. Acta Obstet. Gynecol. Scand. 2014, 93, 261–268. [Google Scholar] [CrossRef]
- Amant, F.; Floquet, A.; Friedlander, M.; Kristensen, G.; Mahner, S.; Nam, E.J.; Powell, M.A.; Ray-Coquard, I.; Siddiqui, N.; Sykes, P.; et al. Gynecologic Cancer InterGroup (GCIG) consensus review for endometrial stromal sarcoma. Int. J. Gynecol. Cancer 2014, 4, S67–S72. [Google Scholar] [CrossRef]
- Conklin, C.M.; Longacre, T.A. Endometrial stromal tumors: The new WHO classification. Adv. Anat. Pathol. 2014, 21, 383–393. [Google Scholar] [CrossRef]
- Ali, R.H.; Rouzbahman, M. Endometrial stromal tumours revisited: An update based on the 2014 WHO classification. J. Clin. Pathol. 2015, 68, 325–332. [Google Scholar] [CrossRef]
- Huang, Y.T.; Huang, Y.L.; Ng, K.K.; Lin, G. Current Status of Magnetic Resonance Imaging in Patients with Malignant Uterine Neoplasms: A Review. Korean J. Radiol. 2019, 20, 18–33. [Google Scholar] [CrossRef]
- Sahdev, A.; Sohaib, S.A.; Jacobs, I.; Shepherd, J.H.; Oram, D.H.; Reznek, R.H. MR imaging of uterine sarcomas. AJR Am. J. Roentgenol. 2001, 177, 1307–1311. [Google Scholar] [CrossRef] [PubMed]
- Ueda, M.; Otsuka, M.; Hatakenaka, M.; Torii, Y. Uterine endometrial stromal sarcoma located in uterine myometrium: MRI appearance. Eur. Radiol. 2000, 10, 780–782. [Google Scholar] [CrossRef] [PubMed]
- Goto, A.; Takeuchi, S.; Sugimura, K.; Maruo, T. Usefulness of Gd-DTPA contrast-enhanced dynamic MRI and serum determination of LDH and its isozymes in the differential diagnosis of leiomyosarcoma from degenerated leiomyoma of the uterus. Int. J. Gynecol. Cancer 2002, 12, 354–361. [Google Scholar] [CrossRef] [PubMed]
- Namimoto, T.; Yamashita, Y.; Awai, K.; Nakaura, T.; Yanaga, Y.; Hirai, T.; Saito, T.; Katabuchi, H. Combined use of T2-weighted and diffusion-weighted 3-T MR imaging for differentiating uterine sarcomas from benign leiomyomas. Eur. Radiol. 2009, 19, 2756–2764. [Google Scholar] [CrossRef] [PubMed]
- Tamai, K.; Koyama, T.; Saga, T.; Morisawa, N.; Fujimoto, K.; Mikami, Y.; Togashi, K. The utility of diffusion-weighted MR imaging for differentiating uterine sarcomas from benign leiomyomas. Eur. Radiol. 2008, 18, 723–730. [Google Scholar] [CrossRef]
- Thomassin-Naggara, I.; Dechoux, S.; Bonneau, C.; Morel, A.; Rouzier, R.; Carette, M.F.; Daraï, E.; Bazot, M. How to differentiate benign from malignant myometrial tumours using MR imaging. Eur. Radiol. 2013, 23, 2306–2314. [Google Scholar] [CrossRef]
- Sato, K.; Yuasa, N.; Fujita, M.; Fukushima, Y. Clinical application of diffusion-weighted imaging for preoperative differentiation between uterine leiomyoma and leiomyosarcoma. Am. J. Obstet. Gynecol. 2014, 210, 368.e1–368.e8. [Google Scholar] [CrossRef]
- Lin, G.; Yang, L.Y.; Huang, Y.T.; Ng, K.K.; Ng, S.H.; Ueng, S.H.; Chao, A.; Yen, T.C.; Chang, T.C.; Lai, C.H. Comparison of the diagnostic accuracy of contrast-enhanced MRI and diffusion-weighted MRI in the differentiation between uterine leiomyosarcoma/smooth muscle tumor with uncertain malignant potential and benign leiomyoma. J. Magn. Reson. Imaging 2015, 43, 333–342. [Google Scholar] [CrossRef]
- Gaetke-Udager, K.; McLean, K.; Sciallis, A.P.; Alves, T.; Maturen, K.E.; Mervak, B.M.; Moore, A.G.; Wasnik, A.P.; Erba, J. Davenport MS. Diagnostic Accuracy of Ultrasound, Contrast-enhanced CT, and Conventional MRI for Differentiating Leiomyoma from Leiomyosarcoma. Acad. Radiol. 2016, 23, 1290–1297. [Google Scholar] [CrossRef]
- Li, H.M.; Liu, J.; Qiang, J.W.; Zhang, H.; Zhang, G.F.; Ma, F. Diffusion-Weighted Imaging for Differentiating Uterine Leiomyosarcoma From Degenerated Leiomyoma. J. Comput. Assist. Tomogr. 2017, 41, 599–606. [Google Scholar] [CrossRef]
- Bi, Q.; Xiao, Z.; Lv, F.; Liu, Y.; Zou, C.; Shen, Y. Utility of Clinical Parameters and Multiparametric MRI as Predictive Factors for Differentiating Uterine Sarcoma from Atypical Leiomyoma. Acad. Radiol. 2018, 25, 993–1002. [Google Scholar] [CrossRef]
- DeMulder, D.; Ascher, S.M. Uterine Leiomyosarcoma: Can MRI Differentiate Leiomyosarcoma From Benign Leiomyoma Before Treatment? AJR Am. J. Roentgenol. 2018, 211, 1405–1415. [Google Scholar] [CrossRef] [PubMed]
- Kaganov, H.; Ades, A.; Fraser, D.S. Preoperative magnetic resonance imaging diagnostic features of uterine leiomyosarcomas: A systematic review. Int. J. Technol. Assess Health Care 2018, 34, 172–179. [Google Scholar] [CrossRef] [PubMed]
- Nagai, T.; Takai, Y.; Akahori, T.; Ishida, H.; Hanaoka, T.; Uotani, T.; Sato, S.; Matsunaga, S.; Baba, K.; Seki, H. Novel uterine sarcoma preoperative diagnosis score predicts the need for surgery in patients presenting with a uterine mass. Springerplus 2014, 3, 678. [Google Scholar] [CrossRef] [PubMed]
- Nagai, T.; Takai, Y.; Akahori, T.; Ishida, H.; Hanaoka, T.; Uotani, T.; Sato, S.; Matsunaga, S.; Baba, K.; Seki, H. Highly improved accuracy of the revised PREoperative sarcoma score (rPRESS) in the decision of performing surgery for patients presenting with a uterine mass. Springerplus 2015, 4, 520. [Google Scholar] [CrossRef] [PubMed]


| Ordinary Leiomyoma | Degenerated Leiomyoma | Cellular Leiomyoma | Leiomyosarcoma | |
|---|---|---|---|---|
| Number | Multiple | Multiple | Multiple | Single |
| Well-Delinecated Margins | Yes | Yes | Yes | − |
| Endometrial Thinkening | No | – | − | Yes |
| Ascites | – | – | – | Yes |
| T2-Weighted Images | Hypointense | Hypo or Hyper Intense (Depending on the Type of Degeneration) | Intermediate Hypersignal | Hyperintense |
| T1-Weighted Images | Isosignal | Hypo or Hyper Intense (Depending on the Type of Degeneration) | Inosignal | Hypersignal |
| Diffusion-Weighted Images | Isosignal | Isosignal | Hypersignal | Hypersignal |
| ADC value <1.23 × 10⁻³ mm2/s | – | – | + | + |
| T1-Weighted Post-Gadolinium Chelate | Hypovascular heterogeneous | Hypovascular Heterogeneous | Homogeneous Progressive Filling-In | Early Heterogenous progressive fillng-in |
© 2019 by the authors. Licensee MDPI, Basel, Switzerland. This article is an open access article distributed under the terms and conditions of the Creative Commons Attribution (CC BY) license (http://creativecommons.org/licenses/by/4.0/).
Share and Cite
Suzuki, A.; Aoki, M.; Miyagawa, C.; Murakami, K.; Takaya, H.; Kotani, Y.; Nakai, H.; Matsumura, N. Differential Diagnosis of Uterine Leiomyoma and Uterine Sarcoma Using Magnetic Resonance Images: A Literature Review. Healthcare 2019, 7, 158. https://doi.org/10.3390/healthcare7040158
Suzuki A, Aoki M, Miyagawa C, Murakami K, Takaya H, Kotani Y, Nakai H, Matsumura N. Differential Diagnosis of Uterine Leiomyoma and Uterine Sarcoma Using Magnetic Resonance Images: A Literature Review. Healthcare. 2019; 7(4):158. https://doi.org/10.3390/healthcare7040158
Chicago/Turabian StyleSuzuki, Ayako, Masato Aoki, Chiho Miyagawa, Kosuke Murakami, Hisamitsu Takaya, Yasushi Kotani, Hidekatsu Nakai, and Noriomi Matsumura. 2019. "Differential Diagnosis of Uterine Leiomyoma and Uterine Sarcoma Using Magnetic Resonance Images: A Literature Review" Healthcare 7, no. 4: 158. https://doi.org/10.3390/healthcare7040158
APA StyleSuzuki, A., Aoki, M., Miyagawa, C., Murakami, K., Takaya, H., Kotani, Y., Nakai, H., & Matsumura, N. (2019). Differential Diagnosis of Uterine Leiomyoma and Uterine Sarcoma Using Magnetic Resonance Images: A Literature Review. Healthcare, 7(4), 158. https://doi.org/10.3390/healthcare7040158