AR-Therapist: Design and Simulation of an AR-Game Environment as a CBT for Patients with ADHD


Abstract
:1. Introduction
2. Literature Review
3. AR-Therapist: Generic Design
3.1. A Game Pipeline
- Treatment is the whole treatment system (i.e., AR-Therapist). Its profile is a tuple of:
- Patient: Each patient will have his/her own profile. The profile has to be complete for the patient to join the treatment program.
- Doctor: Each doctor will have his/her own profile.
- Game: The game has to be defined by the doctor considering patients current mental state and the disorder severity.
- : Players will go through a treatment program following a predefined.
- treatment plan that includes playing an AR-based game consisting of a set of levels.
- Patient:
- ID: is a short identification as a name or a referral number used by the doctor to define a patient.
- Level: The level to where the patient has arrived in the treatment plan.
- : The current value of performance the patient has achieved throughout the game.
- : The set of predefined preferences for a patient considering other psychological disorders that may affect current design and methodology of the treatment plan.
- Doctor:
- ID: The doctor has to have his/her own profile that is different from other therapists or psychological centers. This will give the doctor an access to the patient profiles and progress reports to allow for further evaluations.
- Experience: Experience level of the doctor is useful in allowing access to more complex/detailed data of the patients.
- Involvement: The level of engagement within the treatment process which allow the doctor to get involved in the game and in the reporting progress along the way of the patient assigned treatment.
- Game:
- : The type of the game to be played that has to be suitable for the patient. e.g., drag-and-drop and multiple-choices.
- : The game consists of a set of levels that have different levels of complexity.
- Level:
- : Maximum set of objects used in this level.
- : A predefined maximum time for the whole level to be completed or abort otherwise.
- : Simple directional voice or instructions used for guidance in case of a remote following.
- Object:
- : The structure of an object has to be predefined beforehand the start of a session.
- : The size of an object will depend on the location and closeness from the player focal point.
- : The initial distribution of objects around the real environment.
- : The appearance of one object after another.
- Treatment-Program:
- : The set of game session to complete the treatment program.
- : The performance in one session reports the correct, incorrect and uncompleted tried the patient has gone through in one session.
- : The maximum treatment time for the whole treatment program, e.g., 20 min to complete the treatment.
- Game-session:
- : The game level has to be defined beforehand. The initial level is defined in the patient profile and player can move from one level to another asynchronously depending on his/her achievement in the session and then the patient profile is updated.
- : To count the response time for the patients.
- : To track current location of the patient for measuring closeness from objects within a session.
- : The repetition of tries within one session to include correct, incorrect and uncompleted tries. e.g., the number of collected target objects the patient has correctly collected in one session.
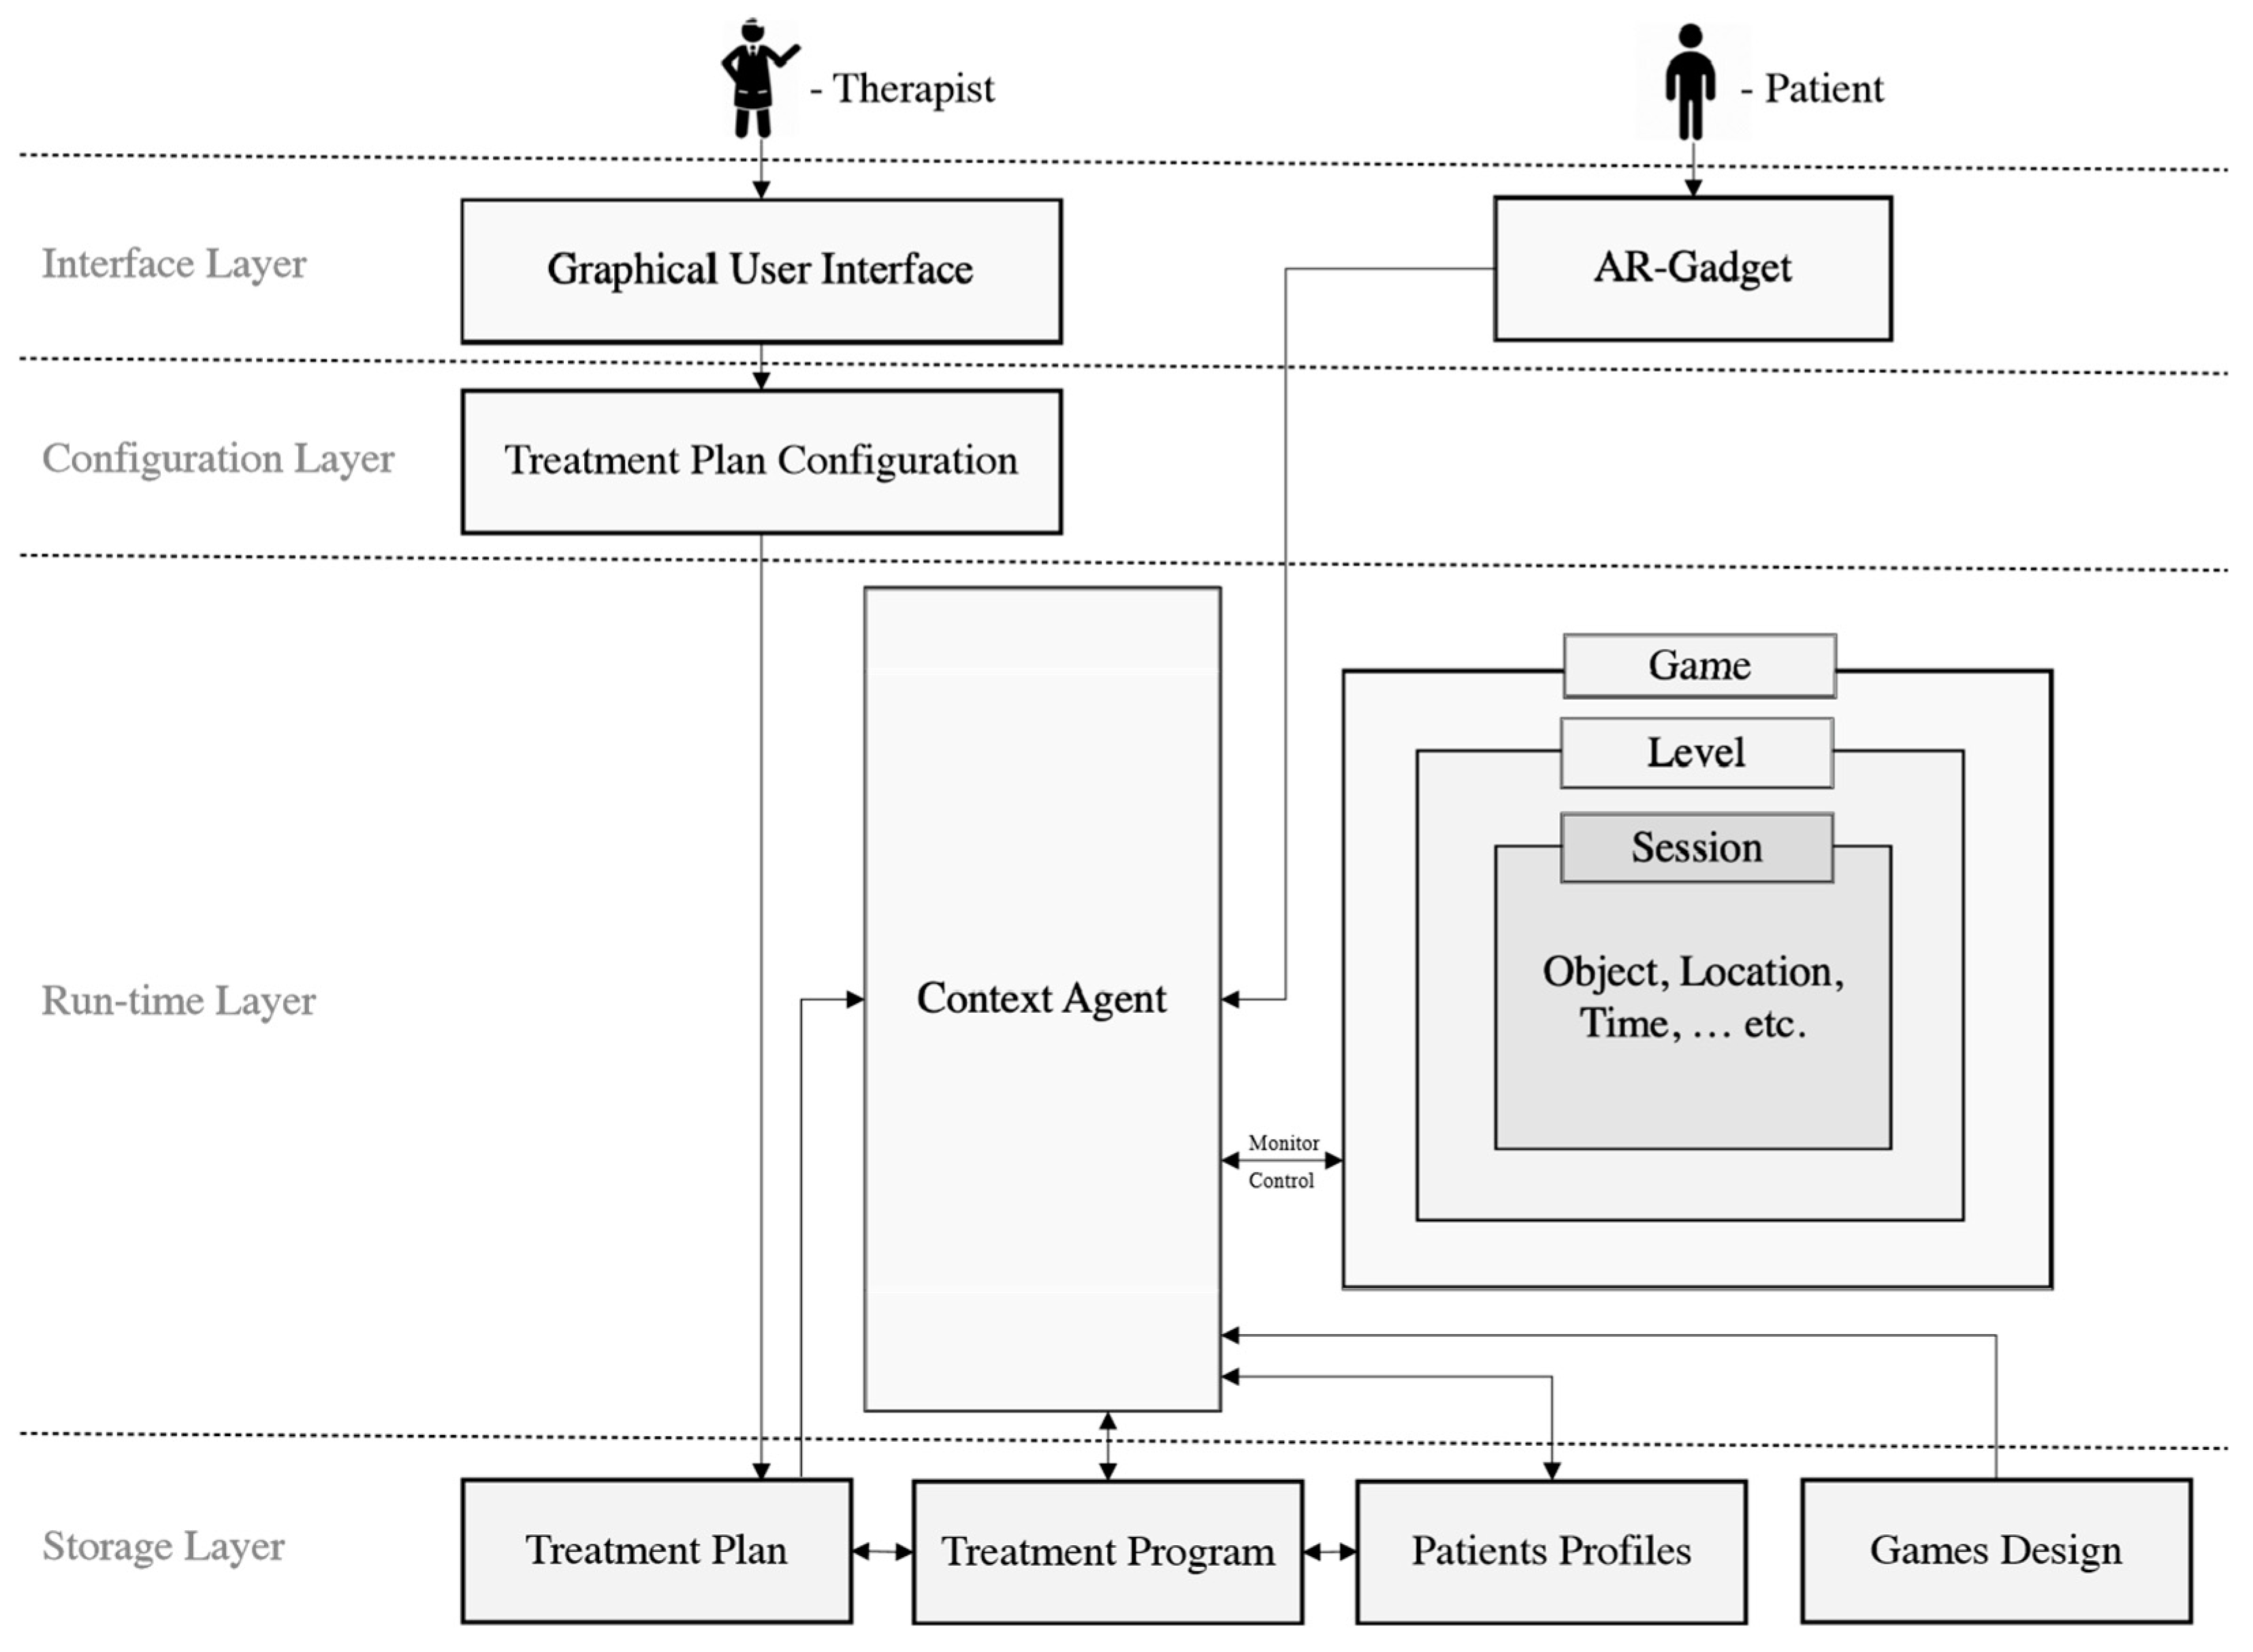
3.2. General Conceptual Model
- The interface layer contains the interfaces used for accessing other layers. For instance, doctor can use a user-friendly interface to configure the treatment plan, whereas players interact with the game through Augmented Reality glasses.
- The Configuration layer consists of the “treatment plan configuration” component, where the doctor can add new treatment plan and configure the existence ones.
- The Run-time layer has the components that interact with the player while the game is running. These components are: The Context-Agent component and the Game component.
- -
- The Context Agent component retrieves the player treatment plan, and his/her performance in order to control the current game-session and guide the player based on the treatment plan. Furthermore, the context agent capable of monitoring all the player’s behaviors and interactions with the environment, logging “Ethically” the needed data, and calculating the player’s performance following the equations highlighted in Section 3. Thus, the agent gains a deeper understanding of the patient to enrich the AR-Therapist model based on appropriate reasoning techniques. This in turns can be utilized in the future for suggesting the most optimal treatment plan for new patient (e.g., when facing a “cold start issue”). In addition, logging the needed data and explaining them will reveal some hidden information which may help the ADHD community.
- -
- On the other hand, there is a persistent need for employing an intelligent agent capable of performing the tasks explained above since the AR-Therapist model is used by the patients with the aid of their families and under the doctors’ remote supervision (i.e., ambient assistant living “AAL”). Surveying the literature resulted in finding prior use of AAL such as in fall detection [24,25], and for monitoring elderly in their homes using video surveillance [26,27].
- -
- The game Component involves levels of game; each level has its own games-sessions, and each game-session in turns contains the appropriate difficulty level that characterizes the maximum game-session time, used objects, and their locations.
- The storage layer involves components which store data about the treatment-plan, treatment-program, player profile, and game levels and objects. Each component follows an appropriate common specification for structuring the related data. Thus, the system’s extensibility can be guaranteed as well as the integration with the existence e-health systems.
3.3. Performance Measures
- T: Number of tries in one session.
- C: Number of correct tries in one session.
- I: Number of incorrect tries (due to omission or commission errors) in one session.
- K: Number of uncompleted tries in one session.
- Correct Response Times (CRT): The percentage of measuring attention deficits for the time spent on the correct tries.
- Mean of the CRT (M): To compare with correct response time to make sure they follow opposite relation to one another.
- Standard deviation of the CRT (SD): Indicative of impulsive and hyperactive symptoms.
- Try time (): The maximum allowed time to complete one try within a session.
- Omission errors (OE): The absence of any response during a try period to be used to measure inattention.
- Commission errors (CE): The response to non-target stimuli which to be used to measure impulsivity.
- Engagement Factor (GF): It indicates the patient engagement level with the game.
- Inattention Factor (IAF): It represents the percentage of patient’s inattention.
- Impulsivity Factor (IMF): Indicative of percentage of the patient’s impulsivity observed in his/her behavior within a session.
- Error Factor (EF): It represents the percentage of the error rate during a session.
- Correct Response Factor (CRF): The percentage of the total correct response time relatively to maximum allowed time for all correct tries.
- Performance Index (PI): It reflects the single measure for the overall performance of the patient which depends on the correct response factor, error factor, and engagement factor.
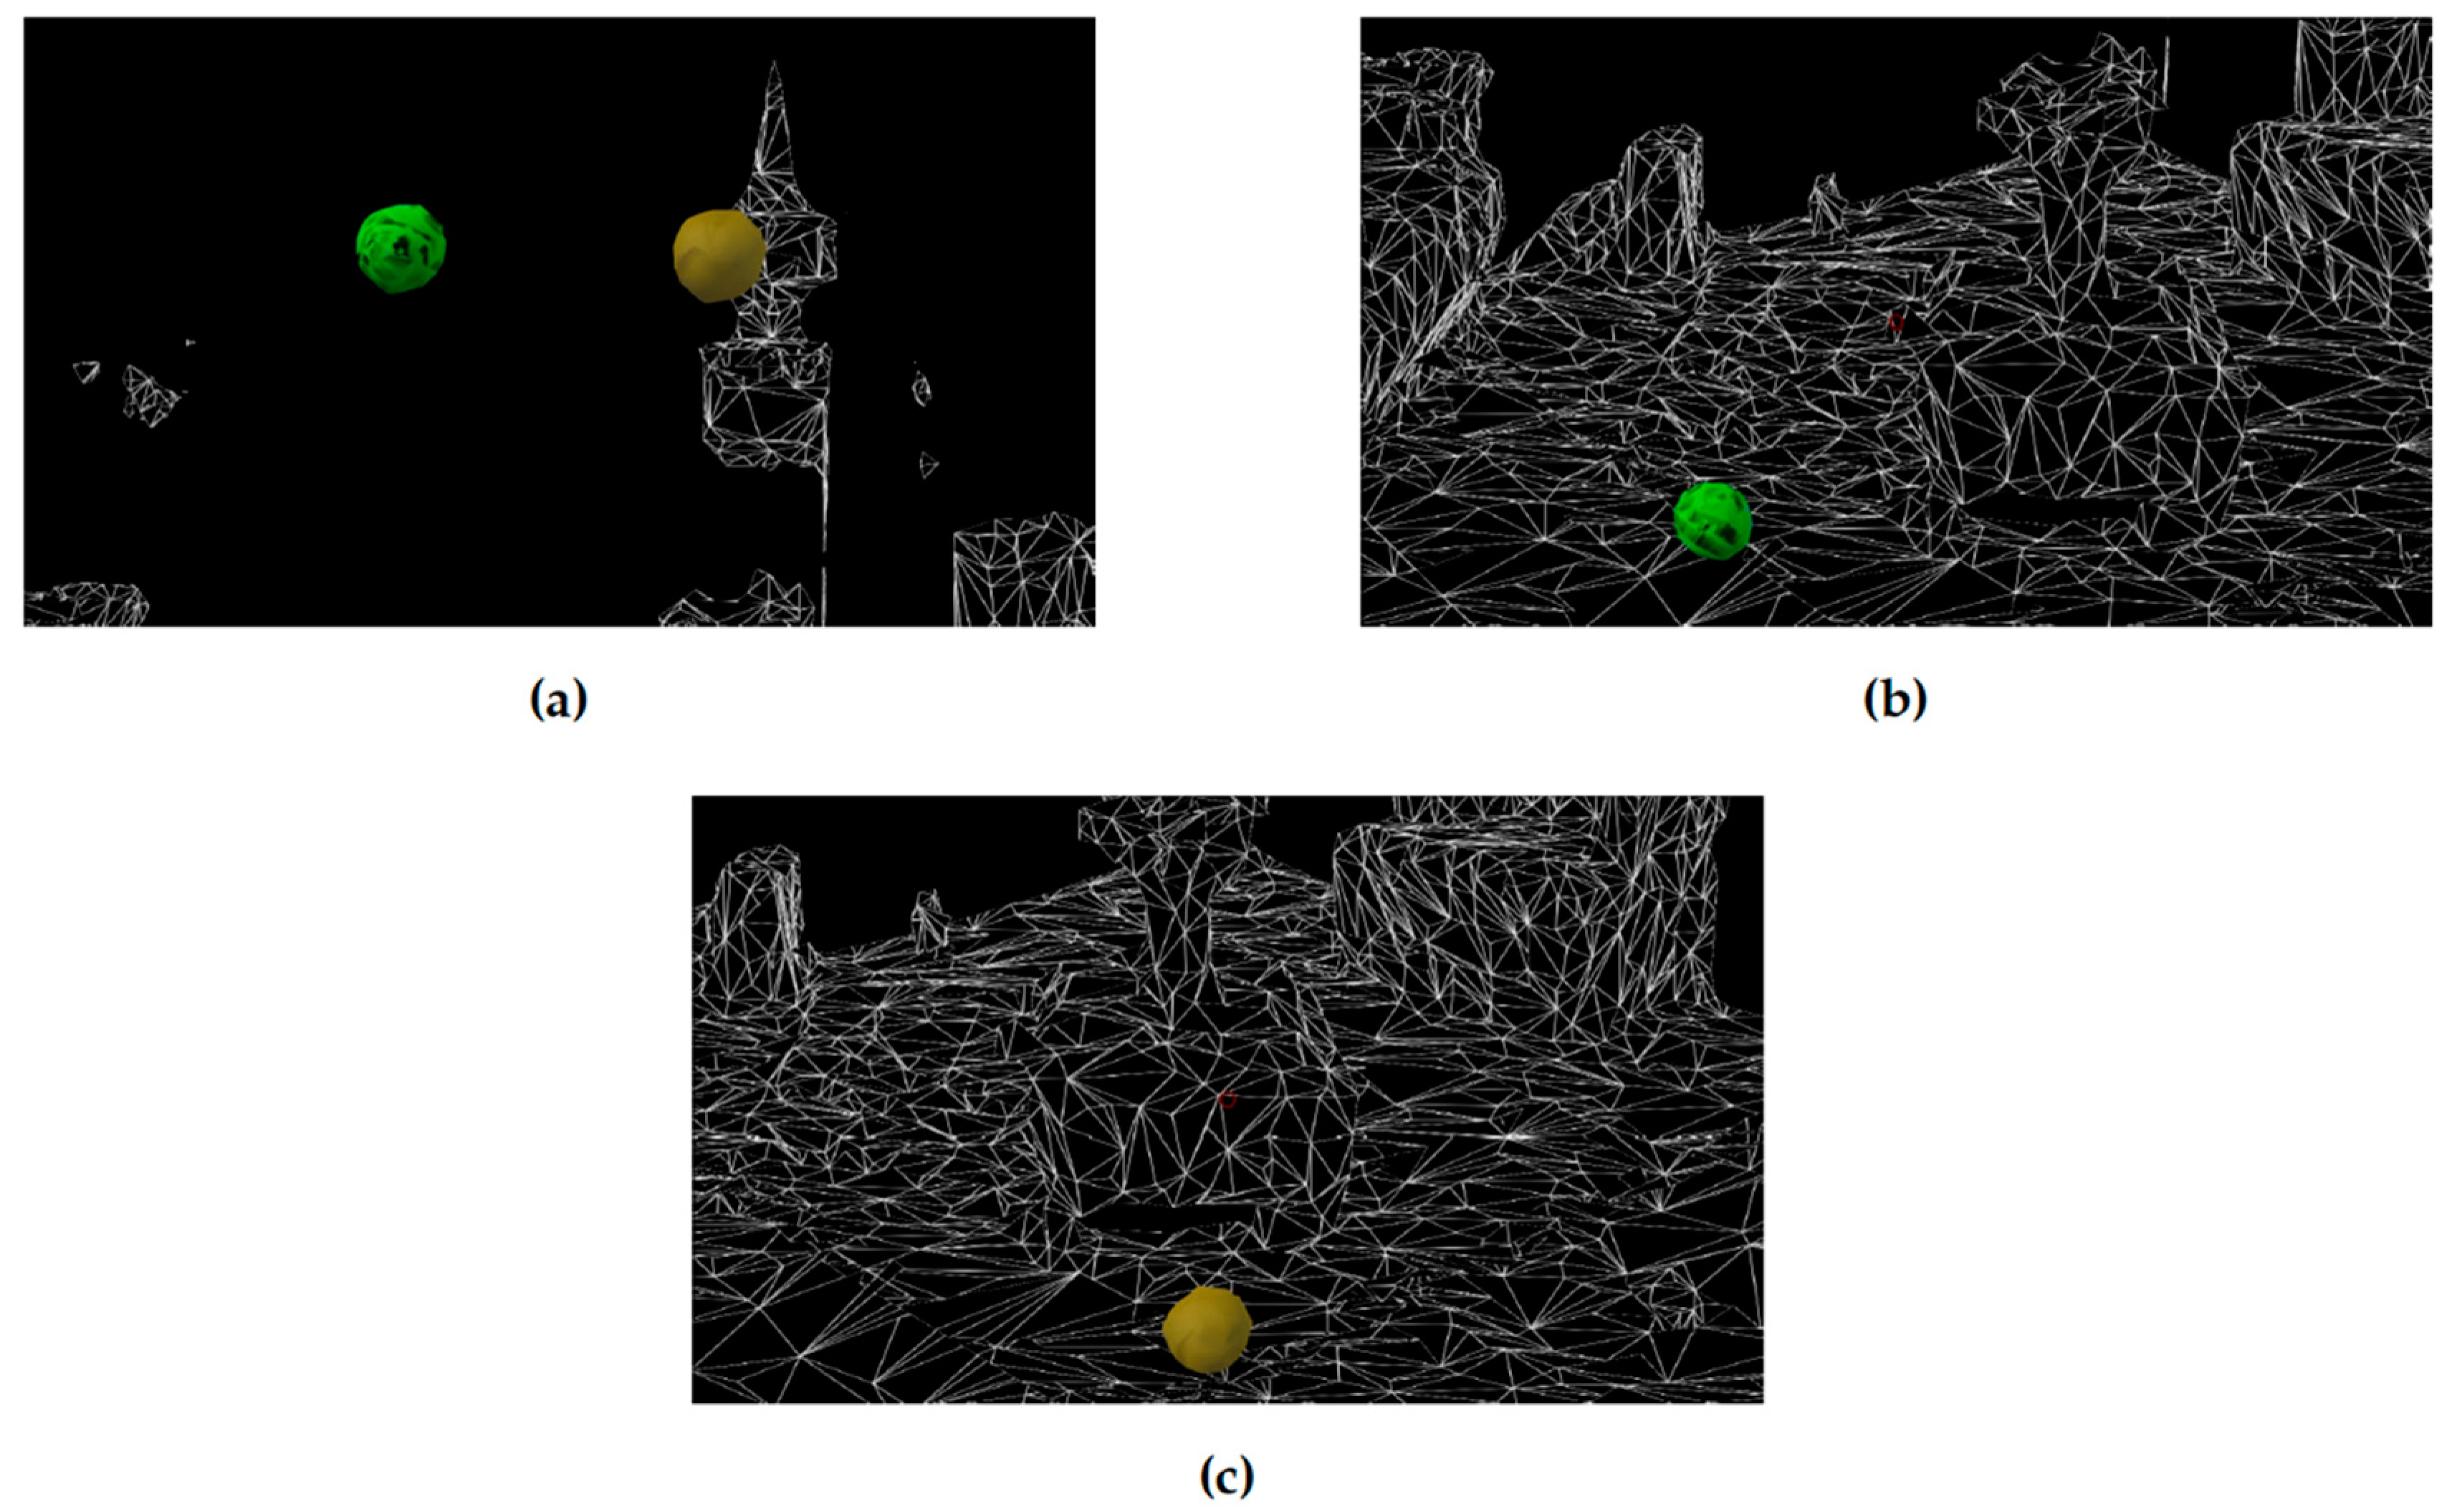
4. Implementation
- The child starts the game session.
- A brief explanation of the game is presented to the child along with an indication of the target ball.
- A timer is started to count 60 s of the first trial.
- The trial is ended in four situations. Firstly, if the child selected the target ball. Secondly, if s/he selected the non-target ball (commission error). Thirdly, the time is out, and s/he did not choose any ball (omission error). Finally, if s/he ends the game.
- The trial statistical data are recorded.
- If it is not the tenth trial or the game is not ended, the next trial begins.
- All performance parameters are calculated and recorded for further analysis.
5. Experimentation with a Case Study
6. Conclusions and Future Work
Author Contributions
Funding
Conflicts of Interest
References
- Barkley, R.A. The ecological validity of laboratory and analogue assessment methods of ADHD symptoms. J. Abnorm. Child Psychol. 1991, 19, 149–178. [Google Scholar] [CrossRef] [PubMed]
- Abikoff, H.; Courtney, M.; Pelham, W.E.; Koplewicz, H.S. Teachers’ ratings of disruptive behaviors: The influence of halo effects. J. Abnorm. Child Psychol. 1993, 21, 519–533. [Google Scholar] [CrossRef] [PubMed]
- Parsons, T.D.; Bowerly, T.; Buckwalter, J.G.; Rizzo, A.A. A controlled clinical comparison of attention performance in children with ADHD in a virtual reality classroom compared to standard neuropsychological methods. Child Neuropsychol. 2007, 13, 363–381. [Google Scholar] [CrossRef] [PubMed]
- Gorini, A.; Gaggioli, A.; Vigna, C.; Riva, G. A second life for eHealth: prospects for the use of 3-D virtual worlds in clinical psychology. J. Med. Int. Res. 2008, 10, e21. [Google Scholar] [CrossRef]
- Beard, L.; Wilson, K.; Morra, D.; Keelan, J. A survey of health-related activities on second life. J. Med. Int. Res. 2009, 11, e17. [Google Scholar] [CrossRef]
- Parsons, T.D.; Rizzo, A.A.; Rogers, S.; York, P. Virtual reality in paediatric rehabilitation: a review. Dev. Neurorehabilit. 2009, 12, 224–238. [Google Scholar] [CrossRef]
- Bickmore, T.W.; Mitchell, S.E.; Jack, B.W.; Paasche-Orlow, M.K.; Pfeifer, L.M.; O’Donnell, J. Response to a relational agent by hospital patients with depressive symptoms. Interact. Comput. 2010, 22, 289–298. [Google Scholar] [CrossRef]
- Meyerbröker, K.; Emmelkamp, P.M. Virtual reality exposure therapy in anxiety disorders: a systematic review of process-and-outcome studies. Depress. Anxiety 2010, 27, 933–944. [Google Scholar] [CrossRef]
- Azuma, R.T. A Survey of Augmented Reality. Presence Teleoperators Virtual Environ. 1997, 6, 355–385. [Google Scholar] [CrossRef]
- Burdea, G.C.; Coiffet, P. Virtual Reality Technology; John Wiley & Sons: Hoboken, NJ, USA, 2003. [Google Scholar]
- Billinghurst, M.; Clark, A.; Lee, G. A Survey of Augmented Reality. Found. Trends Hum. Comput. Interact. 2015, 8, 73–272. [Google Scholar] [CrossRef]
- Alqithami, S.; Alzahrani, M.; Alzahrani, A.; Ahmed, Y. Modeling an Augmented Reality Game Environment to Enhance Behavior of ADHD Patients. In Proceedings of the 12th International Conference on Brain Informatics, Hainan, China, 13–15 December 2019. in press. [Google Scholar]
- Biederman, J. Attention-deficit/hyperactivity disorder: a selective overview. Biol. Psychiatry 2005, 57, 1215–1220. [Google Scholar] [CrossRef] [PubMed]
- Schachar, R.; Mota, V.L.; Logan, G.D.; Tannock, R.; Klim, P. Confirmation of an inhibitory control deficit in attention-deficit/hyperactivity disorder. J. Abnorm. Child Psychol. 2000, 28, 227–235. [Google Scholar] [CrossRef]
- Ben-Moussa, M.; Rubo, M.; Debracque, C.; Lange, W.G. Djinni: a novel technology supported exposure therapy paradigm for sad combining virtual reality and augmented reality. Front. Psychiatry 2017, 8, 26. [Google Scholar] [CrossRef] [PubMed]
- Cho, B.H.; Ku, J.; Jang, D.P.; Kim, S.; Lee, Y.H.; Kim, I.Y.; Lee, J.H.; Kim, S.I. The effect of virtual reality cognitive training for attention enhancement. Cyberpsychol. Behav. 2002, 5, 129–137. [Google Scholar] [CrossRef] [PubMed]
- Strickland, D.; Marcus, L.M.; Mesibov, G.B.; Hogan, K. Brief report: Two case studies using virtual reality as a learning tool for autistic children. J. Autism Dev. Disord. 1996, 26, 651–659. [Google Scholar] [CrossRef]
- Akhutina, T.; Foreman, N.; Krichevets, A.; Matikka, L.; Narhi, V.; Pylaeva, N.; Vahakuopus, J. Improving spatial functioning in childrenwith cerebral palsy using computerized and traditional game tasks. Disabil. Rehabil. 2003, 25, 1361–1371. [Google Scholar] [CrossRef]
- Reid, D. Changes in seated postural control in children with cerebral palsy following a virtual play environment intervention: a pilot study. Isr. J. Occup. 2002, 11, E75–E95. [Google Scholar]
- Reid, D.T. Benefits of a virtual play rehabilitation environment for children with cerebral palsy on perceptions of self-efficacy: a pilot study. Pediatric Rehabil. 2002, 5, 141–148. [Google Scholar] [CrossRef]
- Gelenbe, E.; Hussain, K.; Kaptan, V. Simulating autonomous agents in augmented reality. J. Syst. Softw. 2005, 74, 255–268. [Google Scholar] [CrossRef]
- Shendarkar, A.; Vasudevan, K.; Lee, S.; Son, Y.J. Crowd simulation for emergency response using BDI agents based on immersive virtual reality. Simul. Model. Pract. Theory 2008, 16, 1415–1429. [Google Scholar] [CrossRef]
- Starner, T.; Mann, S.; Rhodes, B.; Levine, J.; Healey, J.; Kirsch, D.; Picard, R.W.; Pentland, A. Augmented reality through wearable computing. Presence Teleoperators Virtual Environ. 1997, 6, 386–398. [Google Scholar] [CrossRef]
- Zhang, T.; Wang, J.; Liu, P.; Hou, J. Fall detection by embedding an accelerometer in cellphone and using KFD algorithm. IJCSNS 2006, 6, 277–284. [Google Scholar]
- Chan, E.; Wang, D.; Pasquier, M. Towards intelligent self-care: Multi-sensor monitoring and neuro-fuzzy behavior modelling. Proceeding of the 2008 IEEE International Conference on Systems, Man and Cybernetics, Singapore, 12–15 October 2008; pp. 3083–3088. [Google Scholar] [CrossRef]
- Nasution, A.H.; Emmanuel, S. Intelligent Video Surveillance for Monitoring Elderly in Home Environments. In Proceedings of the 2007 IEEE 9th Workshop on Multimedia Signal Processing, Crete, Greece, 1–3 October 2007; pp. 203–206. [Google Scholar] [CrossRef]
- Foroughi, H.; Aski, B.S.; Pourreza, H. Intelligent video surveillance for monitoring fall detection of elderly in home environments. In Proceedings of the 2008 11th International Conference on Computer and Information Technology, Khulna, Bangladesh, 24–27 December 2008; pp. 219–224. [Google Scholar] [CrossRef]
- Morales-Hidalgo, P.; Hernández-Martínez, C.; Vera, M.; Voltas, N.; Canals, J. Psychometric properties of the Conners-3 and Conners Early Childhood Indexes in a Spanish school population. Int. J. Clin. Health Psychol. 2017, 17, 85–96. [Google Scholar] [CrossRef] [PubMed]
- Hall, C.L.; Valentine, A.Z.; Groom, M.J.; Walker, G.M.; Sayal, K.; Daley, D.; Hollis, C. The clinical utility of the continuous performance test and objective measures of activity for diagnosing and monitoring ADHD in children: a systematic review. Eur. Child Adolesc. Psychiatry 2016, 25, 677–699. [Google Scholar] [CrossRef] [PubMed]
- Edwards, M.C.; Gardner, E.S.; Chelonis, J.J.; Schulz, E.G.; Flake, R.A.; Diaz, P.F. Estimates of the validity and utility of the Conners’ Continuous Performance Test in the assessment of inattentive and/or hyperactive-impulsive behaviors in children. J. Abnorm. Child Psychol. 2007, 35, 393–404. [Google Scholar] [CrossRef]
- Vogt, C.; Williams, T. Early identification of stimulant treatment responders, partial responders and non-responders using objective measures in children and adolescents with hyperkinetic disorder. Child Adolesc. Ment. Health 2011, 16, 144–149. [Google Scholar] [CrossRef]
- Conners, C.K.; Staff, M.; Connelly, V.; Campbell, S.; MacLean, M.; Barnes, J. Conners’ continuous performance Test II (CPT II v. 5). Multi-Health Syst. Inc. 2000, 29, 175–196. [Google Scholar]
- Rapport, M.D.; Chung, K.M.; Shore, G.; Denney, C.B.; Isaacs, P. Upgrading the science and technology of assessment and diagnosis: Laboratory and clinic-based assessment of children with ADHD. J. Clin. Child Psychol. 2000, 29, 555–568. [Google Scholar] [CrossRef]
- Rodríguez, C.; Areces, D.; García, T.; Cueli, M.; González-Castro, P. Comparison between two continuous performance tests for identifying ADHD: Traditional vs. virtual reality. Int. J. Clin. Health Psychol. 2018, 18, 254–263. [Google Scholar] [CrossRef]
- Negut, A.; Jurma, A.M.; David, D. Virtual-reality-based attention assessment of ADHD: ClinicaVR: Classroom-CPT versus a traditional continuous performance test. Child Neuropsychol. 2017, 23, 692–712. [Google Scholar] [CrossRef]
- Climent, G.; Banterla, F.; Iriarte, Y. AULA: Theoretical Manual; Nesplora: San Sebastianspain, Spain, 2011. [Google Scholar]


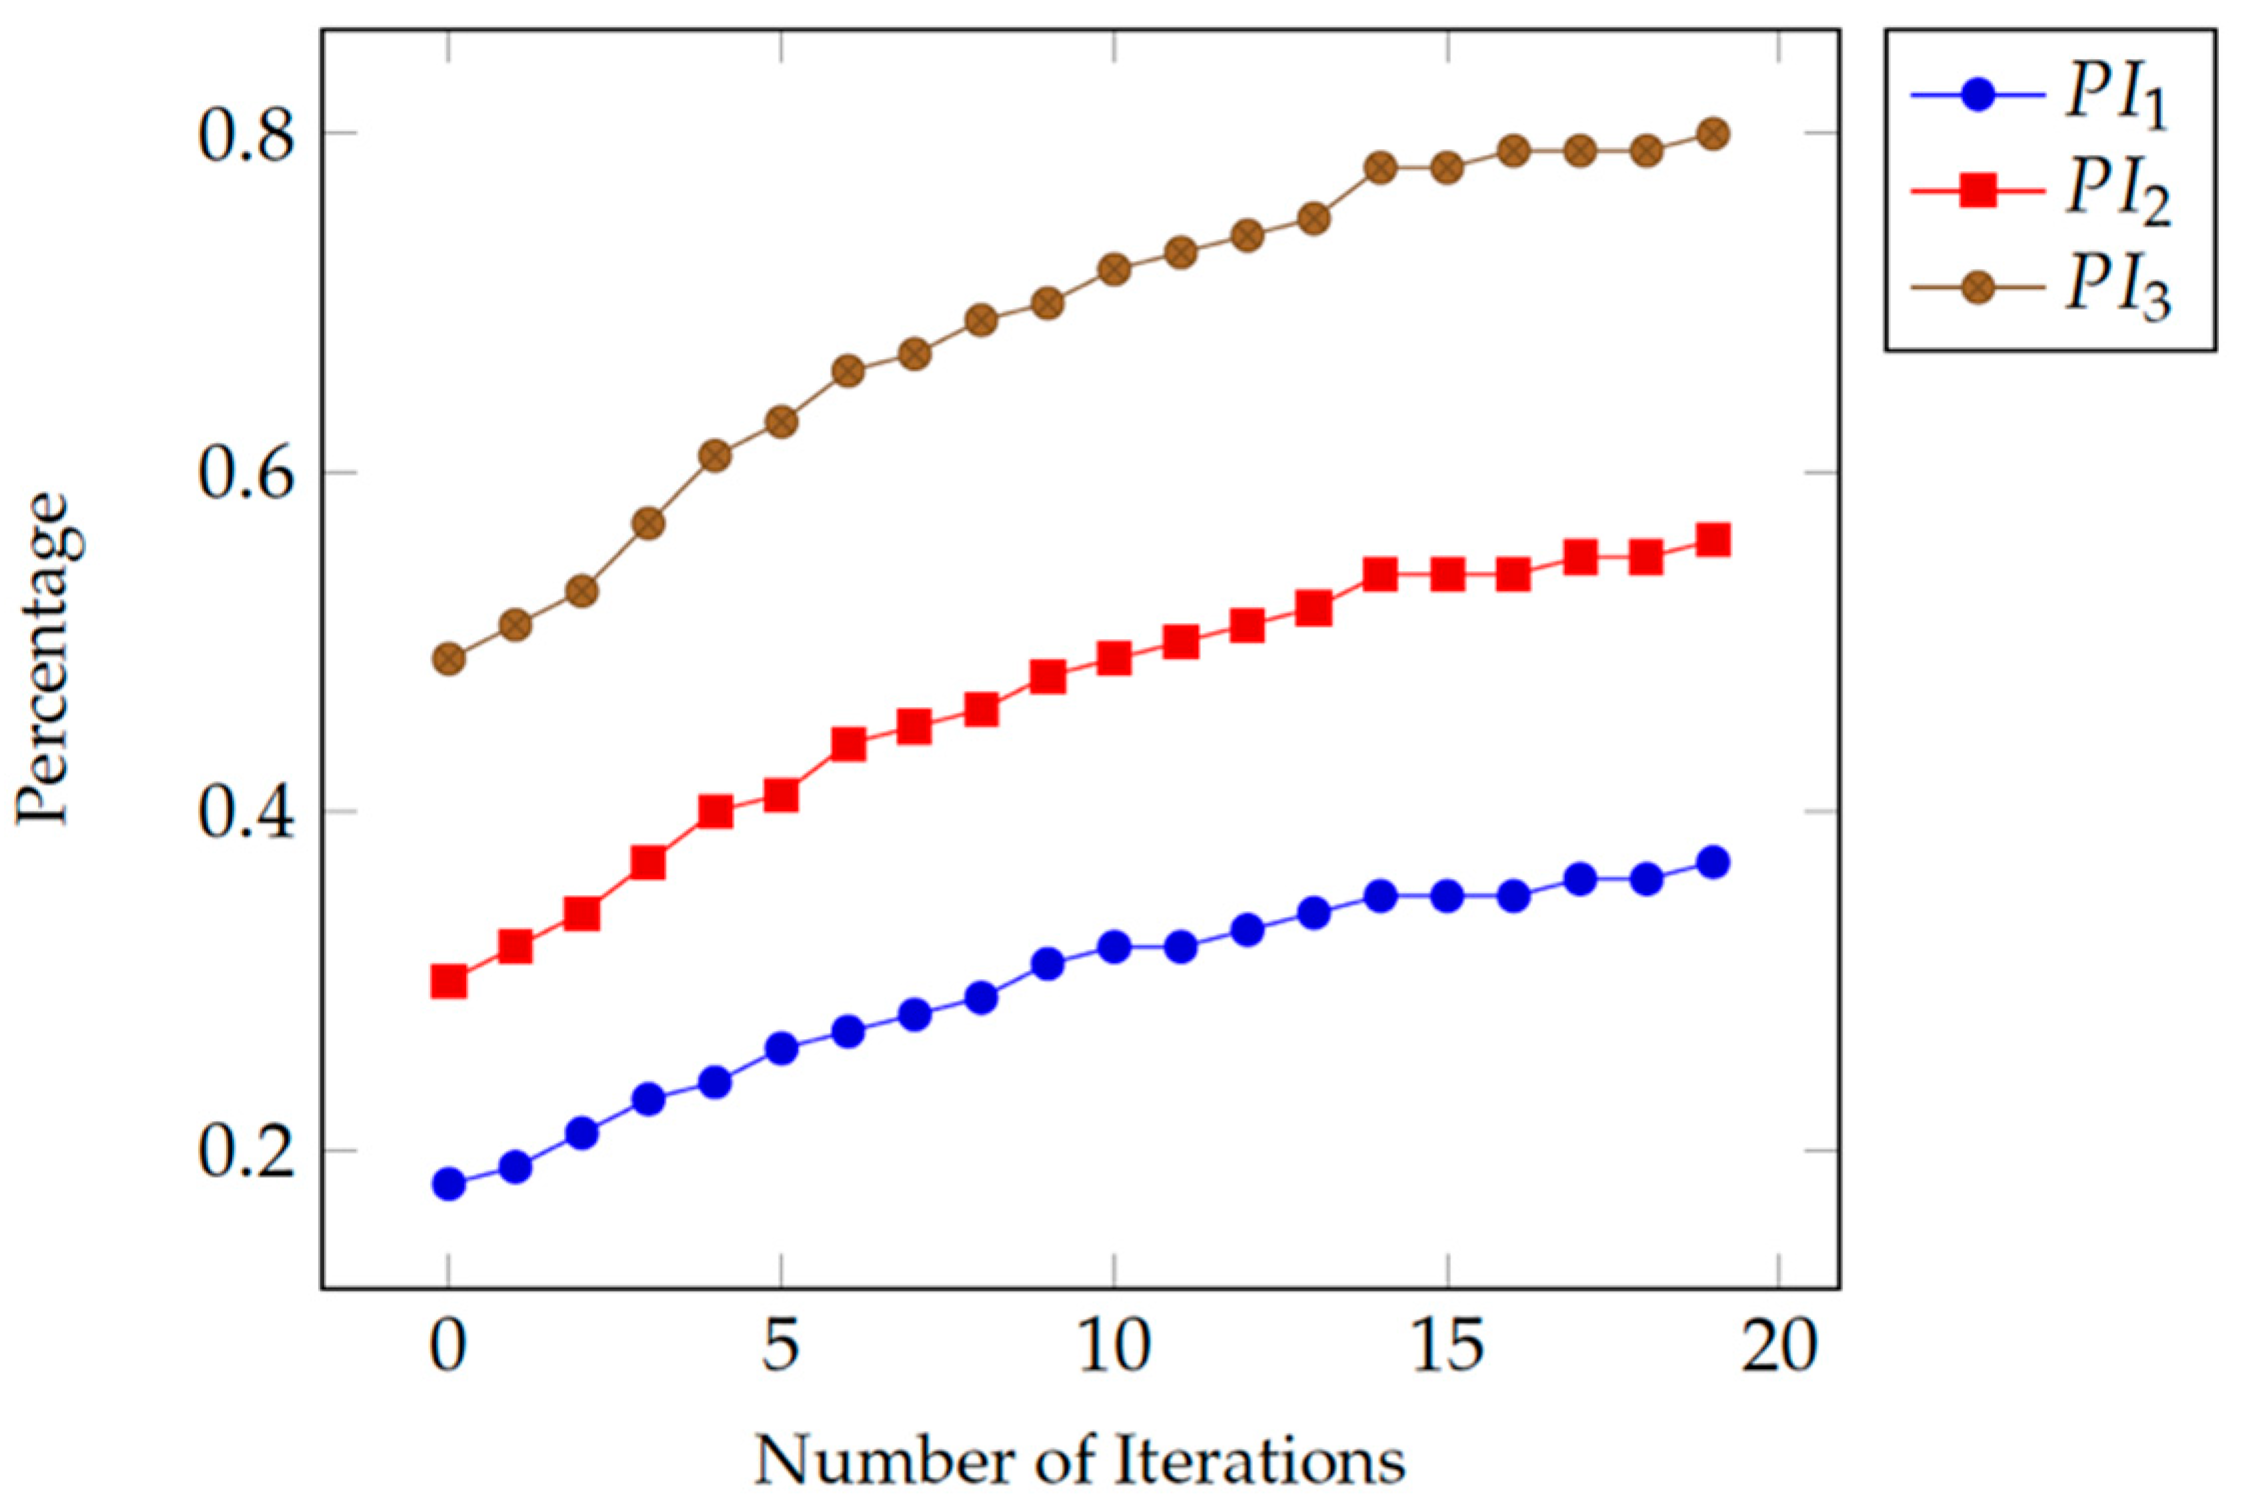
| Experiment Parameters & Performance Measures | Phase 1 | Phase 2 | Phase 3 |
|---|---|---|---|
| No. of Sessions | 20 | 20 | 20 |
| C | 3 | 5 | 8 |
| OE | 3 | 3 | 1 |
| CE | 4 | 2 | 1 |
| K | 0 | 0 | 0 |
| IAF | 30% | 30% | 10% |
| IMF | 40% | 20% | 10% |
| EF | 70% | 50% | 20% |
| GF | 100% | 100% | 100% |
| M | 25.13 | 23.71 | 21.81 |
| SD | 14.46 | 14.17 | 13.58 |
| Average PI | 44% | 55% | 72% |
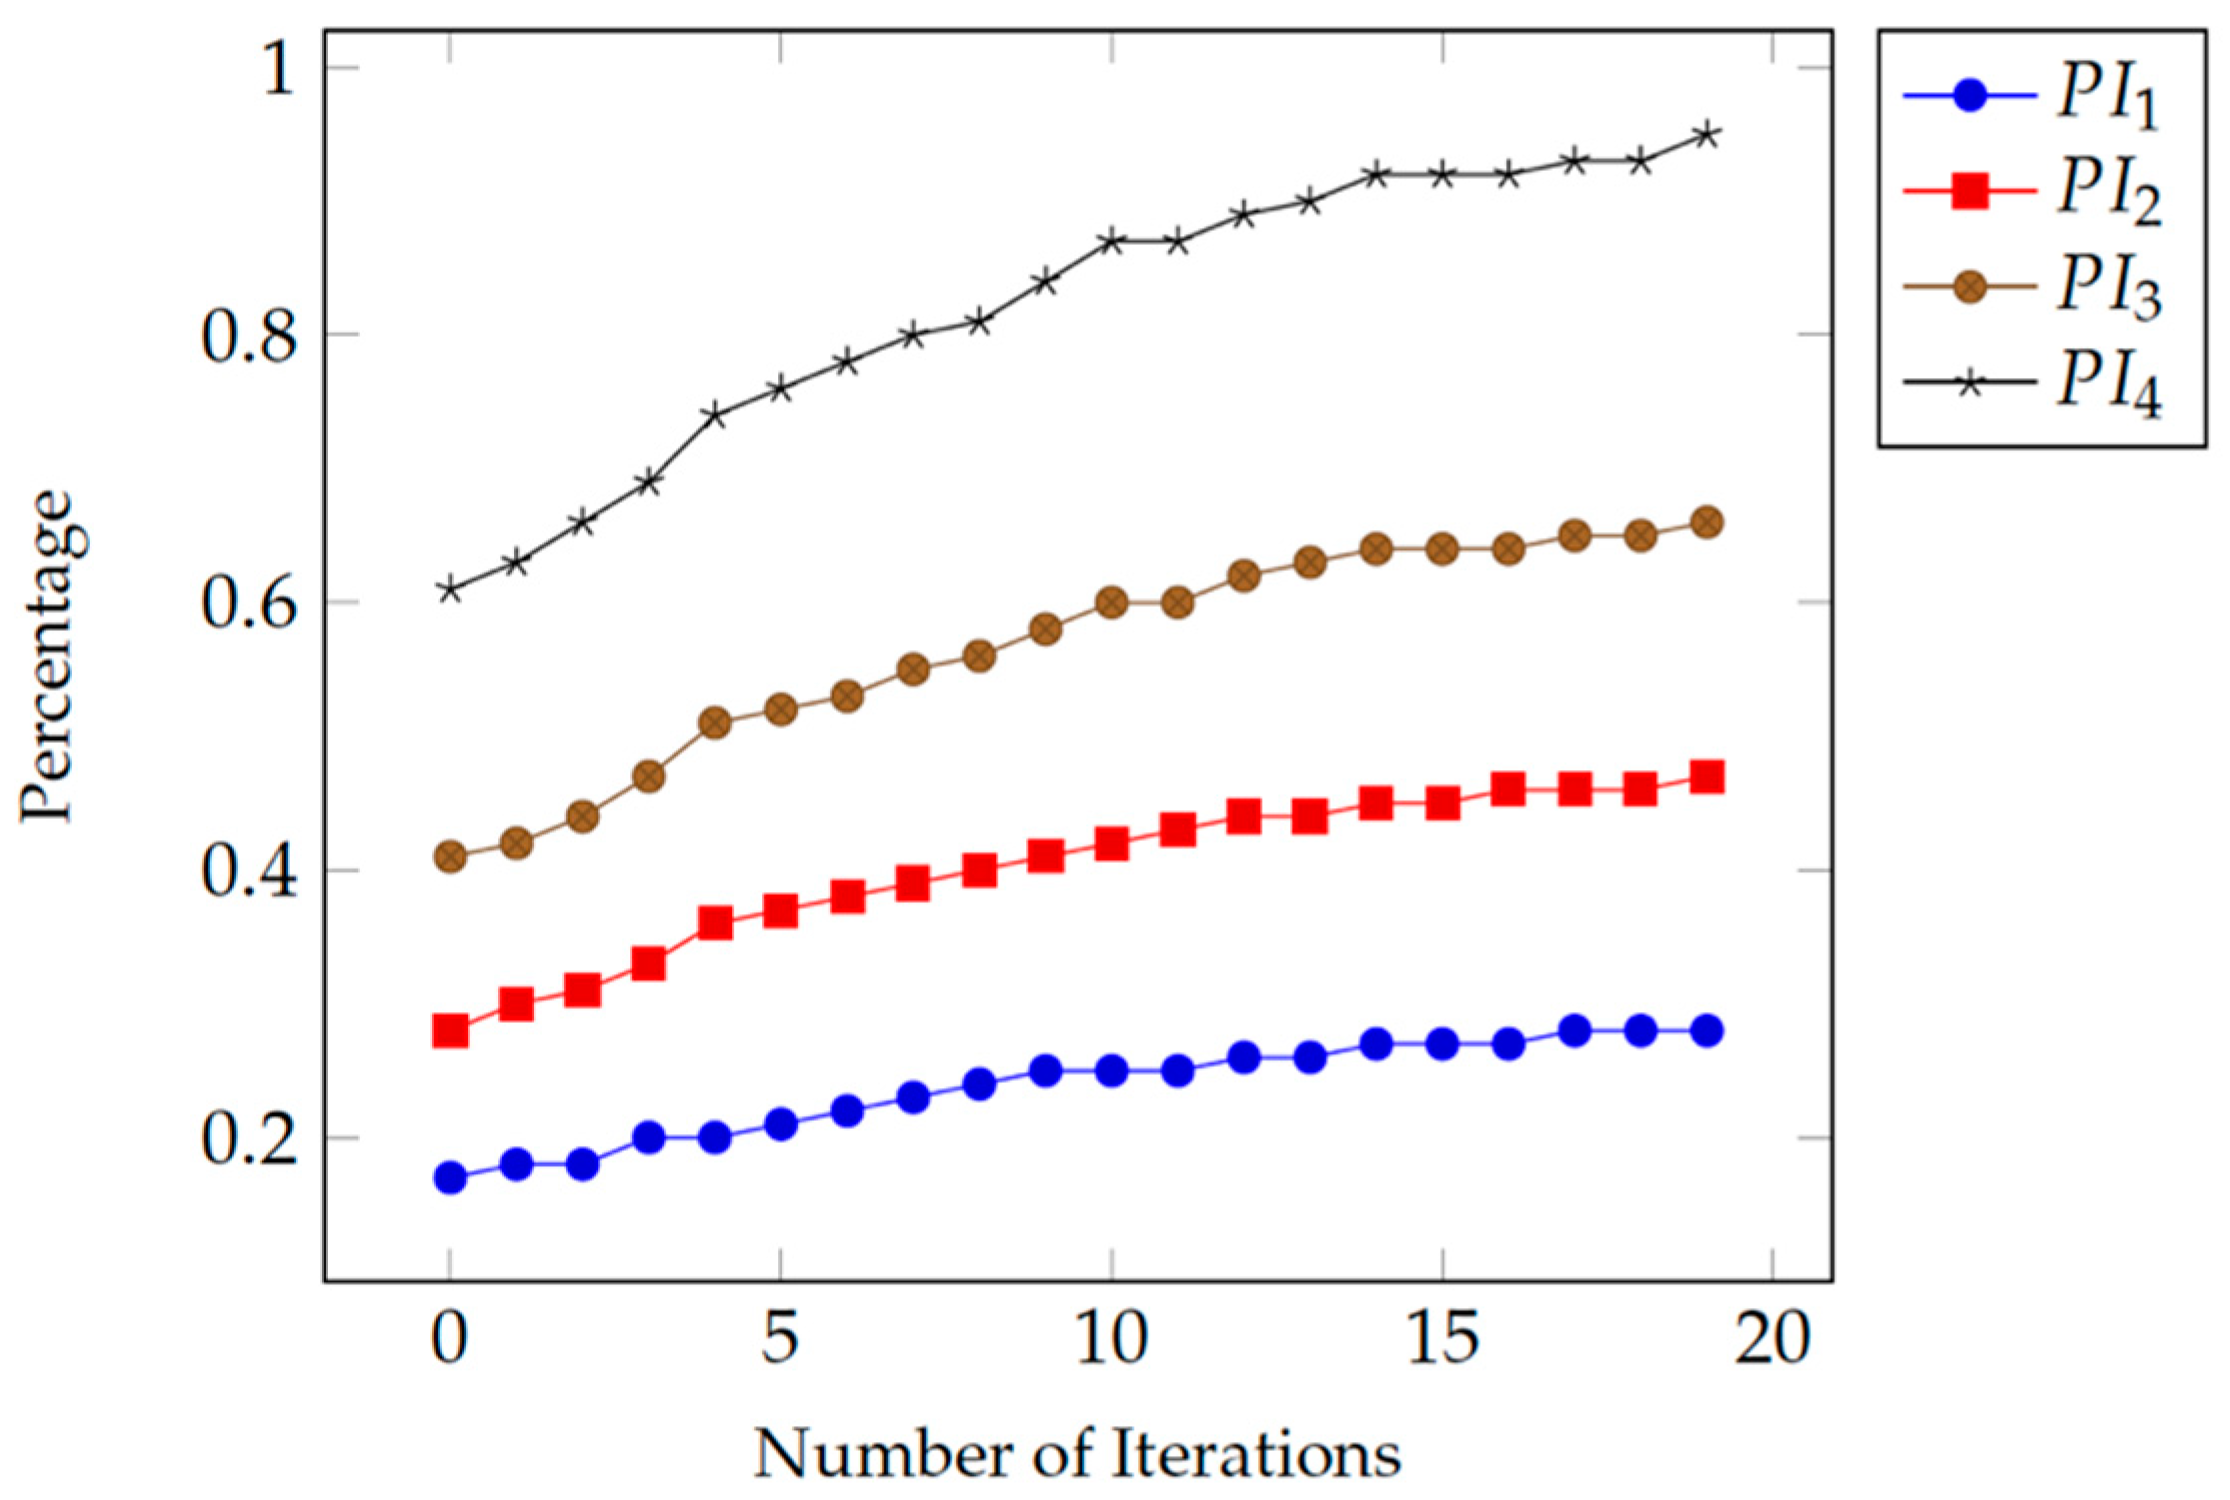
| Experiment Parameters & Performance Measures | Phase 1 | Phase 2 | Phase 3 | Phase 4 |
|---|---|---|---|---|
| No. of Sessions | 20 | 20 | 20 | 20 |
| C | 3 | 5 | 7 | 10 |
| OE | 0 | 0 | 0 | 0 |
| CE | 0 | 0 | 0 | 0 |
| K | 7 | 5 | 3 | 0 |
| IAF | 0% | 0% | 0% | 0% |
| IMF | 0% | 0% | 0% | 0% |
| EF | 0% | 0% | 0% | 0% |
| GF | 30% | 50% | 70% | 100% |
| M | 25.13 | 23.93 | 22.94 | 21.62 |
| SD | 14.46 | 14.13 | 13.80 | 13.18 |
| Average PI | 24% | 40% | 57% | 82% |
© 2019 by the authors. Licensee MDPI, Basel, Switzerland. This article is an open access article distributed under the terms and conditions of the Creative Commons Attribution (CC BY) license (http://creativecommons.org/licenses/by/4.0/).
Share and Cite
Alqithami, S.; Alzahrani, M.; Alzahrani, A.; Mustafa, A. AR-Therapist: Design and Simulation of an AR-Game Environment as a CBT for Patients with ADHD. Healthcare 2019, 7, 146. https://doi.org/10.3390/healthcare7040146
Alqithami S, Alzahrani M, Alzahrani A, Mustafa A. AR-Therapist: Design and Simulation of an AR-Game Environment as a CBT for Patients with ADHD. Healthcare. 2019; 7(4):146. https://doi.org/10.3390/healthcare7040146
Chicago/Turabian StyleAlqithami, Saad, Musaad Alzahrani, Abdulkareem Alzahrani, and Ahmed Mustafa. 2019. "AR-Therapist: Design and Simulation of an AR-Game Environment as a CBT for Patients with ADHD" Healthcare 7, no. 4: 146. https://doi.org/10.3390/healthcare7040146
APA StyleAlqithami, S., Alzahrani, M., Alzahrani, A., & Mustafa, A. (2019). AR-Therapist: Design and Simulation of an AR-Game Environment as a CBT for Patients with ADHD. Healthcare, 7(4), 146. https://doi.org/10.3390/healthcare7040146