Article

Association Between Social Participation, Physical Activity, and Intrinsic Capacity Decline: Empirical Evidence from the CHARLS

School of Public Health, Chongqing Medical University, Chongqing 400016, China
*
Author to whom correspondence should be addressed.
Healthcare 2026, 14(7), 936; https://doi.org/10.3390/healthcare14070936
Submission received: 19 February 2026 / Revised: 20 March 2026 / Accepted: 1 April 2026 / Published: 3 April 2026
(This article belongs to the Topic Healthy, Safe and Active Aging, 2nd Edition)

Highlights

What are the main findings?
  • Social participation levels exhibit a dose–response relationship with the risk of declining intrinsic capacity.
  • Physical activity levels exhibit a U-shaped relationship with the risk of declining intrinsic capacity.
What are the implications of the main findings?
  • Social participation plays a positive role in protecting intrinsic capacity.
  • A nonlinear threshold relationship suggests that moderate physical activity yields the greatest benefits for intrinsic capacity protection.

Abstract

Objectives: The reduction in intrinsic capacity significantly impacts the functional abilities of older individuals, and is strongly linked to adverse health consequences. Safeguarding and enhancing an elderly person’s intrinsic capacity can lead to better life quality and improved social well-being. This research seeks to explore the relationships between social engagement, physical activity, and the likelihood of decline in intrinsic capacity among the elderly in China. Methods: Utilizing the CHARLS data from 2015, individuals with incomplete information were removed from our study. Our analysis included a total of 3502 samples. Social participation and physical activity were assessed through self-reported surveys. The evaluation of intrinsic capacity, based on WHO criteria, thoroughly examined participants in five areas: mobility, sensory functions, vitality, mental health and cognitive abilities. The links between social participation, physical activity and intrinsic capacity decline were revealed through logistic regression. Restricted cubic splines (RCS) were employed as a statistical model, exploring the relationships between dose and response. Interaction analysis was used to examine the interaction between social participation and physical activity. Analyses of subgroups facilitated the evaluation of variations based on factors including age, gender, duration of sleep, and chronic disease numbers. Results: In contrast to the low-level group, individuals with moderate to high degrees of social participation (OR = 0.80, p = 0.012; OR = 0.56, p < 0.001) and those with moderate to high levels physical activity (OR = 0.72, p = 0.019; OR = 0.74, p = 0.016) demonstrated a notably lower risk of decline in intrinsic capacities. A negative correlation was identified in a dose-response manner between social participation and the risk of IC decline. A U-shaped relationship was established between physical activity levels and the risk of intrinsic capacity decline. The fully adjusted interaction model showed that no significant interaction was observed between social participation and physical activity (p = 0.778). Furthermore, subgroup analyses showed that these associations remained generally consistent across older adults of different age groups, genders, sleep duration, and numbers of chronic diseases. Conclusions: In order to slow down the deterioration of intrinsic capacity in older adults in China, it may be beneficial to focus on sustaining elevated levels of social participation and engaging in moderate physical activity. Higher levels of social participation are associated with a lower risk of experiencing a decline in intrinsic capacity, whereas both insufficient and excessive physical activity are associated with an increased risk of intrinsic capacity decline.

1. Introduction

Life expectancy is on the rise, and the fertility rate is declining, which is having a great impact on global demographic patterns [1,2]. The proportion of those aged 60 and above is increasing and is expected to reach 16% by the year 2050 [3]. Some common age-related concerns, such as chronic diseases and frailty, deteriorate functional ability, which may ultimately result in diminished independence, social isolation and a reduced life quality for older individuals [4,5]. Healthy aging is thus now considered a major global priority for protecting the growing aged population. The World Health Organization (WHO) has defined intrinsic capacity as a crucial indicator for assessing healthy aging [6]. The ultimate goal is to promote the health of seniors and support high-quality longevity.
Intrinsic capacity (IC) stands for the entire physical and mental capacity that an individual can utilize at any given moment. It consists of five dimensions: locomotion, sensory functions (including vision and hearing), vitality, cognitive abilities, and psychological function [7]. It is often employed to evaluate an individual’s ability to manage challenges, maintain health, and live autonomously in their later years. Research indicates that IC generally declines with advancing age [8]. IC decline has also been linked to various negative health outcomes in older individuals, including frailty [9], falls [10], disability [11], institutionalization [12], and mortality [13]. Furthermore, IC is affected by factors including demographic background, health-related behaviors, and living environments [14,15,16]. A decline in IC severely restricts the functional performance and life quality for older adults, not only increasing caregiving burden on individuals and families but also potentially driving up societal healthcare expenditures. This presents a great danger to social–economic development and public health systems. Recent meta-analyses revealed that approximately 66.0% of Chinese older people experience IC decline [17]. Moreover, the worldwide prevalence of older adults with IC impairment together with other diseases is as high as 55.0% [18]. Thus, early assessment and timely intervention become particularly important in slowing down IC decline, better supporting older adults’ ability to live independently, enhancing quality of life in later years, and promoting healthy aging.
Activity participation is recognized as an essential element of healthy aging and one potential factor influencing IC. It typically encompasses social participation (SP), such as socializing with friends or groups, and physical activity (PA), such as exercise or a structured physical training program [19]. Social participation and physical activity are two conceptually distinct yet potentially complementary behavioral dimensions [20,21]. Social participation primarily reflects individuals’ engagement in interpersonal, community, and societal activities, whereas physical activity mainly refers to behaviors related to bodily movement and energy expenditure. Although these two dimensions emphasize different aspects, both play positive roles in healthy aging, and interventions targeting both dimensions simultaneously have shown potential to improve health-related outcomes [22,23]. Existing evidence further suggests that social participation and physical activity may be linked to health through partly different pathways: social participation is more closely related to social connectedness, psychosocial support, and cognitive stimulation, whereas physical activity is more strongly associated with locomotor function, vitality, and the maintenance of overall physical functioning [24,25,26,27,28,29,30]. Therefore, it is necessary to examine the independent and joint associations of social participation and physical activity with intrinsic capacity impairment within the same analytical framework.
Recent studies have emphasized the connections between both social participation and physical activity and IC, showcasing the significant impact of these factors on its preservation. Research indicates that older individuals who are socially isolated are more likely to experience IC decline [31]. Further, social participation mediates the association between internet use and IC [32,33]. The research further suggested that physical activity is linked to some domains of IC (locomotion, vitality, and cognition), albeit in an inconsistent fashion [34,35], which may be due to differing study design, populations, or methodologies. On the other hand, recent research revealed that older adults with lower IC might face increased challenges in sustaining independent participation in daily social and physical activities due to a higher risk of limitations in ADL [36,37]. It is noteworthy that current research has focused on the correlations or mediating effects between SP and PA with IC. Far less attention has been paid to how these factors might be linked through dose–response relationships. In fact, nonlinear relationships may exist between these variables, and the associations may differ by age and gender. Accordingly, social participation and physical activity need to be investigated in relation to IC decline risk in the elderly to enrich relevant studies and provide scientific evidence for future studies in the field.
This research aims to delve into the associations between both social participation and physical activity and the risk of IC decline among older people, utilizing the third wave of data from the CHARLS. Meanwhile, it attempts to evaluate potential nonlinear relationships, which could offer good evidence for future research and intervention management to delay the decline of IC and promote healthy aging.

2. Materials and Methods

2.1. Study Design and Participants

The China Health and Retirement Longitudinal Study (CHARLS) is conducted by the National School of Development at Peking University. It aims to collect high-quality, multidimensional microdata concerning individuals aged 45 and above in China [38]. This study received ethical approval (IRB00001052-11015). All participants signed their informed consent. Data is available for download from the CHARLS platform.
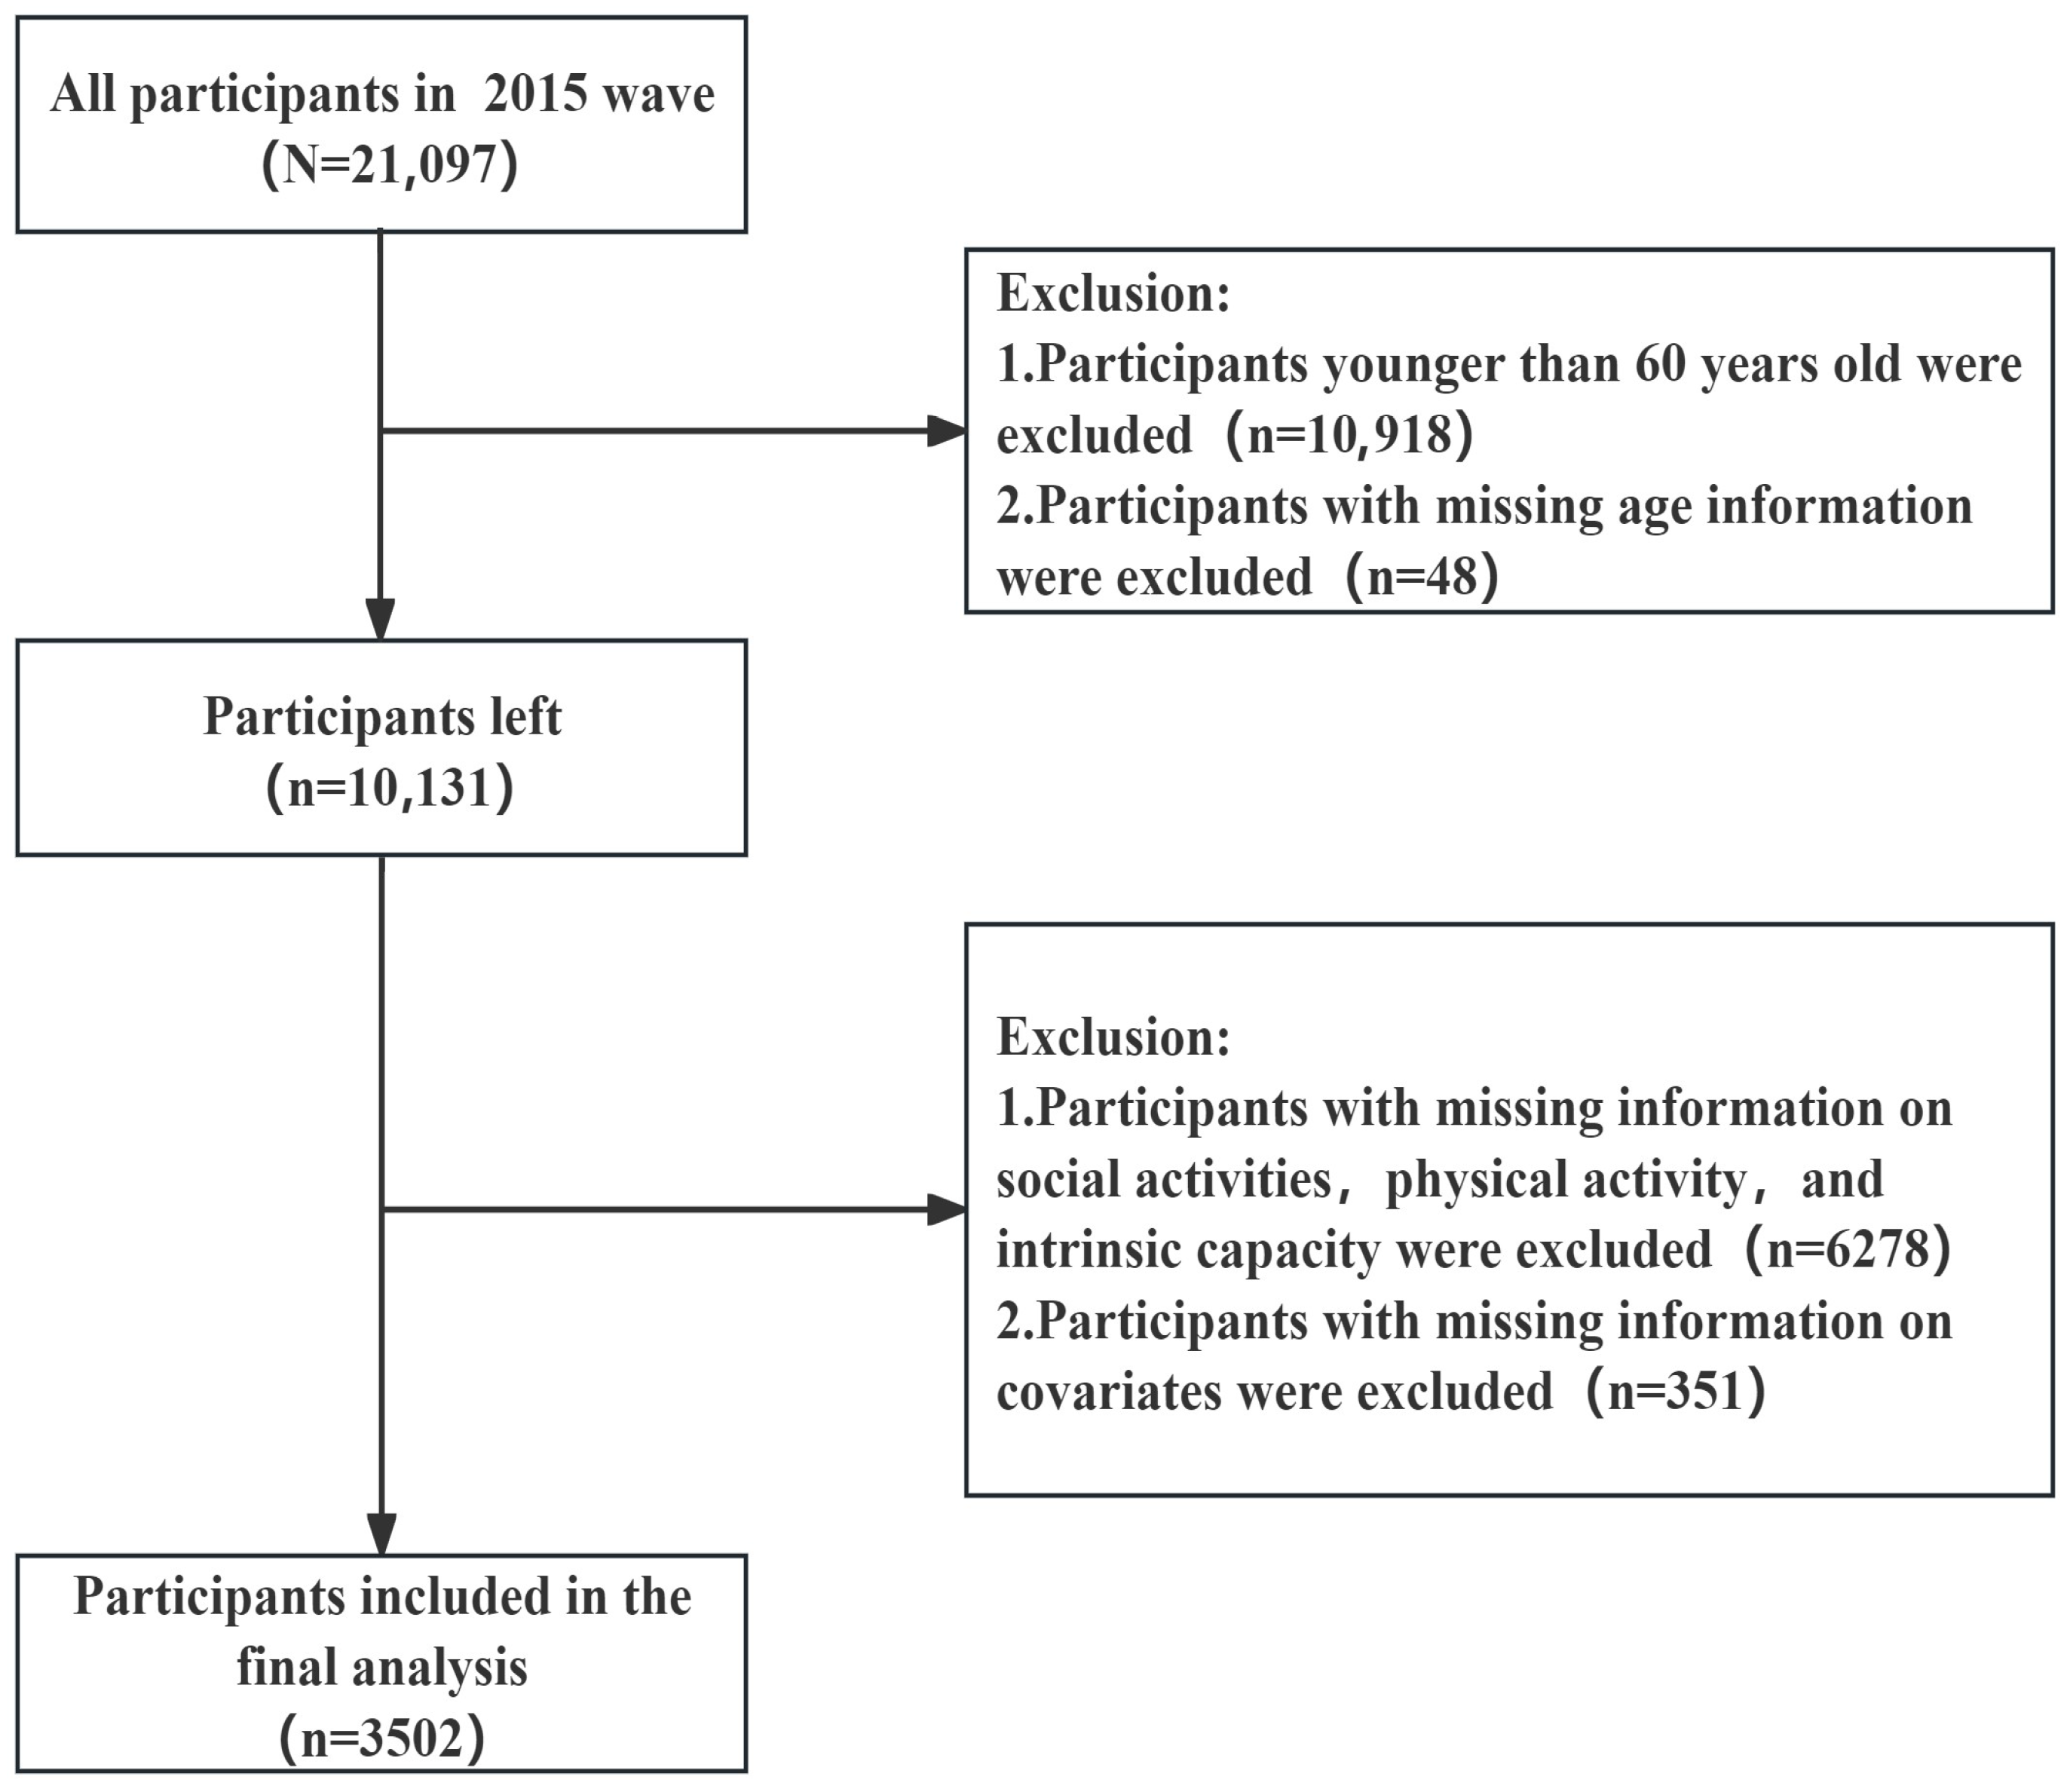
The data from the CHARLS 2015 was utilized for this study. All modules from the 2015 survey that are relevant were merged for analysis. Individuals were excluded if they lacked information on social participation, physical activity, or intrinsic capacity. Furthermore, people under the age of 60 and those lacking information on core covariates were also excluded from the study. The final analytical sample comprised a total of 3502 participants. The detailed flowchart showing participant selection is presented in Figure 1.

2.2. Assessment of Social Participation

In the CHARLS questionnaire, social participation (SP) was assessed based on the number and frequency of activities. Participants were asked, “Have you engaged in any of the following social activities in the past month?”, with multiple response options, including: (1) interacting with friends; (2) playing mahjong, cards, or chess, or visiting community activity centers; (3) providing help to family members, friends, or neighbors who do not live together; (4) dancing, fitness, or similar activities; (5) participating in social organizations or clubs; (6) engaging in volunteer or charitable activities; (7) caring for sick or disabled individuals not living in the same household; (8) attending educational or training courses; (9) financial investment activities; (10) internet use; (11) other social activities; and (12) none of the above. One point was awarded for each activity participated in. Option (12) was treated as an independent category; participants selecting this option were assigned a total score of zero. The total activity count ranged from 0 to 11, with higher scores indicating participation in a greater number of activity types.
Participants who selected any of options (1)–(11) were further asked about the frequency of each activity, categorized as (1) almost daily, (2) almost weekly, or (3) not regularly, and assigned values of 3, 2, and 1, respectively. For each activity, the activity score was multiplied by the corresponding frequency score, and all activities were summed to generate a total SP frequency score. The theoretical score range was 0–33, while the observed SP score in this study ranged from 0 to 14. Consistent with previous research [39], SP was categorized into three levels: low (0 points), moderate (1–3 points), and high (>3 points).

2.3. Assessment of Physical Activity

To measure participants’ physical activity levels, their level of intensity, days and duration are used. Research places physical activity into three intensity levels with respective metabolic equivalents (MET): vigorous activity (8.0 MET), moderate physical activity (4.0 MET), and light physical activity (3.3 MET). To estimate the daily duration of activity, we used a median value. For instance, the range “≥10 to <30 min” was recorded as 20 min. We took the value for open-ended categories like “≥240 min”. We subsequently computed the weekly PA volume (MET-min/week) as follows: TPA = MET value × daily duration (in minutes) × number of active days per week (in days). Based on the classification criteria established by the International Physical Activity Questionnaire (IPAQ) classification criteria [40], participants were categorized as having a low level (less than 600 MET-min/week), moderate level (600 to 3000 MET-min/week), or high level (>3000 MET-min/week).

2.4. Assessment of Intrinsic Capacity

IC is assessed across five dimensions: locomotion, sensory capacity (hearing and vision), vitality, cognition, and psychological capacity. Each dimension received a score of 1 for full functionality and 0 for any impairment. The obtained score can vary from 0 to 5. Higher scores indicated better intrinsic capacity. A score of 4 or lower was defined as IC decline. The criteria for evaluation are shown in Supplementary Table S1.

2.5. Covariates

The covariates chosen for this analysis were based on the available literature and the 2015 CHARLS dataset. Factors such as age (60–74/≥75 years), gender (male/female), marital status (partnered/unpartnered), education level (below primary school/primary school/junior middle school/high school and above), residence (urban/rural), currently smoking (yes/no), currently drinking (yes/no), sleep duration (<7 h/≥7 h), number of chronic diseases (0/1/≥2), body mass index (BMI; underweight/normal/overweight/obese), and health insurance (yes/no) were used.

2.6. Statistical Analysis

Descriptive statistics were applied to summarize the participants’ traits. Frequencies and percentages served to describe categorical variables. For simple group comparisons, chi-square tests were employed. We utilized logistic regression models to investigate the relationships between the levels of social participation and physical activity (low, moderate, or high) and IC decline. The relationships between the social participation levels and physical activity levels (low, moderate, or high) in relation to IC decline were explored by logistic regression models. Model 1 was unadjusted; Model 2 was adjusted for age, gender, marital status, and education; Model 3 was further adjusted for health behavior-related factors and socioeconomic factors based on the Model 2. The low-level group was set as the reference group. Odds ratios (ORs) with 95% confidence intervals (CIs) and p-values were reported for results. Using restricted cubic spline (RCS) models, the potential nonlinear relationships were examined among social participation, physical activity, and IC impairment using nodes at the 5th, 35th, 65th, and 95th percentiles. Several covariates were adjusted in the analyses, including age, sex, marital status, education, residence, currently smoking, currently drinking, sleep duration, number of chronic diseases, BMI, and health insurance. Interaction analysis was conducted to assess the interaction between social participation and physical activity. Stratified analyses also controlled for age, gender, and sleep duration to further assess differences. RCS analysis and subgroup analysis were performed in RStudio 4.4.3, whereas other statistical analyses were performed in STATA 17.0. Two-tailed tests were used for the hypothesis tests and p-value < 0.05 was considered statistically significant.

3. Results

3.1. Baseline Characteristics of the Participants

The fundamental characteristics of the 3502 individuals involved in this research were displayed (Table 1), showing an average age of 67.96 ± 6.47 years. Of the participants, 1758 (50.2%) were male and 1744 (49.8%) were female. Among all participants, 2503 (71.5%) showed an IC decline (average age: 68.45 ± 6.76 years). IC was significantly associated with age, gender, marital status, education, residence, currently smoking, currently drinking, sleep duration, number of chronic diseases, BMI, health insurance, and activity levels (p ≤ 0.004). Individuals who were older, female, less educated, unpartnered, living in rural areas, had shorter sleep duration, more chronic diseases, no health insurance, and lower activity levels were more likely to experience IC decline than individuals with normal IC.
To assess potential selection bias, we compared the relevant baseline characteristics between the included group (n = 3502) and the excluded group (n = 6629); participants who did not meet the study design age criteria were not included in this analysis. As shown in Supplementary Table S2, no statistically significant differences were observed for most covariates (p > 0.05).

3.2. Association Between Social Participation and Physical Activity Levels and Declines in Intrinsic Capacity

Table 2 indicates that social participation levels are significantly linked to a decline in IC. In the unadjusted Model 1, specifically, mid-to-high-level SP participants had lower IC impairment compared to low SP levels (OR = 0.72, p < 0.001; OR = 0.42, p < 0.001). These associations continued to be significant following adjustments in Model 3. The mid-to-high-level SP was linked to reduced risks of 20% (OR = 0.80, 95% CI: 0.67–0.95, p = 0.012) and 44% (OR = 0.56, 95% CI: 0.45–0.70, p < 0.001) as compared to the low-level group. Table 3 indicates that, in Model 3, which was adjusted for all variables, the mid-to-high-level PA compared to the low-level group showed a protective effect on IC, with a reduced risk of IC impairment by 28% (OR = 0.72, 95% CI: 0.55–0.95, p = 0.019) and 26% (OR = 0.74, 95% CI: 0.58–0.95, p = 0.016), respectively.
We then analyzed the associations between different SP and PA levels and every subdomain of the IC. According to Supplementary Table S3, social participation significantly negatively correlated with locomotion, psychological function, and cognition (p < 0.01), and only proved to be statistically significant in the high-level group for sensory function and vitality. We also observed an important connection between physical activity and the locomotion, sensory, and cognitive domains, and moderate links with the vitality domain. Nonetheless, no significant association was observed in the psychological dimension (Supplementary Table S4).

3.3. Nonlinear Relationship Between Social Participation and Physical Activity Levels and Intrinsic Capacity Decline

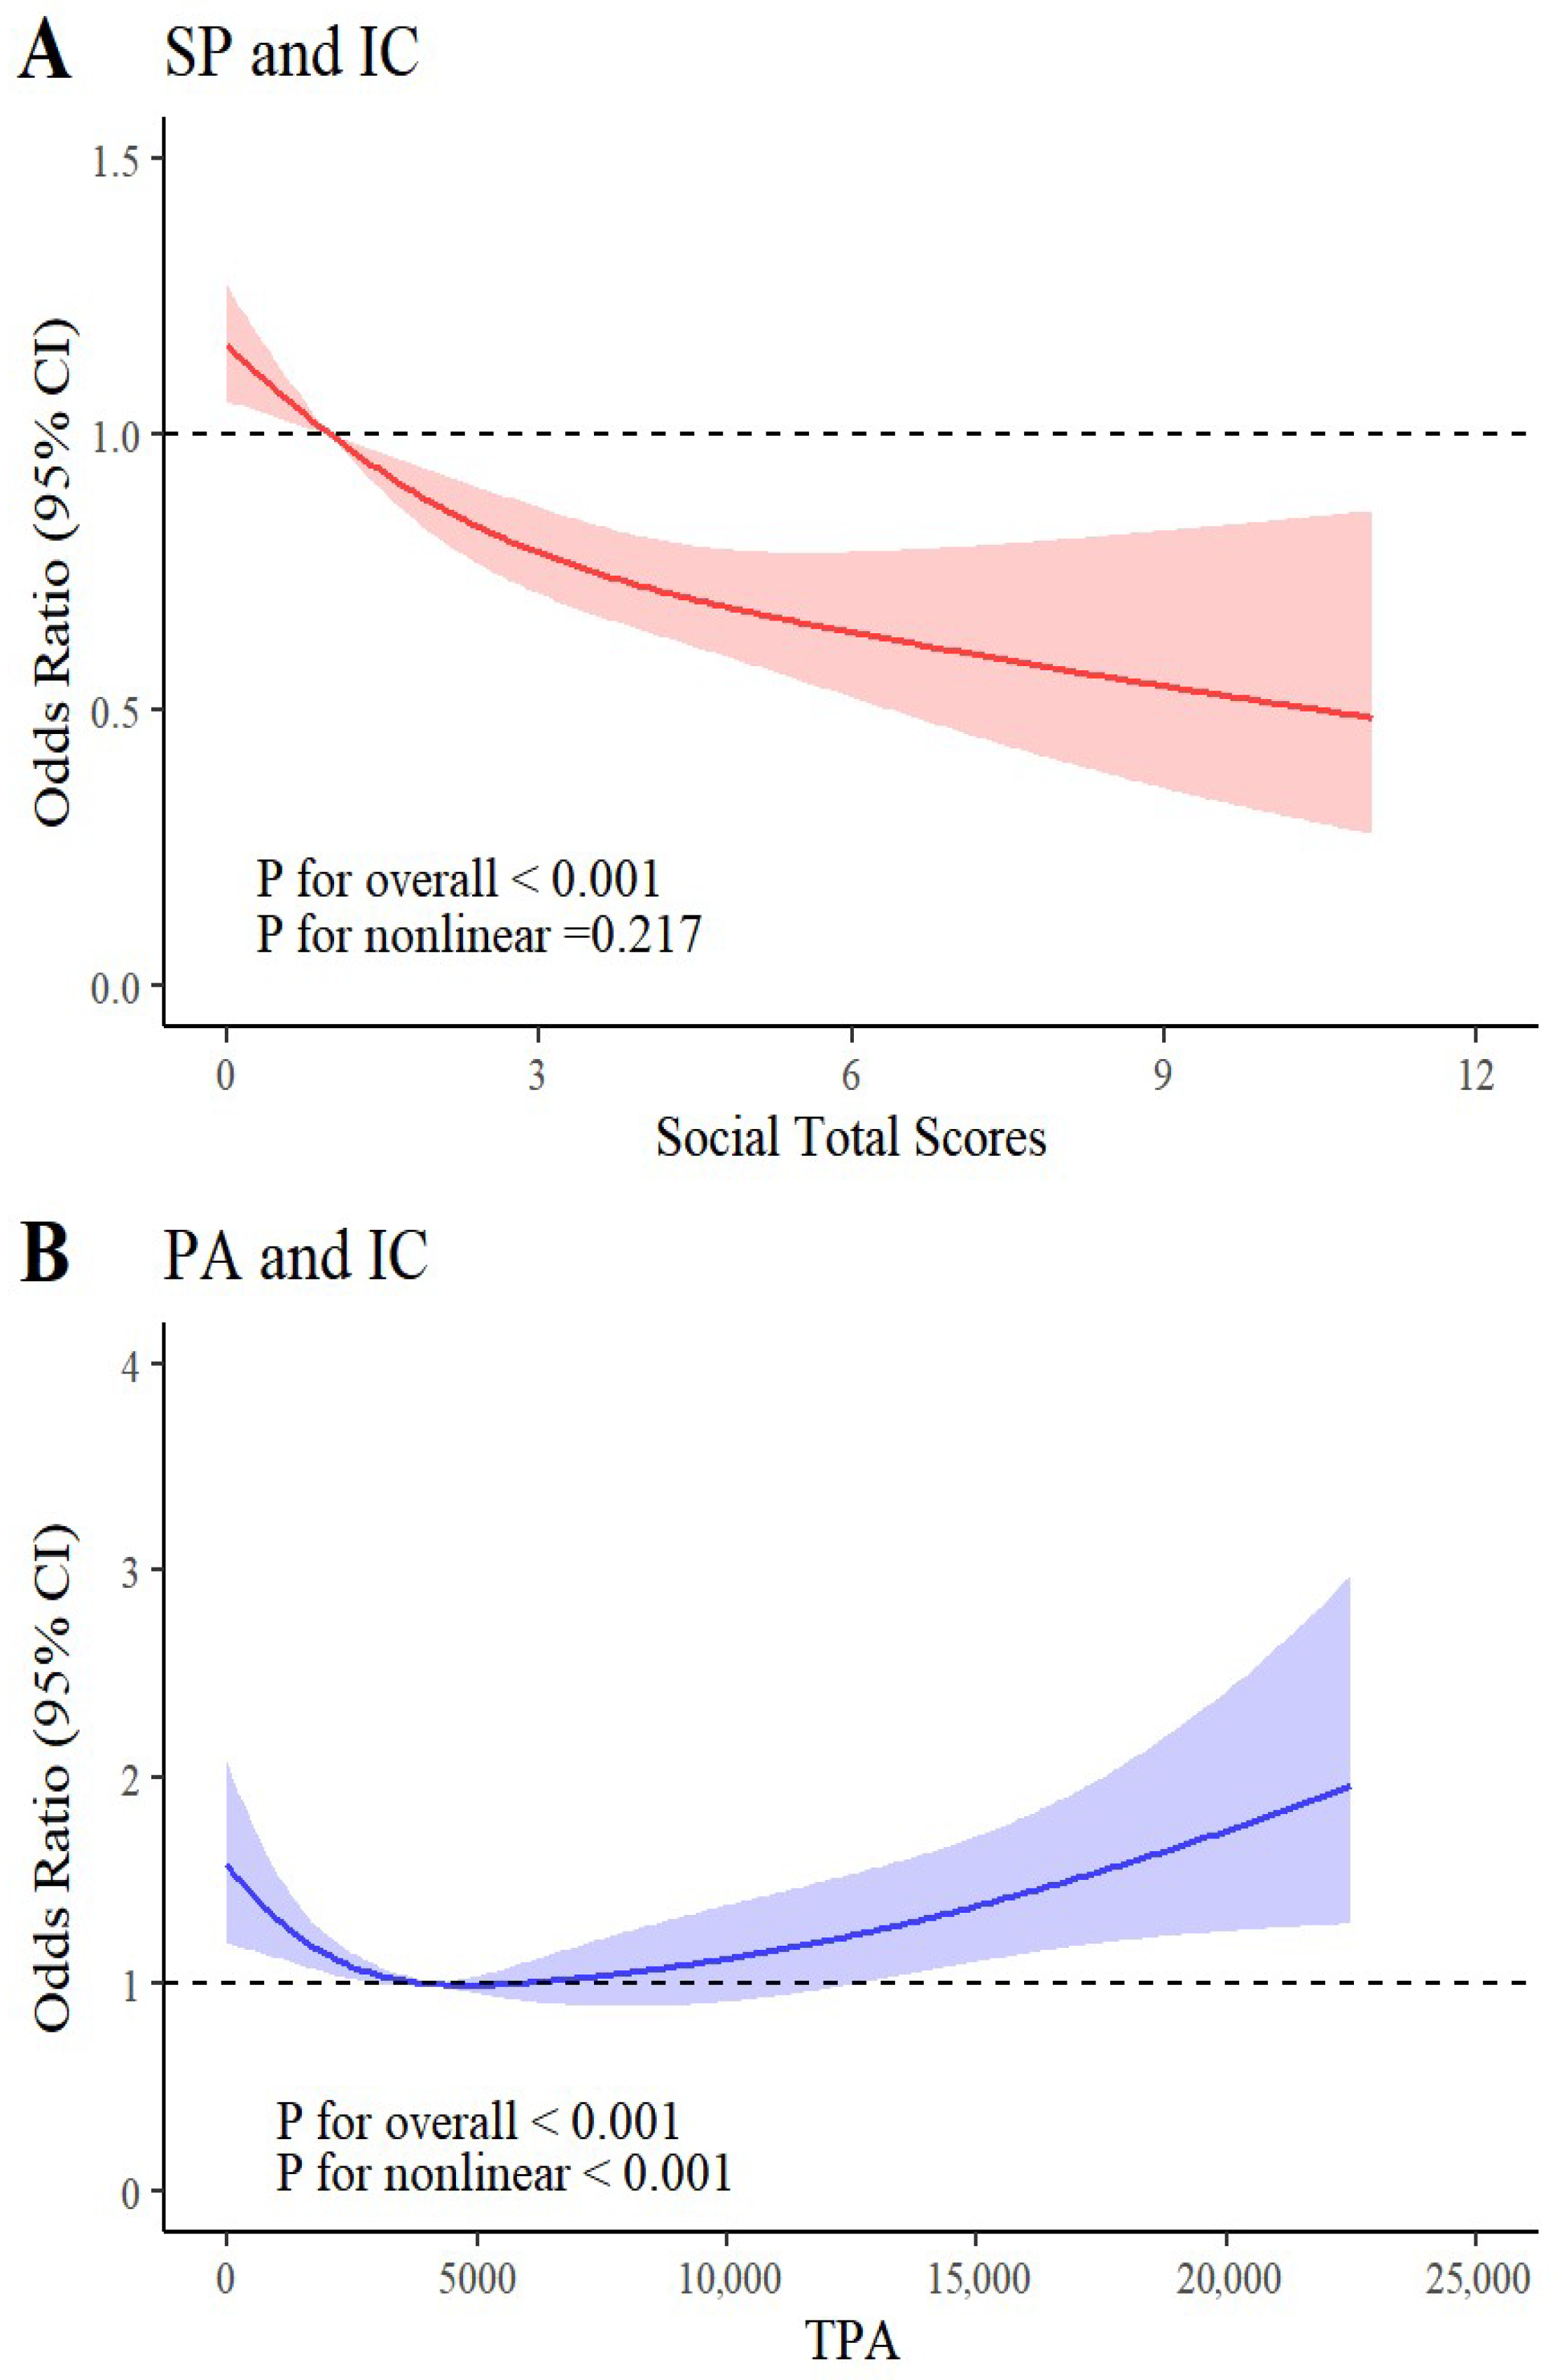
To further analyze the relationship between social participation, physical activity, and IC decline, the RCS model was applied to explore potential nonlinear relationships. Figure 2A demonstrates a significant negative dose–response relationship between social participation and the risk of IC impairment. Both the overall trend (p < 0.001) and nonlinear values (p = 0.217) indicate that the risk of IC decline gradually decreases as the variety and frequency of social activities increase. Figure 2B presents a U-shaped association between physical activity and IC decline risk, with the overall trend and nonlinear values exhibiting statistical significance (all p < 0.001). Physical activity levels of approximately 3000–4000 MET-min/week correspond to a comparatively low risk of IC impairment. We assessed the robustness of the results by sequentially including confounding factors. Sensitivity analyses confirmed that the association between social participation, physical activity, and IC decline risk remained robust (Supplementary Figure S1).
Additionally, we further examined the associations of social participation and physical activity with each subdomain of IC. Supplementary Figure S2 reveals significant negative dose–response relationships between social participation and all five dimensions of IC (p for nonlinear ≥ 0.496). Meanwhile, Supplementary Figure S3 demonstrates a pronounced nonlinear relationship between physical activity levels and the five IC dimensions (p for nonlinear ≤ 0.016).

3.4. Interaction Analysis

We further examined the interaction between social participation and physical activity. In the fully adjusted model, the interaction term did not reach statistical significance (p for interaction = 0.778), suggesting that there was no significant interaction between social participation and physical activity in their association with intrinsic capacity impairment. Table 4 further presents the predicted risk of intrinsic capacity impairment across different combinations of social participation and physical activity. The results showed that, among all combinations, individuals with high levels of social participation and low levels of physical activity had the lowest predicted risk of intrinsic capacity impairment.

3.5. Subgroup Analysis

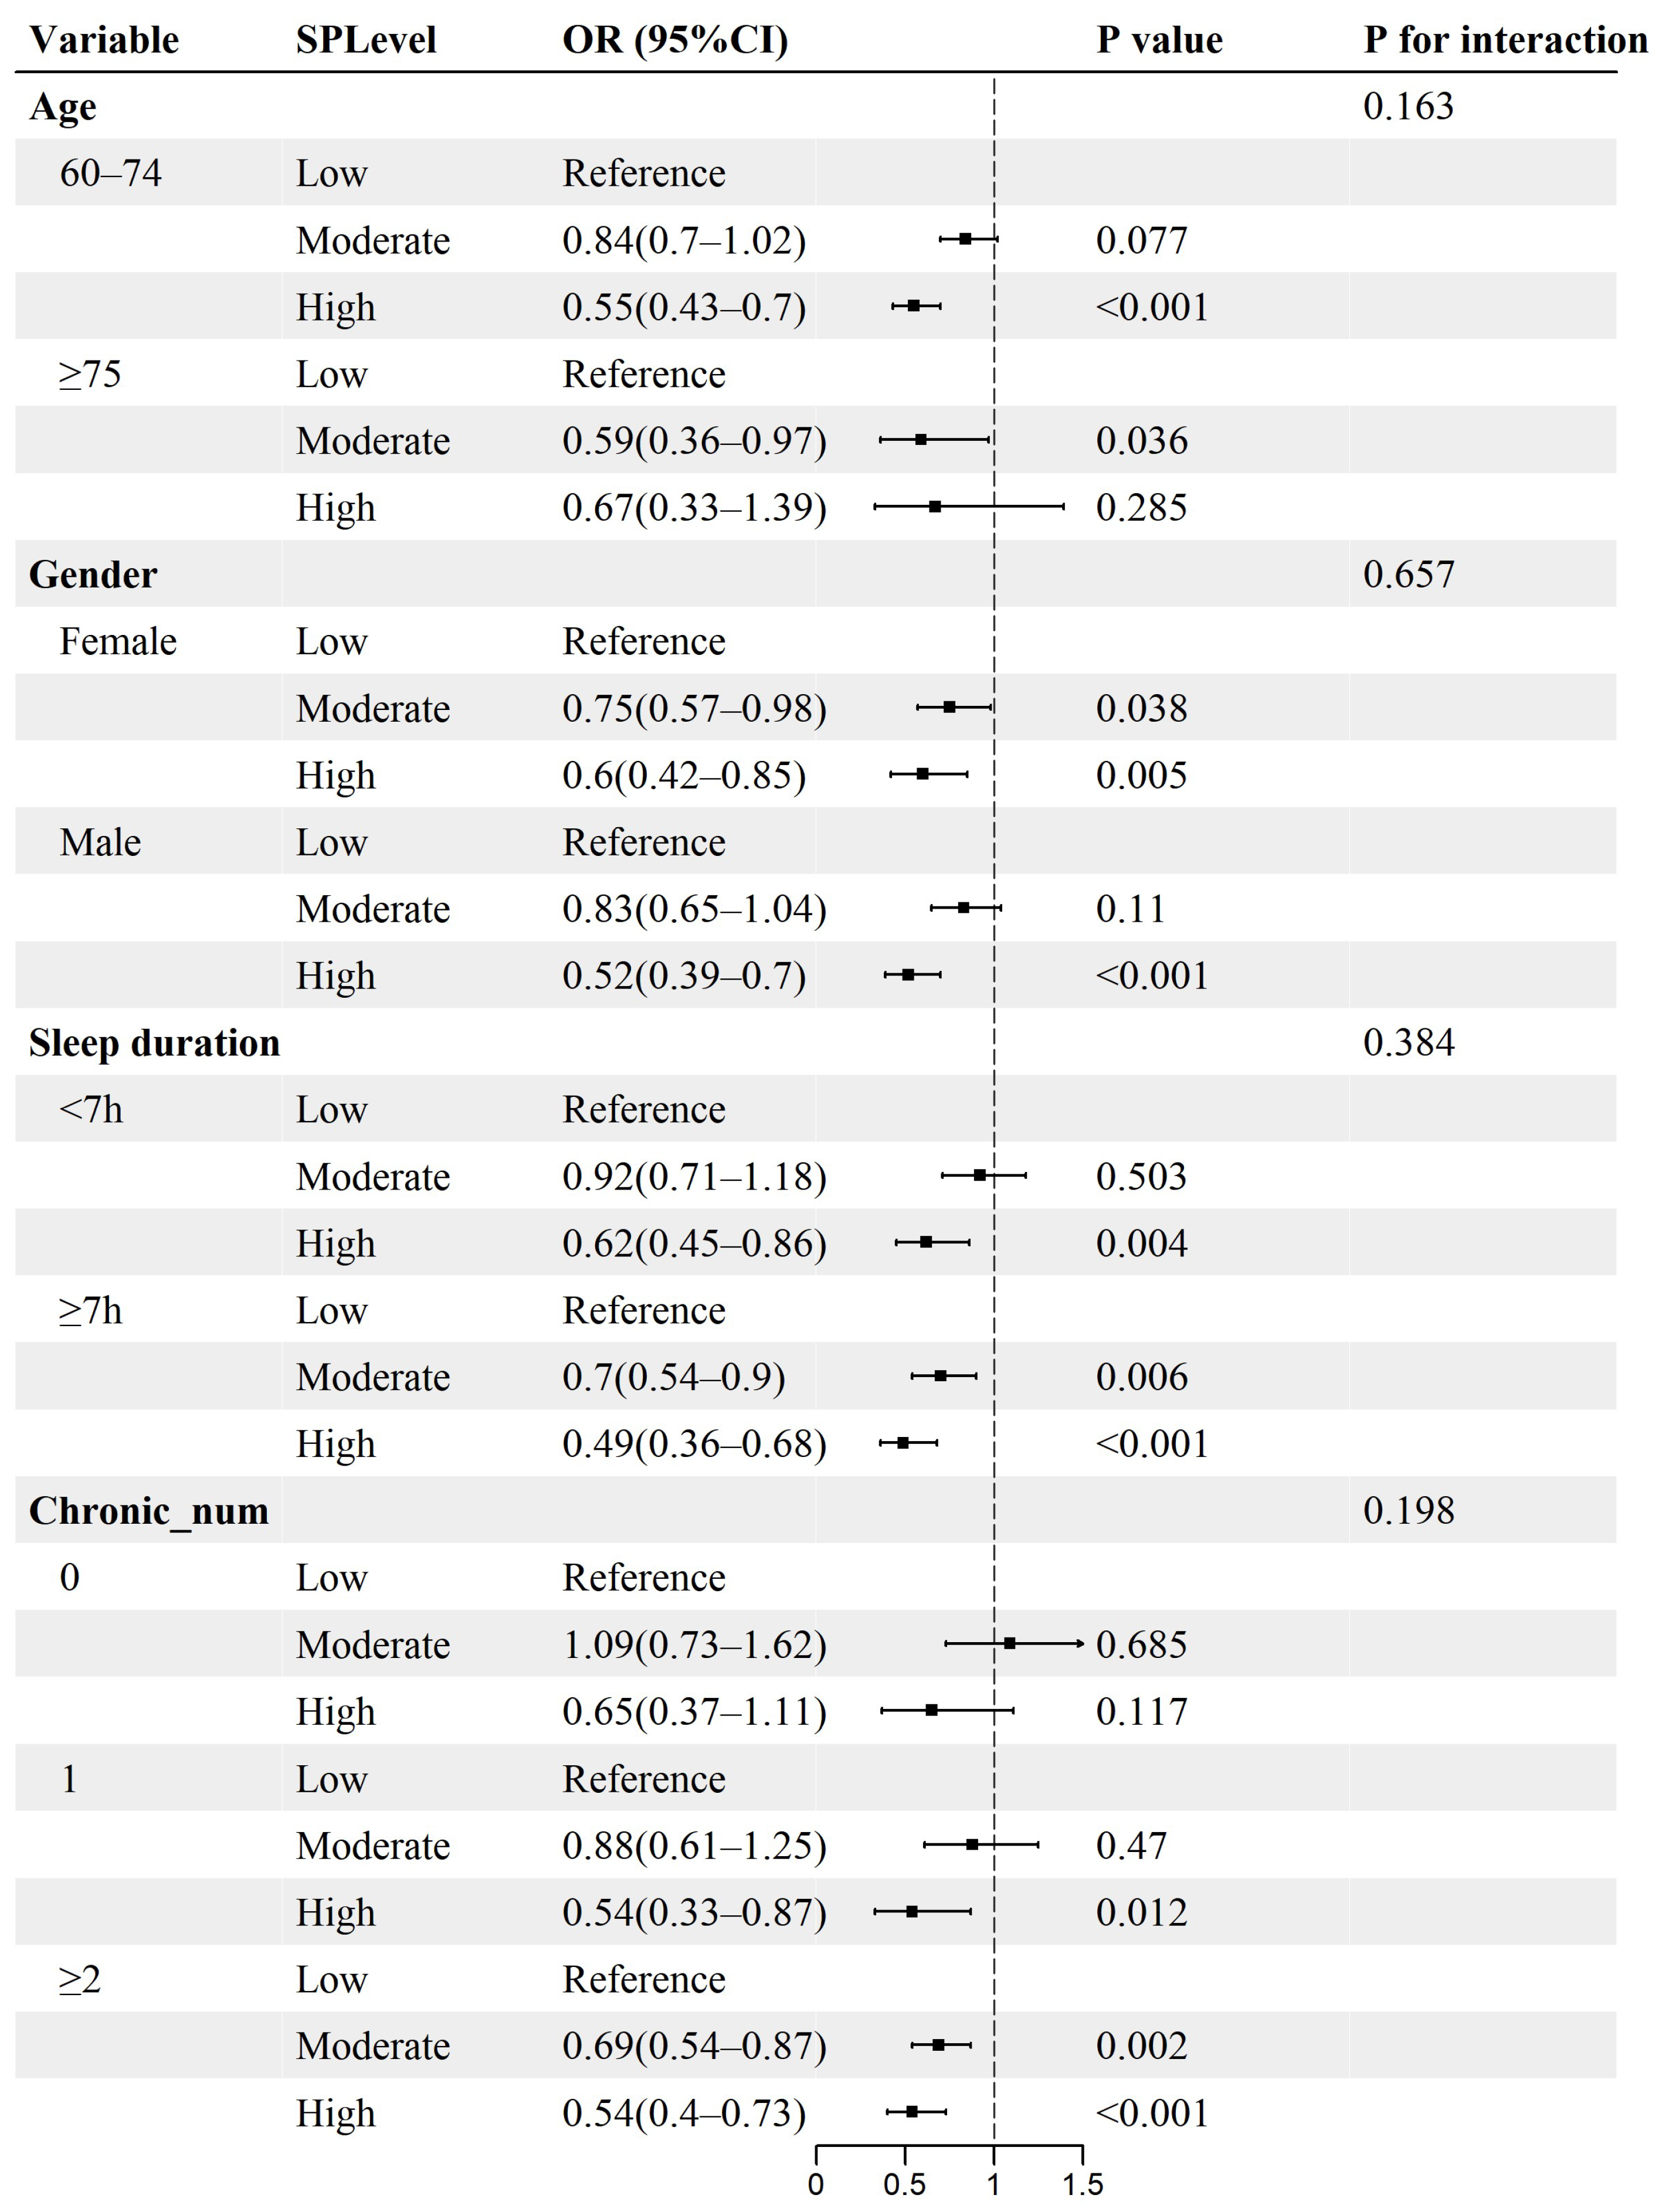
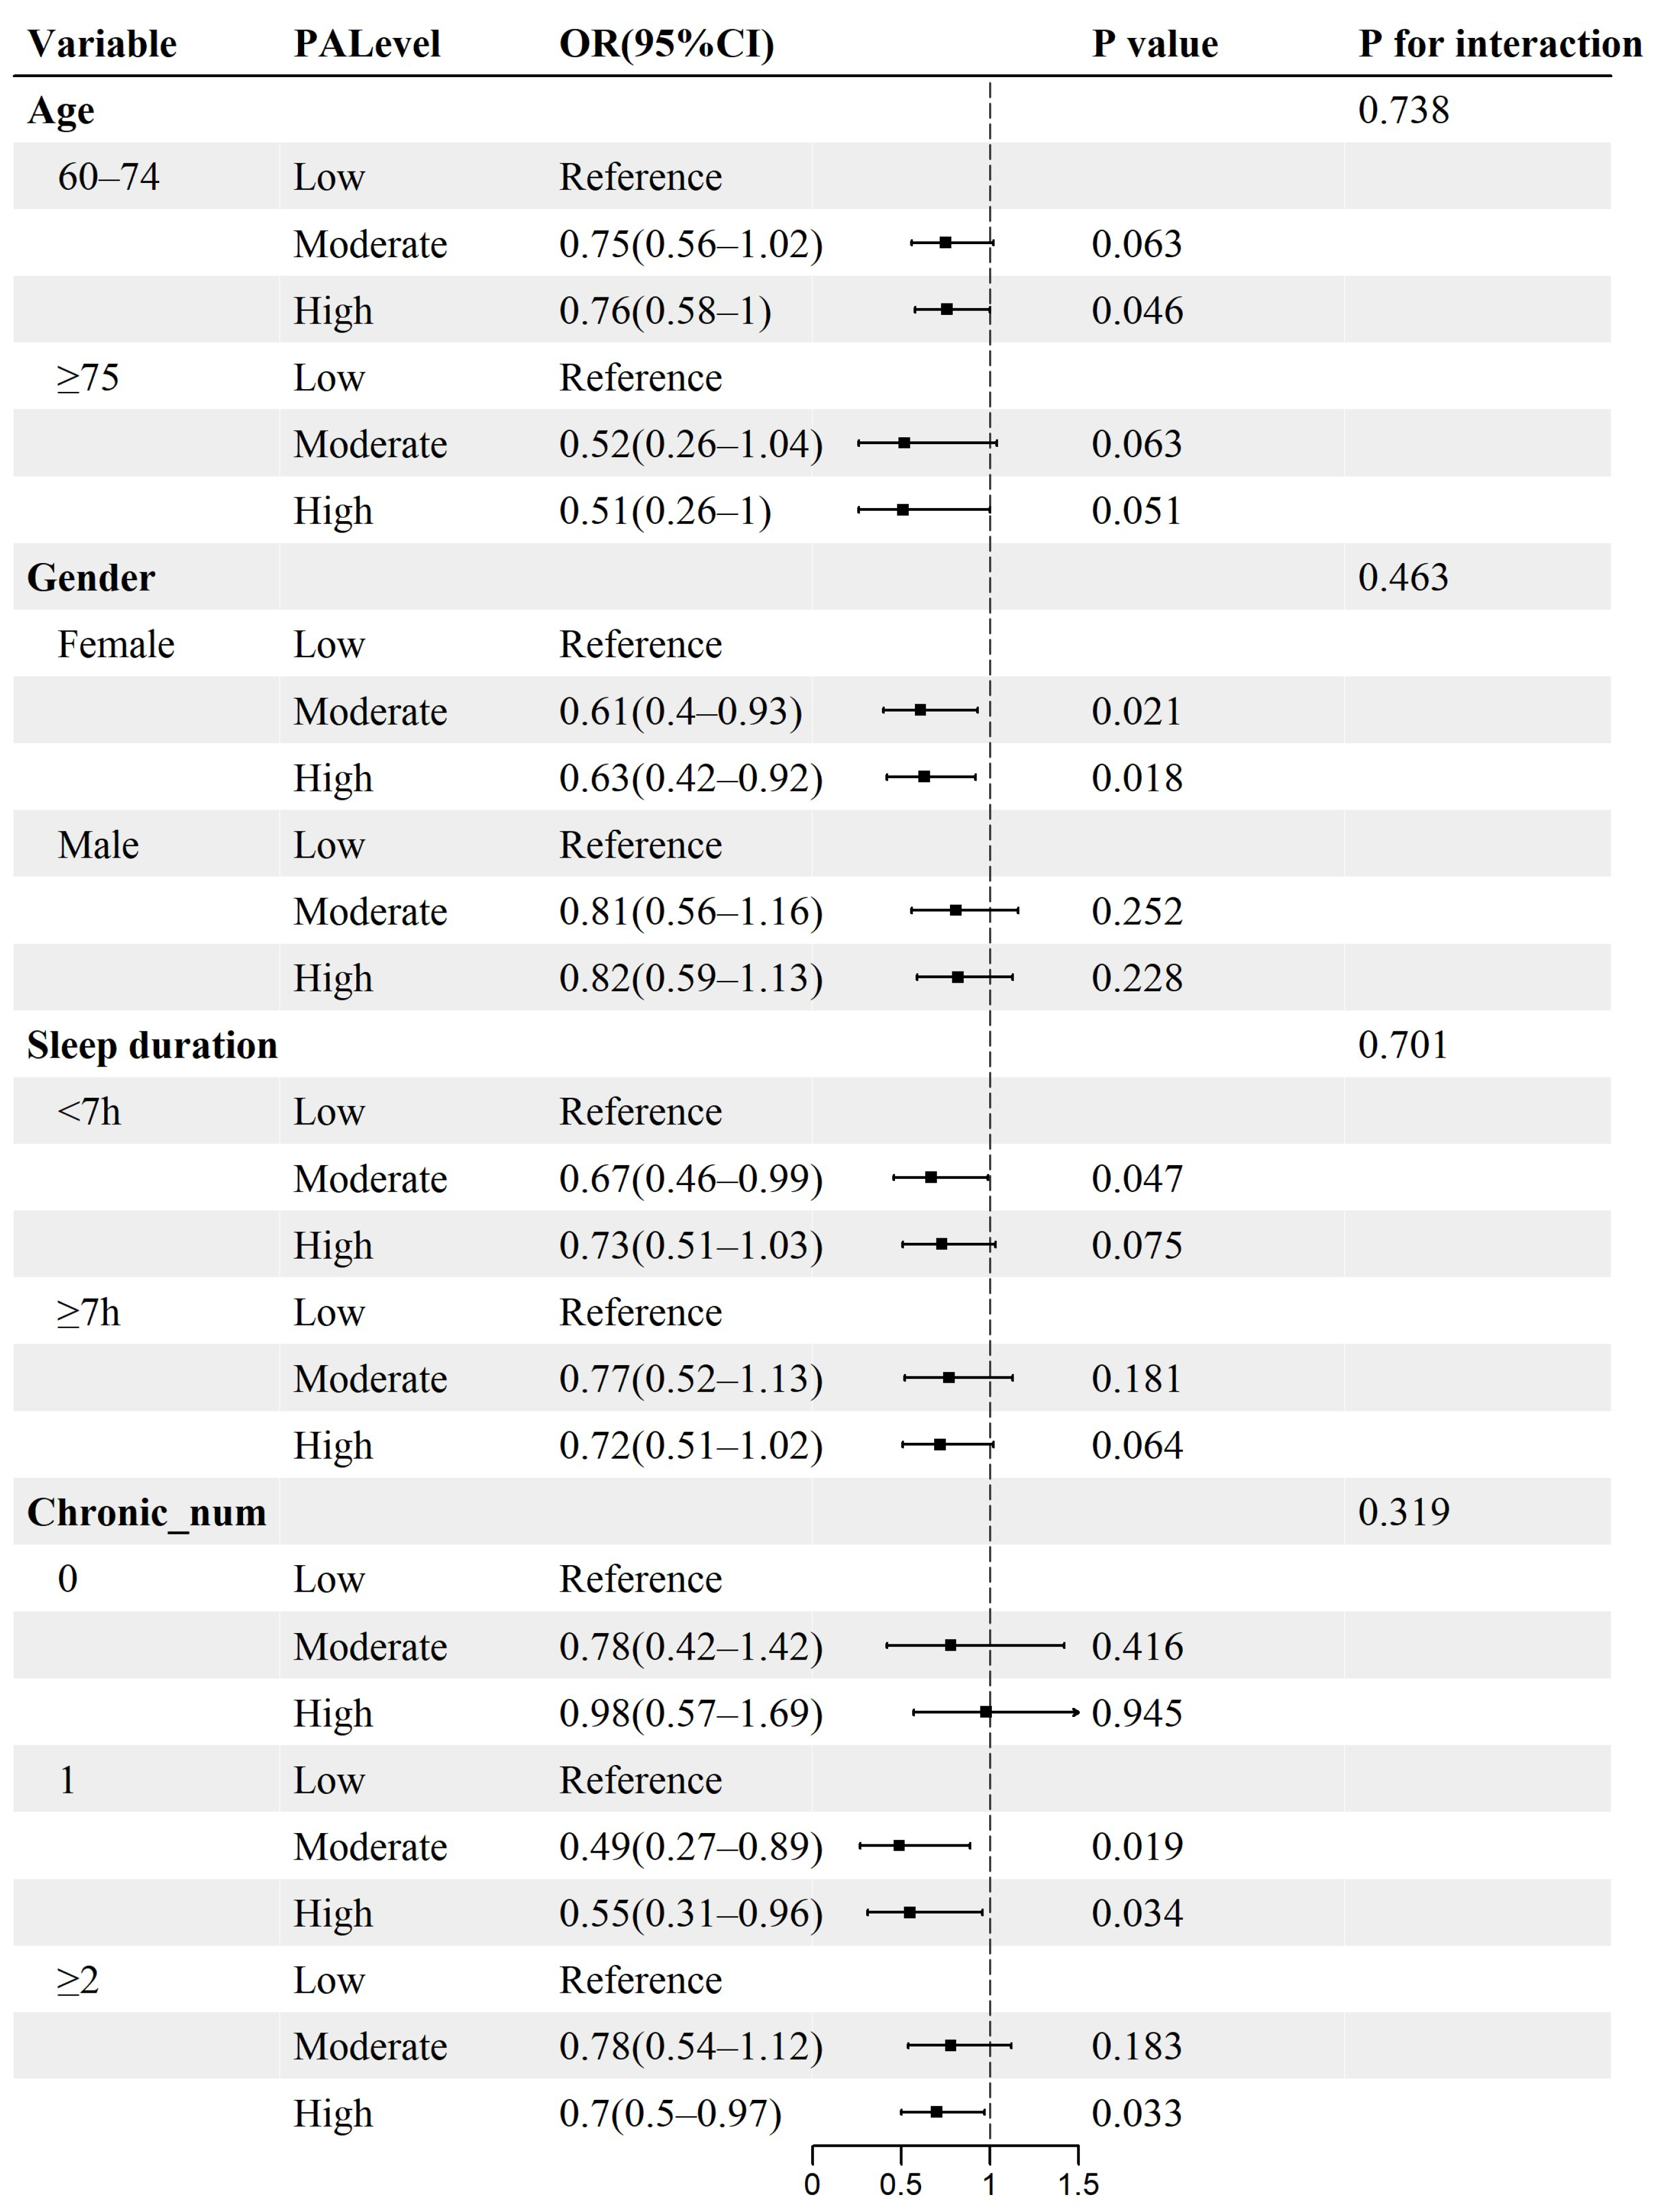
Subgroup analyses examined differences in the association between the levels of both SP and PA and IC decline across subgroups. Results showed no significant interactions when stratified by variables such as age, gender, sleep duration, and the number of chronic diseases (Figure 3 and Figure 4). These findings indicate that the association of social participation and physical activity levels with IC decline risk remained consistent across subgroups, with no significant effect modification observed (all p values for interaction > 0.05).

4. Discussion

This research explored the relationships between both social participation and physical activity and IC decline among older adults. The results suggest that elevated levels of SP and PA are significantly negatively correlated with IC impairment. The RCS model identified a significant negative dose–response relationship between levels of social participation and IC decline risk. Meanwhile, physical activity levels had a U-shaped association with this risk. Interaction analysis revealed no observed interaction between social engagement and physical activity with intrinsic capacity. Analyses of subgroups demonstrated consistent associations across subgroups. These findings underscore that social participation and physical activity may serve as important protective factors for delaying IC decline in later life.
Study results have shown that the incidence of impaired IC in Chinese older adults was relatively high at 71.5%, exceeding the results reported by Zhu et al. (69.6%) [41] and slightly lower than the combined detection rate of IC decline (73.7%) from a recent meta-analysis [42]. Based on the research, it was found that the impairment rates among the elderly in the sensory, psychological, vitality, cognition, and locomotion domains were 41.37%, 35.15%, 23.64%, 19.16%, and 16.13%, respectively. Impairment rates in the sensory, psychological, and vitality domains were higher than those reported by Vinothini et al. [17], while impairment rates in the cognition and locomotion domains were largely consistent. These disparities between the research findings are likely due to differences in study design, sample size, sampling methods, or measurement tools.
Our findings demonstrate a notable negative correlation between SP levels and IC decline risk. Higher SP levels correlate with a reduced risk of IC decline, particularly in the domains of locomotion, psychology, and cognition. This result aligns with earlier studies that have confirmed the positive role of social participation in protecting the functional health of elderly people. Yan et al. found that active involvement in social life can lessen the risk of being limited in actions for people with arthritis [43]. Research by Cheung [44] and Chen et al. [45] showed that participation in social activities not only lowers the risk of dementia and enhances cognitive function but is also associated with a lower risk of depressive symptoms. This connection can be understood from multiple perspectives. Social activities broaden social networks, boost social support, and improve opportunities to access external resources [46]. In the course of interacting with the outside world, the negative psychological impacts resulting from occupational identity transition may be mitigated by enhancing cognitive reserves and achieving self-worth [37] in older adults, such as engaging in community affairs or volunteer activities [47,48,49]. Moreover, involvement in social activities is more likely to sustain independence in ADL of seniors and lower their risk of developing motor–cognitive syndrome [50,51]. At the same time, social interactions usually involve the joint functioning of multiple brain functions, such as communication, thinking, and learning. This cognitive engagement could benefit the preservation of flexibility and reactivity in the brain [52]. Based on earlier studies, if an individual participates in social activities for a long period and is active in them, it may promote a range of healthy behaviors, thereby generating positive health effects across multiple functional domains and reducing the risk of IC decline [53,54]. These findings suggest that strengthening social participation or increasing the accessibility of meaningful activities may help maintain or postpone older people’s IC decline.
This study indicates that physical activity exerts a positive influence on intrinsic capacity, primarily manifested in the domains of exercise, vitality, and cognition. However, unlike the dose–response pattern presented by social participation, PA levels exhibited a U-shaped association with IC decline. This contrasts with earlier findings by Zhou et al. and Luis et al. [34,55,56], who reported a positive relationship between PA and IC—meaning higher levels of PA were linked to better IC. This differs to some extent from previous findings, as our results suggest the greatest benefits for IC are associated with moderate PA, rather than with higher levels, which do not necessarily result in better IC. Aging brings about various physiological changes, including declines in muscle mass, bone density and recovery function [57,58]. Physical exercise is good for postponing loss of muscle strength and bone mineral density. However, individuals vary in how their bodies physiologically adapt to physical activity. When the intensity or duration goes above the physiological tolerance threshold of older adults for exertion, it may cause adverse events such as muscle strains or joint injuries [59], and increase the risk of ADL-limitations. Additionally, some older people objectively lack the physical capacity to engage in high-intensity or prolonged activities [60] due to multiple chronic conditions or other health issues. It may further elevate the probability of exercise-related injuries [61,62,63]. Besides the musculoskeletal system, PA may also affect IC through mechanisms related to the brain health. Inadequate PA may lead to decreased cerebral blood flow and insufficient neurotrophic factor secretion. On the other hand, excessive PA may generate oxidative stress and trigger inflammatory responses within the brain, as reported in other studies [64]. These effects may reduce neural network activity levels [65] and increase IC impairment risk, which aligns with findings from Zhang et al. [66]. Previous studies suggested that moderate PA may enhance balance and cognitive function. In contrast, higher PA may not result in sustained benefits and it could even cause dyspnea and mobility problems [67,68]. To conclude, physical activity contributes immensely to maintaining IC in older adults. One way to promote the health and well-being of elderly people, improve the musculoskeletal system and optimize neuroprotective mechanisms is through moderate exercise [69]. This certainly can provide a basis for public health interventions in an aging society.
The interaction model analysis showed that there was no significant interaction between social participation, physical activity, and IC. However, in the joint distribution of social participation and physical activity, we found that groups characterized by higher social participation generally exhibited a lower overall risk, and the lowest risk of IC decline was observed among individuals with high social participation and low physical activity. This pattern was consistent with the associations suggested by the nonlinear relationship identified in the present study. These findings indicate that social participation may play a more stable and broader role than physical activity in maintaining IC. Intrinsic capacity is not a single indicator of physical function, but rather a multidimensional construct encompassing locomotion, vitality, cognition, psychological well-being, and sensory function. Previous studies have shown that the association between social participation and health in older adults may operate through mechanisms such as social support, social cohesion, and broader community connectedness, and may simultaneously influence both mental and physical health [70,71]. In addition, higher levels of social participation have been associated not only with the maintenance of intact IC, but also with a greater likelihood of intrinsic capacity recovery and a lower risk of decline [14,72]. In contrast, although physical activity is generally beneficially associated with IC, its effects appear to be more domain-specific and context-dependent, with stronger associations observed mainly in specific domains such as locomotion and vitality [34].
The results of the study are robust in subgroup analyses. The study indicated that elevated SP levels were linked to a reduced risk of IC decline. This association was present irrespective of age, gender, sleep duration, and chronic_num subgroups. Nonetheless, elevated levels of PA correlate with a greater risk of IC impairment in the majority of subgroups. Further stratification indicates that there are differences in the association between SP levels and IC decline risk among older adults, according to gender and sleep duration. When SP is at a high level, older men tend to face a lower IC risk than their female counterparts, possibly due to physiological differences between the sexes. Insufficient sleep may also trigger negative activation in regions of the brain that affect cognitive functions related to planning and memory in elderly people [73,74]. Additionally, the connection of PA with the outcome of IC impairment risk appears to be more stable among women and those with a heavier burden of chronic diseases. Women may restrict their physical activity engagement to a greater extent than men due to taking on extra family responsibilities [75]. Moreover, physical pain caused by chronic diseases may limit the daily activity participation of elderly people, which could create an adverse cycle through cumulative tissue damage [76,77]. Thus, appropriately extending sleep duration and strengthening chronic disease management may alleviate the limitations of social and physical activity in older adults, promoting the maintenance of IC and improving quality of life.
As an initial note, this study has certain limitations. The first limitation of the research sample is that it only includes people aged 60 and above in China. Thus, if we summarize the conclusion, the findings may not be generalizable due to demographic characteristics. Moreover, the two main variables, SP and PA levels, were both self-reported through questionnaires. This may suffer from recall bias and social desirability effects. Finally, given that the current study is based on cross-sectional data from CHARLS 2015, its conclusion implies that social participation and physical activity are related to IC decline, and are not necessarily causative. Reverse causation may exist if older adults with poor IC may be less inclined to participate in activities. In addition, the lack of longitudinal data restricts our assessment of dynamic and long-term impacts. Future research should focus on longitudinal studies to further validate the long-term association and potential causal mechanisms between social participation, physical activity, and declines in IC.

5. Conclusions

This study examined the relationships between social participation, physical activity, and IC decline. The findings indicated that both social participation and physical activity were independently associated with overall IC and several IC domains in older adults. Older adults with higher levels of social participation had a lower risk of IC decline, while those engaging in moderate physical activity were also less likely to experience IC decline. No significant interaction was observed between social participation and physical activity. However, the joint distribution further suggested that different combinations of social participation and physical activity were associated with differences in IC decline. Compared with physical activity, social participation may play a more stable and broader role in maintaining intrinsic capacity. Therefore, attention to social participation and physical activity intensity in older adults may help delay IC decline and promote healthy aging.

Supplementary Materials

The following supporting information can be downloaded at https://www.mdpi.com/article/10.3390/healthcare14070936/s1: Table S1: Intrinsic capacity evaluation standard; Table S2: Baseline characteristics of participants excluded and retained in the study; Table S3: Associations between social participation and five subdomains of intrinsic capacity; Table S4: Associations between physical activity and five subdomains of intrinsic capacity; Figure S1: Nonlinear relationships between social participation and physical activity levels and intrinsic capacity decline; Figure S2: Nonlinear relationships between social participation levels and five subdomains of intrinsic capacity; Figure S3: Nonlinear relationships between physical activity levels and five subdomains of intrinsic capacity.

Author Contributions

L.H.: Conceptualization, data curation, methodology, validation, software, resources, investigation, formal analysis, visualization, funding acquisition, supervision, validation, writing—original draft preparation, writing—review and editing. J.T.: Conceptualization, data curation, methodology, formal analysis, funding acquisition, visualization, writing—original draft preparation, writing—review and editing. C.P.: Conceptualization, methodology, funding acquisition, resources, investigation, formal analysis, project administration, supervision, writing—original draft preparation, writing—review and editing. All authors have read and agreed to the published version of the manuscript.

Funding

This work was supported by the Research on Comprehensive Evaluation of Private Hospitals Based on Government Supervision (CSTB2023TFII-OIX0003) and the Research Project on Closed-Loop Management of Focused Health Based on the Whole Life Cycle (cstc2021jsyj-zzysbAX0066).

Institutional Review Board Statement

Ethical review and approval is not required for the study on human participants, in accordance with the local legislation and institutional requirements. Our study used secondary data from the China Health and Retirement Longitudinal Study (CHARLS). In accordance with Article 32 of the Measures for the Ethical Review of Research Involving Human Beings in Life Sciences and Medicine issued by the National Health Commission of the People’s Republic of China in 2023, ethical review can be waived for studies using publicly available, anonymized secondary data that cause no harm to individuals and do not involve sensitive personal information or commercial interests. Since the CHARLS data has been reviewed and approved by the Ethics Committee of Peking University (the undertaking unit of the project) before being made public (IRB00001052-11015), our study, which is based on this publicly available secondary data for statistical analysis without involving any direct contact with human participants or collection of new human-related data, meets the conditions for exemption from ethical review and approval as specified in the above-mentioned local and national legislation.

Informed Consent Statement

Written informed consent from the patients/participants or patients/participants’ legal guardians/next of kin was not required to participate in this study, in accordance with the national legislation and the institutional requirements.

Data Availability Statement

This research relies on datasets that are accessible to the public. The data utilized and examined in this research originates from CHARLS (http://charls.pku.edu.cn (accessed on 15 September 2025)), which is a longitudinal survey that represents the nation and is carried out by the Institute of Social Science Surveys at Peking University.

Acknowledgments

We extend our gratitude to the CHARLS team for supplying these resources, as well as to all participants in the CHARLS survey for their significant contributions to research related to aging.

Conflicts of Interest

The authors declare that the research was conducted in the absence of any commercial or financial relationships that could be construed as a potential conflict. They have no conflicts of interest.

References

  1. Amuthavalli Thiyagarajan, J.; Mikton, C.; Harwood, R.H.; Gichu, M.; Gaigbe-Togbe, V.; Jhamba, T.; Pokorna, D.; Stoevska, V.; Hada, R.; Steffan, G.S.; et al. The UN Decade of healthy ageing: Strengthening measurement for monitoring health and wellbeing of older people. Age Ageing 2022, 51, afac147. [Google Scholar] [CrossRef] [PubMed]
  2. Hsiao, F.-Y.; Chen, L.-K. Intrinsic capacity assessment works—Let’s move on actions. Lancet Healthy Longev. 2024, 5, e448–e449. [Google Scholar] [CrossRef] [PubMed]
  3. United Nations. World Population Prospects; United Nations: New York, NY, USA, 2019. [Google Scholar]
  4. Yuenyongchaiwat, K.; Akekawatchai, C. Systemic Inflammation in Sarcopenia Alter Functional Capacity in Thai Community-dwelling Older People: A Preliminary Observational Study. Curr. Aging Sci. 2022, 15, 274–281. [Google Scholar] [CrossRef] [PubMed]
  5. Guo, L.; An, L.; Luo, F.; Yu, B. Social isolation, loneliness and functional disability in Chinese older women and men: A longitudinal study. Age Ageing 2020, 50, 1222–1228. [Google Scholar] [CrossRef]
  6. Rudnicka, E.; Napierała, P.; Podfigurna, A.; Męczekalski, B.; Smolarczyk, R.; Grymowicz, M. The World Health Organization (WHO) approach to healthy ageing. Maturitas 2020, 139, 6–11. [Google Scholar] [CrossRef]
  7. Cesari, M.; Keeffe, J.; Dent, E.; Kondo, N.; Laiteerapong, A.; Izquierdo, M.; Lloyd-Sherlock, P.; Gutiérrez-Robledo, L.M.; McMahon, C.; Ndegwa, S. Integrated Care for Older People (ICOPE): Handbook: Guidance for Person-Centred Assessment and Pathways in Primary Care; World Health Organization: Geneva, Switzerland, 2019. [Google Scholar]
  8. Lu, W.-H.; Rolland, Y.; Guyonnet, S.; de Souto Barreto, P.; Vellas, B. Reference centiles for intrinsic capacity throughout adulthood and their association with clinical outcomes: A cross-sectional analysis from the INSPIRE-T cohort. Nat. Aging 2023, 3, 1521–1528. [Google Scholar] [CrossRef]
  9. Tay, L.; Tay, E.L.; Mah, S.M.; Latib, A.; Koh, C.; Ng, Y.S. Association of Intrinsic Capacity with Frailty, Physical Fitness and Adverse Health Outcomes in Community-Dwelling Older Adults. J. Frailty Aging 2023, 12, 7–15. [Google Scholar] [CrossRef]
  10. Muneera, K.; Muhammad, T.; Pai, M.; Ahmed, W.; Althaf, S. Associations between intrinsic capacity, functional difficulty, and fall outcomes among older adults in India. Sci. Rep. 2023, 13, 9829. [Google Scholar] [CrossRef]
  11. Yu, R.; Lai, D.; Leung, G.; Woo, J. Trajectories of Intrinsic Capacity: Determinants and Associations with Disability. J. Nutr. Health Aging 2023, 27, 174–181. [Google Scholar] [CrossRef]
  12. Zhou, W.; Guo, M.; Hu, B.; Jiang, Y.; Yao, Y. The effect of China’s Integrated Medical and Social Care Policy on functional dependency and care deficits in older adults: A nationwide quasi-experimental study. Lancet Healthy Longev. 2025, 6, 100697. [Google Scholar] [CrossRef]
  13. Sánchez-Sánchez, J.L.; Lu, W.-H.; Gallardo-Gómez, D.; del Pozo Cruz, B.; de Souto Barreto, P.; Lucia, A.; Valenzuela, P.L. Association of intrinsic capacity with functional decline and mortality in older adults: A systematic review and meta-analysis of longitudinal studies. Lancet Healthy Longev. 2024, 5, e480–e492. [Google Scholar] [CrossRef] [PubMed]
  14. Huang, Z.-T.; Lai, E.T.C.; Luo, Y.; Woo, J. Social determinants of intrinsic capacity: A systematic review of observational studies. Ageing Res. Rev. 2024, 95, 102239. [Google Scholar] [CrossRef] [PubMed]
  15. Beard, J.R.; Hanewald, K.; Si, Y.; Amuthavalli Thiyagarajan, J.; Moreno-Agostino, D. Cohort trends in intrinsic capacity in England and China. Nat. Aging 2025, 5, 87–98. [Google Scholar] [CrossRef] [PubMed]
  16. Yue, X.; Yuan, Q.; Zhou, R.; Wang, M. Social isolation, healthy lifestyle, and intrinsic capacity among older adults in China: A longitudinal study. J. Nutr. Health Aging 2025, 29, 100583. [Google Scholar] [CrossRef]
  17. Jayaraj, V.; Gnanasekaran, S.; Vb, Y.; Palani Selvam, M.; Rajendran, N.; Dutta, G.; Kumar, T.; Babu, C.; Rajendran, V. Estimating the prevalence of intrinsic capacity decline: A systematic review and meta-analysis using WHO’s integrated care of older people (ICOPE) screening tool. Arch. Gerontol. Geriatr. Plus 2024, 1, 100032. [Google Scholar] [CrossRef]
  18. Sun, J.; Amnatsatsue, K.; Srisuwan, P.; Kerdmongkol, P.; Nityasuddhi, D. Intrinsic Capacity of Chinese Community-Dwelling Older Adults Using WHO Integrated Care for Older People (ICOPE) Framework: Structural Equation Model Analysis. J. Prim. Care Community Health 2025, 16, 21501319251346433. [Google Scholar] [CrossRef]
  19. Jin, L.; Jing, F. Effects of activity participation and cognitive levels on depression in middle-aged and older adults with chronic illness: A national cross-sectional study. Front. Psychol. 2024, 15, 1415715. [Google Scholar] [CrossRef]
  20. Kikuchi, H.; Inoue, S.; Fukushima, N.; Takamiya, T.; Odagiri, Y.; Ohya, Y.; Amagasa, S.; Oka, K.; Owen, N. Social participation among older adults not engaged in full- or part-time work is associated with more physical activity and less sedentary time. Geriatr. Gerontol. Int. 2017, 17, 1921–1927. [Google Scholar] [CrossRef]
  21. Levasseur, M.; Richard, L.; Gauvin, L.; Raymond, E. Inventory and analysis of definitions of social participation found in the aging literature: Proposed taxonomy of social activities. Soc. Sci. Med. 2010, 71, 2141–2149. [Google Scholar] [CrossRef]
  22. Tcymbal, A.; Abu-Omar, K.; Hartung, V.; Bußkamp, A.; Comito, C.; Rossmann, C.; Meinzinger, D.; Reimers, A.K. Interventions simultaneously promoting social participation and physical activity in community living older adults: A systematic review. Front. Public Health 2022, 10, 1048496. [Google Scholar] [CrossRef]
  23. Torres, Z.; Tomás, J.M.; Sentandreu-Mañó, T.; Fernández, I.; Pla-Sanz, N. Social participation, loneliness, and physical inactivity over time: Evidence from SHARE. Int. Psychogeriatr. 2024, 36, 799–807. [Google Scholar] [CrossRef] [PubMed]
  24. Shao, Z.; Chen, Y.; Sun, S.; Wang, M. Association Between Multidimensional Social Participation and Hypertension Among Middle-Aged and Older Adults in China: A Cross-Sectional Analysis from the China Health and Retirement Longitudinal Study. J. Clin. Hypertens. 2025, 27, e70059. [Google Scholar] [CrossRef] [PubMed]
  25. Choi, E.; Han, K.-M.; Chang, J.; Lee, Y.J.; Choi, K.W.; Han, C.; Ham, B.-J. Social participation and depressive symptoms in community-dwelling older adults: Emotional social support as a mediator. J. Psychiatr. Res. 2021, 137, 589–596. [Google Scholar] [CrossRef] [PubMed]
  26. Cai, S. Does social participation improve cognitive abilities of the elderly? J. Popul. Econ. 2022, 35, 591–619. [Google Scholar] [CrossRef]
  27. Bone, J.K.; Bu, F.; Sonke, J.K.; Fancourt, D. Leisure engagement in older age is related to objective and subjective experiences of aging. Nat. Commun. 2024, 15, 1499. [Google Scholar] [CrossRef]
  28. Shi, H.; Hu, F.B.; Huang, T.; Schernhammer, E.S.; Willett, W.C.; Sun, Q.; Wang, M. Sedentary Behaviors, Light-Intensity Physical Activity, and Healthy Aging. JAMA Netw. Open 2024, 7, e2416300. [Google Scholar] [CrossRef]
  29. Jia, J.; Zhao, T.; Liu, Z.; Liang, Y.; Li, F.; Li, Y.; Liu, W.; Li, F.; Shi, S.; Zhou, C.; et al. Association between healthy lifestyle and memory decline in older adults: 10 year, population based, prospective cohort study. BMJ 2023, 380, e072691. [Google Scholar] [CrossRef]
  30. Bangsbo, J.; Blackwell, J.; Boraxbekk, C.J.; Caserotti, P.; Dela, F.; Evans, A.B.; Jespersen, A.P.; Gliemann, L.; Kramer, A.F.; Lundbye-Jensen, J.; et al. Copenhagen Consensus statement 2019: Physical activity and ageing. Br. J. Sports Med. 2019, 53, 856–858. [Google Scholar] [CrossRef]
  31. Huang, C.H.; Okada, K.; Matsushita, E.; Uno, C.; Satake, S.; Martins, B.A.; Kuzuya, M. The association of social frailty with intrinsic capacity in community-dwelling older adults: A prospective cohort study. BMC Geriatr. 2021, 21, 515. [Google Scholar] [CrossRef]
  32. Chen, X.L.; Li, J.; Sun, S.N.; Zhao, Q.Q.; Lin, S.R.; Wang, L.J.; Yang, Z.Q.; Ni, S.H.; Lu, L. Association Between Daily Internet Use and Intrinsic Capacity Among Middle-Aged and Older Adults in China: Large Prospective Cohort Study. J. Med. Internet Res. 2024, 26, e54200. [Google Scholar] [CrossRef]
  33. Fu, J.; Fu, S.; Wang, X.; Wang, X. The association between Internet use and intrinsic capacity among older adults in China: The mediating role of social participation. Public Health Nurs. 2024, 41, 1600–1611. [Google Scholar] [CrossRef]
  34. Zhou, M.; Kuang, L.; Hu, N. The Association between Physical Activity and Intrinsic Capacity in Chinese Older Adults and Its Connection to Primary Care: China Health and Retirement Longitudinal Study (CHARLS). Int. J. Environ. Res. Public Health 2023, 20, 5361. [Google Scholar] [CrossRef] [PubMed]
  35. Huang, Z.; Lai, E.T.C.; Woo, J. Contribution of physical activity to intrinsic capacity differs in USA, UK, Europe and China. J. Aging Res. Lifestyle 2025, 14, 100007. [Google Scholar] [CrossRef] [PubMed]
  36. Cheong, G.; Tov, W.; Choo, R.W.M.; Tan, M.; Lau, L.K.; Lim, W.S.; Ding, Y.Y.; Straughan, P.T. Exploring the relationship between intrinsic capacity and social participation in healthy ageing: Evidence from Singapore. J. Nutr. Health Aging 2025, 29, 100524. [Google Scholar] [CrossRef] [PubMed]
  37. Liu, M.; Chang, Y.; Zhao, S.; Guo, W.; Ji, X.; Liu, Y.; Ma, X.; Zhang, M.; Zhang, L. The effect of the interaction between intrinsic capacity and social support on the trajectories of activities of daily living in older adults. Geriatr. Nurs. 2024, 60, 231–240. [Google Scholar] [CrossRef]
  38. Zhao, Y.; Hu, Y.; Smith, J.; Strauss, J.; Yang, G. The China Health and Retirement Longitudinal Study (CHARLS). Int. J. Epidemiol. 2014, 43, 61–68. [Google Scholar] [CrossRef]
  39. Li, W.; Zhang, X.; Gao, H.; Tang, Q. Heterogeneous effects of socio-economic status on social engagement level among Chinese older adults: Evidence from CHARLS 2020. Front. Public Health 2024, 12, 1479359. [Google Scholar] [CrossRef]
  40. Hallal, P.C.; Victora, C.G. Reliability and validity of the International Physical Activity Questionnaire (IPAQ). Med. Sci. Sports Exerc. 2004, 36, 556. [Google Scholar] [CrossRef]
  41. Zhu, L.; Shen, X.; Shi, X.; Ouyang, X. Factors associated with intrinsic capacity impairment in hospitalized older adults: A latent class analysis. BMC Geriatr. 2024, 24, 494. [Google Scholar] [CrossRef]
  42. Liu, Y.; Du, Q.; Jiang, Y. Detection rate of decreased intrinsic capacity of older adults: A systematic review and meta-analysis. Aging Clin. Exp. Res. 2023, 35, 2009–2017. [Google Scholar] [CrossRef]
  43. Yan, Z.; Luan, X.; Meng, L.; Wu, Y.; Qu, W.; Zhang, S.; Wei, H.; Wu, S. Longitudinal relationship between social participation, depressive symptoms, and activity impairment among older patients with arthritis: A moderated mediation analysis. BMC Geriatr. 2024, 24, 139. [Google Scholar] [CrossRef]
  44. Cheung, E.S.L. Social Participation Patterns Among Community-Dwelling Older Adults Before and During the COVID-19 Pandemic: Roles of Community Social Cohesion and Health. Int. J. Aging Hum. Dev. 2025, 100, 184–209. [Google Scholar] [CrossRef] [PubMed]
  45. Chen, C.; Tian, Y.; Ni, L.; Xu, Q.; Hu, Y.; Peng, B. The influence of social participation and depressive symptoms on cognition among middle-aged and older adults. Heliyon 2024, 10, e24110. [Google Scholar] [CrossRef] [PubMed]
  46. Hashidate, H.; Shimada, H.; Fujisawa, Y.; Yatsunami, M. An Overview of Social Participation in Older Adults: Concepts and Assessments. Phys. Ther. Res. 2021, 24, 85–97. [Google Scholar] [CrossRef] [PubMed]
  47. Wang, X.; Guo, J.; Liu, H.; Zhao, T.; Li, H.; Wang, T. Impact of Social Participation Types on Depression in the Elderly in China: An Analysis Based on Counterfactual Causal Inference. Front. Public Health 2022, 10, 792765. [Google Scholar] [CrossRef]
  48. Zhao, L.; Wu, L. The Association between Social Participation and Loneliness of the Chinese Older Adults over Time—The Mediating Effect of Social Support. Int. J. Environ. Res. Public Health 2022, 19, 815. [Google Scholar] [CrossRef]
  49. Zhang, X.; Yang, Y.; He, L.; Wang, Z. Fading authority, rising depression: Occupational identity and mental health among China’s retired danwei leaders. Front. Psychiatry 2025, 16, 1663695. [Google Scholar] [CrossRef]
  50. Xie, B.; Ma, C. Effect of social participation on the development of physical frailty: Do type, frequency and diversity matter? Maturitas 2021, 151, 48–54. [Google Scholar] [CrossRef]
  51. Zhou, J.; Yang, Y.; Li, S.; Mao, N.; Chen, X.; Wang, D.; Zhang, Y.; Shi, X.; Li, J.; Gao, X.; et al. Patterns of social participation among older adults and their association with self-rated health: The mediating role of activities of daily living. Aging Clin. Exp. Res. 2025, 37, 221. [Google Scholar] [CrossRef]
  52. Dai, L.; Tang, Y.; Guo, Y.; Lai, X.; Wang, X.; Li, B. The association between exercise, activities, and frailty in older Chinese adults: A cross-sectional study based on the Chinese Longitudinal Healthy Longevity Survey (CLHLS) data. BMC Geriatr. 2025, 25, 131. [Google Scholar] [CrossRef]
  53. Sommerlad, A.; Kivimäki, M.; Larson, E.B.; Röhr, S.; Shirai, K.; Singh-Manoux, A.; Livingston, G. Social participation and risk of developing dementia. Nat. Aging 2023, 3, 532–545. [Google Scholar] [CrossRef]
  54. Samtani, S.; Mahalingam, G.; Lam, B.C.P.; Lipnicki, D.M.; Lima-Costa, M.F.; Blay, S.L.; Castro-Costa, E.; Shifu, X.; Guerchet, M.; Preux, P.-M.; et al. Associations between social connections and cognition: A global collaborative individual participant data meta-analysis. Lancet Healthy Longev. 2022, 3, e740–e753. [Google Scholar] [CrossRef] [PubMed]
  55. Ma, L. Physical activity, sedentary behaviour, and intrinsic capacity at older ages: Get active! Lancet Healthy Longev. 2025, 6, 100687. [Google Scholar] [CrossRef] [PubMed]
  56. Sánchez-Sánchez, J.L.; Ortolá, R.; Banegas, J.R.; Lucia, A.; Rodríguez-Artalejo, F.; Sotos-Prieto, M.; Valenzuela, P.L. Association between physical activity and sedentary behaviour and changes in intrinsic capacity in Spanish older adults (Seniors-ENRICA-2): A prospective population-based study. Lancet Healthy Longev. 2025, 6, 100681. [Google Scholar] [CrossRef] [PubMed]
  57. Militello, R.; Luti, S.; Gamberi, T.; Pellegrino, A.; Modesti, A.; Modesti, P.A. Physical Activity and Oxidative Stress in Aging. Antioxidants 2024, 13, 557. [Google Scholar] [CrossRef]
  58. Cheng, L.; Wang, S. Correlation between bone mineral density and sarcopenia in US adults: A population-based study. J. Orthop. Surg. Res. 2023, 18, 588. [Google Scholar] [CrossRef]
  59. Zhu, J.; Zhu, T.; Lai, K.; Lv, Z.; Hu, C.; Lai, C.; Su, L. Physical activity levels and musculoskeletal disease risk in adults aged 45 and above: A cross-sectional study. BMC Public Health 2024, 24, 2964. [Google Scholar] [CrossRef]
  60. Tan, K.H.L.; Siah, C.J.R. Effects of low-to-moderate physical activities on older adults with chronic diseases: A systematic review and meta-analysis. J. Clin. Nurs. 2022, 31, 2072–2086. [Google Scholar] [CrossRef]
  61. Liu, D.; Pan, Y.; Wang, J.; Shen, S.; Zhao, X. Relationship between different physical activity parameters and cognitive impairment in middle-aged and older adults: Insights from a 4-year longitudinal study. BMC Psychol. 2025, 13, 274. [Google Scholar] [CrossRef]
  62. Felipe, S.G.; Printes, C.B.; Sato, D.K.; Baptista, R.R. Impact of a multicomponent physical exercise program on intrinsic capacity in community-dwelling older adults. PeerJ 2025, 13, e19017. [Google Scholar] [CrossRef]
  63. Sherrington, C.; Fairhall, N.J.; Wallbank, G.K.; Tiedemann, A.; Michaleff, Z.A.; Howard, K.; Clemson, L.; Hopewell, S.; Lamb, S.E. Exercise for preventing falls in older people living in the community. Cochrane Database Syst. Rev. 2019, 2019, CD012424. [Google Scholar] [CrossRef]
  64. Chen, H.; Cao, Z.; Zhang, J.; Li, D.; Wang, Y.; Xu, C. Accelerometer-Measured Physical Activity and Neuroimaging-Driven Brain Age. Health Data Sci. 2025, 5, 0257. [Google Scholar] [CrossRef] [PubMed]
  65. Bodensohn, L.; Maurer, A.; Daamen, M.; Upadhyay, N.; Werkhausen, J.; Lohaus, M.; Manunzio, U.; Manunzio, C.; Radbruch, A.; Attenberger, U.; et al. Inverted U-shape-like functional connectivity alterations in cognitive resting-state networks depending on exercise intensity: An fMRI study. Brain Cogn. 2024, 177, 106156. [Google Scholar] [CrossRef] [PubMed]
  66. Zhang, L.; Chen, W.; Miao, H.; Zou, T.; Xiang, X.; Wu, R.; Zhou, X. Association between physical activity levels and mild cognitive impairment in Chinese older adults: A cross-sectional study from the China health and retirement longitudinal study. Front. Public Health 2025, 13, 1564544. [Google Scholar] [CrossRef] [PubMed]
  67. Carta, M.G.; Cossu, G.; Pintus, E.; Zoccheddu, R.; Callia, O.; Conti, G.; Pintus, M.; Gonzalez, C.I.A.; Massidda, M.V.; Mura, G.; et al. Active elderly and health—Can moderate exercise improve health and wellbeing in older adults? Protocol for a randomized controlled trial. Trials 2021, 22, 331. [Google Scholar] [CrossRef]
  68. Ni, Z.; Zhu, X.; Shen, Y.; Zhu, X.; Xie, S.; Yang, X. Effects of activities participation on frailty of older adults in China. Front. Public Health 2024, 12, 1483166. [Google Scholar] [CrossRef]
  69. Izquierdo, M.; Duque, G.; Morley, J.E. Physical activity guidelines for older people: Knowledge gaps and future directions. Lancet Healthy Longev. 2021, 2, e380–e383. [Google Scholar] [CrossRef]
  70. Douglas, H.; Georgiou, A.; Westbrook, J. Social participation as an indicator of successful aging: An overview of concepts and their associations with health. Aust. Health Rev. 2017, 41, 455–462. [Google Scholar] [CrossRef]
  71. Cunha, C.; Voss, G.; Andrade, R.; Delerue-Matos, A. Is Formal Social Participation Associated with Cognitive Function in Middle-Aged and Older Adults? A Systematic Review with Meta-Analysis of Longitudinal Studies. Behav. Sci. 2024, 14, 262. [Google Scholar] [CrossRef]
  72. Xie, G.; Focacci, C.N.; Li, J.; Wang, R.; Chen, G. Association of social participation with progression and reversion of intrinsic capacity in older adults: Based on multistate model. J. Nutr. Health Aging 2025, 29, 100719. [Google Scholar] [CrossRef]
  73. Mi, Y.; Lei, X. Sleep loss and lack of social interaction: A summary interview. Brain-Appar. Commun. A J. Bacomics 2023, 2, 2163593. [Google Scholar] [CrossRef]
  74. Mi, Y.; Duan, H.; Xu, Z.; Lei, X. The Impact of Sleep Deprivation on Brain Networks in Response to Social Evaluation Tasks. Brain Sci. 2023, 13, 1122. [Google Scholar] [CrossRef]
  75. van Wyk, P.M.; Seguin, H.; Dionigi, R.A.; Weir, P.L.; Horton, S. Women participating in sport: Tensions rising from negotiations of aging, gender norms, and personal responsibility for health in later life. Front. Sports Act. Living 2025, 7, 1655912. [Google Scholar] [CrossRef]
  76. Calderón-Larrañaga, A.; Vetrano, D.L.; Ferrucci, L.; Mercer, S.W.; Marengoni, A.; Onder, G.; Eriksdotter, M.; Fratiglioni, L. Multimorbidity and functional impairment–bidirectional interplay, synergistic effects and common pathways. J. Intern. Med. 2019, 285, 255–271. [Google Scholar] [CrossRef]
  77. Cai, D.; Zeng, Y.; Chen, M.; Zhong, Y.; Quan, Y.; Ye, M.; Huang, X. Association between sleep duration and disability in activities of daily living among Chinese older adults: A nationwide observational study. Front. Public Health 2025, 1, 1580101. [Google Scholar] [CrossRef]
Figure 1. Flowchart of sample selection.
Healthcare 14 00936 g001
Figure 2. Nonlinear relationship between activity participation levels and risk of intrinsic capacity decline. Note: (A) The red solid line represents the estimated odds ratios (ORs) for the risk of IC decline across different levels of social participation, with the red shaded area indicating the corresponding 95% confidence intervals (CIs). (B) The blue solid line represents the estimated ORs for the risk of IC decline across different levels of physical activity, with the blue shaded area indicating the corresponding 95% CIs. P for overall and P for nonlinear indicate the significance of the overall association and the nonlinear association, respectively.
Healthcare 14 00936 g002
Figure 3. Association between social participation levels and risk of intrinsic capacity decline stratified by different factors. OR, odds ratio; CI, confidence interval. Reference, low-level group.
Healthcare 14 00936 g003
Figure 4. Association between physical activity levels and risk of intrinsic capacity decline stratified by different factors. OR, odds ratio; CI, confidence interval. Reference, low-level group.
Healthcare 14 00936 g004
Table 1. Participants demographics and baseline characteristics.
CharacteristicOverall
N = 3502
IC Impairmentχ2p-Value
No
N = 999
Yes
N = 2503
Age, n (%) 45.94<0.001
60–742910 (83.1%)898 (89.9%)2012 (80.4%)
≥75592 (16.9%)101 (10.1%)491 (19.6%)
Gender, n (%) 89.65<0.001
Female1744 (49.8%)371 (37.1%)1373 (54.9%)
Male1758 (50.2%)628 (62.9%)1130 (45.1%)
Marital status, n (%) 34.69<0.001
Partnered2861 (81.7%)877 (87.8%)1984 (79.3%)
Unpartnered641 (18.3%)122 (12.2%)519 (20.7%)
Education, n (%) 219.09<0.001
Below primary school2029 (57.9%)391 (39.1%)1638 (65.4%)
Primary school806 (23.1%)300 (30.0%)506 (20.2%)
Middle school450 (12.8%)200 (20.0%)250 (10.0%)
High school and above217 (6.2%)108 (10.8%)109 (4.4%)
Residence, n (%) 72.53<0.001
Rural2290 (65.4%)545 (54.6%)1745 (69.7%)
Urban1212 (34.6%)454 (45.4%)758 (30.3%)
Currently smoking, n (%) 8.400.004
No2513 (71.8%)682 (68.3%)1831 (73.2%)
Yes989 (28.2%)317 (31.7%)672 (26.8%)
Currently drinking, n (%) 40.44<0.001
No2368 (67.6%)596 (59.7%)1772 (70.8%)
Yes1134 (32.4%)403 (40.3%)731 (29.2%)
Sleep duration, n (%) 26.92<0.001
˂7 h1921 (54.9%)479 (47.9%)1442 (57.6%)
≥7 h1581 (45.1%)520 (52.1%)1061 (42.4%)
Chronic_num, n (%) 69.15<0.001
0554 (15.8%)231 (23.1%)323 (12.9%)
1811 (23.2%)251 (25.1%)560 (22.4%)
≥22137 (61.0%)517 (51.8%)1620 (64.7%)
BMI, n (%) 38.21<0.001
Normal weight1780 (50.8%)496 (49.6%)1284 (51.3%)
Underweight268 (7.7%)41 (4.1%)227 (9.1%)
Overweight1065 (30.4%)359 (35.9%)706 (28.2%)
Obese389 (11.1%)103 (10.3%)286 (11.4%)
Health insurance, n (%) 12.67<0.001
No292 (8.3%)57 (5.7%)235 (9.4%)
Yes3210 (91.7%)942 (94.3%)2268 (90.6%)
SP level, n (%) 71.13<0.001
Low level1730 (49.4%)406 (40.6%)1324 (52.9%)
Moderate level1252 (35.8%)373 (37.3%)879 (35.1%)
High level520 (14.8%)220 (22.0%)300 (12.0%)
PA level, n (%) 22.23<0.001
Low level539 (15.4%)109 (10.9%)430 (17.2%)
Moderate level911 (26.0%)283 (28.3%)628 (25.1%)
High level2052 (58.6%)607 (60.8%)1445 (57.7%)
Table 2. Association between social participation levels and intrinsic capacity decline.
VariablesSocial ParticipationModel 1
OR (95%CI)
p-ValueModel 2
OR (95%CI)
p-ValueModel 3
OR (95%CI)
p-Value
Social participationLow levelREF REF REF
Moderate level0.72 (0.61, 0.85)<0.0010.78 (0.66, 0.93)0.0050.80 (0.67, 0.95)0.012
High level0.42 (0.34, 0.51)<0.0010.53 (0.43, 0.66)<0.0010.56 (0.45, 0.70)<0.001
Note: Model 1 was a crude model. Model 2 is adjusted for age, gender, marital status and education. Model 3 further adjusted for currently smoking, currently drinking, sleep duration, chronic_num, BMI, residence and health insurance based on Model 2.
Table 3. Association between physical activity levels and intrinsic capacity decline.
VariablesPhysical ActivityModel 1
OR (95%CI)
p-ValueModel 2
OR (95%CI)
p-ValueModel 3
OR (95%CI)
p-Value
Physical activityLow levelREF REF REF
Moderate level0.56 (0.44, 0.72)<0.0010.65 (0.50, 0.85)0.0010.72 (0.55, 0.95)0.019
High level0.60 (0.48, 0.76)<0.0010.72 (0.56, 0.91)0.0070.74 (0.58, 0.95) 0.016
Note: Model 1 was a crude model. Model 2 is adjusted for age, gender, marital status and education. Model 3 further adjusted for currently smoking, currently drinking, sleep duration, Chronic_num, BMI, residence and health insurance based on Model 2.
Table 4. Predictive margins of intrinsic capacity impairment across combined categories of social participation and physical activity.
GroupsDelta-Method
MarginStd. Err.zp > |z|[95% Conf. Interval]
SP level * PA level
Low level * Low level0.77790.018442.390.0000.74200.8139
Low level * Moderate level0.74350.020636.010.0000.70300.7840
Low level * High level0.73380.013554.510.0000.70740.7601
Moderate level * Low level0.73970.031123.780.0000.67880.8007
Moderate level * Moderate level0.68590.023728.970.0000.63950.7323
Moderate level * High level0.70790.016143.890.0000.67630.7395
High level * Low level0.55910.09086.160.0000.38120.7370
High level * Moderate level0.62130.042914.500.0000.53730.7053
High level * High level0.63120.026823.620.0000.57890.6836
Note: Confounders included age, gender, marital status, education, residence, currently smoking, currently drinking, sleep duration, Chronic_num, BMI and health insurance.
Disclaimer/Publisher’s Note: The statements, opinions and data contained in all publications are solely those of the individual author(s) and contributor(s) and not of MDPI and/or the editor(s). MDPI and/or the editor(s) disclaim responsibility for any injury to people or property resulting from any ideas, methods, instructions or products referred to in the content.