Article

Association Between Physical Activity Level, Quality of Life Determinants, Internet Use, and Orthorexia Among Sport Science Students Living in Naples: An Observational Study
1
Department of Medical, Human Movement and Wellbeing Sciences, University Parthenope, 80133 Naples, Italy
2
CEINGE-Biotecnologie Avanzate “Franco Salvatore”, 80145 Naples, Italy
3
Department of Neurosciences, Biomedicine and Movement Sciences, University of Verona, 37129 Verona, Italy
4
Department of Economics, Law, Cybersecurity and Sport Sciences, University Parthenope, 80133 Naples, Italy
*
Author to whom correspondence should be addressed.
Healthcare 2026, 14(3), 369; https://doi.org/10.3390/healthcare14030369
Submission received: 21 December 2025 / Revised: 28 January 2026 / Accepted: 29 January 2026 / Published: 31 January 2026
(This article belongs to the Section Public Health and Preventive Medicine)

Abstract

Background: In recent years, growing attention has been paid to the lifestyle factors that influence young adults’ well-being. University students represent young adults at risk of Sedentary Behavior (SB) and mental distress. Sport Science students represent a health-conscious population, less prone to mental distress. This study aims to investigate the associations between physical activity (PA) levels, different determinants of quality of life (QoL), orthorexia nervosa (ON) symptoms, and internet use among Sport Science students living in Naples. Methods: An online survey comprising General Data (GD) and eight validated questionnaires was used to assess PA levels, mood, sleep quality, eating habits, and digital behavior in a population of university students enrolled in Sport Science courses at Parthenope University, Naples. The statistical analyses included descriptive statistics, Student’s t-test, a Mann–Whitney U Test, frequencies, chi-square tests, and a Spearman’s rank correlation. All the analyses were performed using JASP and Jamovi software. Results: We surveyed 775 students (472 M; 303 F; 22.85 ± 3.85 y; BMI 23.74 ± 3.63 kg/m2). Regarding the MET-min/week, 65% of participants reported being highly active, 28% moderately active, and 7% inactive. Poor sleep quality was reported by 20% of those surveyed. Additionally, 84% of participants declared average internet use, which positively correlated with their emotional profile and sleep quality. High PA levels were directly associated with the presence of ON symptoms in 27% of the participants, most of whom exercised in gyms. Conclusions: To our knowledge, this is the first study conducted on a study population of Sport Science University students addressing the complex and interconnected relationships between PA levels, QoL, ON symptoms, and internet use.

1. Introduction

Robust evidence supports the beneficial effects of PA on health across several domains, including all-cause mortality; cancer; and cardiovascular, musculoskeletal, metabolic, and neurocognitive health [1,2].
On the other hand, SB and physical inactivity are associated with an increased risk of several chronic diseases, including heart disease, chronic obstructive pulmonary disease, diabetes, hypertension, osteoporosis, depression, and several types of cancer [3,4]. SB is defined as any waking behavior characterized by an energy expenditure of 1.5 metabolic equivalents (METs) or less, performed while in a sitting or reclining posture (e.g., sitting, watching television, or computer use) [5,6].
The 2020 WHO guidelines on PA and SB for adults (18–64 years) state that all adults should engage in regular PA, as some activity is better than none [1]. These guidelines for adults include strong recommendations regarding weekly volumes of aerobic PA and muscle-strengthening activity. Many of the benefits of PA are seen with average weekly volumes of 150–300 min of moderate intensity or 75–150 min of vigorous intensity, or an equivalent combination of moderate–vigorous PA (MVPA) [7,8].
Given that the most recent global estimates show that one in four adults (27.5%) [6] and more than three-quarters (81%) of adolescents [9] do not meet the recommendations for aerobic exercise, and that in Italy, less than one in two adults (aged 18–69) achieves sufficient levels of PA [10], painting a worse picture in Italy than compared to global trends, it is crucial to raise awareness and increase action regarding health and other key areas (e.g., regular PA).
Alongside the concept of PA, quality of life (QoL) has been established as a significant focus of research and practice in the fields of health and medicine [9]. QoL is a complex and multifaceted concept that has been used to study several aspects of peoples’ lives, including physical and psychological well-being, financial independence, social relationships, personal beliefs, and living situation [10]. The WHO defines QoL as “individuals’ perception of their position in life in the context of the culture and value systems in which they live and in relation to their goals, expectations, standards and concerns” [7].
Early adulthood is one of the most crucial phases of human development [8]. For this population, the transition from secondary to higher education can be especially demanding for many reasons, including the pressure to thrive academically, competition between peers, changes in workload and support networks and, at times, changes in living conditions and being away from family for extended periods [11].
Emerging evidence suggests that college students’ lifestyles are closely interrelated, with implications for both their physical and mental health, including anxiety and depression [12,13]. Low levels of PA and prolonged SB have been associated with poorer QoL, including increased stress, fatigue, and decreased social skills [14]. At the same time, excessive internet use has been linked to increased time spent sitting, and an increased risk of ON [15,16]. ON, characterized by an obsessive focus on ‘healthy’ eating, can be exacerbated by exposure to online health videos and fitness content, particularly in populations already vulnerable to lifestyle pressures [17]. Therefore, it is appropriate to investigate the relationships between PA, QoL, internet use, and ON in university students, as these factors may influence their overall well-being and the risk of maladaptive behaviors [18].
Given the content of their academic degrees, Sport Science students should be aware of the benefits of regular PA and, conversely, the risks associated with SB. Further, their well-being should be evaluated through the lens of a 24 h movement behavior framework, which emphasizes the integrated relationship between PA, sedentary time, and sleep [19,20,21].
However, until now no study has addressed the associations between PA levels, QoL determinants, internet use, and ON symptoms in university students engaged in human movement and Sport Sciences living in southern Italy. Due to the fact that QoL encompasses interconnected physical, psychological, and behavioral dimensions, this research adopts a multidimensional approach to examine how engagement in PA may influence well-being in young adults. We constructed an online survey containing GD and eight sections composed of validated questionnaires: Global Physical Activity Questionnaire (GPAQ), Short Form 12 Health Survey (SF-12), Profile of Mood States (POMS), Pittsburgh Sleep Quality Index (PSQI), Oswestry Disability Index (ODI), Mediterranean Diet (MD) Adherence, Internet Addiction Test (IAT), and Italian-Düsseldorf Orthorexia Scale (I-DOS) to assess the physical health, moods, sleep quality, eating habits, and digital behavior of university students engaged in Sport Science courses at Parthenope University, Naples.
By integrating these domains, the study seeks to provide a comprehensive understanding of the relationship between PA levels and overall well-being within a population of emerging adults engaged in sports-related academic training.

2. Materials and Methods

The authors have read the STROBE Statement checklist of items, and the manuscript was prepared and revised accordingly.

2.1. Questionnaire Survey

From 8 January to 25 February 2025, we administrated the questionnaire survey to students enrolled in a Bachelor’s or Master’s Degree in Sports Science for Prevention and Health/Sport and Management courses at Parthenope University (Naples). The survey was anonymous and voluntary; the completion and submission of the questionnaire implied informed consent for the processing of data (See 2.12. Ethics and Informed Consent). To facilitate the participants’ comprehension and understanding, the survey was written and administered in Italian. The Google Forms setting allowed only one response per user. The participants were recruited during class sessions, where they received detailed information regarding the study. The researchers provided a digital link to the survey and guaranteed complete anonymity for all submitted data. The questionnaire was completed independently on the participants’ own devices (e.g., smartphones or laptops) at their convenience, without the constraints of a classroom setting. The researchers emphasized the importance of having adequate time available to complete the 119-items survey. Of the 902 invited students, we received 779 answers that represent an 86.4% response rate; 4 answers were excluded due to inconsistent and incongruent data between the GD and GPAQ parts. So, we analyzed 775 surveys (472 males and 303 females). Among the participants, the “Other” category (referred to in the “Academic Degree engagement” section of Table 1) included 7 participants (4 males, 3 females). They recently graduated with a Master’s Degree in Sport Science and were unemployed at the time of data collection.

2.2. General Data (GD)

We used the following online Google Forms composed of a total of 119 items, subdivided into nine sections: a brief introduction assuring the anonymity and the non-collection of sensible personal data (e.g., names, home addresses, email addresses, and phone numbers); (1) GD; (2) GPAQ [22]; (3) SF-12 [23]; (4) POMS [24]; (5) PSQI [25]; (6) ODI [26]; (7) Adherence to MD [27]; (8) IAT [28]; and (9) I-DOS [29]. All questionnaires were administered in their validated Italian versions (See Supplementary Materials for complete survey module). The GD section comprises twelve questions aiming to frame the responders from their demographic, self-reported anthropometric, and sport practice aspects. In order, the questions ask about their study degree program; home city; age (in years); gender; height (in m); weight (in kg); present practiced sport; sport frequency per week; single session volume (in min); sessions a day; training intensity (detailed below); and sport experience (in years).
The training intensity is divided into five answer choices: low, moderate, vigorous, high intensity, or do not train. Each training intensity has a description providing the related METs equivalent range and a practical explanation. MET is defined as the amount of energy consumed while sitting at rest and it is equivalent to a caloric consumption of 1 kcal/kg/hour [30]. Low intensity ranges from 1.6 to 3 METs and refers to aerobic activity that does not cause significant changes in respiratory frequency. Moderate intensity ranges from 3 to 6 METs and refers to aerobic activity that generally can be protracted while speaking. Vigorous intensity ranges from 6 to 9 METs and refers to aerobic activity that generally cannot be protracted while speaking. High intensity is higher than 9 METs and refers to an activity that cannot be performed for more than ten minutes [31,32].

2.3. Global Physical Activity Questionnaire (GPAQ)

The GPAQ is a modified version of Internet Physical Activity Questionnaire (IPAQ), and it was developed by the WHO in 2002 in response to the great interest in the role of PA in health. The original version of the GPAQ contained nineteen questions with a shorter version developed later, which eliminated three redundant questions [12]. The GPAQ has a total of sixteen questions (P1-P16) that assess SB and three domains in which PA is performed: work, transport, and leisure-time activities. It covers several components of PA, such as intensity, duration, and frequency. Intensity of PA is expressed in terms of MET.
The study participants were asked if they engaged in vigorous and moderate work or leisure-time activities continuously for at least 10 min. They provided answers about the number of days they engaged in each activity in a typical week, and the time spent on each activity on a typical day. The scoring system attributes 8 MET-min to vigorous-intensity activities; 4 MET-min are attributed to moderate-intensity activities. SB is assessed through the question “How much time do you usually spend sitting or reclining on a typical day?” [33]. The total score is expressed in MET-min/week and derives from the following equation.
MET min week = P 2 × P 3 × 8 + P 5 × P 6 × 4 + P 8 × P 9 × 4 + P 11 × P 12 × 8 + P 14 × P 15 × 4
According to the WHO GPAQ Analysis Guide [34] and latest reference about the interpretation of the scoring system for healthy people [35], individuals are divided into three classes: “Low PA” (inactive) if they achieve <600 MET-min/week, “Moderate PA” (active) if they achieve between 600 and 2999 MET-min/week, and “High PA” (highly active) if they achieve ≥3000 MET-min/week.

2.4. Short Form 12 Health Survey (SF-12)

The SF-12 is one of the most widely used instruments for assessing self-reported health-related quality of life (HRQoL). It was originally developed from the Medical Outcomes Study as a 36-item Short-Form Health Survey (SF-36). The SF-12 consists of twelve questions that measure eight health domains to assess physical and mental health. The physical health-related domains include General Health, Physical Functioning, Role—Physical, and Body Pain. The mental health-related domains include Vitality, Social Functioning, Role— Emotional, and Mental Health [36]. The eight domain scores are summarized into two component summary scores: Physical Component Summary (PCS) score and Mental Component Summary (MCS) score.
The norm-based PCS and MCS scores for the general population are 50 ± 10. Higher scores indicate better health status [37]. According to the scoring system, individuals are divided into two classes: a score < 20 means “frequent psychological unease” and a score ≥ 20 means “psychological health” [38].

2.5. Profile of Mood States 11-Items Short Version (POMS)

The POMS is a valid and reliable instrument that has been widely used in clinical and psychological research. There are full length and shorter versions of the POMS suitable for different research environments. The POMS Short Form has thirty-seven items divided among six subscales: Anger, Confusion, Depression, Fatigue, Tension, and Vigor. The responders indicate how much they have felt like the word (adjective) in the last two weeks on a Likert scale (0 = not at all; 1 = a little; 2 = moderately; 3 = quite a bit; 4 = extremely) [39]. In our study we used the brief version of POMS 11-items proposed by Cella and colleagues, which shows good internal consistency with the Total Mood Disturbance (TMD) score, a reliable index for QoL [40]. The following equation gives the POMS TMD score.
TMD = sum   of   negative   adjectives sum   of   positive   adjectives
Following the scoring system, score range from 0 to 100 points and individuals are divided into three classes according to their TMD score. A score < 40 means “lack of emotional sensitivity”, a score between 40 and 60 means “normal emotional area”, and a score > 60 means “potentially problematic emotional area” [40].

2.6. Pittsburgh Sleep Quality Index (PSQI)

The PSQI is a widely used self-report questionnaire that assesses sleep quality over a one-month interval. The PSQI is commonly used in both clinical and research settings to evaluate various aspects of sleep, including both subjective experiences and objective parameters. It allows researchers and healthcare providers alike to obtain a comprehensive understanding of an individual’s sleep patterns and disturbances (e.g., trouble getting to sleep, going to the toilet frequently). The PSQI’s strong validity is supported by its consistent performance in identifying individuals with sleep disturbances using a post hoc cutoff score. A comparative analysis with polysomnography further substantiated the PSQI’s validity, showing alignment with objective measures of sleep across various subject groups [41].
The PSQI includes nineteen questions, categorized into seven groups that collectively make up a global sleep quality score. This aggregate score is derived from questions relating to “sleep quality, sleep latency, sleep duration, habitual sleep efficiency, sleep disturbance, use of sleeping medication and daytime dysfunction.” The PSQI items use different response categories that include recording the usual bedtime, usual wake time, the number of hours slept, and the number of minutes to fall asleep [42].
Each constituent question produces a score on a scale from 0 to 3, with 3 indicating the greatest dysfunction. The total score is made up of scores from each of the seven subgroups of questions, giving a cumulated score between 0 and 21, with lower scores indicating better sleep quality and higher scores indicating poorer sleep quality [41]. If the PSQI score is less than 5, it is inferred that the subject has a good quality of sleep, and vice versa for higher scores (poor sleep quality). These scoring criteria were re-based on multiple studies using a range of population samples, including college responders, and are believed to be generalizable to the current sample studied [43].

2.7. Oswestry Disability Index (ODI)

The ODI has become one of the principal condition-specific measures used in the management of spinal disorders. The development of the ODI was initiated by John O’Brien in 1976 [44]. The questionnaire is formed of ten questions (items) asking about the possible limitations/disabilities due to chronic low back pain. The items ask about pain intensity, limitations to personal care, limitations to lifting heavy things, limitations to walking, limitations to sitting, limitations to standing, limitations to sleeping, limitations to sexual life, limitations to social life, and limitations to travel. Each item is scored on a Likert scale of 0–5 points [45].
The total limitation score is formed by the sum of the ten items. Scores range from 0 to 50 points, and the population is classified into four classes. If a subject’s score is 0–4, they have “no disability” due to back pain; a score of 5–14 means “mild disability”; a score of 15–24 means “moderate disability”; a score of 25–34 means “severe disability”; and a score of 35–50 means “complete disability” [44].

2.8. Adherence to Mediterranean Diet (MD)

The MD has the advantage of a very lengthy history. It has been used for centuries, even in resource-poor areas, which argues in favor of its potential adoption across the world. Moreover, in more recent times evidence has accumulated for the health benefits of the MD [46]. Adherence to the MD is defined thorough scores that estimate the conformity of the dietary pattern of a population with the traditional Mediterranean dietary pattern [47]. The MD pattern includes consumption of fruit (>2 portions/day), vegetables (>2.5 portions/day), legumes (2 portions/week), cereals (>2 portions/day), fish (>2.5 portions/week), meet and cured meats (<1 portion/day), milk and dairy products (<1 portion/day), alcohol (1–2 Alcoholic Unit/day), and olive oil (frequently).
The MD scoring system range is 0–18 points. Each of the nine items has a maximum score of 2 points, assigned to the appropriate food consumption, as previously described. Otherwise, for each item, the subject is given 1 or 0 points according to the distance between the recommended consumption. A total adherence to the MD score is formed by the sum of each item score and the population is divided into three groups as follows: a score of 0–8 indicates “low adherence”, a score of 9–10 indicates “medium adherence”, and a score of 11–18 indicates “high adherence” [47].

2.9. Internet Addiction Test (IAT)

The IAT measures the use of electronic devices with online access (e.g., mobile phones, computers). Young described internet addiction as “an impulse-control disorder which does not involve an intoxicant” [48]. Later, Young extended the previous version of IAT. The new scale exhibits the following characteristics:
  • The IAT comprises 20 items rated on a five-point Likert scale (from 1—not at all to 5—always);
  • As with the first diagnostic questionnaire, this measurement is derived from the DSM-IV (Diagnostic and Statistical Manual of Mental Disorders IV) criteria for pathological gambling and alcoholism, and it measures the extent of an individual’s problems with daily routines, social life, productivity, sleeping patterns, and feeling due to internet use [49].
The questionnaire examines the degree of preoccupation, compulsive use, behavioral problems, emotional changes, and the impact on life related to internet use. The IAT score ranges from 0 to 100 points with the following cut-offs. A score of 0–39 is for an “average online user”, a score of 40–70 is for a “problematic online user”, and a score of 71–100 is for an “addictive online user” [50].

2.10. Italian-Düsseldorf Orthorexia Scale (I-DOS)

In the 1990′s, Bratman described for the first time orthorexia nervosa (ON) as an extreme level of preoccupation around healthy eating, accompanied by restrictive eating behaviors. It can be considered a disorder to the extent that the pursuit of healthy food negatively impacts upon other areas of life, such as work and relationships, and it is associated with significant changes in lifestyle [51]. The Düsseldorf Orthorexia Scale has been validated in different languages, and it has shown good reliability, criterion validity, and factor structure [52].
The I-DOS scale consists of 10 items assessing ON behaviors and attitudes, using a 0–1 point scale. The score range is 0–10. If a score is between 0 and 3, symptoms of ON are absent; if score is between 4 and 10, symptoms are present [51].

2.11. Statistical Analyses

The statistical analyses were performed using JASP (Version 0.95.3.0; JASP Team, Amsterdam, Netherlands) and Jamovi (Version 2.3.26.0; Jamovi Project, Sydney, Australia) software. Descriptive statistics were produced for the preliminary analysis. A Shapiro–Wilk statistical test was used to check the normality of the distributions. The variables that had a non-parametric distribution were expressed as medians and the interquartile range, while those that had a normal distribution were expressed as the mean and standard deviation. A Student’s t-test was used to compare the anthropometric variables between males and females. A Mann–Whitney U test was applied for the training-related variables. For all the analyses, statistical significance was set at p < 0.05. The gender influence on the questionnaire scores was assessed by a chi-square2) test, with Cramer’s V calculated to determine the effect size. A power analysis was conducted using the G*Power program (version 3.1.9.7 for Windows) to test the research hypothesis at a 0.05 significance level (type I error rate), assuming a minimally interesting effect size (δ = 0.20) and a minimum desired power of 0.80. A Spearman’s rank correlation was applied to assess the association between the variables of interest. The correlation between two variables is denoted by Spearman’s rho and quantified by a number, which varies between −1 and +1: 0.1 ≤ rho ≤ 0.3 means a weak association; 0.4 ≤ rho ≤ 0.6 means a moderate association; and 0.7 ≤ rho ≤ 0.9 means a strong association [53]. Zero means there is no correlation; ±1 means a complete or perfect positive or negative correlation. The direction of Spearman’s rho in this study should be interpreted according to the rank assignment. Consequently, the sign of the correlation reflects this numerical coding and has been interpreted based on the substantive direction of the observed phenomena [54].

2.12. Ethics and Informed Consent

The data collection was conducted anonymously, ensuring participant confidentiality and preventing any identification [55,56]. Anonymity was ensured by excluding any personal data in the questionnaire.
Further, the study was approved by the Dean of the Department; all the data were analyzed in aggregated form, according to Italian and European laws on personal data protection [57,58,59]. We also provided the purpose of the study with the presentation of the questionnaire; by clicking the link to complete the survey, the volunteers confirmed their understanding of the study procedures and objectives and provided informed consent for both their participation and data collection and processing.
Participation was exclusively voluntary, and the participants were free to withdraw at any time prior to submission by exiting the questionnaire, ensuring that no partial responses were recorded.
Google Forms was used only for questionnaire distribution and data collection. All the data were subsequently downloaded and securely stored on a password-protected professional computer.

3. Results

The participants’ characteristics are summarized in Table 1. Of the 902 invited students, we received 779 answers that represent an 86.4% response rate; 4 were excluded due to inconsistent and incongruent answers to the GD and GPAQ parts. The participants (N = 775) were young adults, 472 males and 303 females, matched for age (22.88 ± 4.01 M; 22.81 ± 3.59 F). Both the males and females were of normal weight according to a BMI analysis (24.68 ± 3.62 M; 22.28 ± 3.15 F). As shown in Table 1, significant sex-related differences were observed for weight, height, and BMI. Most of participants (74.07%) lived in metropolitan areas of Naples and its surroundings; only a limited number (3.10%) were off-site, so they were not natives of Campania region. Regarding the educational and professional status of the participants, 70.84% of students were enrolled in a Bachelor’s Degree in Sport Science, and 28.26% in a Master’s Degree in Sport Science for Health and Prevention/ Sport and Management. The “Other” category included seven participants (four males, three females) who were recent graduates of the Master’s Degree in Sport Science and unemployed at the time of data collection.
More than half of the students regularly engaged in gym activities (52.13%); moreover, 18.58% of participants practiced a ball team sport (e.g., football, basketball, or volleyball). Only 10.06% of students, equally distributed between males and females, were not regularly engaged in any sport (Table 2). The trend for sports practice was to train three times a week (IQR 3–4) for 90 (IQR 60–120) minutes, with a training volume per week of 360 (IQR 240–480), and an experience in the sport of 4 years (IQR 2–10). Significant sex-related differences were observed for training volume and experience, as detailed in Table 2.
In order to test the influence of gender on the questionnaire scores, a chi-square2) test was used. No gender influence (p > 0.05) was found in any of the questionnaire scores completed by the participants (Table 3).
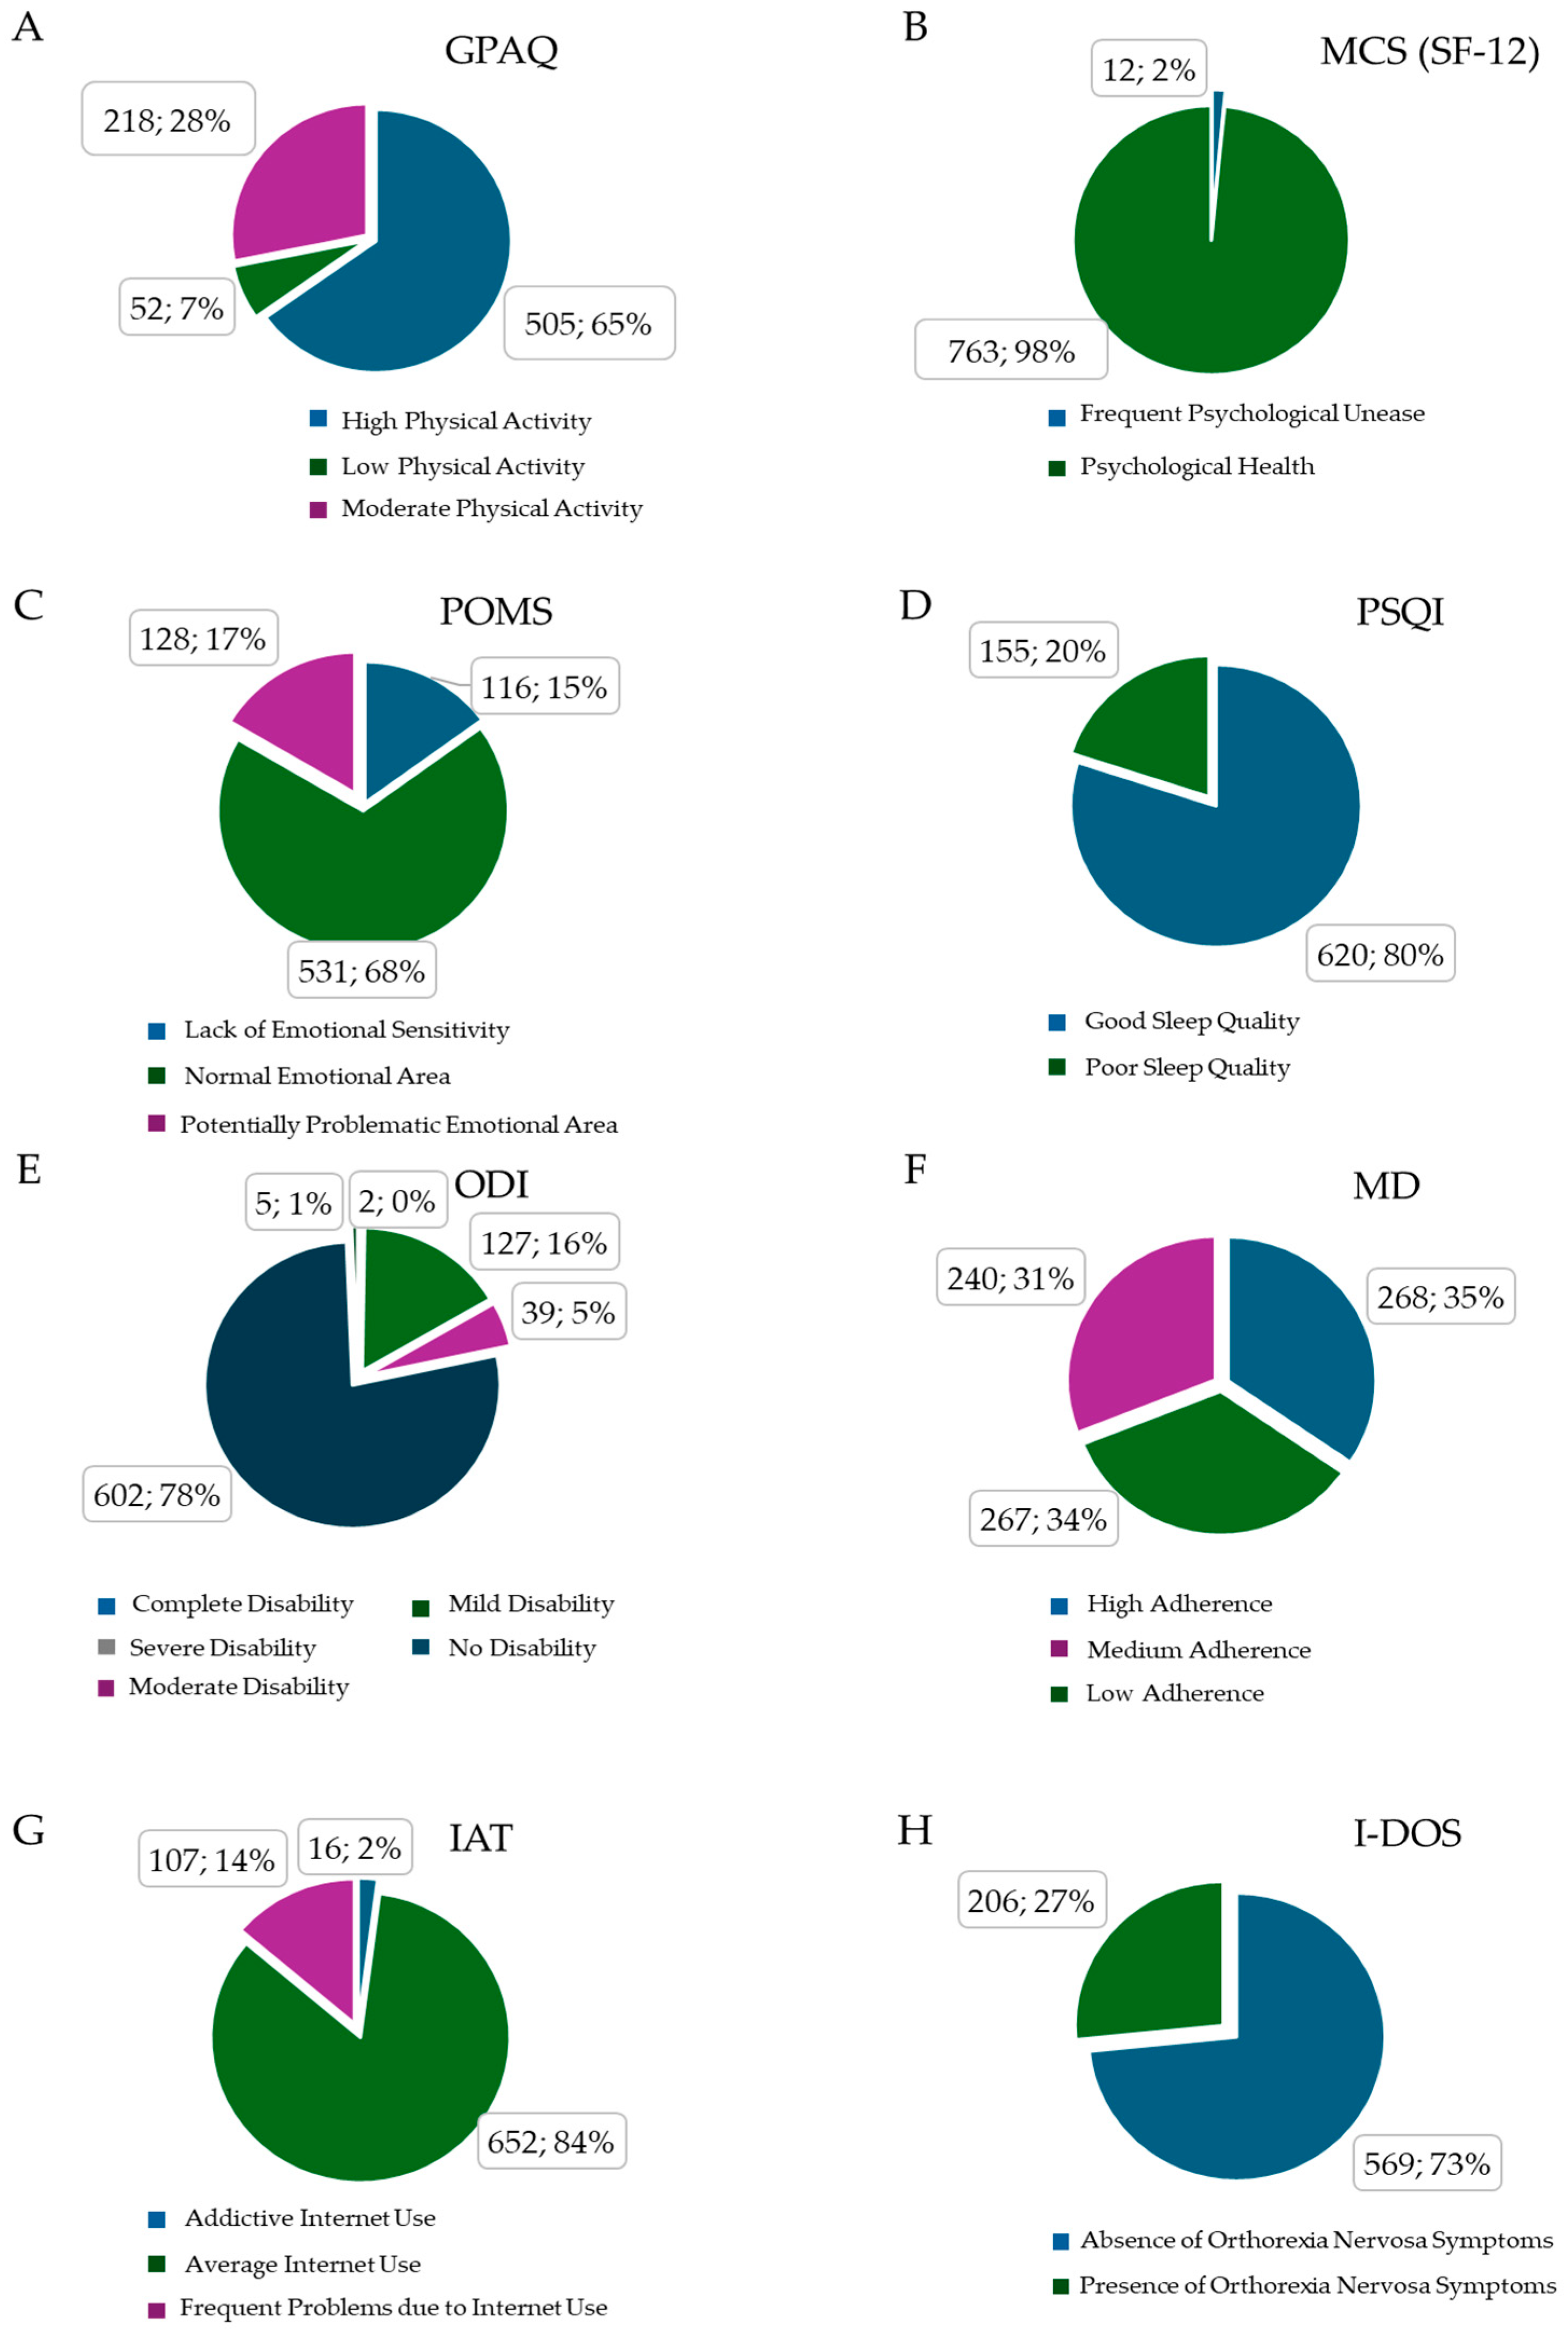
The relative distribution of participants across the different classes for each questionnaire is reported using pie charts (Figure 1A–H). In brief, 65% of students reached a high amount of weekly PA, 28% reached moderate PA, and 7% of participants reached low PA. We opted to consider the PCS of SF-12 as a constant parameter since 100% of participants reported themselves as physically healthy. The MCS of SF-12 revealed that only 2% of this sample had frequent psychological unease. The POMS analysis showed that 68% of participants fell into a normal emotional range, 17% had potentially problematic emotions, and 15% lacked emotional sensitivity. The PSQI score evidenced that 20% of the study population slept badly; on the contrary, 80% reported no trouble with their quality of sleep. The ODI percentages underline that 78% of the participants did not suffer from back pain, 16% reported mild, and 5% reported moderate disability. The MD analysis showed that 35% of the participants strictly followed MD principles, 31% had a medium adherence, and 34% did not follow a MD strictly. The IAT results evidenced that 14% of participants had frequent problems due to internet use; only 2% showed a profile of addiction to online devices. According to the I-DOS results, a substantial 27% of participants met the criteria for ON.
Using a Spearman’s correlation analysis (Table 4), we obtained seven statistically significant correlations (p < 0.001) among the tests. The GPAQ negatively correlated with the I-DOS (−0.123); the MCS positively correlated with the POMS (0.221) and PSQI (0.146); the IAT positively correlated with both the POMS (0.170) and PSQI (0.180), and the I-DOS positively correlated with both the PSQI (0.193) and IAT (0.179).
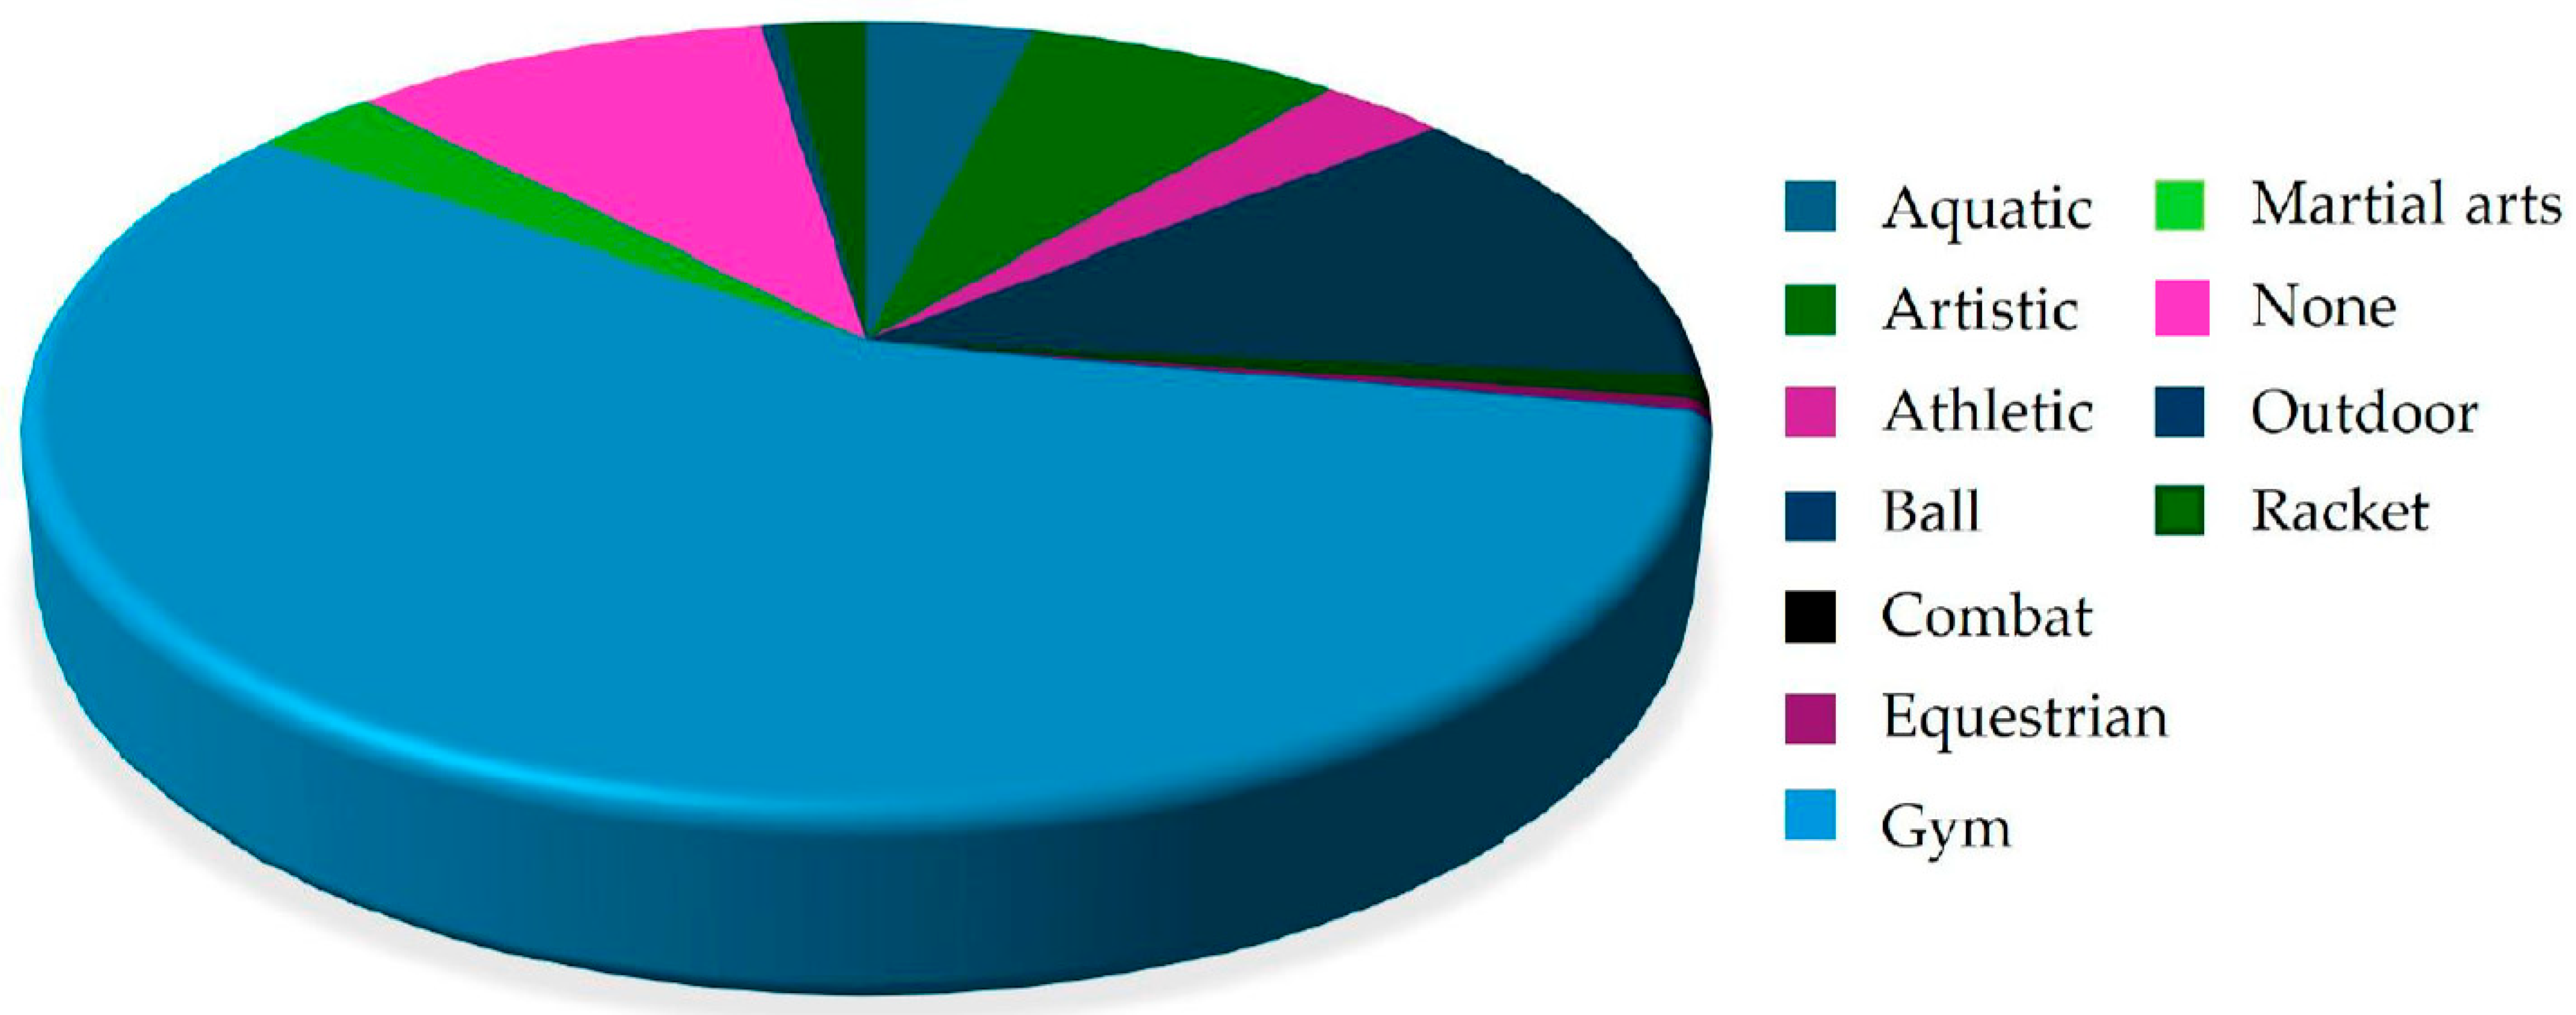
Regarding the prevalence of ON symptoms, interestingly, 206 students (27% of the total sample) met the criteria for this condition (Figure 1H). An analysis of their sports activities revealed that 57.07% of these students regularly trained in a gym, while 12.20% were engaged in a team ball sport (Figure 2).

4. Discussion

In this study, we sought to determine whether different levels of PA were associated with the different components of QoL, internet use, and ON symptoms among Sports Science students enrolled at Parthenope University (Naples, Italy). A total of 779 answers were received from 902 invited students, yielding a response rate of 86.4%. After data screening, by analyzing 775 participants through a comprehensive set of validated questionnaires (GPAQ, SF-12, POMS, PSQI, ODI, MD, IAT, and I-DOS), we aimed to capture the multifaceted nature of well-being in this population. Our approach allowed us to gain insights into the interaction among lifestyle factors in a group of young adults belonging to an educational environment focused on sport and a healthy lifestyle.
Regular PA and sport engagement are associated with a healthier profile of young populations, such as students [60,61,62]. Although Sports Science students are expected, by virtue of their academic training, to maintain an active lifestyle, recent findings have revealed that SB and compromised psychological well-being are prevalent even in this population [10].
Espada and colleagues showed that athletes are most inclined to eating disorders, as they focus heavily on their weight and diet with the aim of enhancing their performance and physical appearance [63].
In this study, we found that male and female participants met the WHO recommendations, although the males showed a higher volume of weekly training [1].
The students exhibiting ON symptoms (I-DOS questionnaire), characterized by strict attention to the quantity and quality of food consumed, showed a direct association with higher levels of weekly PA (GPAQ questionnaire; notwithstanding the negative rho value due to rank coding). Conversely, ON symptoms were negatively correlated with both good sleep quality and conscious internet use, suggesting that higher orthorexic tendencies are linked to poorer sleep and less regulated internet behavior. Moreover, psychological well-being was positively associated with both a positive emotional profile and good sleep quality. On the other hand, conscious internet use was positively correlated with both a good emotional profile and sleep quality.
Several studies have analyzed the correlation between ON symptoms and PA [64,65]. In particular, Dimitrova [66] and colleagues reported symptoms of eating disorders among university students engaged in higher levels of PA. Similarly, other authors have reported significant positive correlations between ON symptoms and PA volume, measured as the number of weekly exercise sessions between fitness center members and sports participation among university students [67,68]. The 27% ON prevalence rate in our study aligns with previous results reporting an ON prevalence of near 42% among the university students of Parma (Northen Italy) [69], and of near 30% among university students in central Italy (University La Sapienza, Rome), with no significant sex differences [70]. These discrepancies may be attributed to the use of different methods.
To our knowledge, no previous studies have investigated the relationship between PA levels and the different determinants of QoL, MD adherence, internet use, and presence of ON symptoms in a sample of Sport Sciences university students.
We found that approximately 27% of surveyed students exhibited ON symptoms; of these, 57.07% reported training in a gym. This finding highlights the common tendency among young adults who regularly attend a gym to develop excessive attention focus on eating habits. A closer analysis of the data collected shows that the prevalence of ON symptoms was highest among those who exercised four times a week; however, we do not have data regarding the specific type of exercises performed. A perfectionist mindset can lead individuals to use dietary control as a stress-management strategy, a tendency further exacerbated by gym culture’s emphasis on a ‘perfect’ physique [71]. We cannot exclude other factors, such as academic pressure or lifestyle habits, which may influence this prevalence. As suggested by Wachten et al. [72], the context of PA often ‘normalizes’ restrictive eating, making it increasingly difficult to distinguish a healthy commitment from orthorexia tendencies. Interestingly, in our study, adherence to a MD did not seem to influence the QoL determinants.
A recent study found positive relationships between PA and self-rated QoL and inverse associations between PA and perceived stress [16]. The positive link between mental state, mood, and sleep highlights the interconnection between psychological well-being and QoL [73].
Digital addiction often leads individuals to spend long periods indoors, resulting in continuous exposure to blue light emitted by devices both during the day and at night [74]. Extensive research has demonstrated a correlation between average sleep quality, social media use, and mental health in young people [75,76]. In particular, some evidence indicates that excessive engagement with social media platforms is linked to deteriorating sleep quality and increased risk of negative mental health outcomes in young populations [77]. Furthermore, a cross-sectional study conducted across seven countries concluded that internet addiction is a significant predictor of poor sleep quality [74]. Currently, growing evidence supports the view that movement behavior, including PA levels, sedentary time, and sleep duration, are interconnected throughout a 24 h cycle and should therefore be assessed collectively [78]. From this perspective, the associations found in our study between ON symptoms, PA levels, sleep quality, and internet use can be interpreted through a 24 h movement behavior framework [19]. This model indicates that the three categories of movement (PA, SB, and sleep quality) are mutually exclusive and exhaustive components of a 24 h period. Consequently, a change in one of the three categories inevitably affects the others [20]. For instance, the time spent on digital monitoring (problematic internet use) or excessive exercising may directly compromise sleep hygiene, explaining the direct correlation observed between the presence of ON symptoms and poor sleep quality or addictive online use.

5. Conclusions

To our knowledge, this is the first study conducted on a population of Sport Sciences university students living in southern Italy to address the complex and interconnected associations among PA levels, QoL determinants, and ON symptoms. Our findings demonstrate an association between high PA levels and the presence of ON symptoms, suggesting that while being more active is generally beneficial, it can sometimes coincide with an excessive focus on controlled food intake. Furthermore, the positive links between mood disorders (POMS), sleep quality (PSQI), and internet use (IAT) reveal how emotional and digital behaviors are closely intertwined, collectively shaping students’ overall well-being. Although these associations are modest, they indicate a coordinated interaction between physical, emotional, and behavioral dimensions.

Study Limitations

Our study has some limitations. First, the cross-sectional design limits causal inference and the presence of uncontrolled confounding factors, such as academic stress and socioeconomic status, may have influenced the results. Second, the self-reported nature of PA levels via the GPAQ questionnaire is susceptible to recall and social expectation bias. Similarly, the self-reported data regarding eating habits and ON symptoms were not clinically validated, which should be considered when interpreting the results. Furthermore, the research was limited to students attending a single university; it might be appropriate to enlarge the observation to Sport Sciences students belonging to other geographic areas and integrate objective measurement tools (such as accelerometers) in future studies to more accurately assess PA and nutrition levels.

Supplementary Materials

The following supporting information can be downloaded at: https://www.mdpi.com/article/10.3390/healthcare14030369/s1, File S1: Questionnaire.

Author Contributions

Conceptualization, A.M., D.V. and P.B.; methodology, software, and validation S.D., D.V., R.G. and A.T.; formal analysis, investigation, and resources, D.M., S.D. and A.M.; data curation and writing—original draft preparation, S.D., A.M., D.V., A.A., R.G. and A.T.; writing—review and editing, A.M., S.O. and P.B.; visualization and supervision, P.B. and S.O.; project administration and funding acquisition, P.B., S.O. and A.M. All authors have read and agreed to the published version of the manuscript.

Funding

This research was funded by University Parthenope, Naples CUP I53D23007060001 and the CIG BA351B3632.

Institutional Review Board Statement

Ethics committee approval was not required for this study, as the data were collected anonymously and participation was voluntary. Anonymity was maintained by excluding any personal or identifying information from the questionnaire. An exemption letter was obtained from the Dean of the department.

Informed Consent Statement

Informed consent was obtained from all subjects involved in the study. As this is a study protocol, this section is not strictly applicable. Although the questionnaire was fully anonymous, the questionnaire cover letter clearly stated that by clicking the link to complete the survey, volunteers confirmed that they understood the study procedures and objectives and provided informed consent for both participation and the collection and processing of data.

Data Availability Statement

Data generated or analyzed during this study are available from the corresponding author upon reasonable request.

Conflicts of Interest

The authors declare no conflicts of interest.

Abbreviations

The following abbreviations are used in this manuscript:
PAPhysical Activity
SBSedentary Behavior
METMetabolic Equivalent
WHOWorld Health Organization
MVPAModerate–Vigorous Physical Activity
QoLQuality of Life
GPAQGlobal Physical Activity Questionnaire
SF-12Short Form 12 Health Survey
POMSProfile of Mood States
PSQIPittsburgh Sleep Quality Index
ODIOswestry Disability Index
MDMediterranean Diet
IATInternet Addiction Test
I-DOSItalian-Düsseldorf Orthorexia Scale
GDGeneral Data
IPAQInternational Physical Activity Questionnaire
HRQoLHealth-Related Quality of Life
PCSPhysical Component Summary
MCSMental Component Summary
TMDTotal Mood Disturbance
ONOrthorexia Nervosa
rhoSpearman’s Correlation
dfDegree of Freedom
IQRInterquartile Range

References

  1. WHO Guidelines on Physical Activity and Sedentary Behaviour. Available online: https://www.who.int/publications/i/item/9789240015128 (accessed on 19 February 2025).
  2. Miko, H.-C.; Zillmann, N.; Ring-Dimitriou, S.; Dorner, T.E.; Titze, S.; Bauer, R. Effects of Physical Activity on Health. Gesundheitswesen 2020, 82, S184–S195. [Google Scholar] [CrossRef]
  3. Silveira, J.F.; Reuter, C.P.; Welser, L.; Pfeiffer, K.A.; Andersen, L.B.; Pohl, H.H.; Lima, R.A. Tracking of Cardiometabolic Risk in a {Brazilian} Schoolchildren Cohort: A 3-Year Longitudinal Study. J. Sports Med. Phys. Fit. 2021, 61, 997–1006. [Google Scholar] [CrossRef]
  4. Delgado Floody, P.A.; Martínez Salazar, C.; Caamaño Navarrete, F.; Jerez Mayorga, D.; Osorio Poblete, A.; García Pinillos, F.; Latorre Román, P. Dissatisfaction with body image and its relation to nutritional status, cardiometabolic risk and cardiorespiratory capacity in public school children. Nutr. Hosp. 2017, 34, 1044–1049. [Google Scholar] [CrossRef]
  5. Sedentary Behaviour Research Network. Letter to the Editor: Standardized Use of the Terms “Sedentary” and “Sedentary Behaviours”. Appl. Physiol. Nutr. Metab. 2012, 37, 540–542. [Google Scholar] [CrossRef]
  6. Pate, R.R.; O’Neill, J.R.; Lobelo, F. The Evolving Definition of “Sedentary”. Exerc. Sport Sci. Rev. 2008, 36, 173–178. [Google Scholar] [CrossRef] [PubMed]
  7. Moussa-Chamari, I.; Farooq, A.; Romdhani, M.; Washif, J.A.; Bakare, U.; Helmy, M.; Al-Horani, R.A.; Salamh, P.; Robin, N.; Hue, O. The Relationship between Quality of Life, Sleep Quality, Mental Health, and Physical Activity in an International Sample of College Students: A Structural Equation Modeling Approach. Front. Public Health 2024, 12, 1397924. [Google Scholar] [CrossRef] [PubMed]
  8. Faílde Garrido, J.M.; Ruiz Soriano, L.; Pérez Fernández, M.R.; Lameiras Fernández, M.; Rodríguez Castro, Y. Evolution of Quality of Life and Health-Related Behaviors among Spanish University Students. Int. J. Health Plan. Manag. 2019, 34, e789–e801. [Google Scholar] [CrossRef] [PubMed]
  9. Haraldstad, K.; Wahl, A.; Andenæs, R.; Andersen, J.R.; Andersen, M.H.; Beisland, E.; Borge, C.R.; Engebretsen, E.; Eisemann, M.; Halvorsrud, L.; et al. A Systematic Review of Quality of Life Research in Medicine and Health Sciences. Qual. Life Res. 2019, 28, 2641–2650. [Google Scholar] [CrossRef]
  10. Ramón-Arbués, E.; Echániz-Serrano, E.; Martínez-Abadía, B.; Antón-Solanas, I.; Cobos-Rincón, A.; Santolalla-Arnedo, I.; Juárez-Vela, R.; Adam Jerue, B. Predictors of the Quality of Life of University Students: A Cross-Sectional Study. Int. J. Environ. Res. Public Health 2022, 19, 12043. [Google Scholar] [CrossRef]
  11. Ramón-Arbués, E.; Martínez Abadía, B.; Granada López, J.M.; Echániz Serrano, E.; Pellicer García, B.; Juárez Vela, R.; Guerrero Portillo, S.; Saéz Guinoa, M. Eating behavior and relationships with stress, anxiety, depression and insomnia in university students. Nutr. Hosp. 2019, 36, 1339–1345. [Google Scholar] [CrossRef]
  12. Keating, X.D.; Zhou, K.; Liu, X.; Hodges, M.; Liu, J.; Guan, J.; Phelps, A.; Castro-Piñero, J. Reliability and Concurrent Validity of Global Physical Activity Questionnaire (GPAQ): A Systematic Review. Int. J. Environ. Res. Public Health 2019, 16, 4128. [Google Scholar] [CrossRef]
  13. Bernal-Morales, B.; Rodríguez-Landa, J.F.; Pulido-Criollo, F. Impact of Anxiety and Depression Symptoms on Scholar Performance in High School and University Students. In A Fresh Look at Anxiety Disorders; IntechOpen: London, UK, 2015; pp. 225–242. ISBN 978-953-51-4277-5. [Google Scholar]
  14. Hamid, M.R.A.; Azman, N.N.; Said, N.; Rahman, A.N.A. Orthorexia Nervosa and the Quality of Life among Health Sciences Students in Universiti Teknologi MARA, Selangor. Environ.-Behav. Proc. J. 2018, 3, 121–126. [Google Scholar] [CrossRef]
  15. Boutouis, S.; Grant, J.E. Problematic Usage of the Internet Is Associated with Orthorexia Nervosa Tendency in Adults. CNS Spectr. 2025, 30, e96. [Google Scholar] [CrossRef]
  16. Brytek-Matera, A.; Pardini, S.; Szubert, J.; Novara, C. Orthorexia Nervosa and Disordered Eating Attitudes, Self-Esteem and Physical Activity among Young Adults. Nutrients 2022, 14, 1289. [Google Scholar] [CrossRef]
  17. Guidotti, S.; Fiduccia, A.; Murgolo, M.; Pruneti, C. Comparison between Physical Activity and Stress-Related Lifestyle between Orthorexic and Non-Orthorexic University Students: A Case–Control Study. Nutrients 2024, 16, 1340. [Google Scholar] [CrossRef]
  18. Guglielmetti, M.; Ferraro, O.E.; Gorrasi, I.S.R.; Carraro, E.; Bo, S.; Abbate-Daga, G.; Tagliabue, A.; Ferraris, C. Lifestyle-Related Risk Factors of Orthorexia Can Differ among the Students of Distinct University Courses. Nutrients 2022, 14, 1111. [Google Scholar] [CrossRef]
  19. Pengpid, S.; Peltzer, K. Adherence to 24-h Movement Guidelines and Its Associations with Dietary Behavior and Mental Health among University Students from Five ASEAN Countries. BMC Public Health 2025, 25, 1592. [Google Scholar] [CrossRef]
  20. Kracht, C.L.; Burkart, S.; Groves, C.I.; Balbim, G.M.; Pfledderer, C.D.; Porter, C.D.; St. Laurent, C.W.; Johnson, E.K.; Brown, D.M.Y. 24-Hour Movement Behavior Adherence and Associations with Health Outcomes: An Umbrella Review. J. Act. Sedentary Sleep Behav. 2024, 3, 25. [Google Scholar] [CrossRef] [PubMed]
  21. Ndupu, L.B.; Faghy, M.; Staples, V.; Lipka, S.; Bussell, C. Exploring the Predictors of Physical Inactivity in a University Setting. BMC Public Health 2023, 23, 59. [Google Scholar] [CrossRef] [PubMed]
  22. Global Physical Activity Questionnaire (GPAQ). Available online: https://www.who.int/publications/m/item/global-physical-activity-questionnaire (accessed on 13 January 2026).
  23. Kodraliu, G.; Mosconi, P.; Groth, N.; Carmosino, G.; Perilli, A.; Gianicolo, E.A.; Rossi, C.; Apolone, G. Subjective Health Status Assessment: Evaluation of the Italian Version of the SF-12 Health Survey. Results from the MiOS Project. J. Epidemiol. Biostat. 2001, 6, 305–316. [Google Scholar] [CrossRef] [PubMed]
  24. Farnè, M.; Sebellico, A.; Gnugnoli, D.; Corallo, A. POMS. Profile of Mood States Adattamento Italiano. Firenze Organizzazioni Speciali.—References—Scientific Research Publishing. 1991. Available online: https://www.scirp.org/reference/referencespapers?referenceid=846391 (accessed on 13 January 2026).
  25. Curcio, G.; Tempesta, D.; Scarlata, S.; Marzano, C.; Moroni, F.; Rossini, P.M.; Ferrara, M.; De Gennaro, L. Validity of the Italian Version of the Pittsburgh Sleep Quality Index (PSQI). Neurol. Sci. 2013, 34, 511–519. [Google Scholar] [CrossRef]
  26. Monticone, M.; Baiardi, P.; Ferrari, S.; Foti, C.; Mugnai, R.; Pillastrini, P.; Vanti, C.; Zanoli, G. Development of the Italian Version of the Oswestry Disability Index (ODI-I): A Cross-Cultural Adaptation, Reliability, and Validity Study. Spine 2009, 34, 2090–2095. [Google Scholar] [CrossRef]
  27. Sofi, F.; Macchi, C.; Abbate, R.; Gensini, G.F.; Casini, A. Mediterranean Diet and Health Status: An Updated Meta-Analysis and a Proposal for a Literature-Based Adherence Score. Public Health Nutr. 2014, 17, 2769–2782. [Google Scholar] [CrossRef] [PubMed]
  28. Fioravanti, G.; Casale, S. Evaluation of the Psychometric Properties of the Italian Internet Addiction Test. Cyberpsychol. Behav. Soc. Netw. 2015, 18, 120–128. [Google Scholar] [CrossRef] [PubMed]
  29. Cerolini, S.; Vacca, M.; Zagaria, A.; Donini, L.M.; Barbaranelli, C.; Lombardo, C. Italian Adaptation of the Düsseldorf Orthorexia Scale (I-DOS): Psychometric Properties and Prevalence of Orthorexia Nervosa among an Italian Sample. Eat. Weight Disord. 2022, 27, 1405–1413. [Google Scholar] [CrossRef]
  30. Veer, B.; Ghanekar, D.J.; Dasila, D.P. Are We Physically Active? Assessment Using Global Physical Activity Questionnaire (GPAQ). Int. J. Health Sci. Res. 2018, 8, 137–142. [Google Scholar]
  31. Graham, I.; Atar, D.; Borch-Johnsen, K.; Boysen, G.; Burell, G.; Cifkova, R.; Dallongeville, J.; De Backer, G.; Ebrahim, S.; Gjelsvik, B.; et al. European Guidelines on Cardiovascular Disease Prevention in Clinical Practice: Executive Summary. Atherosclerosis 2007, 194, 1–45. [Google Scholar] [CrossRef] [PubMed]
  32. Physical Activity and Health in Europe: Evidence for Action. Available online: https://iris.who.int/items/e6cdad6d-6cbc-489b-8972-d869941c8829 (accessed on 16 December 2025).
  33. Mengesha, M.M.; Roba, H.S.; Ayele, B.H.; Beyene, A.S. Level of Physical Activity among Urban Adults and the Socio-Demographic Correlates: A Population-Based Cross-Sectional Study Using the Global Physical Activity Questionnaire. BMC Public Health 2019, 19, 1160. [Google Scholar] [CrossRef]
  34. World Health Organization. Global Physical Activity Questionnaire Analysis Guide Surveillance and Population-Based Prevention; Prevention of Noncommunicable Diseases Department. World Health Organization: Geneva, Switzerland. Available online: https://www.academia.edu/32922327/Global_Physical_Activity_Questionnaire_Analysis_Guide_Surveillance_and_Population_Based_Prevention_Prevention_of_Noncommunicable_Diseases_Department_World_Health_Organization (accessed on 28 January 2026).
  35. Sathish, T.; Mathews, E. Development of a Modified Global Physical Activity Questionnaire and Its Construct Validity among Adults in Kerala, India. Diabetology 2023, 4, 235–242. [Google Scholar] [CrossRef]
  36. Huo, T.; Guo, Y.; Shenkman, E.; Muller, K. Assessing the Reliability of the Short Form 12 (SF-12) Health Survey in Adults with Mental Health Conditions: A Report from the Wellness Incentive and Navigation (WIN) Study. Health Qual. Life Outcomes 2018, 16, 34. [Google Scholar] [CrossRef]
  37. Shah, R.M.; Banahan, B.F.; Holmes, E.R.; Patel, A.S.; Barnard, M.; Khanna, R.; Bentley, J.P. An Evaluation of the Psychometric Properties of the Sf-12v2 Health Survey among Adults with Hemophilia. Health Qual. Life Outcomes 2018, 16, 229. [Google Scholar] [CrossRef]
  38. Ware, J.; Kosinski, M.; Turner-Bowker, D.; Gandek, B. How to Score SF-12 Items. In SF-12 v2: How to Score Version 2 of the SF-12 Health Survey; Quality Metric Incorporated: Johnston, RI, USA, 2002; pp. 29–38. [Google Scholar]
  39. Kim, J.; Smith, T. Exploring Measurement Invariance by Gender in the Profile of Mood States Depression Subscale among Cancer Survivors. Qual. Life Res. 2017, 26, 171–175. [Google Scholar] [CrossRef]
  40. Cella, D.F.; Jacobsen, P.B.; Orav, E.J.; Holland, J.C.; Silberfarb, P.M.; Rafla, S. A Brief POMS Measure of Distress for Cancer Patients. J. Chronic Dis. 1987, 40, 939–942. [Google Scholar] [CrossRef] [PubMed]
  41. Buysse, D.J.; Reynolds, C.F.; Monk, T.H.; Berman, S.R.; Kupfer, D.J. The Pittsburgh Sleep Quality Index: A New Instrument for Psychiatric Practice and Research. Psychiatry Res. 1989, 28, 193–213. [Google Scholar] [CrossRef]
  42. Ghrouz, A.K.; Noohu, M.M.; Dilshad Manzar, M.; Warren Spence, D.; BaHammam, A.S.; Pandi-Perumal, S.R. Physical Activity and Sleep Quality in Relation to Mental Health among College Students. Sleep Breath. 2019, 23, 627–634. [Google Scholar] [CrossRef]
  43. Gelaye, B.; Lohsoonthorn, V.; Lertmeharit, S.; Pensuksan, W.C.; Sanchez, S.E.; Lemma, S.; Berhane, Y.; Zhu, X.; Vélez, J.C.; Barbosa, C.; et al. Construct Validity and Factor Structure of the Pittsburgh Sleep Quality Index and Epworth Sleepiness Scale in a Multi-National Study of African, South East Asian and South American College Students. PLoS ONE 2014, 9, e116383. [Google Scholar] [CrossRef] [PubMed]
  44. Fairbank, J.C.; Pynsent, P.B. The Oswestry Disability Index. Spine 2000, 25, 2940–2952; discussion 2952. [Google Scholar] [CrossRef]
  45. Irmak, R. Relatively Short Term Test Re-Test Reliability of Neck Disability Index by Long Term Test Re-Retest Reliability Method of Oswestry Disability Index in Healthy Office Workers. Work 2019, 64, 635–640. [Google Scholar] [CrossRef] [PubMed]
  46. Hidalgo-Mora, J.J.; García-Vigara, A.; Sánchez-Sánchez, M.L.; García-Pérez, M.-Á.; Tarín, J.; Cano, A. The Mediterranean Diet: A Historical Perspective on Food for Health. Maturitas 2020, 132, 65–69. [Google Scholar] [CrossRef]
  47. Sofi, F.; Cesari, F.; Abbate, R.; Gensini, G.F.; Casini, A. Adherence to Mediterranean Diet and Health Status: Meta-Analysis. BMJ 2008, 337, a1344. [Google Scholar] [CrossRef]
  48. Widyanto, L.; McMurran, M. The Psychometric Properties of the Internet Addiction Test. Cyberpsychol. Behav. 2004, 7, 443–450. [Google Scholar] [CrossRef] [PubMed]
  49. Faraci, P.; Craparo, G.; Messina, R.; Severino, S. Internet Addiction Test (IAT): Which Is the Best Factorial Solution? J. Med. Internet Res. 2013, 15, e225. [Google Scholar] [CrossRef] [PubMed]
  50. Pallanti, S.; Bernardi, S.; Quercioli, L. The Shorter PROMIS Questionnaire and the Internet Addiction Scale in the Assessment of Multiple Addictions in a High-School Population: Prevalence and Related Disability. CNS Spectr. 2006, 11, 966–974. [Google Scholar] [CrossRef] [PubMed]
  51. Bundros, J.; Clifford, D.; Silliman, K.; Neyman Morris, M. Prevalence of Orthorexia Nervosa among College Students Based on Bratman’s Test and Associated Tendencies. Appetite 2016, 101, 86–94. [Google Scholar] [CrossRef]
  52. Aloi, M.; Moniaci, M.; Rania, M.; Carbone, E.A.; Martino, G.; Segura-Garcia, C.; Liuzza, M.T. Relationship between Disgust and Orthorexia Nervosa and Psychometric Properties of the Italian Dusseldorf Orthorexia Scale in a General Population Sample. J. Eat. Disord. 2023, 11, 174. [Google Scholar] [CrossRef]
  53. Akoglu, H. User’s Guide to Correlation Coefficients. Turk. J. Emerg. Med. 2018, 18, 91–93. [Google Scholar] [CrossRef]
  54. Cohen, B.H.; Lea, R.B. Essentials of Statistics for the Social and Behavioral Sciences; Wiley: Hoboken, NJ, USA, 2004. [Google Scholar]
  55. Catalini, A.; Mazza, C.; Cosma, C.; Minutolo, G.; De Nicolò, V.; Gallinoro, V.; Caminiti, M.; Ancona, A.; Stacchini, L.; Berselli, N.; et al. Public Health Residents’ Anonymous Survey in Italy (PHRASI): Study Protocol for a Cross-Sectional Study for a Multidimensional Assessment of Mental Health and Its Determinants. Int. J. Environ. Res. Public Health 2023, 20, 2003. [Google Scholar] [CrossRef]
  56. Berselli, N.; Caminiti, M.; Ancona, A.; Stacchini, L.; Gallinoro, V.; Catalini, A.; Cosma, C.; De Nicolò, V.; Mazza, C.; Minutolo, G.; et al. Social Network Characteristics and Well-Being in Italy: Insights from the PHRASI Study. Ann. Ig. 2024, 36, 169–181. [Google Scholar] [CrossRef]
  57. Gazzetta Ufficiale. Available online: https://www.gazzettaufficiale.it/atto/serie_generale/caricaDettaglioAtto/originario?atto.dataPubblicazioneGazzetta=2003-07-29&atto.codiceRedazionale=003G0218 (accessed on 24 December 2025).
  58. Gazzetta Ufficiale. Available online: https://www.gazzettaufficiale.it/eli/id/2018/09/04/18G00129/sg (accessed on 24 December 2025).
  59. 32016R0679; Regulation (EU) 2016/679 of the European Parliament and of the Council of 27 April 2016 on the Protection of Natural Persons with Regard to the Processing of Personal Data and on the Free Movement of Such Data, and Repealing Directive 95/46/EC (General Data Protection Regulation) (Text with EEA Relevance). European Union: Brussels, Belgium, 2016.
  60. Buttar, K.K.; Kacker, S.; Saboo, N. Influence of Physical Activity on Health-Related Fitness in Young Adults: An Observational Research. Niger. Med. J. 2024, 65, 162–172. [Google Scholar] [CrossRef]
  61. Aira, T.; Vasankari, T.; Heinonen, O.J.; Korpelainen, R.; Kotkajuuri, J.; Parkkari, J.; Savonen, K.; Uusitalo, A.; Valtonen, M.; Villberg, J.; et al. Physical Activity from Adolescence to Young Adulthood: Patterns of Change, and Their Associations with Activity Domains and Sedentary Time. Int. J. Behav. Nutr. Phys. Act. 2021, 18, 85. [Google Scholar] [CrossRef]
  62. Ruiz, J.R.; Castro-Pinero, J.; Artero, E.G.; Ortega, F.B.; Sjostrom, M.; Suni, J.; Castillo, M.J. Predictive Validity of Health-Related Fitness in Youth: A Systematic Review. Br. J. Sports Med. 2009, 43, 909–923. [Google Scholar] [CrossRef]
  63. Espada, M.; Romero-Parra, N.; Bores-García, D.; Delfa-De La Morena, J.M. Gender Differences in University Students’ Levels of Physical Activity and Motivations to Engage in Physical Activity. Educ. Sci. 2023, 13, 340. [Google Scholar] [CrossRef]
  64. Bratland-Sanda, S.; Sundgot-Borgen, J. Eating Disorders in Athletes: Overview of Prevalence, Risk Factors and Recommendations for Prevention and Treatment. Eur. J. Sport Sci. 2013, 13, 499–508. [Google Scholar] [CrossRef]
  65. Neglia, A. Nutrition, Eating Disorders, and Behavior in Athletes. Psychiatr. Clin. N. Am. 2021, 44, 431–441. [Google Scholar] [CrossRef]
  66. Dimitrova, D.E.; Vanljan, G.; Miloshova, E. P-14 Eating Disturbances Among University Male and Female Students with Different Level of Physical Activity. BMJ 2016, 50, A39–A40. [Google Scholar] [CrossRef]
  67. Hafstad, S.M.; Bauer, J.; Harris, A.; Pallesen, S. The Prevalence of Orthorexia in Exercising Populations: A Systematic Review and Meta-Analysis. J. Eat. Disord. 2023, 11, 15. [Google Scholar] [CrossRef] [PubMed]
  68. Oberle, C.D.; Watkins, R.S.; Burkot, A.J. Orthorexic Eating Behaviors Related to Exercise Addiction and Internal Motivations in a Sample of University Students. Eat. Weight Disord. 2018, 23, 67–74. [Google Scholar] [CrossRef]
  69. Sanseverino, R.; Guidotti, S.; Pruneti, C. Assessing Orthorexia Nervosa Among University Students: An Observational Study Analyzing Prevalence and Psychological Characteristics. Nutrients 2025, 17, 2078. [Google Scholar] [CrossRef]
  70. Aiello, P.; Toti, E.; Villaño, D.; Raguzzini, A.; Peluso, I. Overlap of Orthorexia, Eating Attitude and Psychological Distress in Some Italian and Spanish University Students. World J. Psychiatry 2022, 12, 1298–1312. [Google Scholar] [CrossRef] [PubMed]
  71. Barnes, M.A.; Caltabiano, M.L. The Interrelationship between Orthorexia Nervosa, Perfectionism, Body Image and Attachment Style. Eat. Weight. Disord. 2017, 22, 177–184. [Google Scholar] [CrossRef]
  72. Wachten, H.; Wurst, R.; Paganini, S.; Strahler, J. Excessive Health Behaviors in Sports: Links of Orthorexia Nervosa and Exercise Addiction with Well-Being, Exercise Activity in Sports Categories, and Gender Effects. Front. Nutr. 2024, 11, 1494958. [Google Scholar] [CrossRef]
  73. Carpi, M.; Cianfarani, C.; Vestri, A. Sleep Quality and Its Associations with Physical and Mental Health-Related Quality of Life among University Students: A Cross-Sectional Study. Int. J. Environ. Res. Public Health 2022, 19, 2874. [Google Scholar] [CrossRef]
  74. Tan, S.L.; Jetzke, M.; Vergeld, V.; Müller, C. Independent and Combined Associations of Physical Activity, Sedentary Time, and Activity Intensities with Perceived Stress Among University Students: Internet-Based Cross-Sectional Study. JMIR Public Health Surveill. 2020, 6, e20119. [Google Scholar] [CrossRef]
  75. Ahmed, O.; Walsh, E.I.; Dawel, A.; Alateeq, K.; Espinoza Oyarce, D.A.; Cherbuin, N. Social Media Use, Mental Health and Sleep: A Systematic Review with Meta-Analyses. J. Affect. Disord. 2024, 367, 701–712. [Google Scholar] [CrossRef] [PubMed]
  76. Yu, D.J.; Wing, Y.K.; Li, T.M.H.; Chan, N.Y. The Impact of Social Media Use on Sleep and Mental Health in Youth: A Scoping Review. Curr. Psychiatry Rep. 2024, 26, 104–119. [Google Scholar] [CrossRef] [PubMed]
  77. Alonzo, R.; Hussain, J.; Stranges, S.; Anderson, K.K. Interplay between Social Media Use, Sleep Quality, and Mental Health in Youth: A Systematic Review. Sleep Med. Rev. 2021, 56, 101414. [Google Scholar] [CrossRef] [PubMed]
  78. Gutiérrez-Espinoza, H.; Cassola-Cajiao, M.; Garzón-Ulloa, E.; Celi-Lalama, D.; Araya-Quintanilla, F.; Valenzuela-Fuenzalida, J.; López-Gil, J.F. Changes in the Lifestyle Behavior and Anthropometrics of University Students after the First Year: A One-Year Prospective Observational Study. Front. Sports Act. Living 2025, 7, 1499828. [Google Scholar] [CrossRef]
Figure 1. Relative distribution of participants across different questionnaires’ categories. (A) GPAQ (Global Physical Activity Questionnaire); (B) MCS (Mental Component Summary of Short Form 12); (C) POMS (Profile of Mood States); (D) PSQI (Pittsburgh Sleep Quality Index); (E) ODI (Oswestry Disability Index); (F) MD (Mediterranean Diet Adherence); (G) IAT (Internet Addiction Test); (H) I-DOS (Italian Düsseldorf Orthorexia Scale).
Healthcare 14 00369 g001
Figure 2. Sports practiced by participants exhibiting symptoms of ON.
Healthcare 14 00369 g002
Table 1. Baseline characteristics of participants: anthropometric measures, geographic origin, and academic engagement.
Total (N = 775)Males (N = 472)Females (N = 303)
Anthropometry
Age (years)22.85 ± 3.8522.88 ± 4.0122.81 ± 3.59
Height (m)1.72 ± 0.101.78 ± 0.08 ***1.63 ± 0.06
Weight (kg)70.90 ± 14.6578.23 ± 12.58 ***59.47 ± 9.38
BMI (kg/m2)23.74 ± 3.6324.68 ± 3.62 ***22.28 ± 3.15
Home City (Relative Frequency, %)
Naples74.0744.1329.94
Avellino1.290.900.39
Benevento0.260.130.13
Caserta15.7410.325.42
Salerno5.553.611.94
Off-site3.101.811.29
Academic Degree Engagement (Percentage, %)
Bachelor’s Degree in Sport Science70.8443.3527.48
Master’s Degree in Sport Science for Health and Prevention/Sport and Management28.2617.0311.23
Other 0.900.510.39
Anthropometric characteristics of participants are reported as mean ± standard deviation; home city and academic degree engagement information are reported as percentages (%). Student’s t test: *** p < 0.001; males vs. females. Abbreviations: BMI, Body Mass Index.
Table 2. Physical activity profiles and sports participation characteristics among the study participants.
Total (N = 775)Males (N = 472)Females (N = 303)
Training variables
Sessions/week3 (3–4)4 (3–5) ***3 (3–4)
Training volume/session (min)90 (60–120)120 (90–120) *90 (60–120)
Training volume/week (min)360 (240–480)360 (270–480) ***270 (180–450)
Experience (y)4 (2–10)5 (2–10) **4 (1–10)
Type of sportRelative Frequency (%)
Aquatic3.101.941.16
Artistic8.131.686.45
Athletic1.420.650.77
Ball (team sport)18.5816.262.19
Combat1.030.900.13
Equestrian0.260.000.26
Gym52.1330.1921.81
Martial arts1.811.290.52
None10.065.035.03
Outdoor1.291.030.26
Racket2.191.810.39
Participants’ sport practice information is reported as median and IQR (interquartile range). IQR is reported as range between 25th and 75th percentile. Type of sport information is reported as percentage (%). Mann–Whitney U test: * p < 0.05, ** p < 0.01, *** p < 0.001; males vs. females.
Table 3. Summary of participant responses across the eight validated questionnaires.
χ2
MalesFemalesValuedfpCramer’s V
GPAQ4566.00 (2160.00–7504.00)4036.00 (2020.00–7048.00)5.08020.0790.081
MCS48.12 (40.02–53.85)49.00 (40.74–53.80)1.89010.1690.049
POMS48.13 (41.95–55.85)48.25 (43.25–56.34)0.95220.6210.035
PSQI3.00 (2.00–5.00)3.00 (2.00–5.00)0.22910.6320.017
ODI0.00 (0.00–3.00)1.00 (0.00–5.00)6.06040.1950.088
MD10.00 (8.00–11.00)10.00 (8.00–11.00)0.92520.6300.035
IAT18.5 (9.00–29.25)18.00 (9.50–29.00)0.48920.7830.025
I-DOS3.00 (2.00–5.00)3.00 (2.00–5.00)0.05910.8080.009
Questionnaire information is reported as median and interquartile range (IQR). IQR is reported as range between 25th and 75th percentile. χ2 (chi-square) test results for all variables are reported (p > 0.05). Abbreviations: Global Physical Activity Questionnaire (GPAQ), Mental Component Summary (MCS), Profile of Mood States 11-items short version (POMS), Pittsburgh Sleep Quality Index (PSQI), Oswestry Disability Index (ODI), Adherence to Mediterranean Diet (MD), Internet Addiction Test (IAT), Italian-Düsseldorf Orthorexia Scale (I-DOS).
Table 4. Spearman’s correlation matrix showing the relationships between PA levels, presence of ON symptoms, internet use, and QoL domains.
GPAQMCSPOMSPSQIODIMDIATI-DOS
GPAQRho
p-value
_
MCSRho
p-value
−0.003
0.943
_
POMSRho
p-value
−0.028
0.431
0.221 ***
< 0.001
_
PSQIRho
p-value
0.019
0.596
0.146 ***
<0.001
0.068
0.060
_
ODIRho
p-value
0.032
0.381
0.009
0.804
0.011
0.763
0.015
0.678
_
MDRho
p-value
0.055
0.124
0.068
0.057
0.023
0.528
0.055
0.127
0.022
0.533
_
IATRho
p-value
0.000
0.999
0.067
0.062
0.170 ***
<0.001
0.180 ***
<0.001
−0.006
0.861
0.041
0.249
_
I-DOSRho
p-value
−0.123 ***
<0.001
0.019
0.594
0.059
0.098
0.193 ***
<0.001
0.042
0.239
−0.049
0.175
0.179 ***
<0.001
_
*** p-value < 0.001. Abbreviations: Global Physical Activity Questionnaire (GPAQ), Mental Component Summary (MCS), Profile of Mood States 11-items short version (POMS), Pittsburgh Sleep Quality Index (PSQI), Oswestry Disability Index (ODI), Adherence to Mediterranean Diet (MD), Internet Addiction Test (IAT), Italian-Düsseldorf Orthorexia Scale (I-DOS).
Disclaimer/Publisher’s Note: The statements, opinions and data contained in all publications are solely those of the individual author(s) and contributor(s) and not of MDPI and/or the editor(s). MDPI and/or the editor(s) disclaim responsibility for any injury to people or property resulting from any ideas, methods, instructions or products referred to in the content.