1. Background
Chronic kidney disease (CKD) is a major global public health concern with increasing prevalence. It is a significant risk factor for cardiovascular disease, end-stage renal disease (ESRD), and all-cause mortality [
1]. According to the Global Burden of Disease (GBD) 2021 report, more than 800 million individuals worldwide are affected by CKD, including approximately 130 million in China, representing a substantial disease burden [
2]. However, early-stage CKD is often clinically silent, and diagnosis is commonly delayed until significant renal function loss has occurred, resulting in missed opportunities for timely intervention [
2]. Therefore, there is an urgent need to identify non-invasive and effective markers for the early identification of individuals at increased CKD risk, which is of great importance to both clinical practice and public health.
Arterial stiffness is recognized as a key pathophysiological mechanism underlying chronic kidney disease (CKD) [
3]. Pulse wave velocity (PWV), the gold standard for assessing arterial stiffness, has been consistently associated with both cardiovascular events and CKD in previous studies [
4]. Elevated PWV reflects not only reduced vascular elasticity and increased hemodynamic load but also indicates a higher risk of microvascular injury within the kidneys [
5]. However, conventional PWV measurement requires specialized equipment and trained personnel, making it costly and impractical for large-scale population screening. In recent years, an estimated form of PWV (ePWV), which is derived from readily available clinical parameters such as age and mean arterial pressure, has been proposed [
6]. ePWV offers advantages of being non-invasive, simple to obtain, and highly reproducible, and has shown initial promise for cardiovascular risk stratification [
7]. Nevertheless, its utility in risk assessment for CKD remains insufficiently investigated.
However, with the advancement of big data and artificial intelligence, machine learning approaches have demonstrated significant advantages in developing disease prediction models [
8]. Compared with traditional statistical methods, machine learning is capable of capturing complex nonlinear relationships and uncovering interactions among multidimensional features, thereby enhancing predictive performance. A range of ensemble learning algorithms—such as Random Forest (RF), Extreme Gradient Boosting (XGBoost), and Light Gradient Boosting Machine (LightGBM)—have been widely applied in risk prediction for cardiovascular, oncological, and metabolic diseases [
9,
10,
11]. In parallel, the development of interpretable machine learning has provided tools to improve model transparency. Among them, SHapley Additive exPlanations (SHAP) enables quantification of each feature’s contribution to the model output [
12], revealing not only its direction of effect but also its pattern of influence, thus offering clinically interpretable insights for decision-making.
To date, studies investigating the association between estimated pulse wave velocity (ePWV) and CKD risk remain limited, often confined to single populations and lacking external validation across diverse cohorts. Moreover, there is a paucity of research employing machine learning approaches to systematically evaluate the utility of ePWV and its relative importance compared with traditional risk factors in CKD risk stratification. In this context, to our knowledge, the present study is among the first to integrate data from two large, nationally representative cohorts—the US National Health and Nutrition Examination Survey (NHANES) and the China Health and Retirement Longitudinal Study (CHARLS)—to comprehensively examine the relationship between ePWV and CKD risk. Multiple machine learning algorithms were applied to develop and compare classification models, with external validation performed in an independent cohort. Furthermore, the SHapley Additive exPlanations (SHAP) framework was used to interpret feature contributions and interaction patterns, aiming to provide novel insights for CKD risk stratification and early detection.
2. Materials and Methods
2.1. Study Design Overview
This study systematically evaluated the association between estimated pulse wave velocity (ePWV) and chronic kidney disease (CKD) using two nationally representative observational cohorts: the National Health and Nutrition Examination Survey (NHANES) in the United States and the China Health and Retirement Longitudinal Study (CHARLS). To ensure data quality and comparability across cohorts, we applied uniform inclusion and exclusion criteria [
13,
14]. Participants were eligible if they were aged ≥45 years and had complete information on blood pressure and serum creatinine, as well as urinary albumin for the NHANES cohort. Individuals were excluded if they lacked key variables or presented with extreme ePWV values. CKD was defined according to the core criteria of the Kidney Disease: Improving Global Outcomes (KDIGO) 2021 guidelines [
15], which require either a reduced glomerular filtration rate or albuminuria. eGFR was calculated using the CKD-EPI equation. In NHANES, which measured both serum creatinine and urinary albumin, CKD was defined as eGFR < 60 mL/min/1.73 m
2 or a urinary albumin-to-creatinine ratio (ACR) ≥ 30 mg/g; in CHARLS, where urinary albumin was not available, CKD was defined as eGFR < 60 mL/min/1.73 m
2 alone. All remaining participants were considered non-CKD. Application of these criteria to the baseline datasets of the two cohorts yielded the final analytical samples. All statistical analyses were performed using R software version 4.4.3 and Python version 3.11.5.
2.2. Two Extensive Observational Cohort Studies
The National Health and Nutrition Examination Survey (NHANES) is a nationally representative survey of adults and children in the United States, designed to assess health and nutritional status through demographic information, dietary habits, laboratory tests, physical examinations, and health-related questionnaires. This study utilized pooled data from the continuous NHANES cycles covering 2005–2018. The total number of participants who completed the Mobile Examination Center (MEC) interview and examination across these combined cycles was 70,190 before the application of study-specific exclusion criteria. According to the predefined criteria [
13], we sequentially excluded individuals aged <45 years (
n = 47,268), those without blood pressure measurements required for ePWV calculation (
n = 4002), those lacking serum creatinine or urinary albumin-to-creatinine ratio data (
n = 1011), and those with extreme ePWV values (
n = 10). The final analytic sample consisted of 17,890 participants. The NHANES protocol was approved by the Ethics Review Board of the National Center for Health Statistics, and all participants provided written informed consent before data collection. All statistical analyses incorporated the sampling weights, strata, and primary sampling unit variables provided by NHANES to ensure nationally representative estimates for the non-institutionalized middle-aged and older U.S. population.
The China Health and Retirement Longitudinal Study (CHARLS) is a nationally representative longitudinal survey aimed at evaluating the health and socioeconomic status of middle-aged and older adults in China. We utilized data from the 2011 and 2015 survey waves, with an initial sample size of 57,405 participants.
For this cross-sectional analysis, data from the two waves were pooled; for participants who completed both surveys, only the 2011 baseline record was retained to avoid duplicate measurements and within-participant correlations.
Following the same criteria [
14], we excluded individuals younger than 45 years (
n = 2180), those without sex information (
n = 19), those missing blood pressure measurements for ePWV calculation (
n = 32,927), those lacking serum creatinine measurements required for eGFR calculation (
n = 243), and those with extreme ePWV values (
n = 183). The final analytical sample included 21,853 participants. The CHARLS protocol was approved by the Institutional Review Board of Peking University, and written informed consent was obtained from all the participants.
2.3. Definition of Chronic Kidney Disease (CKD)
CKD was defined as a binary outcome (yes/no) according to the 2021 Kidney Disease: Improving Global Outcomes (KDIGO) guidelines, which require either a reduced glomerular filtration rate or evidence of albuminuria. eGFR was calculated using the CKD-EPI equation. In NHANES, where both serum creatinine and urinary albumin were measured, CKD was defined as eGFR < 60 mL/min/1.73 m
2 or a urinary albumin-to-creatinine ratio (ACR) ≥ 30 mg/g, consistent with the full KDIGO definition; participants meeting neither criterion were classified as non-CKD. In CHARLS, urinary albumin was not measured, and CKD could therefore be ascertained only by the eGFR criterion (eGFR < 60 mL/min/1.73 m
2 alone) [
15]. This inter-cohort difference in case definition was explicitly acknowledged: CHARLS does not capture individuals who have albuminuria with preserved eGFR, and therefore CKD prevalence, all descriptive statistics, and all model-derived estimates differ between the two cohorts by definition and are not directly comparable in absolute terms. Every result reported in this manuscript was generated using the definition stated above for the respective cohort, and all analyses within each cohort are internally consistent with its own case definition.
2.4. Estimation of Pulse Wave Velocity (ePWV)
In this study, estimated pulse wave velocity (ePWV) was calculated using an established equation derived from reference values for arterial stiffness. The calculation was based on age and mean blood pressure (MBP), using the following formula:
MBP was calculated from the systolic and diastolic blood pressures using the following formula: [
13].
2.5. Covariates
Covariates were pre-specified based on prior studies and biological plausibility [
13] and included demographic characteristics (age, sex, race/ethnicity, marital status, educational attainment, and poverty income ratio (PIR) or income category), anthropometric and biochemical measurements (body mass index (BMI), uric acid (UA), total cholesterol (TC), triglycerides (TG), low-density lipoprotein cholesterol (LDL), alanine aminotransferase (ALT), aspartate aminotransferase (AST), hemoglobin (HGB), and estimated glomerular filtration rate (eGFR), which was used only for outcome definition and sensitivity analysis), lifestyle factors (smoking status, alcohol consumption, and physical activity), and self-reported history of chronic conditions including hypertension, diabetes, and dyslipidemia. SBP, DBP, and MBP were not included as covariates in the multivariable models because they are already incorporated into the ePWV calculation; including them would introduce collinearity.
2.6. Weighting and Representativeness
The NHANES employs a multistage, stratified, cluster sampling design to ensure national representativeness. In this study, all analyses incorporated the complex survey design parameters provided by the NHANES, including sampling weights, strata, and primary sampling units. Specifically, the 2-year mobile examination center (MEC) weight (WTMEC2YR) was used; when combining seven survey cycles from 2005 to 2018, the weight was adjusted as WTMEC2YR × 1/7 in accordance with the NHANES analytic guidelines. The SDMVSTRA (stratum variable) and SDMVPSU (primary sampling unit) were also included to produce nationally representative estimates of means, standard errors, and confidence intervals [
16].
CHARLS uses a multistage stratified sampling design to capture a nationally representative sample of middle-aged and older adults in China. In the present study, analyses were conducted without weighting, consistent with prior CHARLS publications [
17]; therefore, the results reflect the general characteristics of the Chinese middle-aged and older population.
2.7. Statistical Analysis
All statistical analyses were conducted using R software version 4.4.3. For the NHANES cohort, appropriate sample weights were applied to account for the complex, multistage stratified sampling design, whereas analyses for the CHARLS cohort were performed without weighting. Continuous variables with a normal distribution were presented as mean ± standard deviation (SD) and compared using independent sample t-tests. Non-normally distributed variables were expressed as medians with interquartile ranges (IQR) and compared using the Wilcoxon rank-sum test. Categorical variables were presented as counts and percentages, and intergroup comparisons were performed using the chi-square test.
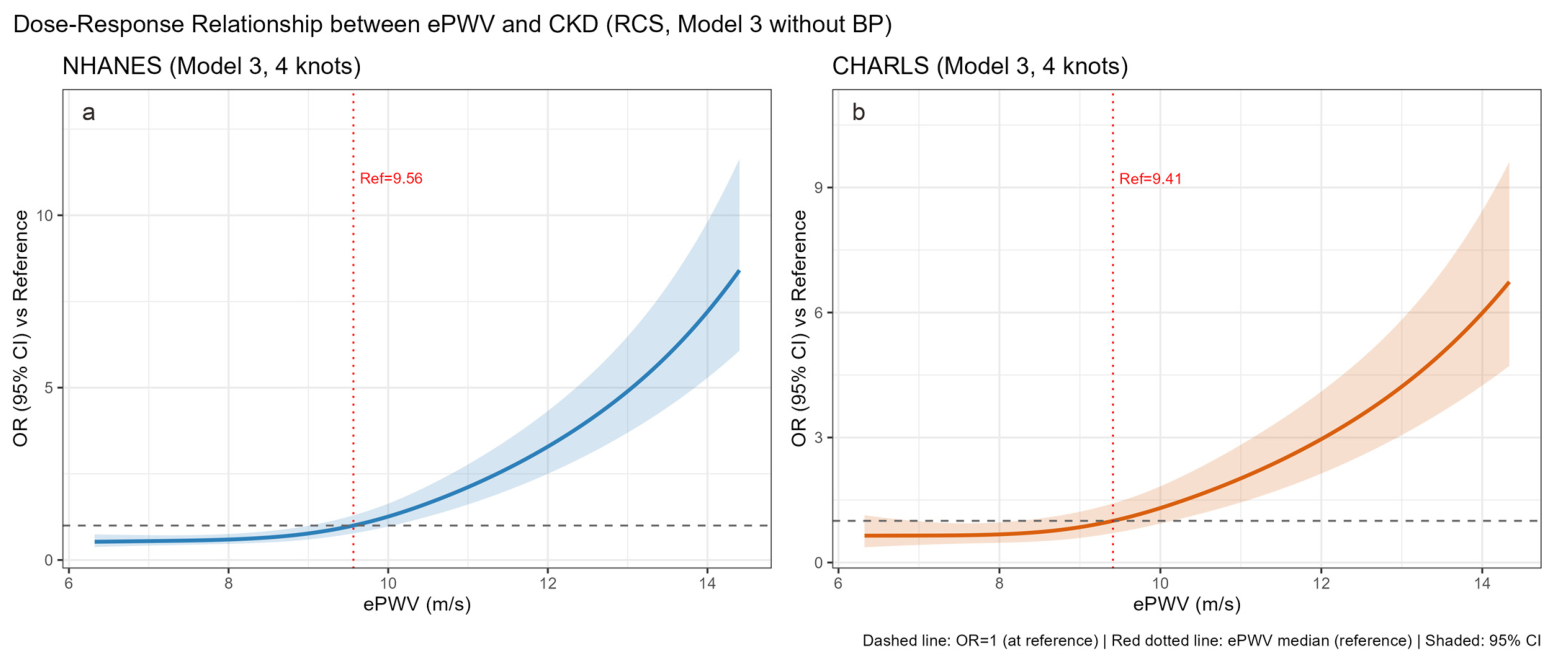
To evaluate the association between ePWV and CKD, multivariable logistic regression models were applied. Three models were progressively constructed: Model 1 was unadjusted; Model 2 was adjusted for sex, residence, marital status, and educational level; and Model 3 was further adjusted for UA, TG, HGB, TC, BMI, LDL-C, hypertension, dyslipidemia, diabetes, alcohol consumption, smoking status, and metabolic equivalents (MET). SBP, DBP, and MBP were not included as covariates because they were already incorporated into the ePWV calculation. Restricted cubic spline (RCS) functions were employed to explore potential nonlinear dose–response relationships between ePWV and CKD risk. Four knots were placed at the 5th, 35th, 65th, and 95th percentiles of the ePWV distribution (NHANES: 7.017, 8.783, 10.461, 13.265; CHARLS: 6.913, 8.683, 10.216, 13.095), with the median ePWV as the reference (NHANES: 9.564; CHARLS: 9.411). Analyses were repeated across the three models (Model 1–3) to assess the robustness of the associations.
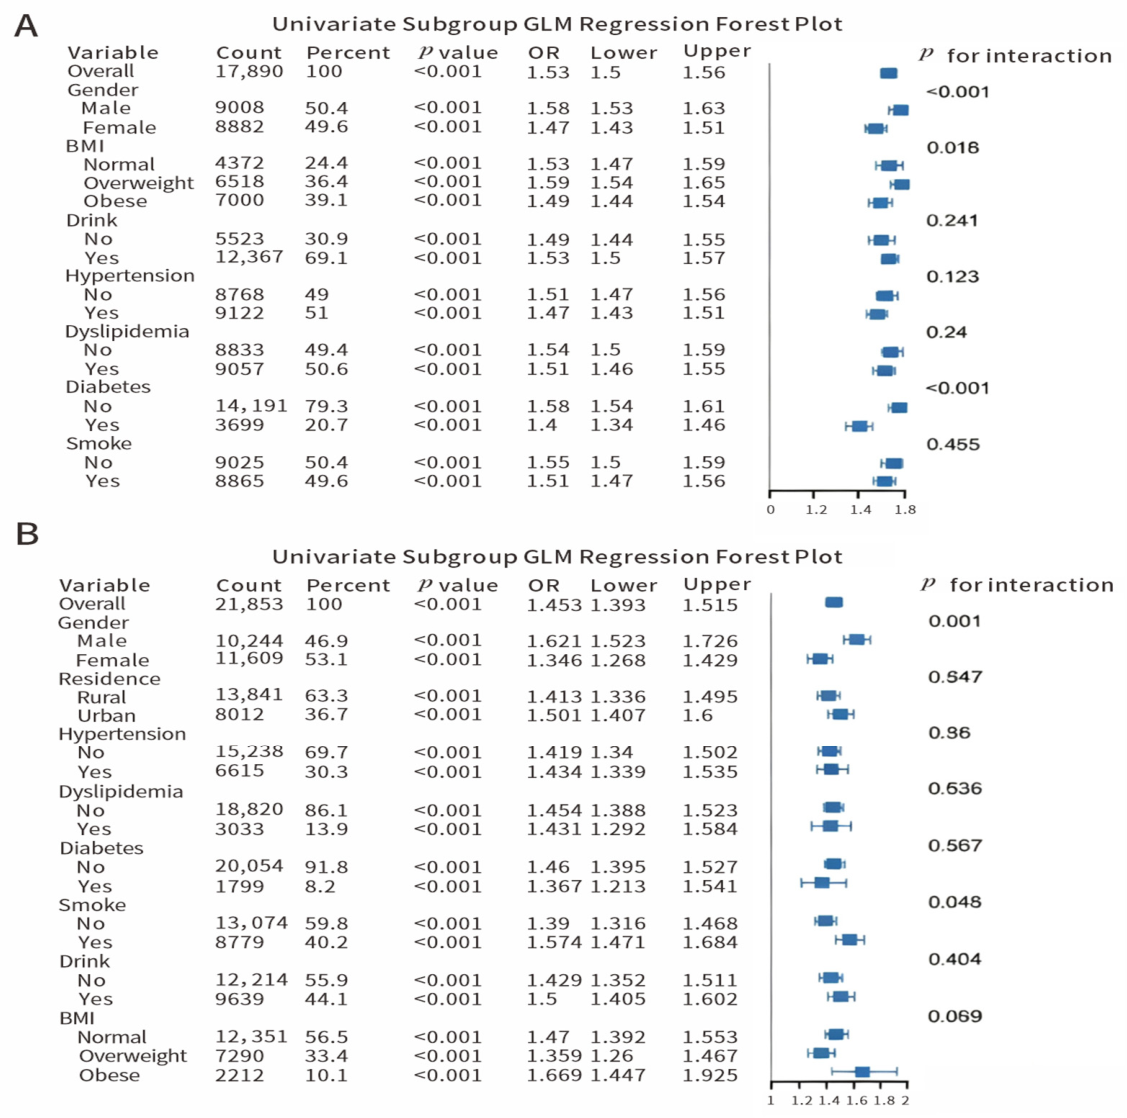
Participants were stratified by sex (male vs. female), body mass index (normal, overweight, obese), alcohol consumption status (no vs. yes), smoking status (no vs. yes), hypertension (no vs. yes), dyslipidemia (no vs. yes), and diabetes (no vs. yes). Within each subgroup, three multivariable logistic regression models (Model 1–3) were constructed to evaluate the association between ePWV and CKD. Odds ratios (ORs) and corresponding 95% confidence intervals (CIs) were reported. To assess potential effect modification, interaction terms were added to the multivariable models, and
p values for interaction were calculated accordingly [
18].
2.8. Machine Learning Analysis
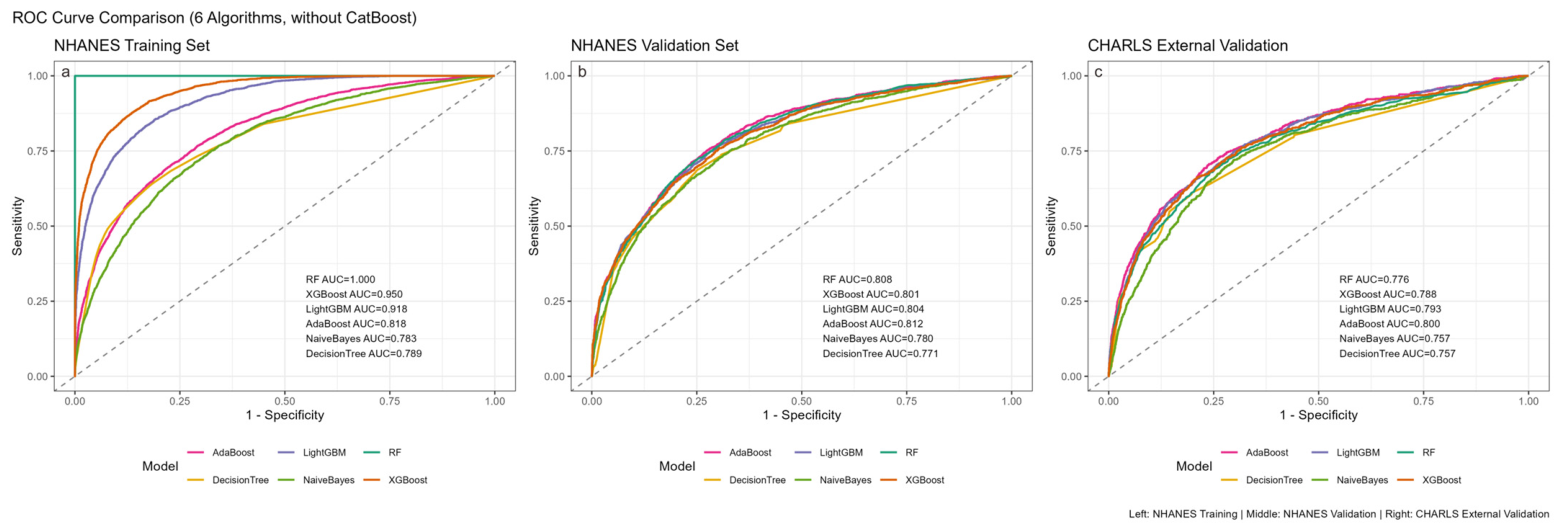
In the machine learning analysis, ePWV and related covariates were used as input features, with CKD status as the outcome variable. The following variables were explicitly excluded from the feature set to prevent target leakage: eGFR and serum creatinine, as both are directly used to define the outcome. Multiple machine learning algorithms were implemented, including Random Forest, XGBoost, LightGBM, AdaBoost, Naive Bayes, and Decision Tree models [
19].
The data from the NHANES cohort were randomly split into training and validation sets in a 7:3 ratio, and external validation was performed using the CHARLS cohort. Continuous variables were standardized using the mean and standard deviation from the training set only; categorical variables were encoded using one-hot encoding. Missing values were imputed using the training set median for continuous variables and the training set mode for categorical variables.
Hyperparameter tuning was performed via a 5-fold grid search within the training set only. Class imbalance was addressed using balanced class weights in all tree-based models. No validation data were used for model training or tuning.
Model performance was evaluated based on accuracy, area under the receiver operating characteristic curve (AUROC) with 95% confidence intervals, F1-score, Matthews correlation coefficient (MCC), sensitivity, and specificity, with average values used to represent overall performance. Discrimination ability was assessed using ROC and precision-recall (PR) curves; calibration was evaluated using calibration curves and Brier scores. Clinical utility was further assessed via decision curve analysis (DCA). Residual Q–Q plots were included as an ancillary tool to visually assess the distributional assumptions of the model residuals, complementing the primary evaluation metrics. Five-fold cross-validation was applied to enhance the robustness of the results, and generalizability was assessed in the external validation set [
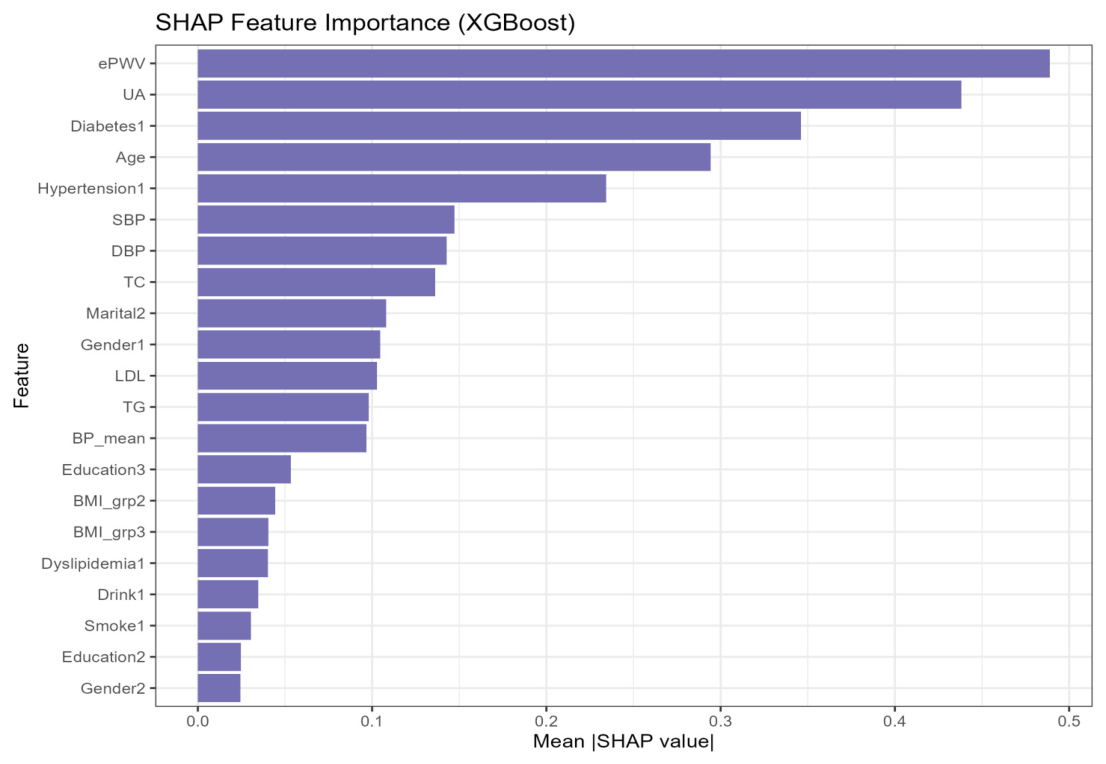
20]. To explore the contribution of each feature to CKD classification, SHAP (SHapley Additive exPlanations) values were calculated and visualized to quantify and interpret the importance and impact of each variable on model predictions.
4. Discussion
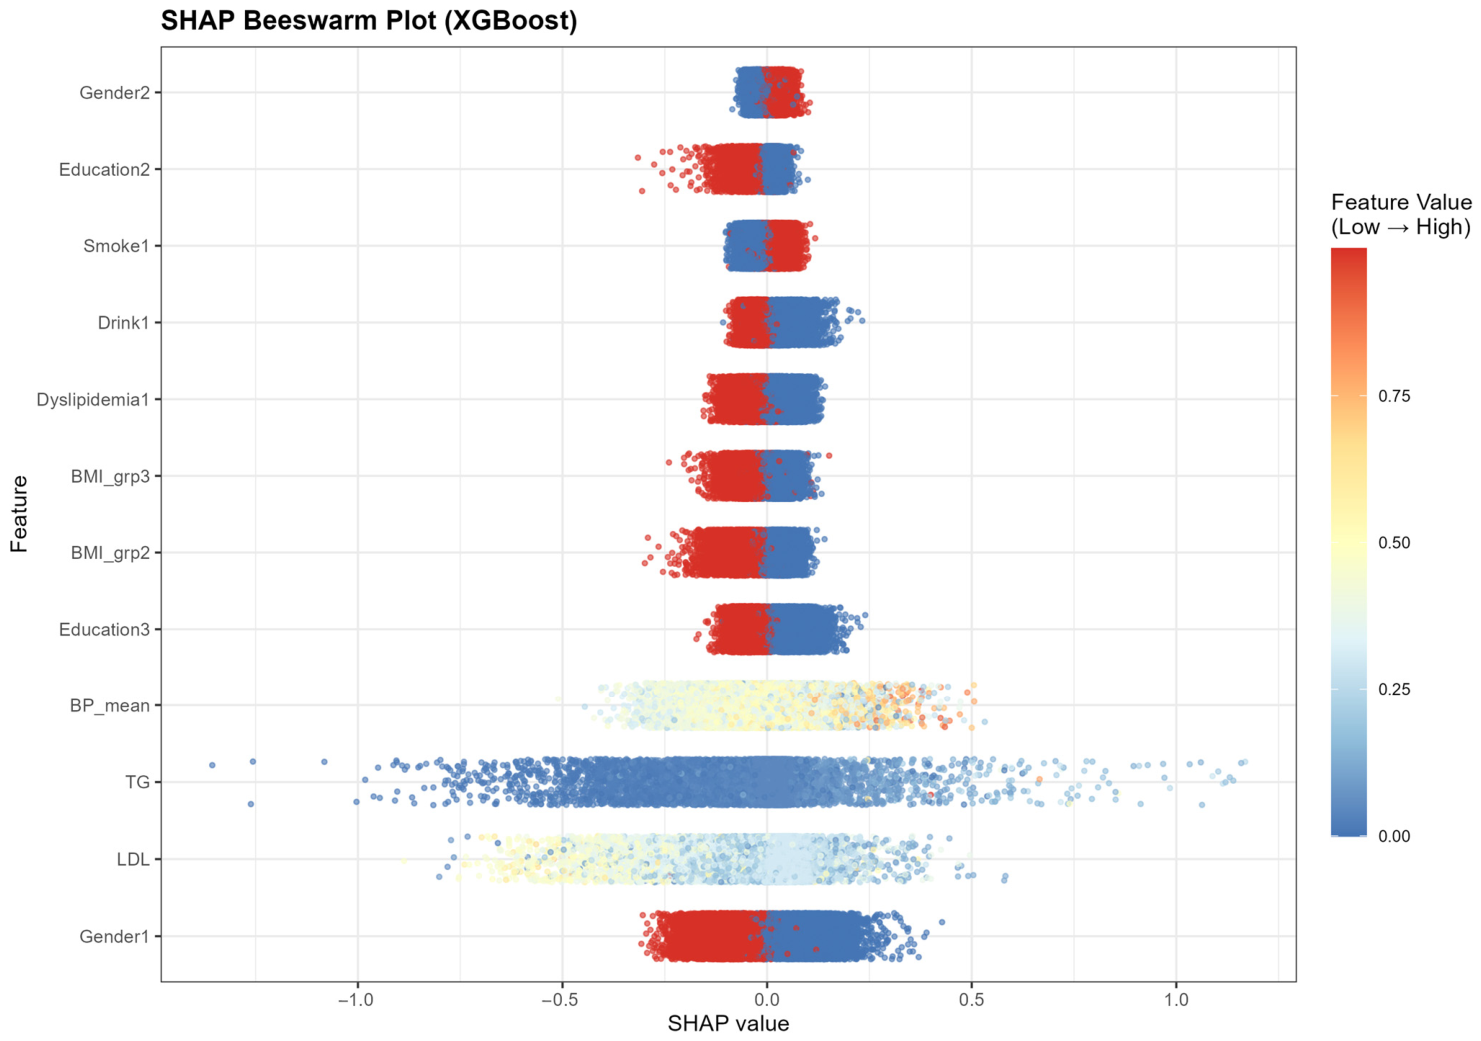
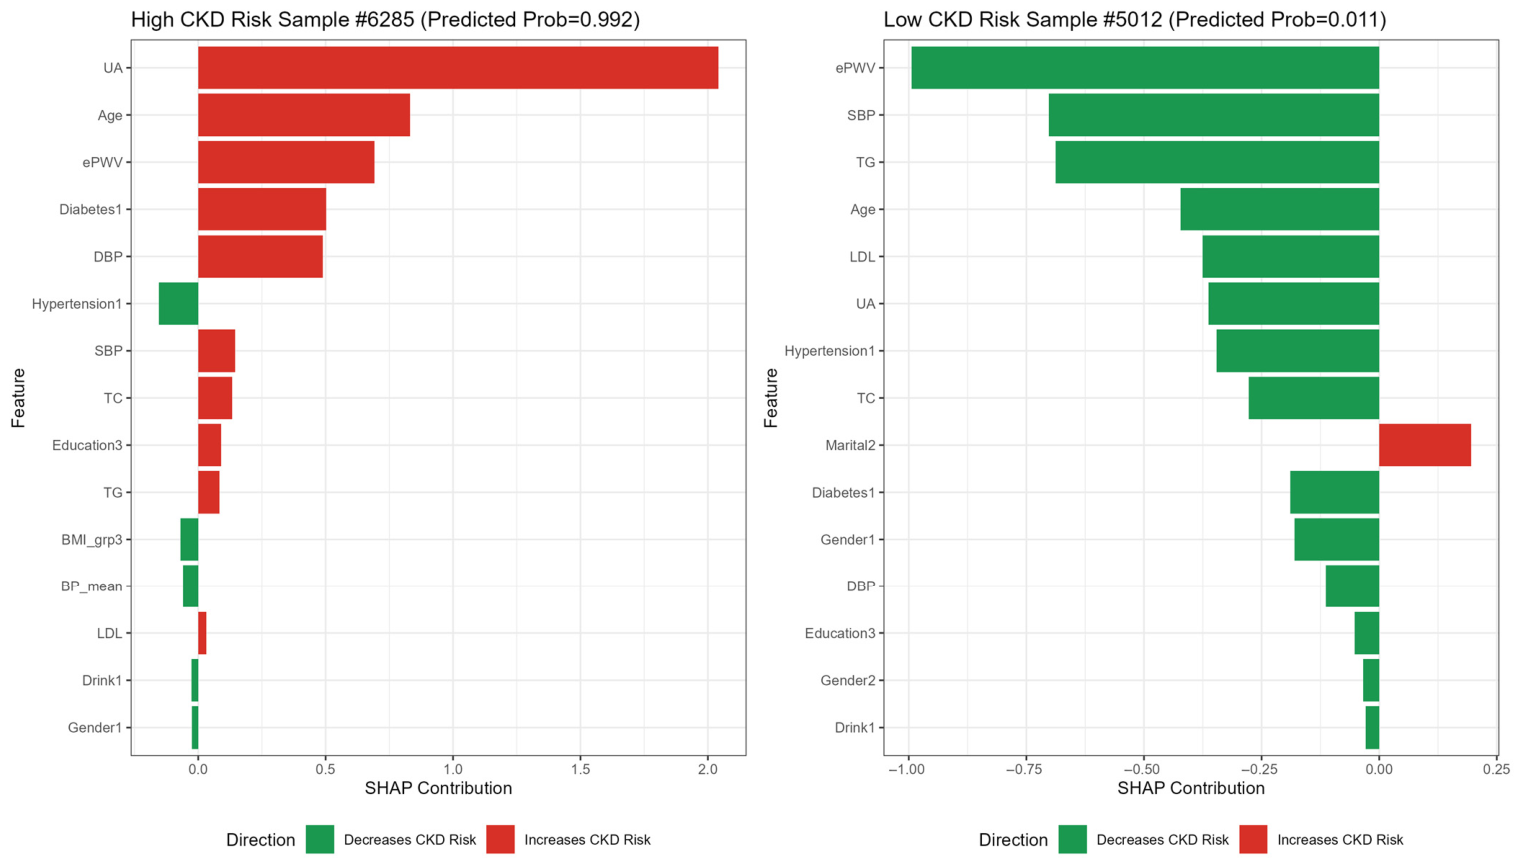
This study systematically investigated the association between estimated pulse wave velocity (ePWV) and chronic kidney disease (CKD) using two nationally representative and independent population-based cohorts, NHANES in the United States and CHARLS in China. The key findings can be summarized as follows: First, in multivariable-adjusted models, elevated ePWV was significantly associated with an increased risk of CKD, showing a clear dose–response relationship. This association was consistently observed across both Western and Eastern populations. Second, subgroup analyses revealed that the association between ePWV and CKD was stronger among men, individuals with obesity, and smokers. Finally, machine learning modeling combined with SHAP-based interpretability analysis demonstrated that ePWV was the highest-ranking feature in model-derived importance. The LightGBM model built upon this feature exhibited consistent and robust discriminative performance.
Extensive prior research has established arterial stiffness as an independent predictor of both the onset and progression of chronic kidney disease (CKD) [
21,
22,
23]. As a simple and accessible surrogate marker, estimated pulse wave velocity (ePWV) has demonstrated associations across various populations and clinical settings in recent years. Analyses of NHANES data have revealed nonlinear or J-shaped associations between ePWV and CKD risk, as well as strong correlations between elevated ePWV and increased all-cause and cardiovascular mortality [
24,
25,
26]. A study based on the MIMIC-IV database also indicated that elevated ePWV significantly predicted poor outcomes—such as increased in-hospital and one-year mortality—in critically ill patients with concurrent CKD and atherosclerosis [
27].
Moreover, several studies suggest that the predictive ability of ePWV may be modified by individual characteristics such as sex, diabetes status, CKD stage, and height, all of which should be taken into account in clinical applications [
28]. Mechanistically, ePWV has been shown to interact with Klotho protein levels, jointly contributing to CKD pathogenesis [
29]. A strong correlation has also been reported between ePWV and carotid atherosclerotic plaque formation, particularly in patients with diabetes [
30].
Beyond these vascular and renal mechanisms, the association between arterial stiffness and CKD may also be interpreted within a broader immunometabolic framework, in which metabolic stress, chronic low-grade inflammation, oxidative imbalance, mitochondrial dysfunction, and vascular injury interact through interconnected feedback mechanisms [
31,
32,
33]. Such network-level interactions may contribute to endothelial and microvascular dysfunction and provide a biological context linking increased arterial stiffness to renal injury. This perspective is consistent with the emerging view that vascular, metabolic, inflammatory, and organ-specific disturbances should be considered as interconnected components of systemic pathophysiology.
Longitudinal cohort studies, such as ARIC, further support these findings by linking higher PWV levels to increased CKD incidence and faster declines in renal function over time [
34].
To our knowledge, the present study is among the first to systematically evaluate the dose–response relationship and model robustness of ePWV for CKD across both U.S. and Chinese population-based datasets. Our results demonstrate that ePWV is consistently associated with CKD in diverse populations, exhibiting greater model-derived feature importance than many traditional risk factors in machine learning models. These findings provide external validation for ePWV and underscore its broad applicability and potential clinical value across different ethnic and health-status groups.
This study found that the association between ePWV and CKD risk was more pronounced in males, individuals with obesity, and smokers. One possible explanation lies in sex-specific vascular aging mechanisms. As highlighted by DuPont et al. in a systematic review, the progression of arterial stiffness differs by sex in relation to age, obesity, and hypertension, with sex hormones and structural vascular differences contributing to variations in arterial elasticity [
35]. In addition, smoking is known to accelerate arterial stiffening by promoting inflammation and endothelial dysfunction, while comorbidities such as hypertension and diabetes further impair vascular health [
36].
Notably, there is currently no strong evidence suggesting that traditional metabolic disorders such as diabetes or hypertension significantly modify the relationship between ePWV and CKD. This suggests that the association between ePWV and CKD is independent of conventional risk factors. From a clinical perspective, early identification of high-risk subgroups—particularly those characterized by male sex or obesity—may inform targeted risk stratification approaches. However, prospective studies are required to determine whether interventions targeting arterial stiffness can delay CKD onset. Nevertheless, in daily clinical practice no calculation—including ePWV—can currently replace the direct assessment of serum creatinine and urine albumin-to-creatinine ratio for individuals identified as at risk of CKD on the basis of traditional risk factors.
In this study, LightGBM, XGBoost, and AdaBoost all demonstrated consistent and robust performance across the training, validation, and external testing sets. Formal DeLong tests showed no statistically significant differences between LightGBM and XGBoost in either internal validation (
p = 0.0655) or external validation (
p = 0.0684). Similar findings have been reported in studies on delayed decision-making in acute ischemic stroke, further supporting the stability and generalizability of these boosting algorithms [
37]. Moreover, SHAP analysis not only confirmed a dose–response relationship for ePWV as a key feature but also revealed complex nonlinear interactions between ePWV and other clinical variables—patterns that are often beyond the explanatory capacity of traditional linear models. More broadly, the integration of quantitative modeling with biologically informative biomarkers and interpretable computational approaches provides a useful framework for translating complex biological signals into clinically meaningful risk assessment [
38,
39,
40]. Comparable methodologies have been successfully applied in the classification of diabetic kidney disease [
41].
These results suggest that ePWV may serve as a potentially useful marker for CKD risk assessment, with broad applicability across diverse populations and health states. Compared with conventional indicators, ePWV offers practical advantages: it is non-invasive, easy to calculate, cost-effective, and more suitable for primary care settings and remote risk assessment. When integrated with artificial intelligence algorithms, its incorporation into electronic health records and mobile health platforms is feasible, potentially enabling early identification and personalized management of CKD risk.
However, it is important to emphasize that no non-invasive calculated metric can replace direct measurement of serum creatinine and urinalysis for identifying individuals at risk of CKD in routine clinical practice. ePWV should be regarded as a complementary tool for risk stratification rather than a substitute for established laboratory-based diagnostic methods.
Limitations
However, several limitations warrant consideration. First, both the NHANES and CHARLS databases are cross-sectional in design, with exposure and outcome assessed at the same point in time; neither temporal sequence nor causality can be established. We therefore describe our findings in terms of association rather than prediction, and confirmation of the predictive value of ePWV requires prospective cohort studies. Second, measurement inconsistencies in certain covariates across the two datasets may introduce residual confounding. Third, CKD was defined by the full KDIGO criteria (eGFR and/or ACR) in NHANES but by the eGFR criterion alone in CHARLS, because urinary albumin was not measured in CHARLS; consequently, CKD prevalence, all descriptive data, and all model-derived estimates differ between the two cohorts by definition, and CHARLS may have missed individuals with albuminuria and preserved eGFR. This difference should be considered when interpreting cross-cohort comparisons.
Fourth, all renal function assessments were based on a single measurement, without confirmation of chronicity. This may lead to misclassification of transient renal function changes as CKD. We therefore use the term “eGFR-defined CKD” for CHARLS analyses where appropriate to reflect this limitation. Fifth, ePWV remains an estimated surrogate marker; its agreement with directly measured carotid-femoral PWV (cfPWV) requires further validation across different populations. Sixth, antihypertensive medication use may influence both blood pressure and ePWV and was not fully adjusted for due to data availability; future studies with detailed medication records are needed to clarify this relationship. Finally, the generalizability of these machine learning findings to other populations or clinical settings requires further external validation.