Digital Divide or Compensatory Dividend? The Longitudinal Impact of Smart Health Monitoring on Intrinsic Capacity Trajectories


Abstract
1. Introduction
2. Materials and Methods
2.1. Data Sources and Sample Selection
2.2. Variable Definitions
2.3. Analytic Strategy
- (1)
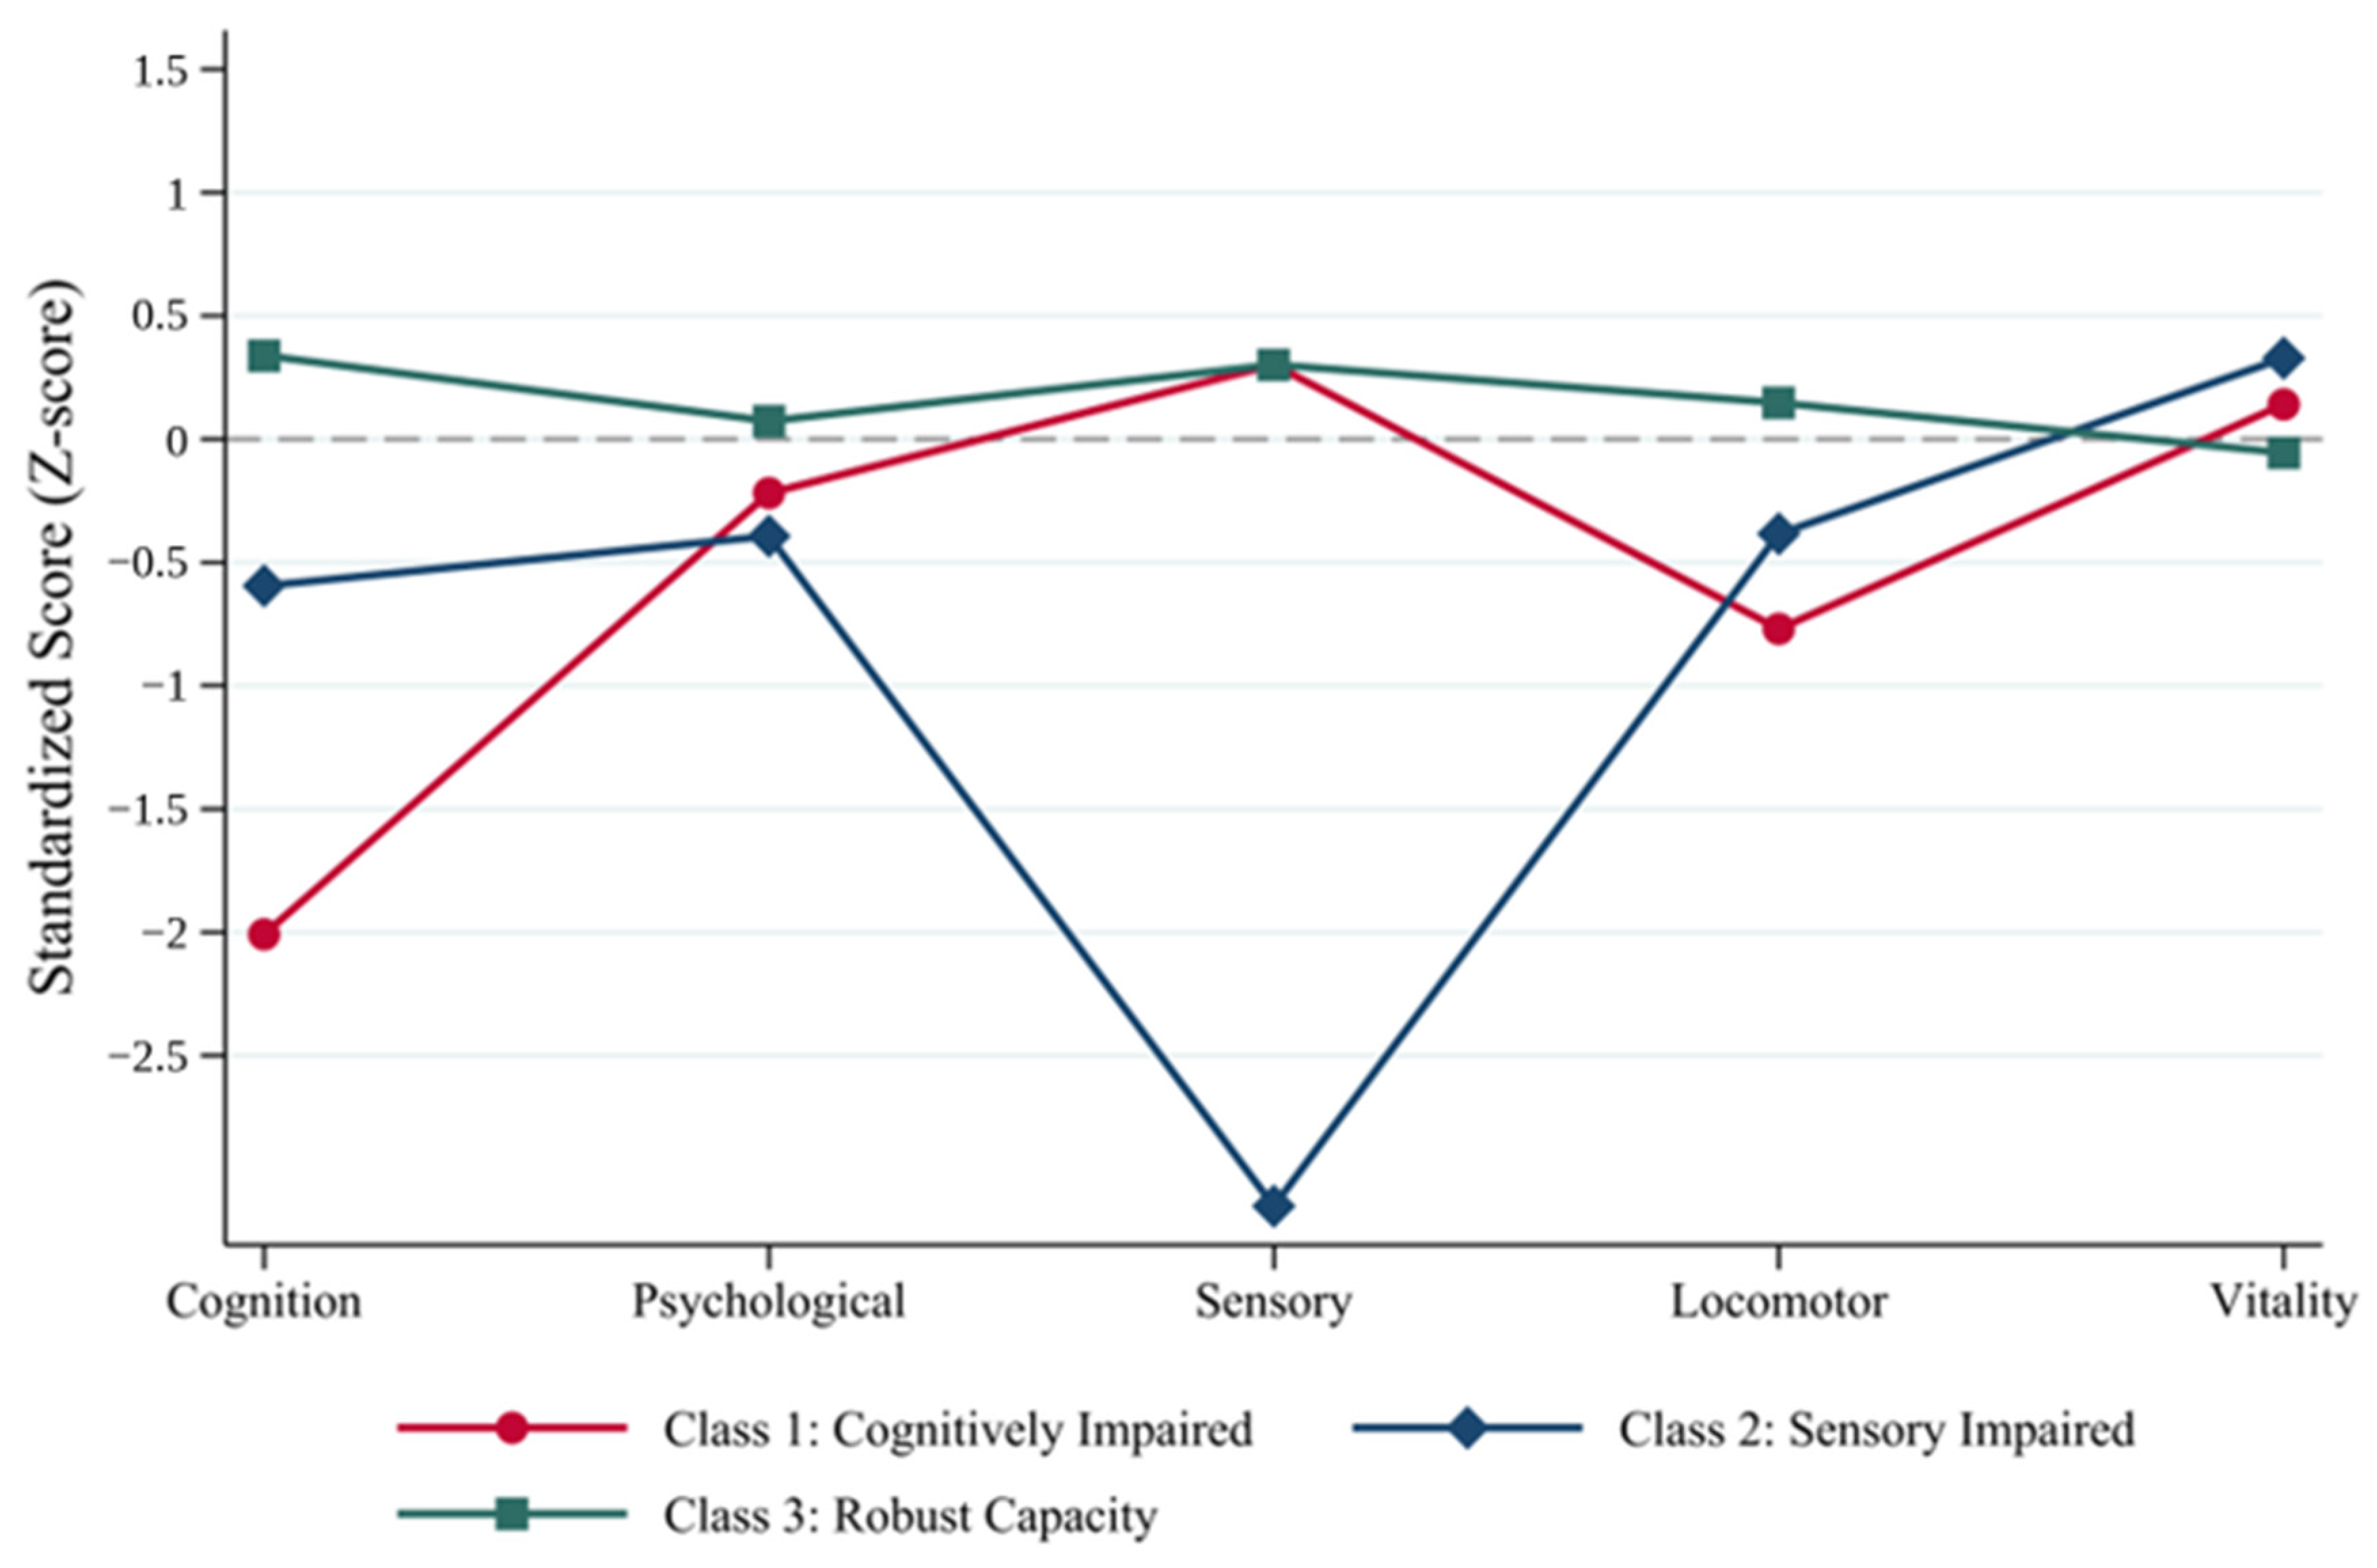
- Latent Profile Analysis (LPA): We utilized the five standardized IC indicators at baseline (Wave 2020) to identify unobserved health states. Models were estimated with robust standard errors. To reduce the risk of local maxima and improve convergence stability, we specified stringent expectation-maximization (EM) iteration settings (emopts (iterate(100)) iterate(200)). Although information criteria (AIC/BIC) slightly favored the 4-class model, its classification quality deteriorated substantially (Entropy dropped to 0.750), and it produced a fragmented latent class comprising only 1.81% of the sample, failing to meet minimum class-size criteria indicating model over-extraction. Therefore, the 3-class model was selected as the optimal taxonomy, balancing empirical fit, high classification quality (Entropy = 0.941), and theoretical interpretability (see Figure 1 for the visualized class characteristics and Table S3 for the full enumeration process). Following class identification, individuals were assigned to their most likely latent profile using modal assignment based on maximum posterior probabilities.
- (2)
- Cross-Wave Profile-Transition Analysis: To describe changes in intrinsic-capacity profiles from 2020 to 2023, we used a classify-then-analyze profile-transition framework. A latent profile model was fitted separately at each wave using the same five standardized intrinsic-capacity domains. Participants were assigned to their most likely profile at each wave using modal assignment based on maximum posterior probabilities. The wave-specific profiles were then matched across waves according to their substantive indicator patterns, and cross-wave transition proportions were calculated.
- (3)
- Confounding Adjustment via IPW-Logit: To evaluate the “digital health dividend,” we employed multinomial logistic regression. To mitigate endogeneity arising from self-selection bias—whereby baseline health-conscious individuals are more likely to adopt digital tools—we utilized Inverse Probability Weighting (IPW) to balance observed covariates between users and non-users, thereby reducing observable selection bias.
- (4)
- IPW Implementation: To mitigate observable selection bias, we implemented Inverse Probability Weighting (IPW). A multivariable logistic regression was used to calculate the propensity scores for smart BP monitor use, conditioning on sociodemographic variables (age, gender, urban residency, marital status, education, log-income), health needs (chronic disease count), and digital literacy (internet use). Unstabilized Average Treatment Effect (ATE) weights were then generated. The 99th percentile of the unstabilized weights was 5.21, indicating no pronounced weight instability; therefore, no trimming was applied. Covariate balance was assessed using Standardized Mean Differences (SMDs), with all covariates achieving SMDs below 0.10 post-weighting (detailed in Supplementary Table S4). Robust sandwich standard errors were employed in the final weighted regression.
- (5)
- Robustness and Mechanism Validation: We verified findings through alternative model specifications and performed structural path analysis to examine whether the longitudinal stabilization of multimorbidity burden mediated the association between digital monitoring and health trajectories.
3. Results
3.1. Baseline Characteristics and Latent Profiles
3.2. Cross-Wave Profile Transitions over Three Years
3.3. Protective Effects of Smart Health Devices on Capacity Transitions
3.4. Heterogeneity in the Digital Health Dividend
3.5. Robustness Checks and Sensitivity Analyses
3.6. Mechanism Exploration: The Exploratory Pathway of Chronic Disease Stability
4. Discussion
4.1. Path Dependence of Intrinsic Capacity and the Vulnerability Trap
4.2. Mechanism Deconstruction: The “Biological Buffer” of Digital Monitoring
4.3. Sociological Critique: Digital Divide vs. Compensatory Digital Dividend
4.4. Policy Implications and Limitations
5. Conclusions
Supplementary Materials
Author Contributions
Funding
Institutional Review Board Statement
Informed Consent Statement
Data Availability Statement
Acknowledgments
Conflicts of Interest
References
- Wang, Y.; Tang, N.; Shao, M.; Song, J.; Su, Q.; Gao, Y. Transitions and trajectories in intrinsic capacity states over time: A systematic review. BMC Geriatr. 2025, 25, 407. [Google Scholar] [CrossRef] [Scilit] [PubMed]
- Astrone, P.; Perracini, M.R.; Martin, F.C.; Marsh, D.R.; Cesari, M. The potential of assessment based on the WHO framework of intrinsic capacity in fragility fracture prevention. Aging Clin. Exp. Res. 2022, 34, 2635–2643. [Google Scholar] [CrossRef] [Scilit] [PubMed]
- Kario, K. Management of hypertension in the digital era: Small wearable monitoring devices for remote blood pressure monitoring. Hypertension 2020, 76, 640–650. [Google Scholar] [CrossRef] [Scilit] [PubMed]
- Omboni, S.; Panzeri, E.; Campolo, L. E-health in hypertension management: An insight into the current and future role of blood pressure telemonitoring. Curr. Hypertens. Rep. 2020, 22, 42. [Google Scholar] [CrossRef] [Scilit] [PubMed]
- Siopis, G.; Moschonis, G.; Eweka, E.; Jung, J.; Kwasnicka, D.; Asare, B.Y.A.; Kodithuwakku, V.; Willems, R.; Verhaeghe, N.; Annemans, L.; et al. Effectiveness, reach, uptake, and feasibility of digital health interventions for adults with hypertension: A systematic review and meta-analysis of randomised controlled trials. Lancet Digit. Health 2023, 5, e144–e159. [Google Scholar] [CrossRef] [Scilit] [PubMed]
- Wang, B.; Gong, R.; Huang, R. Has smart healthcare improved older adults’ health? Evidence from China’s smart city pilot program—A quasi-natural experiment. Digit. Health 2026, 12, 20552076261450604. [Google Scholar] [CrossRef] [Scilit] [PubMed]
- Li, C.; Fan, S.; Li, H. Study on the effectiveness of a community hypertension management model based on home smart blood pressure monitoring using IoT technology. Front. Public Health 2024, 12, 1428310. [Google Scholar] [CrossRef] [Scilit] [PubMed]
- Lin, H.; Wang, Y.; Kim, Y. The rich get richer and the poor get poorer? The effect of news recommendation algorithms in exacerbating inequalities in news engagement and social capital. New Media Soc. 2024, 26, 7371–7394. [Google Scholar]
- Zhang, H.; Liang, S.; Wu, L.; Wang, Y.; Luo, L.; Peng, B.; Xiong, X.; Chen, L.; Jia, Q.; Dai, T.; et al. The usage divide of digital health technology in age-friendly home modifications: An ethnographic study among older adults in rural China. Front. Public Health 2026, 14, 1735560. [Google Scholar] [CrossRef] [Scilit] [PubMed]
- Duan, K. Digital villages construction and subjective well-being of the elderly: Evidence from China longitudinal aging social survey. Appl. Res. Qual. Life 2024, 21, 225–244. [Google Scholar] [CrossRef] [Scilit]
- Li, Z. Digital pathways to reducing depression among aging populations through the “Broadband China” pilot program: Quasi-natural experiment. JMIR Aging 2025, 8, e79260. [Google Scholar] [CrossRef] [Scilit] [PubMed]
- Peng, Y.; Deng, J. Can internet usage reduce health inequality among rural residents? Evidence from China. Front. Public Health 2025, 13, 1743477. [Google Scholar] [CrossRef] [Scilit] [PubMed]
- Dombrowsky, T. Trajectories of functional decline in older adults: A latent class growth curve analysis. West. J. Nurs. Res. 2023, 45, 715–725. [Google Scholar] [CrossRef] [Scilit] [PubMed]
- Peeters, G.; Kok, A.; de Bruin, S.R.; van Campen, C.; Graff, M.; Nieuwboer, M.; Huisman, M.; van Munster, B.; van der Zee, E.A.; Kas, M.J.; et al. Supporting resilience of older adults with cognitive decline requires a multi-level system approach. Gerontology 2023, 69, 866–874. [Google Scholar] [CrossRef] [Scilit] [PubMed]
- Gonzalez-Bautista, E.; Llibre-Guerra, J.J.; Sosa, A.L.; Acosta, I.; Andrieu, S.; Acosta, D.; Llibre-Rodríguez, J.D.J.; Prina, M. Exploring the natural history of intrinsic capacity impairments: Longitudinal patterns in the 10/66 study. Age Ageing 2023, 52, afad137. [Google Scholar] [CrossRef] [Scilit] [PubMed]
- Fang, S.; Liang, Y. Latent transition analysis to explore patterns of physical functional decline among older adults in China: A national 6-year longitudinal study. Arch. Gerontol. Geriatr. 2024, 117, 105223. [Google Scholar] [PubMed]
- Osawa, Y.; Abe, Y.; Takayama, M.; Arai, Y. Six-year transition patterns of activities of daily living in octogenarians: Tokyo oldest old in total health study. BMC Geriatr. 2025, 25, 638. [Google Scholar] [CrossRef] [Scilit] [PubMed]
- Hwang, M.; Chang, A.K. The effect of nurse-led digital health interventions on blood pressure control for people with hypertension: A systematic review and meta-analysis. J. Nurs. Scholarsh. 2023, 55, 1020–1035. [Google Scholar] [CrossRef] [Scilit] [PubMed]
- Clifford, N.; Tunis, R.; Ariyo, A.; Yu, H.; Rhee, H.; Radhakrishnan, K. Trends and gaps in digital precision hypertension management: Scoping review. J. Med. Internet Res. 2025, 27, e59841. [Google Scholar] [CrossRef] [Scilit] [PubMed]
- Ogaz-González, R.; Zou, Q.; Gutiérrez-Robledo, L.M.; Escamilla-Santiago, R.; López-Cervantes, M.; Voshaar, R.C.O.; Corpeleijn, E. Frailty progression: The role of multimorbidity configurations in frailty transitions and predicting mortality risk among older adults. BMC Med. 2026, 24, 27. [Google Scholar] [CrossRef] [Scilit] [PubMed]
- Cui, Y.; Bao, H.; Wen, K.; Wen, H. Bridging the digital health divide: Digital endowment, informal social participation, and health inequality among older adults. BMC Health Serv. Res. 2026, 26, 99. [Google Scholar] [CrossRef] [Scilit] [PubMed]
- Zhao, M.; Wu, C.; Sha, S.; Si, Y.; Peng, S.; Wang, K. Longitudinal transitions in intrinsic capacity profiles and their associations with subsequent adverse outcomes among Chinese older adults: A nationwide prospective cohort study. Geriatr. Nurs. 2025, 64, 103351. [Google Scholar] [CrossRef] [Scilit] [PubMed]
- Cheng, Y.; Xiao, S.; Cai, Y.; Jing, L.; Li, W.; Liu, X. Patterns of intrinsic capacity impairment and their longitudinal association with possible sarcopenia in older adults: A latent class analysis. Maturitas 2026, 206, 108838. [Google Scholar] [CrossRef] [Scilit] [PubMed]
- Yu, J.; Si, H.; Jin, Y.; Qiao, X.; Ji, L.; Bian, Y.; Liu, Q.; Wang, W.; Wang, C. Patterns of intrinsic capacity among community-dwelling older adults: Identification by latent class analysis and association with one-year adverse outcomes. Geriatr. Nurs. 2022, 45, 223–229. [Google Scholar] [CrossRef] [Scilit] [PubMed]
- Wang, Q.; Zhang, S.; Wang, Y.; Zhao, D.; Chen, X.; Zhou, C. The effect of dual sensory impairment and Multimorbidity patterns on functional impairment: A longitudinal cohort of Middle-Aged and older adults in China. Front. Aging Neurosci. 2022, 14, 807383. [Google Scholar] [CrossRef] [Scilit] [PubMed]
- Palmese, F.; Vetrano, D.L.; Gregorio, C.; Calderón-Larrañaga, A.; Welmer, A.K.; Marengoni, A.; Bedogni, G.; Domenicali, M.; Triolo, F. Multimorbidity patterns and 15-year trajectories of physical performance: A population-based study. BMC Med. 2026, 24, 216. [Google Scholar] [CrossRef] [Scilit] [PubMed]
- Jia, S.; Zhao, W.; Ge, M.; Xia, X.; Hu, F.; Hao, Q.; Zhang, Y.; Yang, M.; Yue, J.; Dong, B. Associations between transitions of intrinsic capacity and frailty status, and 3-year disability. BMC Geriatr. 2023, 23, 96. [Google Scholar] [CrossRef] [Scilit] [PubMed]
- Kario, K.; Tomitani, N.; Wang, T.D.; Park, S.; Li, Y.; Shin, J.; Tsoi, K.; Chen, C.H.; Cheng, H.M.; Siddique, S.; et al. Home blood pressure-centered approach–from digital health to medical practice: HOPE Asia Network consensus statement 2023. Hypertens. Res. 2023, 46, 2561–2574. [Google Scholar] [CrossRef] [Scilit] [PubMed]
- Niu, R.; Li, K. Systematic review of the impact of digital health technologies on blood pressure control and treatment adherence in young and middle-aged hypertensive patients. Front. Cardiovasc. Med. 2026, 13, 1708019. [Google Scholar] [CrossRef] [Scilit] [PubMed]
- Maimaitiyiming, M.; Yang, Y.; Jia, X.; Zhang, X. Association of body age and multiorgan ages with cognitive decline in older adults: A nationwide longitudinal study. Age Ageing 2025, 54, afaf132. [Google Scholar] [CrossRef] [Scilit] [PubMed]
- Zhou, X.; Liu, Z.; Liu, J.; Tao, H.; Zhang, T. Inflammatory score, intrinsic capacity and the risk of new-onset chronic lung disease: A cohort study from the China Health and Retirement Longitudinal Study. J. Thorac. Dis. 2026, 18, 69. [Google Scholar] [CrossRef] [Scilit] [PubMed]
- Treskes, R.W.; van Winden, L.A.; van Keulen, N.; van der Velde, E.T.; Beeres, S.L.; Atsma, D.E.; Schalij, M.J. Effect of smartphone-enabled health monitoring devices vs regular follow-up on blood pressure control among patients after myocardial infarction: A randomized clinical trial. JAMA Netw. Open 2020, 3, e20216. [Google Scholar] [CrossRef] [Scilit]
- Li, Z.; Wang, Y.; Zheng, L.; Xu, H. Activating health behaviors: How does digital infrastructure improve the physical health of middle-aged and older adults? Evidence from the ‘Broadband China’ pilot policy. Glob. Health Action 2025, 18, 2568779. [Google Scholar] [CrossRef] [Scilit] [PubMed]
- Guo, K.; Wang, T. Social media use and health empowerment among Chinese adults: The critical role of eHealth literacy and community interventions. BMC Psychol. 2026, 14, 920. [Google Scholar] [CrossRef] [Scilit] [PubMed]
- Duan, K. Digital divide or digital dividend: The impact of digital economy development on the elderly. Behav. Inform. Technol. 2026, 45, 332–347. [Google Scholar]
- Yang, M.; Chen, L.; Guo, W. Social participation and subjective well-being among older adults in China: The mediation effect of media use. Curr. Psychol. 2024, 43, 20041–20055. [Google Scholar] [CrossRef] [Scilit]
- Duan, K.; Li, J. Rural digitalization and health outcomes of older adults in China. Health Policy Technol. 2025, 14, 101038. [Google Scholar] [CrossRef] [Scilit]
- Yang, M.; Wu, L.; Zeng, Y.; Zhao, C.; Ye, H.; Wang, J.; Hao, R. Smart community hypertension management: A narrative review of promises and challenges. J. Multidiscip. Healthc. 2026, 19, 583914. [Google Scholar] [PubMed]
- Shie, A.J.; Xu, E.M.; Ye, Z.Z.; Meng, Q.F.; Wu, Y.J. Sustainable innovative design of elderly-friendly smart medical products: An integrated model. Sustainability 2024, 16, 7580. [Google Scholar] [CrossRef] [Scilit]
- Cristiano, A.; Musteata, S.; De Silvestri, S.; Bellandi, V.; Ceravolo, P.; Cesari, M.; Azzolino, D.; Sanna, A.; Trojaniello, D. Older adults’ and clinicians’ perspectives on a smart health platform for the aging population: Design and evaluation study. JMIR Aging 2022, 5, e29623. [Google Scholar] [CrossRef] [Scilit] [PubMed]
- Gu, D.; Feng, Q.; Yang, F.; Wang, K. Social Media Use and Subjective Well-Being Among Older Adults in China. In ICT Use and Healthy Longevity: Empirical Data and Perspectives; Springer Nature: Cham, Switzerland, 2025; pp. 391–410. [Google Scholar]
- Parupelli, S.K.; Desai, S. The 3D printing of nanocomposites for wearable biosensors: Recent advances, challenges, and prospects. Bioengineering 2023, 11, 32. [Google Scholar] [CrossRef] [Scilit] [PubMed]
- Lin, S.; Wang, F.; Zheng, J.; Yuan, Y.; Huang, F.; Zhu, P. Intrinsic capacity declines with elevated homocysteine in community-dwelling Chinese older adults. Clin. Interv. Aging 2022, 17, 1057–1068. [Google Scholar] [CrossRef] [Scilit] [PubMed]



| Characteristics | Total Sample (N = 2432) | Class 1: Cognitively Impaired (n = 266, 10.9%) | Class 2: Sensory Impaired (n = 215, 8.8%) | Class 3: Robust Capacity (n = 1951, 80.2%) | p-Value |
|---|---|---|---|---|---|
| Intrinsic Capacity Indicators | |||||
| Cognition score (0–13) | 11.33 (2.10) | 7.11 (1.38) | 10.08 (2.69) | 12.04 (1.16) | <0.001 |
| Psychological capacity (0–18) | 11.73 (3.41) | 10.89 (3.57) | 10.29 (3.19) | 11.89 (3.38) | <0.001 |
| Sensory capacity (0–2) | 1.92 (0.30) | 2.00 (0.00) | 0.93 (0.26) | 2.00 (0.00) | <0.001 |
| Locomotor function (2–16) | 15.61 (1.34) | 14.60 (2.78) | 15.12 (2.03) | 15.83 (0.74) | <0.001 |
| Vitality (BMI) | 23.49 (2.61) | 23.85 (2.76) | 24.35 (2.69) | 23.33 (2.60) | <0.001 |
| Sociodemographic Covariates | |||||
| Age (Years) | 68.38 (4.70) | 69.86 (5.21) | 70.65 (5.63) | 67.93 (4.40) | <0.001 |
| Female (%) | 50.58 | 53.38 | 54.88 | 49.77 | 0.230 |
| Urban residents (%) | 87.58 | 80.83 | 82.33 | 89.08 | <0.001 |
| Married and cohabiting (%) | 83.51 | 74.81 | 81.86 | 84.88 | <0.001 |
| Educational attainment (%) | <0.001 | ||||
| -- Primary school and below | 9.62 | 23.31 | 16.28 | 7.02 | |
| -- Primary school | 23.68 | 31.2 | 27.44 | 22.25 | |
| -- Junior high school | 42.39 | 33.08 | 34.88 | 44.49 | |
| -- Senior high school and above | 24.30 | 12.41 | 21.4 | 26.24 | |
| Personal income (ln) | 8.86 (1.06) | 8.59 (1.25) | 8.97 (1.19) | 8.88 (1.01) | <0.001 |
| Family and Health Covariates | |||||
| Household size | 2.56 (1.19) | 2.80 (1.30) | 2.97 (1.33) | 2.57 (1.22) | <0.001 |
| Number of living children | 1.78 (0.92) | 1.91 (0.99) | 1.77 (0.93) | 1.76 (0.91) | 0.045 |
| Chronic conditions count | 1.69 (1.34) | 1.81 (1.43) | 2.30 (1.79) | 1.60 (1.25) | <0.001 |
| Internet use habit (%) | 52.34 | 25.19 | 39.07 | 57.51 | <0.001 |
| Social network activity (0–8) | 3.21 (1.70) | 3.02 (1.58) | 3.18 (1.46) | 3.25 (1.74) | 0.082 |
| Baseline Latent Class (Wave 2020) | Assigned Profile in 2023, Row Percentage (%) | Total Baseline N | ||
|---|---|---|---|---|
| Class 1: Cognitively Impaired | Class 2: Sensory Impaired | Class 3: Robust Capacity | ||
| Class 1: Cognitively Impaired | 10.53 | 2.26 | 87.22 | 266 |
| Class 2: Sensory Impaired | 6.51 | 62.79 | 30.7 | 215 |
| Class 3: Robust Capacity | 1.18 | 1.49 | 97.33 | 1951 |
| Total Sample Distribution (2023) | 2.67 | 6.99 | 90.34 | 2432 |
| Predictors (Wave 2020) | Class 1: Cognitively Impaired | Class 2: Sensory Impaired | ||
|---|---|---|---|---|
| RRR (95% CI) | p-Value | RRR (95% CI) | p-Value | |
| Baseline Profile (Ref = Robust) | ||||
| - Class 1: Cognitively Impaired | 0.173 (0.089, 0.337) | <0.001 | 0.646 (0.269, 1.553) | 0.329 |
| - Class 2: Sensory Impaired | 1.511 (0.683, 3.342) | 0.308 | 96.397 (41.269, 225.169) | <0.001 |
| Smart Device Usage | ||||
| - Electronic BP monitor | 1.433 (0.775, 2.647) | 0.251 | 0.557 (0.325, 0.955) | 0.033 |
| - Blood lipid tester | 0.801 (0.339, 1.890) | 0.612 | 1.640 (0.842, 3.191) | 0.146 |
| - Smart wristband/watch | 1.242 (0.472, 3.267) | 0.661 | 0.757 (0.383, 1.497) | 0.424 |
| - Smart health terminal | 1.812 (0.653, 5.030) | 0.254 | 1.240 (0.629, 2.443) | 0.535 |
| - Smart wheelchair | 2.284 (0.829, 6.293) | 0.110 | 1.251 (0.456, 3.437) | 0.664 |
| - Infrared monitor/camera | 0.564 (0.083, 3.861) | 0.560 | 1.241 (0.353, 4.367) | 0.736 |
| - Smart sleep monitor | 1.108 (0.254, 4.830) | 0.892 | 0.488 (0.154, 1.549) | 0.223 |
| - Audiobooks/Smart audio | 0.835 (0.189, 3.691) | 0.812 | 1.812 (0.861, 3.813) | 0.117 |
| Covariates | ||||
| - Age (Years) | 1.168 (1.104, 1.235) | <0.001 | 1.074 (1.013, 1.139) | 0.017 |
| - Male (Ref = Female) | 0.723 (0.410, 1.274) | 0.262 | 0.495 (0.310, 0.790) | 0.003 |
| - Urban resident | 0.218 (0.093, 0.511) | <0.001 | 0.735 (0.353, 1.531) | 0.411 |
| - Married and cohabiting | 0.666 (0.360, 1.232) | 0.196 | 0.808 (0.439, 1.486) | 0.493 |
| - Educational attainment | 1.011 (0.725, 1.409) | 0.949 | 1.017 (0.779, 1.327) | 0.903 |
| - Personal income (ln) | 1.496 (1.077, 2.079) | 0.016 | 0.831 (0.616, 1.122) | 0.227 |
| - Household size | 0.979 (0.756, 1.268) | 0.874 | 1.028 (0.831, 1.272) | 0.797 |
| - Living children count | 0.981 (0.735, 1.309) | 0.894 | 0.888 (0.651, 1.212) | 0.453 |
| - Chronic conditions count | 1.077 (0.878, 1.320) | 0.478 | 1.108 (0.964, 1.274) | 0.150 |
| - Internet use habit | 0.626 (0.271, 1.444) | 0.272 | 1.412 (0.815, 2.446) | 0.219 |
| - Social network score | 0.759 (0.602, 0.957) | 0.020 | 0.988 (0.862, 1.133) | 0.865 |
| Models | Estimation Strategy | RRR (95% CI) | p-Value |
|---|---|---|---|
| Model 1 | Baseline Multinomial Logit (Reduced Covariates) | 0.626 (0.378, 1.036) | 0.069 |
| Model 2 | Inverse Probability Weighting (IPW) | 0.696 (0.419, 1.156) | 0.162 |
| Model 3 | Controlling for Continuous Baseline Z-scores | 0.581 (0.344, 0.984) | 0.043 |
| Model 4 | Restricted Subsample (Active Internet Users Only) | 0.531 (0.236, 1.196) | 0.126 |
| Effect Component | Coefficient (Log-Odds) | Robust Std. Err. | z-Value | p-Value | 95% CI |
|---|---|---|---|---|---|
| Total Effect (Reduced) | −0.510 | 0.284 | −1.80 | 0.072 | (−1.067, 0.047) |
| Direct Effect (Full) | −0.491 | 0.285 | −1.72 | 0.085 | (−1.050, 0.068) |
| Indirect Effect (Diff) | −0.019 | 0.017 | −1.14 | 0.256 | (−0.052, 0.014) |
Disclaimer/Publisher’s Note: The statements, opinions and data contained in all publications are solely those of the individual author(s) and contributor(s) and not of MDPI and/or the editor(s). MDPI and/or the editor(s) disclaim responsibility for any injury to people or property resulting from any ideas, methods, instructions or products referred to in the content. |
© 2026 by the authors. Licensee MDPI, Basel, Switzerland. This article is an open access article distributed under the terms and conditions of the Creative Commons Attribution (CC BY) license.
Share and Cite
Zhang, B.; Liu, Y.; Li, S.; Zhang, L.; Guo, L. Digital Divide or Compensatory Dividend? The Longitudinal Impact of Smart Health Monitoring on Intrinsic Capacity Trajectories. Healthcare 2026, 14, 2254. https://doi.org/10.3390/healthcare14152254
Zhang B, Liu Y, Li S, Zhang L, Guo L. Digital Divide or Compensatory Dividend? The Longitudinal Impact of Smart Health Monitoring on Intrinsic Capacity Trajectories. Healthcare. 2026; 14(15):2254. https://doi.org/10.3390/healthcare14152254
Chicago/Turabian StyleZhang, Bin, Ying Liu, Shanna Li, Linlin Zhang, and Lin Guo. 2026. "Digital Divide or Compensatory Dividend? The Longitudinal Impact of Smart Health Monitoring on Intrinsic Capacity Trajectories" Healthcare 14, no. 15: 2254. https://doi.org/10.3390/healthcare14152254
APA StyleZhang, B., Liu, Y., Li, S., Zhang, L., & Guo, L. (2026). Digital Divide or Compensatory Dividend? The Longitudinal Impact of Smart Health Monitoring on Intrinsic Capacity Trajectories. Healthcare, 14(15), 2254. https://doi.org/10.3390/healthcare14152254