

Associations between Parental Educational Attainment, Children’s 24-h Behaviors and Children’s Hyperactivity Behavior in the COVID-19 Pandemic

 ,
,  , ,
, ,
Abstract

1. Introduction
1.1. Social-Ecological Theory and Children’s Hyperactive Behavior
1.2. Parental Educational Attainment and Children’s Hyperactive Behavior
1.3. Children’s Hyperactivity and Behavior Changes during COVID-19 Pandemic
2. Methods
2.1. Procedures and Participants
2.2. Survey Instruments
2.2.1. Parent-Surveillance of Digital Media in Childhood Questionnaire (Parent-smalQ®)
2.2.2. Abbreviated Rating Scales from the Conners Parent Symptom Questionnaire (PSQ)
2.3. Data Processing
2.3.1. Behavior Changes in Children’s Physical Activity, Sleep, and Digital Media (CPA, CSL, and CDM) Because of the COVID-19 Pandemic
2.3.2. Children’s Physical Activity, Sleep, and Digital Media (CPA, CSL, and CDM)
2.3.3. Parental Educational Attainment (PEA)
2.3.4. Children’s Hyperactivity Index (CHI)
2.4. Data Analysis
3. Results
3.1. Sample Description and Descriptive Analyses

| Characteristics | Total (N = 11,190) | Hyperactivity Tendency (N = 314) | Non-Hyperactivity Tendency (N = 10,876) | |
|---|---|---|---|---|
| Age | 8.65 (1.85) | 8.44 (1.71) | 8.66 (1.85) | |
| Sex | girl | 5795 (41.30) | 199 (63.40) | 5596 (51.50) |
| boy | 5395 (38.50) | 115 (36.6) | 5280 (48.50) | |
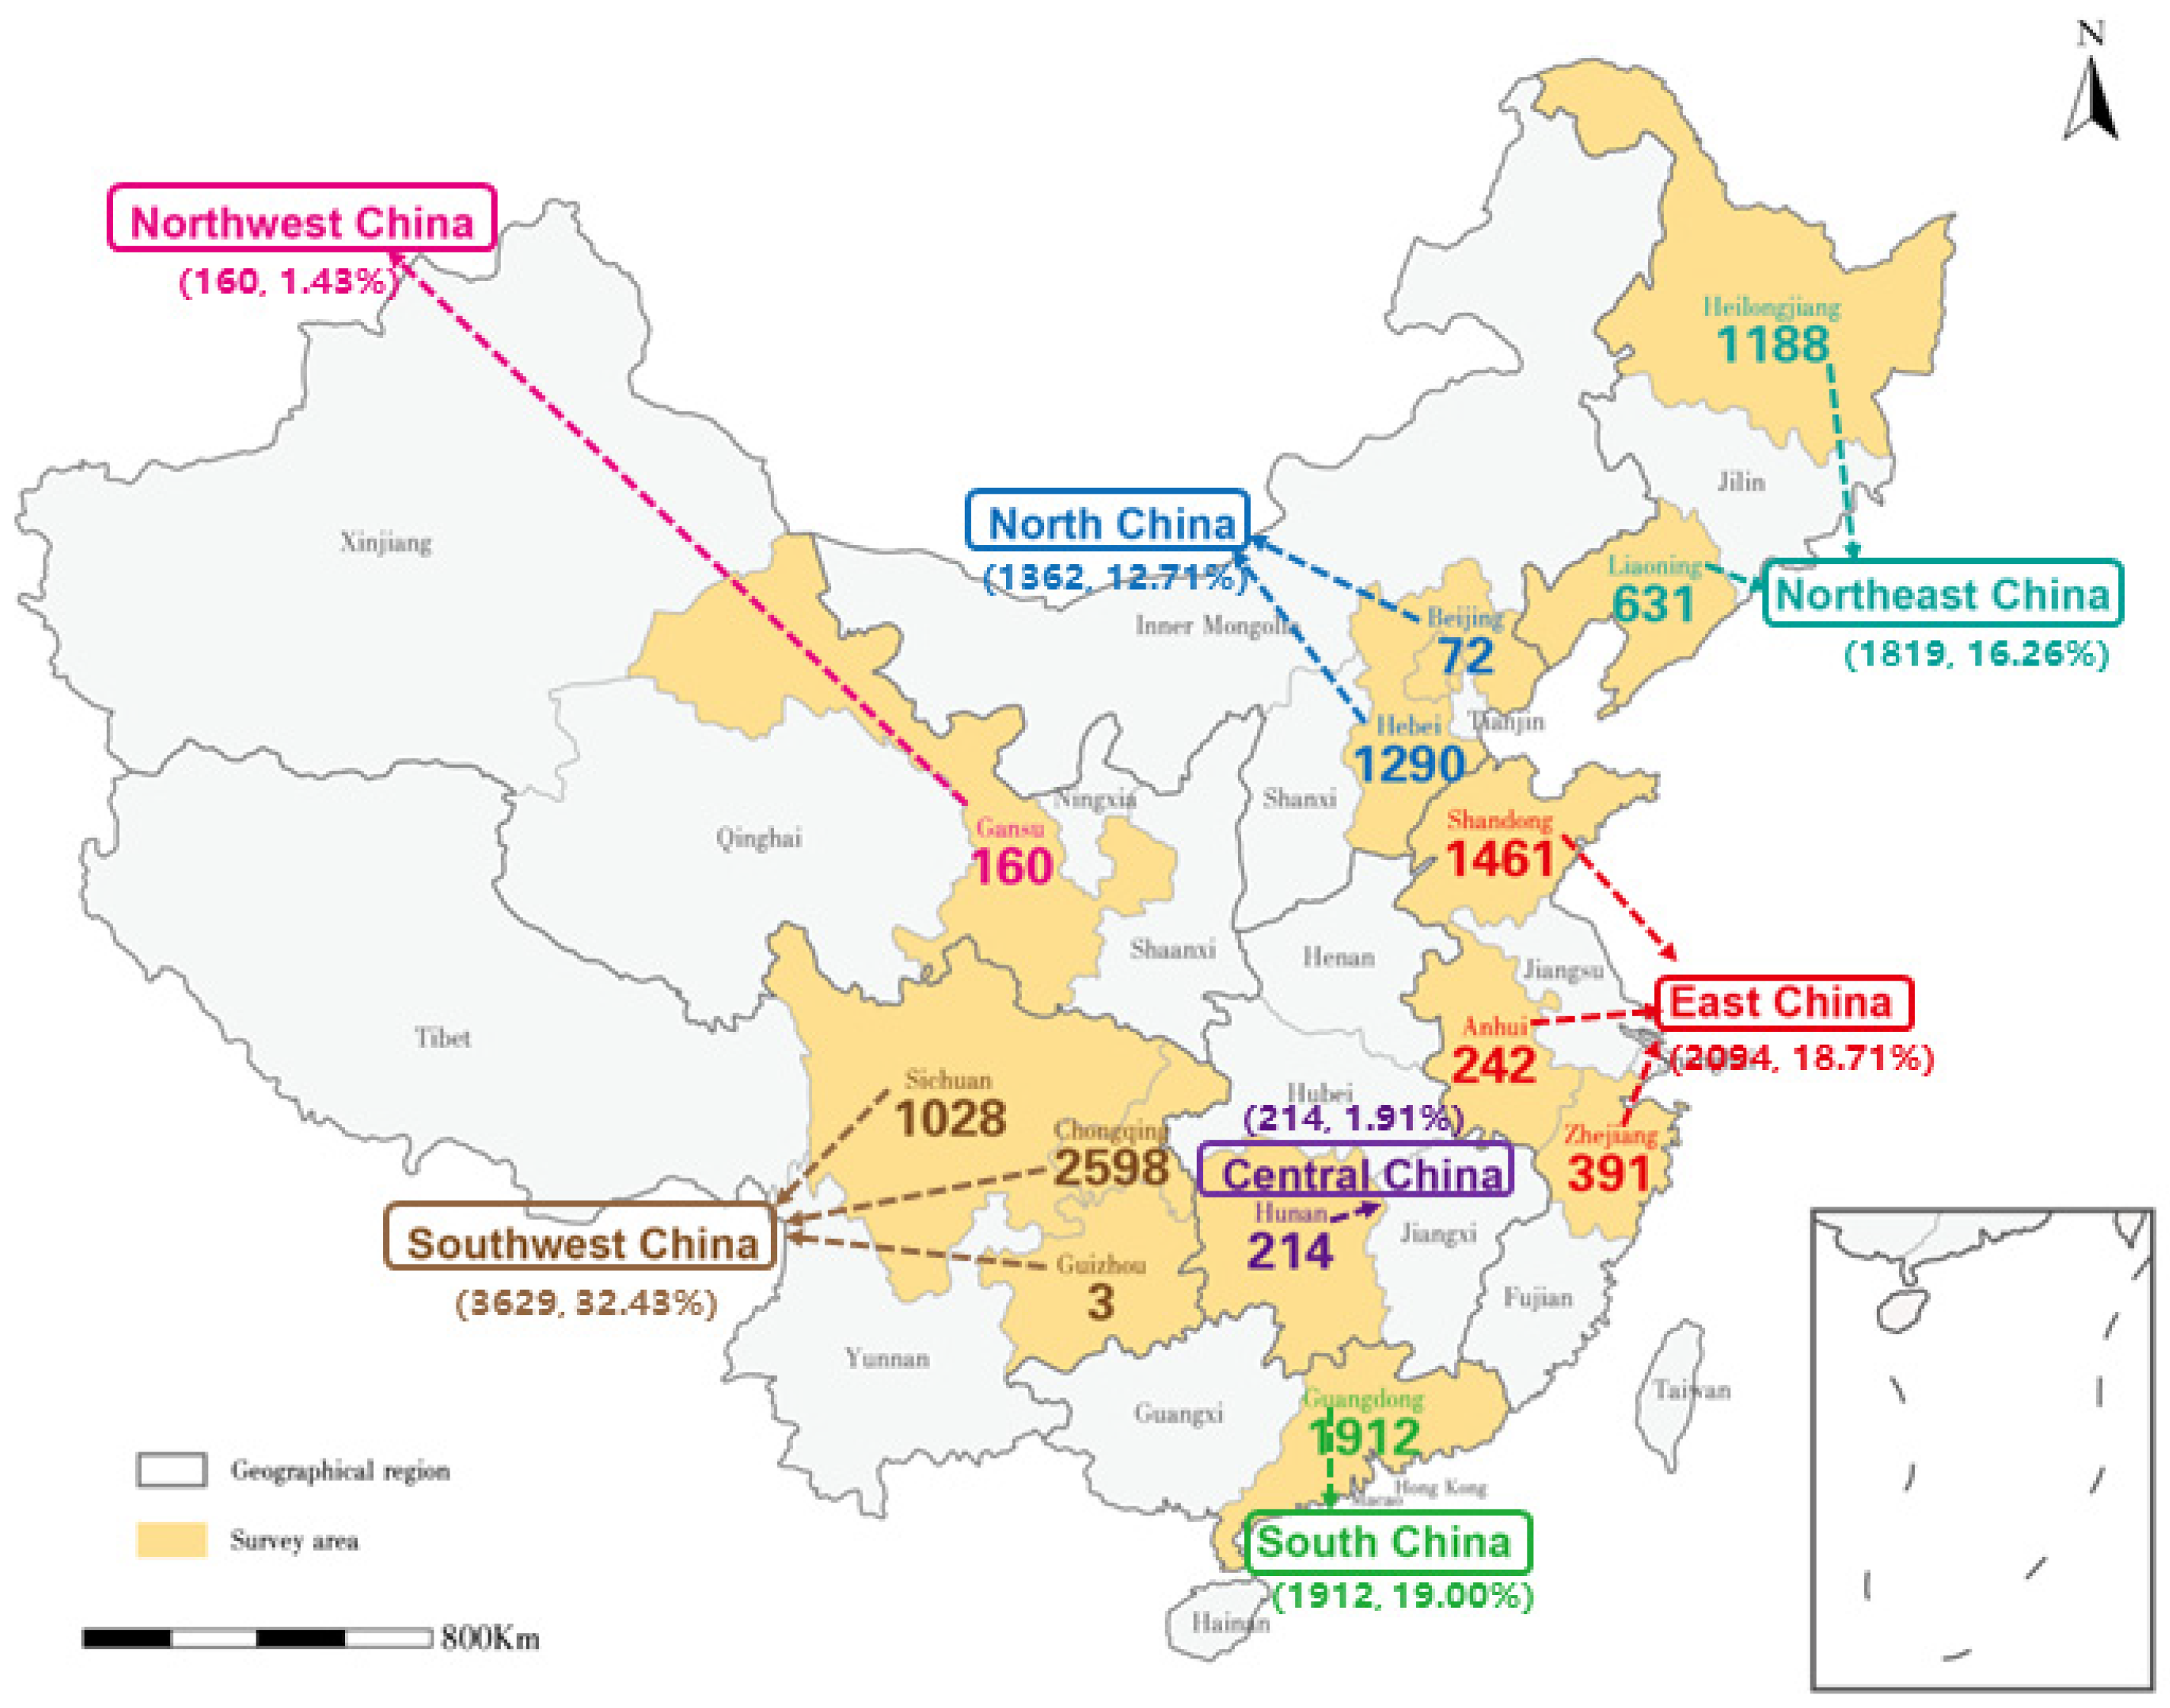
| Geography | Northeast China | 1819 (16.26) | 49 (15.61) | 1770 (16.27 |
| North China | 1362 (12.17) | 37 (11.78) | 1325 (12.18) | |
| East China | 2094 (18.71) | 38 (12.10) | 2056 (18.90) | |
| Northwest China | 160 (1.43) | 7 (2.23) | 155 (1.40) | |
| Southwest China | 3629 (32.43) | 133 (42.36) | 3494 (32.13) | |
| South China | 1912 (19.00) | 42 (13.38) | 1869 (17.18) | |
| Central China | 214 (1.91) | 8 (2.55) | 207 (1.90) | |
| Parental Educational Attainment | No formal education | 49 (3.00) | 3 (1.00) | 46 (0.40) |
| elementary school | 404 (2.90) | 22 (7.00) | 382 (3.50) | |
| secondary school | 2953 (21.1) | 96 (30.60) | 2857 (26.30) | |
| post-secondary | 4405 (31.4) | 116 (36.90) | 4289 (39.40) | |
| bachelor | 2759 (19.7) | 62 (19.70) | 2697 (24.80) | |
| graduate | 620 (4.4) | 15 (4.80) | 605 (5.60) | |
| Independent variable | Total (N = 11,190) | PTE (N = 3406) | PWTE (N = 7784) | |
| The change because of the COVID-19 pandemic | C19-CPA | 2.79 (0.94) | 2.77 (0.93) | 2.85 (0.95) |
| C19-CSL | 3.11 (0.68) | 3.09 (0.64) | 3.14 (0.72) | |
| C19-CDM | 3.52 (1.01) | 3.57 (0.98) | 3.4 (1.05) | |
| Behavior Time | CPA | 126.04 (71.32) | 126.69 (71.56) | 124.57 (70.76) |
| CSL | 569.61 (51.98) | 569.17 (50.69) | 570.61 (54.53) | |
| CDM | 59.50 (39.50) | 57.17 (39.89) | 64.82 (40.38) | |
| Hyperactivity Index | 0.46 (0.43) | 0.46 (0.42) | 0.50 (0.45) | |
3.2. Structural Equation Model Result
3.2.1. Assessment of the Measurement Model and the Structural Equation Model
3.2.2. The Effected Path in the Structural Equation Model
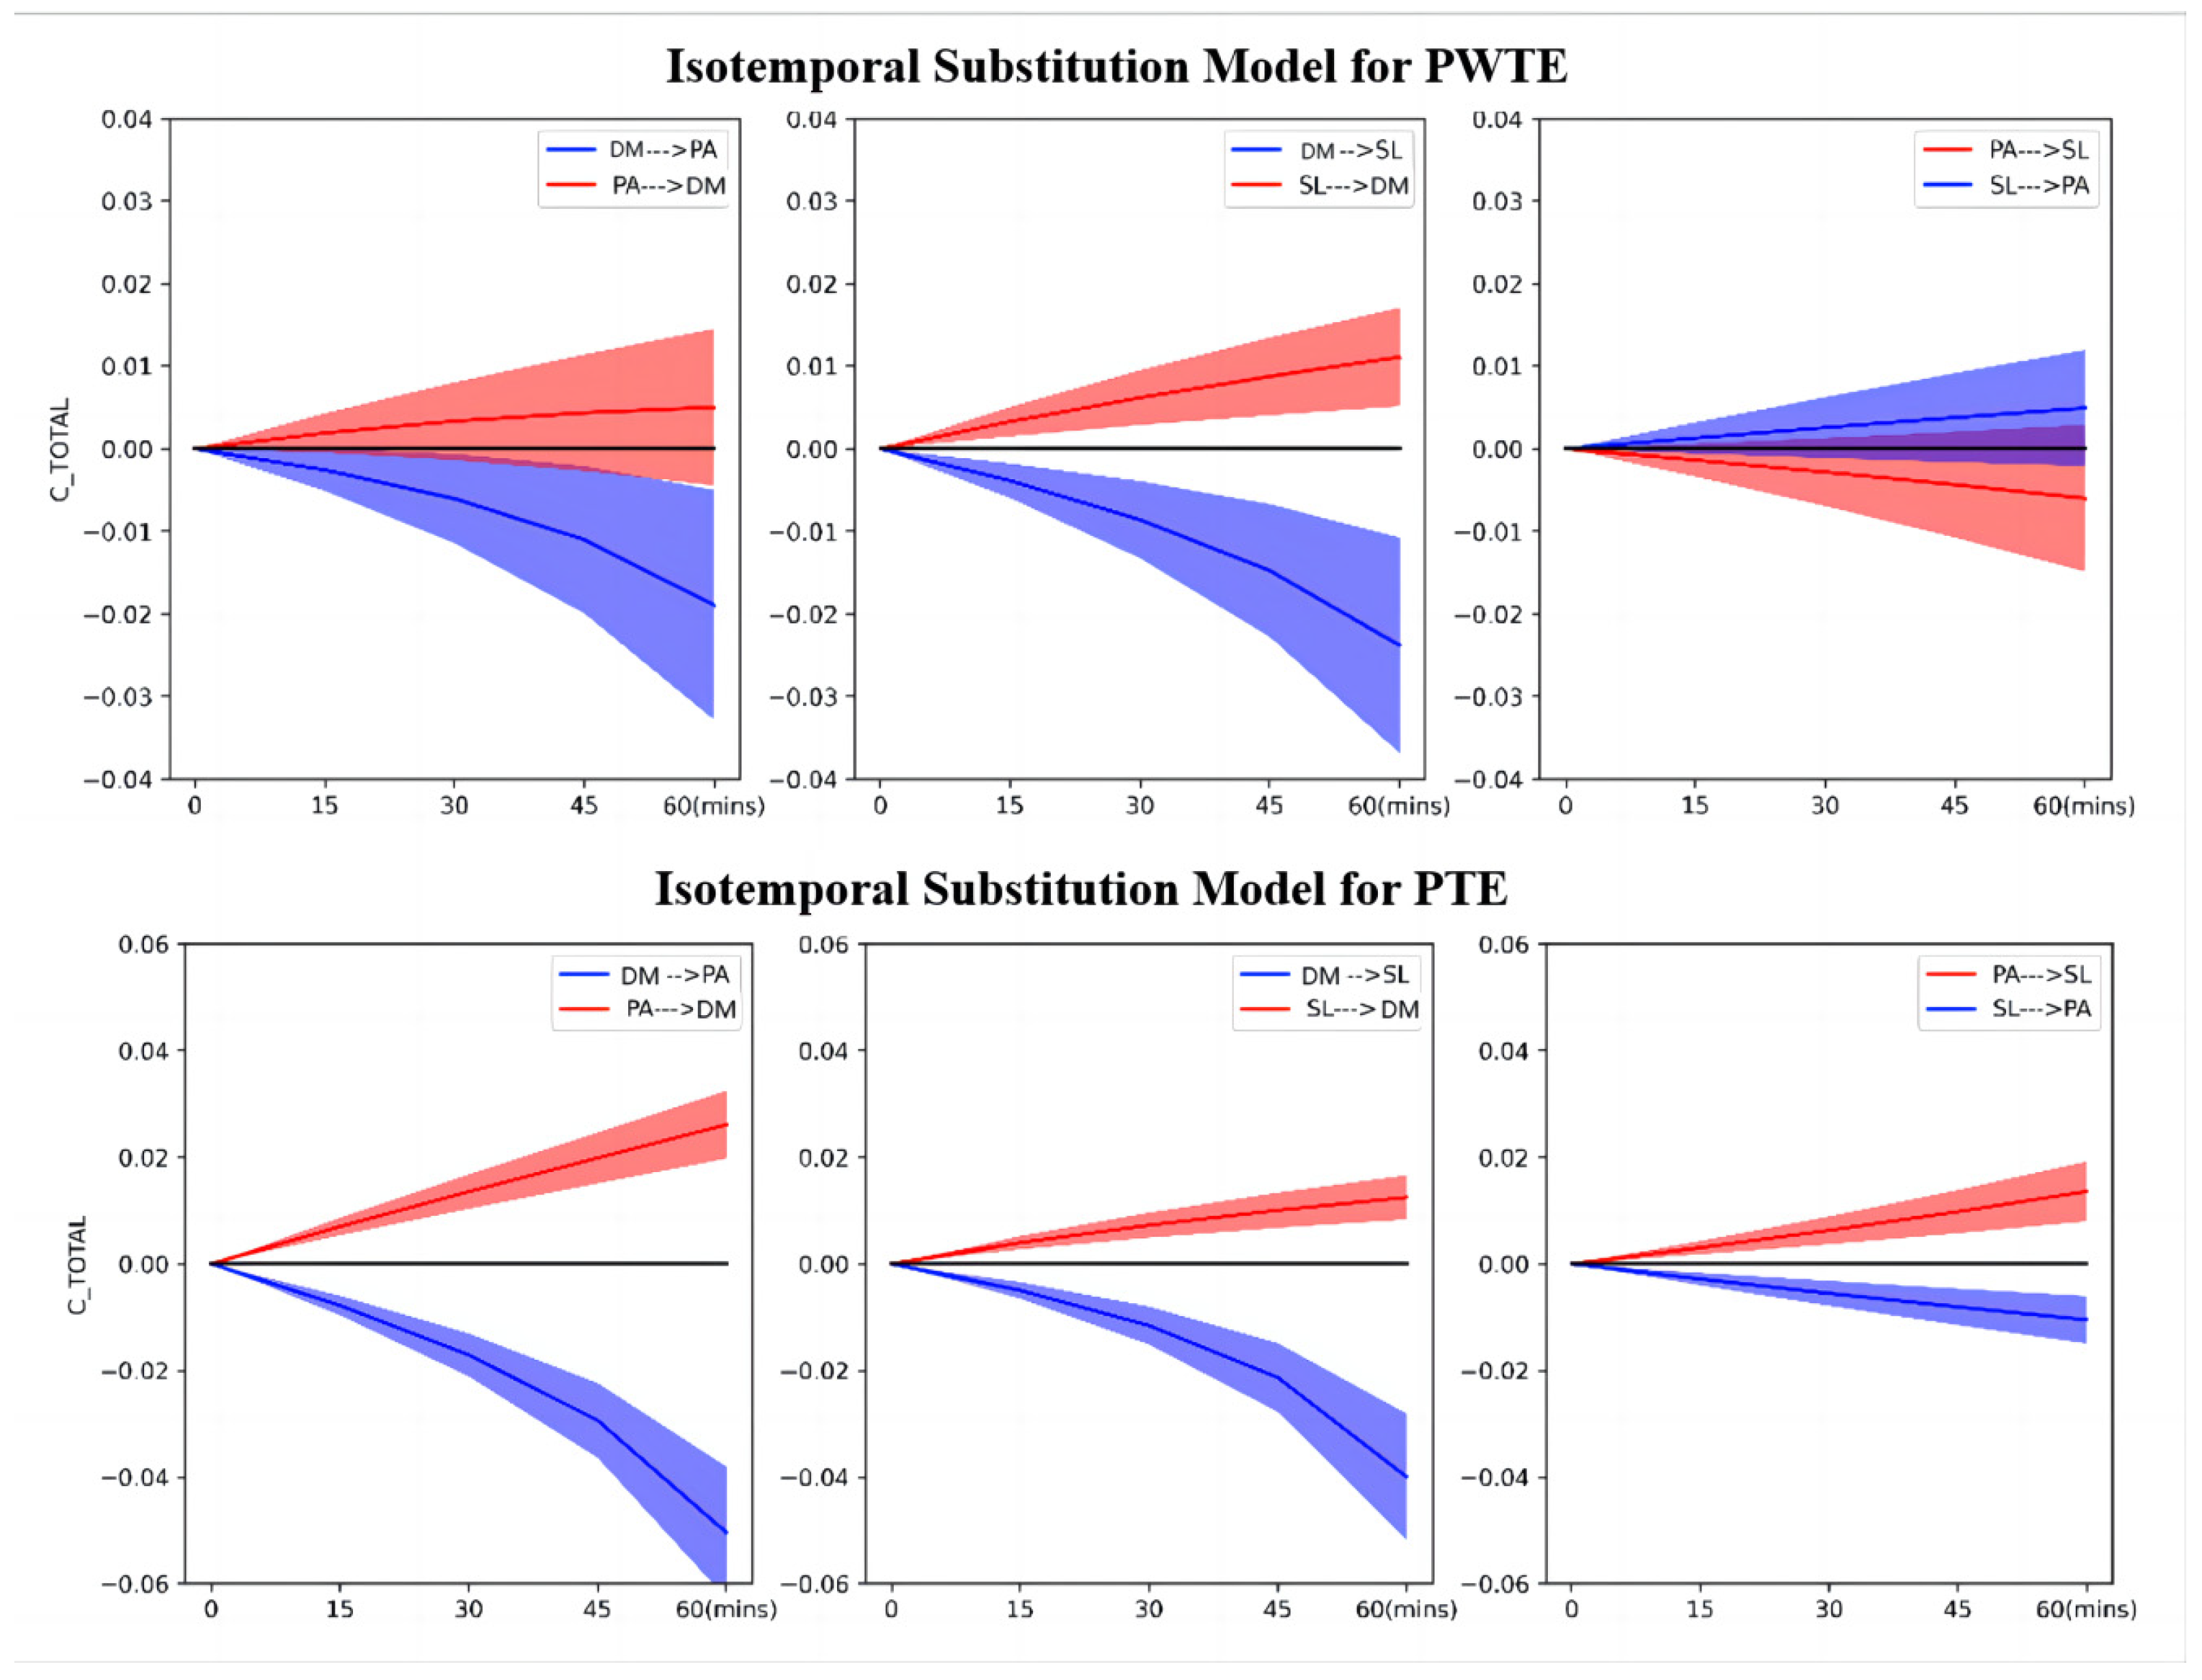
3.3. The Line Regression Model and the Isotemporal Substitution Model Results
4. Discussion
4.1. PEA, CHI, and Children’s Behavioral Changes Because of the COVID-19 Pandemic Are Deeply Intertwined
4.2. Associations of CPA and CSL with CHI Varied across PEAs and Necessitate Targeted Intervention
4.3. Associations between CDM and CHI Are Consistent across PEA and Parents and Caregivers Need to Get More Support to Monitor CDM
4.4. Strengths and Limitations
4.5. Implications of the Research
5. Conclusions
Supplementary Materials
Author Contributions
Funding
Institutional Review Board Statement
Informed Consent Statement
Data Availability Statement
Acknowledgments
Conflicts of Interest
Abbreviations
| ADHD | Attention Deficit Hyperactivity Disorder |
| PA | Physical Activity |
| SL | Sleep |
| DM | Digital Media use |
| CPA | Children’s Physical Activity |
| CSL | Children’s Sleep |
| CDM | Children’s Digital Media use |
| PEA | Parental Educational Attainment |
| PTE | Parents with Tertiary Education |
| PWTE | Parents Without Tertiary Education |
| CHI | Children’s Hyperactivity Index |
| C19 | A change because of the COVID-19 pandemic |
References
- Sagvolden, T. On the Epidemiology of Hyperactivity. In Attention Deficit Disord Pod; Routledge: London, UK, 1989; ISBN 978-1-315-82764-3. [Google Scholar]
- Ross, D.M.; Ross, S.A. Hyperactivity: Research, Theory, and Action; John Wiley & Sons: Oxford, UK, 1976; ISBN 978-0471736783. [Google Scholar]
- Parker, J.D.A.; Sitarenios, G.; Conners, C.K. Abbreviated Conners’ Rating Scales Revisited: A Confirmatory Factor Analytic Study. J Atten Disord 1996, 1, 55–62. [Google Scholar] [CrossRef]
- Thapar, A.; Cooper, M. Attention Deficit Hyperactivity Disorder. Lancet 2016, 387, 1240–1250. [Google Scholar] [CrossRef] [PubMed]
- Shephard, E.; Zuccolo, P.F.; Idrees, I.; Godoy, P.B.G.; Salomone, E.; Ferrante, C.; Sorgato, P.; Catao, L.F.C.C.; Goodwin, A.; Bolton, P.F.; et al. Systematic Review and Meta-Analysis: The Science of Early-Life Precursors and Interventions for Attention-Deficit/Hyperactivity Disorder. J. Am. Acad. Child Adolesc. Psychiatr. 2022, 61, 187–226. [Google Scholar] [CrossRef]
- Chorozoglou, M.; Smith, E.; Koerting, J.; Thompson, M.J.; Sayal, K.; Sonuga-Barke, E.J.S. Preschool Hyperactivity Is Associated with Long-Term Economic Burden: Evidence from a Longitudinal Health Economic Analysis of Costs Incurred across Childhood, Adolescence, and Young Adulthood. J. Child Psychol. Psychiatry 2015, 56, 966–975. [Google Scholar] [CrossRef] [PubMed]
- Reebye, P. Attention–Deficit Hyperactivity Disorder: A Handbook for Diagnosis and Treatment, Third Edition. J. Can. Acad. Child Adolesc. Psychiatry 2008, 17, 31–33. [Google Scholar]
- Glanz, K.; Rimer, B.K.; Viswanath, K. Health Behavior and Health Education: Theory, Research, and Practice, 4th ed.; Jossey-Bass: San Francisco, CA, USA, 2008; ISBN 978-0-7879-9614-7. [Google Scholar]
- Bronfenbrenner, U. The Ecology of Human Development: Experiments by Nature and Design; Harvard University Press: Cambridge, MA, USA, 1979; ISBN 978-0-674-22456-8. [Google Scholar]
- McLeroy, K.R.; Bibeau, D.; Steckler, A.; Glanz, K. An Ecological Perspective on Health Promotion Programs. Health Educ. Q. 1988, 15, 351–377. [Google Scholar] [CrossRef]
- Mehtälä, M.A.K.; Sääkslahti, A.K.; Inkinen, M.E.; Poskiparta, M.E.H. A Socio-Ecological Approach to Physical Activity Interventions in Childcare: A Systematic Review. Int. J. Behav. Nutr. Phys. Act. 2014, 11, 22. [Google Scholar] [CrossRef]
- Krug, E.G.; Mercy, J.A.; Dahlberg, L.L.; Zwi, A.B. The World Report on Violence and Health. Lancet 2002, 360, 1083–1088. [Google Scholar] [CrossRef]
- Stokols, D. Translating Social Ecological Theory into Guidelines for Community Health Promotion. Am. J. Health Promot. 1996, 10, 282–298. [Google Scholar] [CrossRef]
- Rogers, M.A.; Wiener, J.; Marton, I.; Tannock, R. Parental Involvement in Children’s Learning: Comparing Parents of Children with and without Attention-Deficit/Hyperactivity Disorder (ADHD). J. Sch. Psychol. 2009, 47, 167–185. [Google Scholar] [CrossRef] [PubMed]
- Girard-Lapointe, J.; Normandeau, S.; Hechtman, L. Parental Practices Contribution to Organizational Skills’ Improvement Following an Intervention Among ADHD Youths. J. Psychopathol. Behav. Assess 2023, 45, 659–670. [Google Scholar] [CrossRef]
- Jaffee, S.R.; Hanscombe, K.B.; Haworth, C.M.A.; Davis, O.S.P.; Plomin, R. Chaotic Homes and Children’s Disruptive Behavior: A Longitudinal Cross-Lagged Twin Study. Psychol. Sci. 2012, 23, 643–650. [Google Scholar] [CrossRef] [PubMed]
- He, G.-H.; Liu, L.; Strodl, E.; Ruan, Z.-L.; Jiang, H.; Jing, J.; Jin, Y.; Chen, W.-Q. Parental Type D Personality and Children’s Hyperactive Behaviors: The Mediating Role of Parent–Child Interactive Activities. Int. J. Env. Res. Public Health 2019, 16, 1116. [Google Scholar] [CrossRef] [PubMed]
- He, G.-H.; Strodl, E.; Liu, L.; Ruan, Z.-L.; Yin, X.-N.; Wen, G.-M.; Sun, D.-L.; Xian, D.-X.; Jiang, H.; Jing, J.; et al. Teacher’s Type D Personality and Chinese Children’s Hyperactive Behaviors: Moderation Effect of Parental Type D Personality and Mediation Effect of Teacher–Student Relationship. Front. Psychol. 2019, 10, 2517. [Google Scholar] [CrossRef] [PubMed]
- Gao, X.; Tong, P.; Shi, Y.; Dong, L. Relationship between the Emotional and Behavioral Problems of ADHD Children and Their Parents’ Emotions. Nurs. J. Chin PLA 2019, 36, 27–31. [Google Scholar]
- Davis-Kean, P.E.; Tighe, L.A.; Waters, N.E. The Role of Parent Educational Attainment in Parenting and Children’s Development. Curr. Dir. Psychol. Sci. 2021, 30, 186–192. [Google Scholar] [CrossRef]
- Cabello, R.; Gutiérrez-Cobo, M.J.; Fernández-Berrocal, P. Parental Education and Aggressive Behavior in Children: A Moderated-Mediation Model for Inhibitory Control and Gender. Front. Psychol. 2017, 8, 1181. [Google Scholar] [CrossRef]
- Assari, S.; Caldwell, C.H. Parental Educational Attainment Differentially Boosts School Performance of American Adolescents: Minorities’ Diminished Returns. J. Fam. Reprod. Health 2019, 13, 7. [Google Scholar] [CrossRef]
- Fakhrunnisak, D.; Patria, B. The Positive Effects of Parents’ Education Level on Children’s Mental Health in Indonesia: A Result of Longitudinal Survey. BMC Public Health 2022, 22, 949. [Google Scholar] [CrossRef]
- Jin, W.-L.; Li, G.; Du, Y.-S.; Coghill, D.; Au, S.; Zhong, X.-Y. ADHD Symptoms in Children Aged 5 to 15 Years in Zhabei District, Shanghai. Eur. J. Psychiatry 2016, 30, 173–182. [Google Scholar]
- Russell, A.E.; Ford, T.; Williams, R.; Russell, G. The Association Between Socioeconomic Disadvantage and Attention Deficit/Hyperactivity Disorder (ADHD): A Systematic Review. Child Psychiatry Hum. Dev. 2016, 47, 440–458. [Google Scholar] [CrossRef]
- Torvik, F.A.; Eilertsen, E.M.; McAdams, T.A.; Gustavson, K.; Zachrisson, H.D.; Brandlistuen, R.; Gjerde, L.C.; Havdahl, A.; Stoltenberg, C.; Ask, H.; et al. Mechanisms Linking Parental Educational Attainment with Child ADHD, Depression, and Academic Problems: A Study of Extended Families in The Norwegian Mother, Father and Child Cohort Study. J. Child Psychol. Psychiatry 2020, 61, 1009–1018. [Google Scholar] [CrossRef]
- Sciberras, E.; Patel, P.; Stokes, M.A.; Coghill, D.; Middeldorp, C.M.; Bellgrove, M.A.; Becker, S.P.; Efron, D.; Stringaris, A.; Faraone, S.V.; et al. Physical Health, Media Use, and Mental Health in Children and Adolescents With ADHD During the COVID-19 Pandemic in Australia. J. Atten. Disord. 2022, 26, 549–562. [Google Scholar] [CrossRef]
- Zhang, J.; Shuai, L.; Yu, H.; Wang, Z.; Qiu, M.; Lu, L.; Cao, X.; Xia, W.; Wang, Y.; Chen, R. Acute Stress, Behavioural Symptoms and Mood States among School-Age Children with Attention-Deficit/Hyperactive Disorder during the COVID-19 Outbreak. Asian J. Psychiatry 2020, 51, 102077. [Google Scholar] [CrossRef]
- Trumello, C.; Bramanti, S.M.; Lombardi, L.; Ricciardi, P.; Morelli, M.; Candelori, C.; Crudele, M.; Cattelino, E.; Baiocco, R.; Chirumbolo, A.; et al. COVID-19 and Home Confinement: A Study on Fathers, Father–Child Relationships and Child Adjustment. Child: Care Health Dev. 2022, 48, 917–923. [Google Scholar] [CrossRef]
- Qu, G.; Hu, W.; Meng, J.; Wang, X.; Su, W.; Liu, H.; Ma, S.; Sun, C.; Huang, C.; Lowe, S.; et al. Association between Screen Time and Developmental and Behavioral Problems among Children in the United States: Evidence from 2018 to 2020 NSCH. J. Psychiatr. Res. 2023, 161, 140–149. [Google Scholar] [CrossRef]
- Hosokawa, R.; Tomozawa, R.; Fujimoto, M.; Anzai, S.; Sato, M.; Tazoe, H.; Katsura, T. Association between Sleep Habits and Behavioral Problems in Early Adolescence: A Descriptive Study. BMC Psychol. 2022, 10, 254. [Google Scholar] [CrossRef]
- Cooper, R.; Di Biase, M.A.; Bei, B.; Quach, J.; Cropley, V. Associations of Changes in Sleep and Emotional and Behavioral Problems from Late Childhood to Early Adolescence. JAMA Psychiatry 2023, 80, 585–596. [Google Scholar] [CrossRef]
- Liu, J.; Glenn, A.L.; Cui, N.; Raine, A. Longitudinal Bidirectional Association between Sleep and Behavior Problems at Age 6 and 11 Years. Sleep Med. 2021, 83, 290–298. [Google Scholar] [CrossRef]
- Hashemi, M.; Dehghani, L.; Roonasi, A.; Salehian, M.H. Effect of Selected Physical Activities on Behavior Problems among 3–6 Years Old Children. Eur. J. Exp. Biol. 2012, 2, 1129–1133. [Google Scholar]
- So, H.-K.; Chua, G.T.; Yip, K.-M.; Tung, K.T.S.; Wong, R.S.; Louie, L.H.T.; Tso, W.W.Y.; Wong, I.C.K.; Yam, J.C.; Kwan, M.Y.W.; et al. Impact of COVID-19 Pandemic on School-Aged Children’s Physical Activity, Screen Time, and Sleep in Hong Kong: A Cross-Sectional Repeated Measures Study. Int. J. Environ. Res. Public Health 2022, 19, 10539. [Google Scholar] [CrossRef]
- Nikkelen, S.W.C.; Valkenburg, P.M.; Huizinga, M.; Bushman, B.J. Media Use and ADHD-Related Behaviors in Children and Adolescents: A Meta-Analysis. Dev. Psychol. 2014, 50, 2228–2241. [Google Scholar] [CrossRef]
- Paavonen, E.J.; Räikkönen, K.; Lahti, J.; Komsi, N.; Heinonen, K.; Pesonen, A.-K.; Järvenpää, A.-L.; Strandberg, T.; Kajantie, E.; Porkka-Heiskanen, T. Short Sleep Duration and Behavioral Symptoms of Attention-Deficit/Hyperactivity Disorder in Healthy 7- to 8-Year-Old Children. Pediatrics 2009, 123, e857–e864. [Google Scholar] [CrossRef]
- Dimakos, J.; Gauthier-Gagné, G.; Lin, L.; Scholes, S.; Gruber, R. The Associations Between Sleep and Externalizing and Internalizing Problems in Children and Adolescents with Attention-Deficit/Hyperactivity Disorder: Empirical Findings, Clinical Implications, and Future Research Directions. Child Adolesc. Psychiatr. Clin. N. Am. 2021, 30, 175–193. [Google Scholar] [CrossRef]
- Descarpentry, A.; Melchior, M.; Galera, C.; Hazo, J.-B.; Falissard, B.; Warszawski, J.; Davisse-Paturet, C.; Rouquette, A. High Screen Time and Internalizing and Externalizing Behaviours among Children Aged 3 to 14 Years during the COVID-19 Pandemic in France. Eur. Child Adolesc. Psychiatry 2023, 1–11. [Google Scholar] [CrossRef]
- Griffiths, L.J.; Dowda, M.; Dezateux, C.; Pate, R. Associations between Sport and Screen-Entertainment with Mental Health Problems in 5-Year-Old Children. Int. J. Behav. Nutr. Phys. Act. 2010, 7, 30. [Google Scholar] [CrossRef]
- O’Brien, K.; Agostino, J.; Ciszek, K.; Douglas, K.A. Physical Activity and Risk of Behavioural and Mental Health Disorders in Kindergarten Children: Analysis of a Series of Cross-Sectional Complete Enumeration (Census) Surveys. BMJ Open 2020, 10, e034847. [Google Scholar] [CrossRef]
- CDC What is ADHD? Available online: https://www.cdc.gov/ncbddd/adhd/facts.html (accessed on 4 November 2022).
- World Health Organization, WHO Guidelines on Physical Activity and Sedentary Behavior; World Health Organization: Geneva, Switzerland, 2020; ISBN 978-92-4-001512-8.
- van der Sluys, M.E.; Zijlmans, J.; Ket, J.C.F.; Marhe, R.; Popma, A.; Scherder, E.J.A.; van der Laan, P.H. The Efficacy of Physical Activity Interventions in Reducing Antisocial Behavior: A Meta-Analytic Review. J. Exp. Criminol. 2022, 1–27. [Google Scholar] [CrossRef]
- O-ium, P. The Impact of Social Media Misused and Behavior Problems among Adolescent in Thailand. Eur. J. Public Health 2019, 29, ckz186.115. [Google Scholar] [CrossRef]
- Tininenko, J.R.; Fisher, P.A.; Bruce, J.; Pears, K.C. Associations Between Sleep and Inattentive/Hyperactive Problem Behavior Among Foster and Community Children. J. Dev. Behav. Pediatr. 2010, 31, 668–674. [Google Scholar] [CrossRef]
- Stefelova, N.; Dygryn, J.; Hron, K.; Gaba, A.; Rubin, L.; Palarea-Albaladejo, J. Robust Compositional Analysis of Physical Activity and Sedentary Behaviour Data. Int. J. Environ. Res. Public Health 2018, 15, 2248. [Google Scholar] [CrossRef] [PubMed]
- Dumuid, D.; Pedišić, Ž.; Palarea-Albaladejo, J.; Martín-Fernández, J.A.; Hron, K.; Olds, T. Compositional Data Analysis in Time-Use Epidemiology: What, Why, How. Int. J. Environ. Res. Public Health 2020, 17, 2220. [Google Scholar] [CrossRef] [PubMed]
- Chastin, S.F.M.; Palarea-Albaladejo, J.; Dontje, M.L.; Skelton, D.A. Combined Effects of Time Spent in Physical Activity, Sedentary Behaviors and Sleep on Obesity and Cardio-Metabolic Health Markers: A Novel Compositional Data Analysis Approach. PLoS ONE 2015, 10, e0139984. [Google Scholar] [CrossRef] [PubMed]
- Available online: https://www.iissaar.com (accessed on 5 November 2022).
- Paruthi, S.; Brooks, L.J.; D’Ambrosio, C.; Hall, W.A.; Kotagal, S.; Lloyd, R.M.; Malow, B.A.; Maski, K.; Nichols, C.; Quan, S.F.; et al. Recommended Amount of Sleep for Pediatric Populations: A Consensus Statement of the American Academy of Sleep Medicine. J. Clin. Sleep Med. 2016, 12, 785–786. [Google Scholar] [CrossRef]
- Department of Basic Education, Ministry of Education: Introduction to the Notice on Further Strengthening Sleep Management for Primary and Secondary School Students—Press Briefing—Ministry of Education of the People’s Republic of China Government Portal [WWW Document]. Available online: http://www.moe.gov.cn/jyb_xwfb/xw_fbh/moe_2606/2021/tqh_20210402/sm/202104/t20210402_524051.html (accessed on 6 October 2023).
- Chia, M.Y.H.; Tay, L.Y.; Chua, T.B.K. The Development of an Online Surveillance of Digital Media Use in Early Childhood Questionnaire- SMALLQTM- For Singapore. Montenegrin J. Sports Sci. Med. 2019, 8, 77–80. [Google Scholar] [CrossRef]
- Yufeng, Y. Rating Scales for Children’s Developmental Behavior and Mental Health; Yang, Y., Ed.; People’s Medical Publishing House: Beijing, China, 2016; ISBN 978-7-117-21882-5. [Google Scholar]
- Goyette, C.H.; Conners, C.K.; Ulrich, R.F. Normative Data on Revised Conners Parent and Teacher Rating Scales. J Abnorm Child Psychol 1978, 6, 221–236. [Google Scholar] [CrossRef] [PubMed]
- Dong, Y.; Sun, L.; Luo, X. Application of the Conners Scale in attention deficit hyperactivity disorder. Chin. J. Clin. Psychol. 1997, 49–50. [Google Scholar]
- Su, L.; Li, X.; Huang, C.; Luo, X.; Zhang, J. Conners’ Parental Symptom Questionnaire for Chinese Urban Normals. Chin. J. Clin. Psychol. 2001, 241, 243–252. [Google Scholar]
- Cortina, J.M. What Is Coefficient Alpha? An Examination of Theory and Applications. J. Appl. Psychol. 1993, 78, 98–104. [Google Scholar] [CrossRef]
- Peng, X.; Menhas, R.; Dai, J.; Younas, M. The COVID-19 Pandemic and Overall Wellbeing: Mediating Role of Virtual Reality Fitness for Physical-Psychological Health and Physical Activity. Psychol. Res. Behav. Manag. 2022, 2022, 1741–1756. [Google Scholar] [CrossRef]
- Liu, R.; Menhas, R.; Dai, J.; Saqib, Z.A.; Peng, X. Fitness Apps, Live Streaming Workout Classes, and Virtual Reality Fitness for Physical Activity During the COVID-19 Lockdown: An Empirical Study. Front. Public Health 2022, 10, 852311. [Google Scholar] [CrossRef]
- Dai, J.; Sang, X.; Menhas, R.; Xu, X.; Khurshid, S.; Mahmood, S.; Weng, Y.; Huang, J.; Cai, Y.; Shahzad, B.; et al. The Influence of COVID-19 Pandemic on Physical Health–Psychological Health, Physical Activity, and Overall Well-Being: The Mediating Role of Emotional Regulation. Front. Psychol. 2021, 12, 667461. [Google Scholar] [CrossRef]
- Henseler, J.; Hubona, G.; Ray, P.A. Using PLS Path Modeling in New Technology Research: Updated Guidelines. Ind. Manag. Data Syst. 2016, 116, 2–20. [Google Scholar] [CrossRef]
- Aitchison, J. The Statistical Analysis of Compositional Data; Springer: Dordrecht, The Netherlands, 1986; ISBN 978-94-009-4109-0. [Google Scholar]
- Carson, V.; Tremblay, M.S.; Chaput, J.-P.; Chastin, S.F.M. Associations between Sleep Duration, Sedentary Time, Physical Activity, and Health Indicators among Canadian Children and Youth Using Compositional Analyses. Appl. Physiol. Nutr. Metab. 2016, 41, S294–S302. [Google Scholar] [CrossRef]
- Chen, M.; Chua, T.; Shen, Z.; Tay, L.Y.; Wang, X.; Chia, M. The Associations between 24-Hour Movement Behaviours and Quality of Life in Preschoolers: A Compositional Analysis of Cross-Sectional Data from 2018–2021. Int. J. Environ. Res. Public Health 2022, 19, 14969. [Google Scholar] [CrossRef]
- Cheung, G.W.; Wang, C. Current Approaches for Assessing Convergent and Discriminant Validity with SEM: Issues and Solutions. Proceedings 2017, 2017, 12706. [Google Scholar] [CrossRef]
- Dijkstra, T.K.; Henseler, J. Consistent and Asymptotically Normal PLS Estimators for Linear Structural Equations. Comput. Stat. Data Anal. 2015, 81, 10–23. [Google Scholar] [CrossRef]
- Chin, W.; Cheah, J.-H.; Liu, Y.; Ting, H.; Lim, X.-J.; Cham, T.H. Demystifying the Role of Causal-Predictive Modeling Using Partial Least Squares Structural Equation Modeling in Information Systems Research. Ind. Manag. Data Syst. 2020, 120, 2161–2209. [Google Scholar] [CrossRef]
- Pingault, J.-B.; Barkhuizen, W.; Wang, B.; Hannigan, L.J.; Eilertsen, E.M.; Corfield, E.; Andreassen, O.A.; Ask, H.; Tesli, M.; Askeland, R.B.; et al. Genetic Nurture versus Genetic Transmission of Risk for ADHD Traits in the Norwegian Mother, Father and Child Cohort Study. Mol. Psychiatry 2023, 28, 1731–1738. [Google Scholar] [CrossRef] [PubMed]
- Schmengler, H.; Peeters, M.; Stevens, G.W.J.M.; Hartman, C.A.; Oldehinkel, A.J.; Vollebergh, W.A.M. ADHD Symptoms and Educational Level in Adolescents: The Role of the Family, Teachers, and Peers. Res. Child Adolesc. Psychopathol. 2023, 51, 1051–1066. [Google Scholar] [CrossRef] [PubMed]
- Climie, E.A.; Mitchell, K. Parent-Child Relationship and Behavior Problems in Children with ADHD. Int. J. Dev. Disabil. 2017, 63, 27–35. [Google Scholar] [CrossRef]
- Stewart, E.K.; Kotelnikova, Y.; Olino, T.M.; Hayden, E.P. Early Childhood Impulsivity and Parenting Predict Children’s Development of Externalizing Psychopathology. Dev. Psychopathol. 2023, 1–13. [Google Scholar] [CrossRef]
- Lingineni, R.K.; Biswas, S.; Ahmad, N.; Jackson, B.E.; Bae, S.; Singh, K.P. Factors Associated with Attention Deficit/Hyperactivity Disorder among US Children: Results from a National Survey. BMC Pediatr. 2012, 12, 50. [Google Scholar] [CrossRef] [PubMed]
- Holton, K.F.; Nigg, J.T. The Association of Lifestyle Factors and ADHD in Children. J. Atten. Disord. 2020, 24, 1511–1520. [Google Scholar] [CrossRef] [PubMed]
- CDC Benefits of Physical Activity. Available online: https://www.cdc.gov/physicalactivity/basics/pa-health/index.htm (accessed on 30 November 2022).
- Exercise and Well-Being: A Review of Mental and Physical Hea: Current Opinion in Psychiatry. Available online: https://journals.lww.com/co-psychiatry/Abstract/2005/03000/Exercise_and_well_being__a_review_of_mental_and.13.aspx (accessed on 30 November 2022).
- Ganjeh, P.; Hagmayer, Y.; Meyer, T.; Kuhnert, R.; Ravens-Sieberer, U.; Von Steinbuechel, N.; Rothenberger, A.; Becker, A. Physical Activity and the Development of General Mental Health Problems or Attention-Deficit Hyperactivity Disorder (ADHD) Symptoms in Children and Adolescents: A Cross-Lagged Panel Analysis of Long-Term Follow-up Epidemiological Data. Front. Behav. Neurosci. 2022, 16, 933139. [Google Scholar] [CrossRef] [PubMed]
- Knutson, K.L.; Turek, F.W. The U-Shaped Association Between Sleep and Health: The 2 Peaks Do Not Mean the Same Thing. Sleep 2006, 29, 878–879. [Google Scholar] [CrossRef] [PubMed]
- Fadzil, A. Factors Affecting the Quality of Sleep in Children. Children 2021, 8, 122. [Google Scholar] [CrossRef] [PubMed]
- Ra, C.K.; Cho, J.; Stone, M.D.; De La Cerda, J.; Goldenson, N.I.; Moroney, E.; Tung, I.; Lee, S.S.; Leventhal, A.M. Association of Digital Media Use with Subsequent Symptoms of Attention-Deficit/Hyperactivity Disorder Among Adolescents. JAMA 2018, 320, 255–263. [Google Scholar] [CrossRef] [PubMed]
- Radesky, J.S.; Christakis, D.A. Increased Screen Time: Implications for Early Childhood Development and Behavior. Pediatr. Clin. N. Am. 2016, 63, 827–839. [Google Scholar] [CrossRef] [PubMed]
- Geng, S.; Wang, W.; Huang, L.; Xie, J.; Williams, G.J.; Baker, C.; Du, W.; Hua, J. Association between Screen Time and Suspected Developmental Coordination Disorder in Preschoolers: A National Population-Based Study in China. Front. Public Health 2023, 11, 1152321. [Google Scholar] [CrossRef]
- Shuai, L.; He, S.; Zheng, H.; Wang, Z.; Qiu, M.; Xia, W.; Cao, X.; Lu, L.; Zhang, J. Influences of Digital Media Use on Children and Adolescents with ADHD during COVID-19 Pandemic. Glob. Health 2021, 17, 48. [Google Scholar] [CrossRef] [PubMed]

| Constructs | Items | Factor Loadings | Std. D | T-Values | VIF | SCR | AVE | Alpha |
|---|---|---|---|---|---|---|---|---|
| CHI | CHI1 | 0.692 | 0.01 | 72.178 | 1.726 | 0.908 | 0.501 | 0.890 |
| CHI2 | 0.626 | 0.012 | 53.729 | 1.481 | ||||
| CHI3 | 0.601 | 0.012 | 49.923 | 1.621 | ||||
| CHI4 | 0.739 | 0.008 | 89.427 | 1.501 | ||||
| CHI5 | 0.651 | 0.011 | 61.413 | 1.947 | ||||
| CHI6 | 0.779 | 0.007 | 113.97 | 1.661 | ||||
| CHI7 | 0.806 | 0.007 | 123.849 | 2.082 | ||||
| CHI8 | 0.758 | 0.007 | 105.856 | 2.294 | ||||
| CHI9 | 0.775 | 0.007 | 108.436 | 1.999 | ||||
| CHI10 | 0.602 | 0.012 | 51.161 | 1.918 |
| Fornell–Larcker Criterion | |||||
| C19-CPA | C19-CSL | CHI_ | PEA | C19-CDM | |
| C19-CPA | 1.000 | ||||
| C19-CSL | 0.382 | 1.000 | |||
| CHI_ | −0.138 | −0.077 | 0.708 | ||
| PEA | −0.049 | −0.039 | −0.048 | 1.000 | |
| C19-CDM | 0.243 | −0.068 | −0.127 | −0.096 | 1.000 |
| Heterotrait–Monotrait ratio of correlations (HTMT) criterion | |||||
| C19-CPA | C19-CSL | CHI_ | PEA | C19-CDM | |
| C19-CPA | |||||
| C19-CSL | 0.382 | ||||
| CHI_ | 0.135 | 0.077 | |||
| PEA | 0.049 | 0.039 | 0.054 | ||
| C19-CDM | 0.243 | 0.068 | 0.130 | 0.096 | |
| Statistical Tests | Estimation Model |
|---|---|
| SRMR | 0.050 |
| d_ULS | 0.260 |
| d_G | 0.075 |
| X2 | 5101.864 |
| NFI | 0.899 |
| RMS-theta | 0.119 |
| Effect Path | Beta | Std. D | T-Value | p-Values | |
|---|---|---|---|---|---|
| Total effect | PEA -> CHI | −0.046 | 0.010 | 4.521 | 0.000 *** |
| Direct effect | PEA -> CHI | −0.064 | 0.010 | 6.330 | 0.000 *** |
| Total Indirect effect | PEA -> CHI | 0.018 | 0.002 | 9.063 | 0.000 *** |
| Indirect effect | PEA -> C19-CSL -> CHI | 0.002 | 0.001 | 3.046 | 0.002 ** |
| PEA -> C19-CPA -> CHI | 0.002 | 0.001 | 2.600 | 0.009 ** | |
| PEA -> C19-CDM -> CHI | 0.011 | 0.001 | 7.708 | 0.000 *** | |
| PEA -> C19-CDM -> C19-CSL -> CHI | −0.001 | 0.000 | 4.141 | 0.000 *** | |
| PEA -> C19-CPA -> C19-CSL -> CHI | 0.001 | 0.000 | 2.342 | 0.019 * | |
| PEA -> C19-CDM -> C19-CPA -> CHI | 0.002 | 0.000 | 6.244 | 0.000 *** | |
| PEA -> C19-CDM -> C19-CPA -> C19-CSL -> CHI | 0.001 | 0.000 | 4.192 | 0.000 *** | |
| PEA | Path | Isotemporal Substitution Time | |||
|---|---|---|---|---|---|
| 15 min | 30 min | 45 min | 60 min | ||
| Parent Without Tertiary Education (BS = 0.485) | PA-DM | 0.002 (0.000, 0.004) | 0.003 (−0.001, 0.008) | 0.004 (−0.003, 0.011) | 0.005 (−0.004, 0.015) |
| PA-SL | −0.001 (−0.003, 0.011) | −0.003 (−0.003, 0.011) | −0.004 (−0.003, 0.011) | −0.006 (−0.003, 0.011) | |
| SL-DM | 0.003 (0.002, 0.005) * | 0.006 (0.003, 0.010) * | 0.009 (0.004, 0.013) * | 0.011 (0.005, 0.017) * | |
| SL-PA | 0.001 (−0.001, 0.003) | 0.003 (−0.001, 0.006) | 0.004 (−0.002, 0.009) | 0.005 (−0.002, 0.012) | |
| DM-PA | −0.003 (−0.005, 0.000) * | −0.006 (−0.011, 0.001) * | −0.011 (−0.020, −0.002) * | −0.019 (−0.033, −0.005) * | |
| DM-SL | −0.004 (−0.006, −0.002) * | −0.009 (−0.013, −0.004) * | −0.015 (−0.023, −0.007) * | −0.024 (−0.037, −0.011) * | |
| Parent with Tertiary Education (BS = 0.449) | PA-SL | 0.003 (0.002, 0.004) * | 0.006 (0.004, 0.009) * | 0.010 (0.006, 0.014) * | 0.014 (0.008, 0.019) * |
| PA-DM | 0.007 (0.005, 0.009) * | 0.013 (0.010, 0.017) * | 0.020 (0.015, 0.024) * | 0.026 (0.020, 0.032) * | |
| SL-DM | 0.004 (0.003, 0.005) * | 0.007 (0.005, 0.009) * | 0.010 (0.007, 0.013) * | 0.012 (0.008, 0.016) * | |
| SL-PA | −0.003 (−0.004, −0.002) * | −0.006 (−0.008, −0.003) * | −0.008 (−0.012, −0.005) * | −0.010 (−0.015, −0.006) * | |
| DM-PA | −0.008 (−0.010, −0.006) * | −0.017 (−0.021, −0.013) * | −0.029 (−0.036, −0.022) * | −0.050 (−0.062, −0.038) * | |
| DM-SL | −0.005 (−0.006, −0.003) * | −0.011 (−0.015, −0.008) * | −0.021 (−0.027, −0.015) * | −0.040 (−0.051, −0.028) * | |
Disclaimer/Publisher’s Note: The statements, opinions and data contained in all publications are solely those of the individual author(s) and contributor(s) and not of MDPI and/or the editor(s). MDPI and/or the editor(s) disclaim responsibility for any injury to people or property resulting from any ideas, methods, instructions or products referred to in the content. |
© 2024 by the authors. Licensee MDPI, Basel, Switzerland. This article is an open access article distributed under the terms and conditions of the Creative Commons Attribution (CC BY) license (https://creativecommons.org/licenses/by/4.0/).
Share and Cite
Chen, M.; Chia, M.; Chua, T.; Shen, Z.; Kang, M.; Chen, L.; Tong, T.; Wang, X. Associations between Parental Educational Attainment, Children’s 24-h Behaviors and Children’s Hyperactivity Behavior in the COVID-19 Pandemic. Healthcare 2024, 12, 516. https://doi.org/10.3390/healthcare12050516
Chen M, Chia M, Chua T, Shen Z, Kang M, Chen L, Tong T, Wang X. Associations between Parental Educational Attainment, Children’s 24-h Behaviors and Children’s Hyperactivity Behavior in the COVID-19 Pandemic. Healthcare. 2024; 12(5):516. https://doi.org/10.3390/healthcare12050516
Chicago/Turabian StyleChen, Meiyuan, Michael Chia, Terence Chua, Zhi Shen, Mengke Kang, Lu Chen, Tiantian Tong, and Xiaozan Wang. 2024. "Associations between Parental Educational Attainment, Children’s 24-h Behaviors and Children’s Hyperactivity Behavior in the COVID-19 Pandemic" Healthcare 12, no. 5: 516. https://doi.org/10.3390/healthcare12050516
APA StyleChen, M., Chia, M., Chua, T., Shen, Z., Kang, M., Chen, L., Tong, T., & Wang, X. (2024). Associations between Parental Educational Attainment, Children’s 24-h Behaviors and Children’s Hyperactivity Behavior in the COVID-19 Pandemic. Healthcare, 12(5), 516. https://doi.org/10.3390/healthcare12050516