
Healthcare Utilization Among Youth with Chronic Illness Receiving Care at a Large Urban Academic Healthcare System
 ,
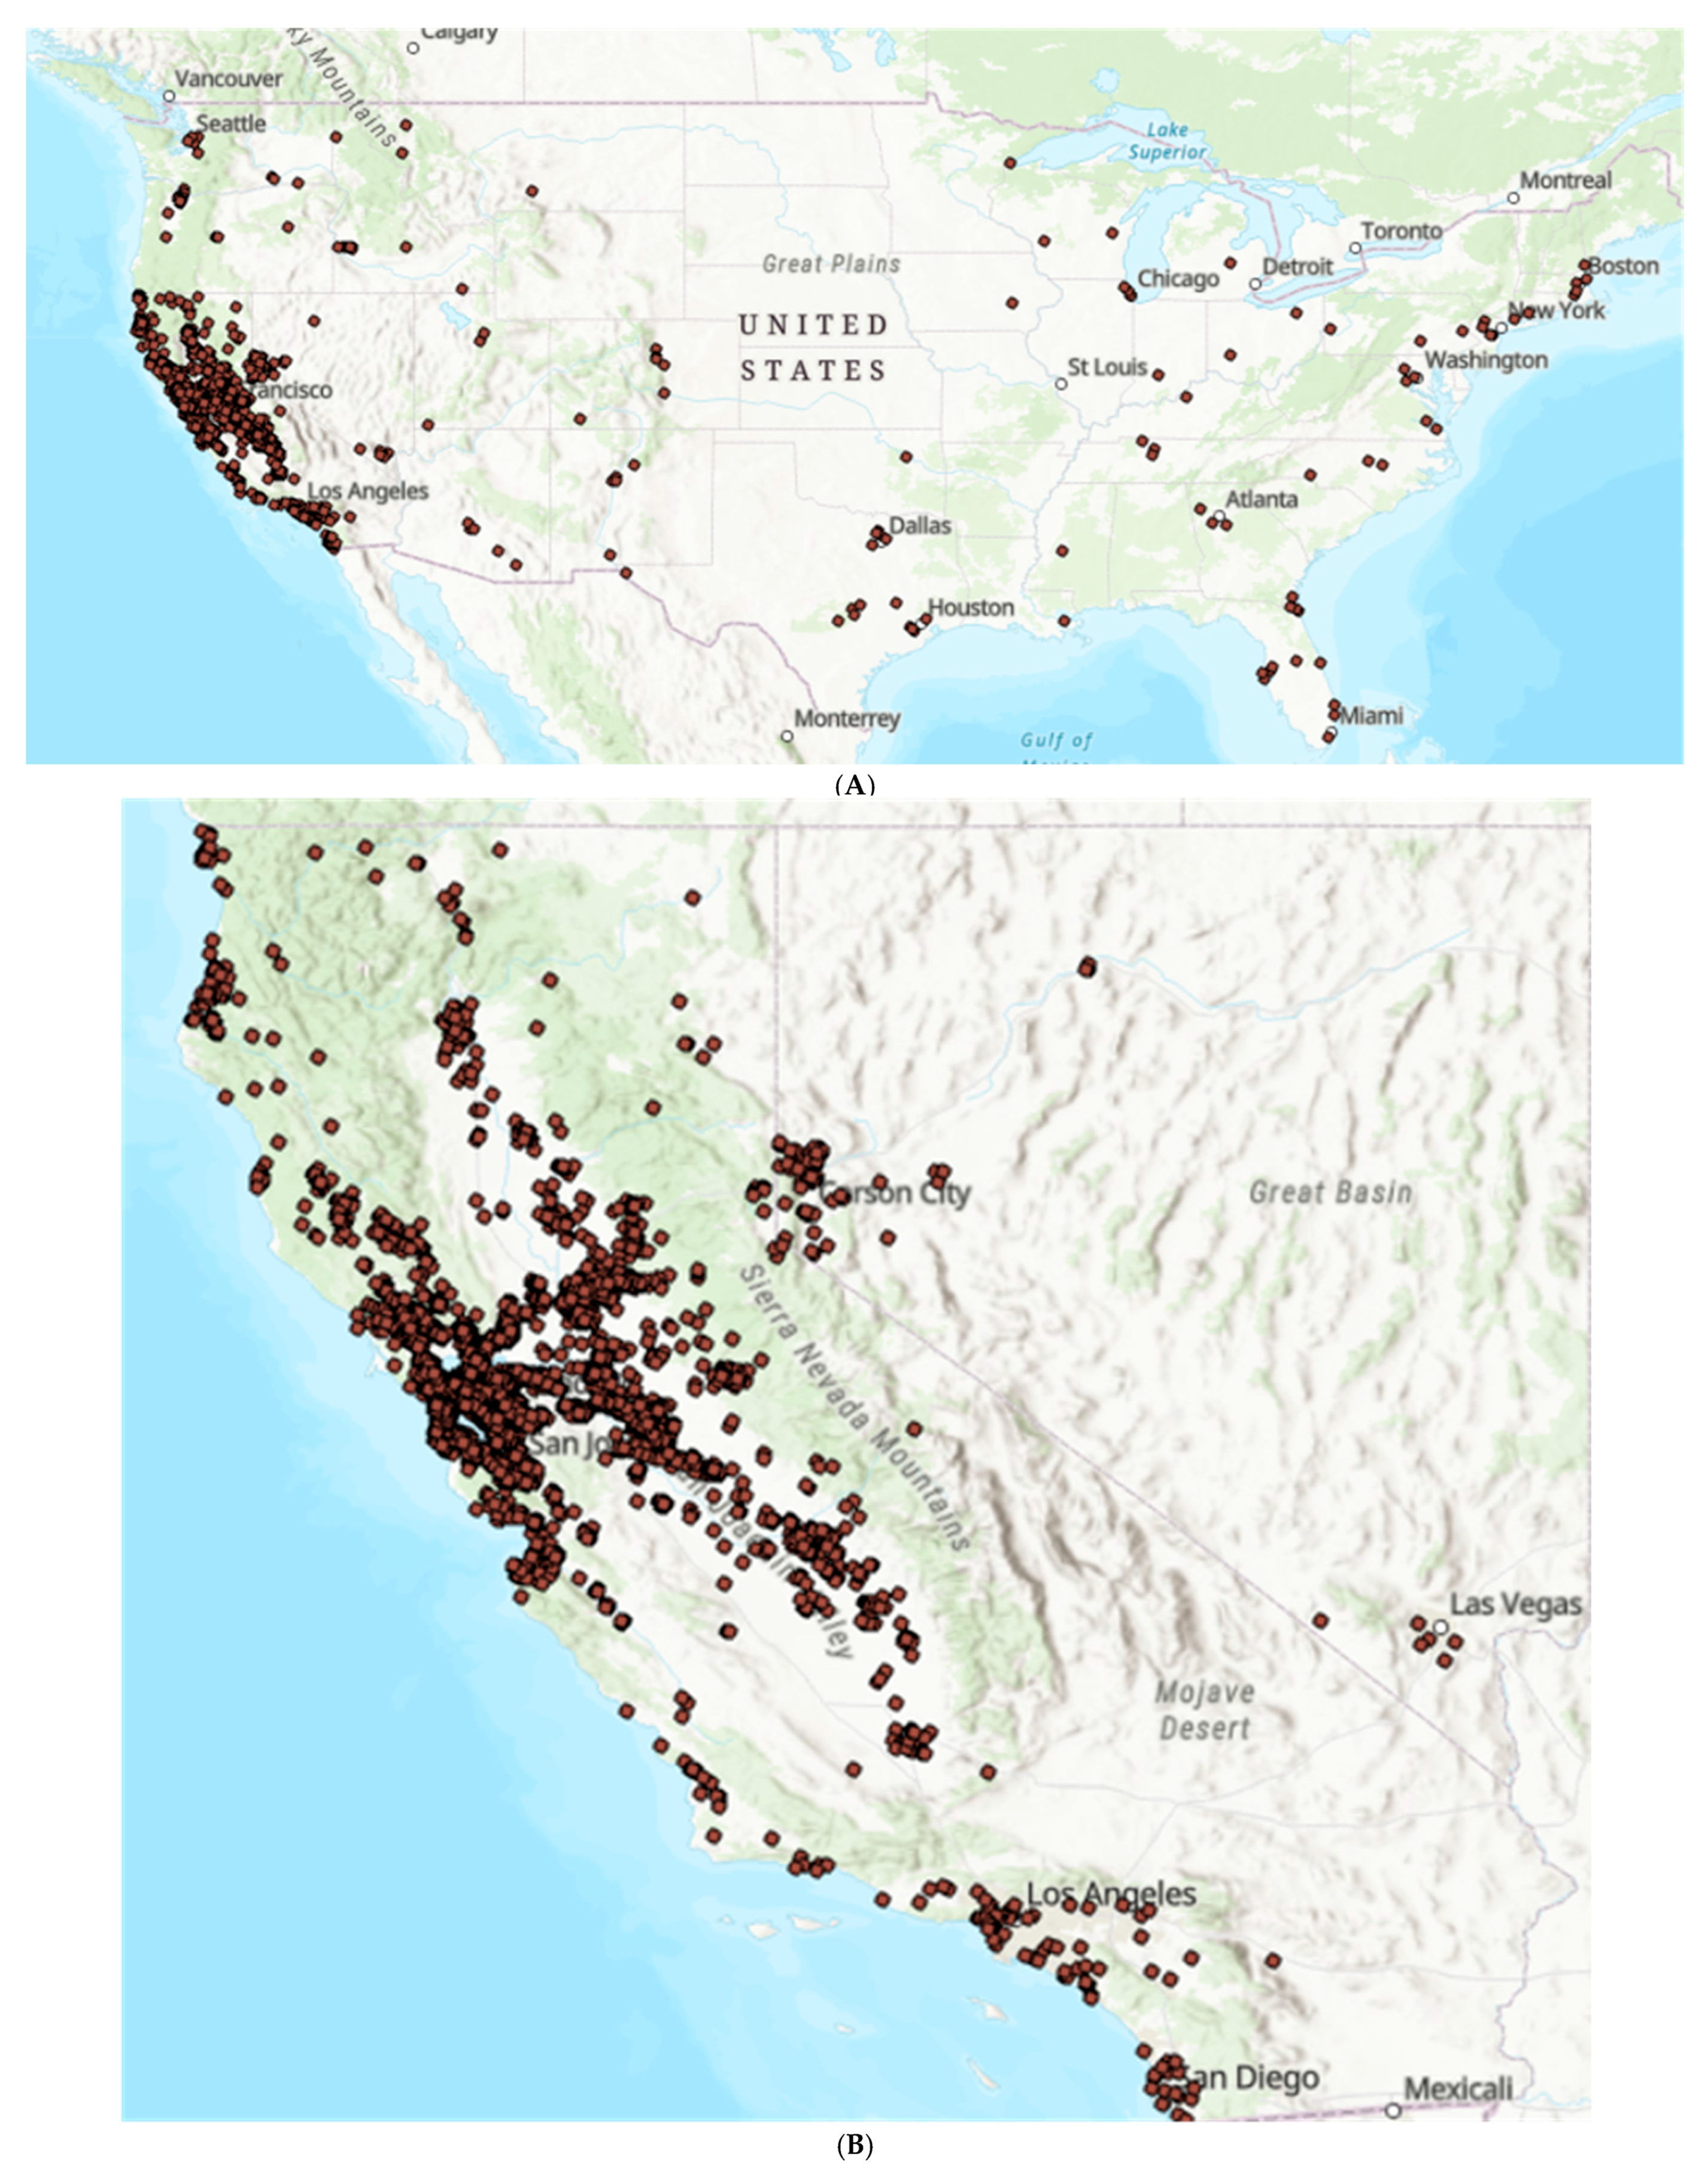
,  ,
,
Abstract
1. Introduction
2. Methods
2.1. Design
2.2. Sample
2.3. Data Acquisition and Analysis
3. Results
3.1. Demographic and Clinical Characteristics
3.2. Healthcare Utilization
3.3. Missed Clinic Visits
3.4. Telehealth Use
3.5. Patient Portal Activation
4. Discussion
5. Conclusions
Author Contributions
Funding
Institutional Review Board Statement
Informed Consent Statement
Data Availability Statement
Acknowledgments
Conflicts of Interest
References
- Rezaee, M.E.; Pollock, M. Multiple Chronic Conditions Among Outpatient Pediatric Patients, Southeastern Michigan, 2008–2013. Prev. Chronic Dis. 2015, 12, E18. [Google Scholar] [CrossRef] [PubMed]
- Perrin, J.M.; Bloom, S.R.; Gortmaker, S.L. The increase of childhood chronic conditions in the United States. JAMA 2007, 297, 2755–2759. [Google Scholar] [CrossRef] [PubMed]
- Bai, G.; Herten, M.H.; Landgraf, J.M.; Korfage, I.J.; Raat, H. Childhood chronic conditions and health-related quality of life: Findings from a large population-based study. PLoS ONE 2017, 12, e0178539. [Google Scholar] [CrossRef] [PubMed] [PubMed Central]
- Turkel, S.; Pao, M. Late consequences of chronic pediatric illness. Psychiatr. Clin. N. Am. 2007, 30, 819–835. [Google Scholar] [CrossRef] [PubMed] [PubMed Central]
- Karve, S.; Candrilli, S.; Kappelman, M.D.; Tolleson-Rinehart, S.; Tennis, P.; Andrews, E. Healthcare utilization and comorbidity burden among children and young adults in the United States with systemic lupus erythematosus or inflammatory bowel disease. J. Pediatr. 2012, 161, 662–670.e2. [Google Scholar] [CrossRef] [PubMed]
- Simeone, J.C.; Shah, S.; Ganz, M.L.; Sullivan, S.; Koralova, A.; LeGrand, J.; Bushman, J. Healthcare resource utilization and cost among patients with type 1 diabetes in the United States. J. Manag. Care Spec. Pharm. 2020, 26, 1399–1410. [Google Scholar] [CrossRef] [PubMed] [PubMed Central]
- Flanagin, A.; Flanagin, A.; Frey, T.; Frey, T.; Christiansen, S.L.; Christiansen, S.L.; AMA Manual of Style Committee. Updated Guidance on the Reporting of Race and Ethnicity in Medical and Science Journals. JAMA 2021, 326, 621–627. [Google Scholar] [CrossRef] [PubMed]
- Razai, M.S.; Majeed, A.; Esmail, A. Structural racism is a fundamental cause and driver of ethnic disparities in health. BMJ 2021, 373, n938. [Google Scholar] [CrossRef] [PubMed]
- Borrell, L.N.; Elhawary, J.R.; Fuentes-Afflick, E.; Witonsky, J.; Bhakta, N.; Wu, A.H.; Bibbins-Domingo, K.; Rodríguez-Santana, J.R.; Lenoir, M.A.; Gavin, J.R.; et al. Race and Genetic Ancestry in Medicine—A Time for Reckoning with Racism. N. Engl. J. Med. 2021, 384, 474–480. [Google Scholar] [CrossRef] [PubMed] [PubMed Central]
- Guzek, L.M.; Gentry, S.D.; Golomb, M.R. The estimated cost of “no-shows” in an academic pediatric neurology clinic. Pediatr. Neurol. 2015, 52, 198–201. [Google Scholar] [CrossRef] [PubMed]
- U.S. Census Bureau. 2017–2022 American Community Survey 5-Year Public Use Microdata Samples [Stata Data File]. 2022. Available online: https://www.census.gov/programs-surveys/acs/microdata/access.html (accessed on 1 July 2022).
- Rural-Urban Commuting Area (RUCA) Codes [Online]. United States Department of Agriculture. Available online: https://www.ers.usda.gov/dataproducts/rural-urban-commuting-area-codes/documentation/ (accessed on 1 July 2022).
- Bureau UC. The Census Multidimensional Deprivation Index: Revised and Updated. Census.gov. Available online: https://www.census.gov/library/working-papers/2021/demo/SEHSD-WP2021-03.html (accessed on 1 July 2022).
- StataCorp. Stata Statistical Software: Release 16; StataCorp LLC.: College Station, TX, USA, 2019. [Google Scholar]
- Esri. “Topographic” [basemap]. Scale Not Given. “USA Topographic Map”. © 2014 National Geographic Society, i-cubed. Available online: http://www.arcgis.com/home/item.html?id=30e5fe3149c34df1ba922e6f5bbf808f (accessed on 1 July 2022).
- Semega, J.; Kollar, M. Income in the United States: 2021. U.S. Census Bureau. Available online: https://www.census.gov/content/dam/Census/library/publications/2022/demo/p60-276.pdf (accessed on 1 July 2022).
- Fortin, K.; Pries, E.; Kwon, S. Missed Medical Appointments and Disease Control in Children with Type 1 Diabetes. J. Pediatr. Health Care 2016, 30, 381–389. [Google Scholar] [CrossRef] [PubMed]
- McGrady, M.E.; Hommel, K.A. Medication adherence and health care utilization in pediatric chronic illness: A systematic review. Pediatrics 2013, 132, 730–740. [Google Scholar] [CrossRef] [PubMed] [PubMed Central]
- Nguyen, D.L.; DeJesus, R.S.; Wieland, M.L. Missed appointments in resident continuity clinic: Patient characteristics and health care outcomes. J. Grad. Med. Educ. 2011, 3, 350–355. [Google Scholar] [CrossRef] [PubMed] [PubMed Central]
- Samuels, R.C.; Ward, V.L.; Melvin, P.; Macht-Greenberg, M.; Wenren, L.M.; Yi, J.; Massey, G.; Cox, J.E. Missed Appointments: Factors Contributing to High No-Show Rates in an Urban Pediatrics Primary Care Clinic. Clin. Pediatr. 2015, 54, 976–982. [Google Scholar] [CrossRef] [PubMed]
- Perez, F.D.; Xie, J.; Sin, A.; Tsai, R.; Sanders, L.; Cox, K.; Haberland, C.A.; Park, K. Characteristics and direct costs of academic pediatric subspecialty outpatient no-show events. J. Healthc. Qual. 2014, 36, 32–42. [Google Scholar] [CrossRef] [PubMed]
- Jones, M.K.; O’Connell, N.S.; Skelton, J.A.; Halvorson, E.E. Patient Characteristics Associated With Missed Appointments in Pediatric Subspecialty Clinics. J. Healthc. Qual. 2022, 44, 230–239. [Google Scholar] [CrossRef]
- Bailey, Z.D.; Krieger, N.; Agénor, M.; Graves, J.; Linos, N.; Bassett, M.T. Structural racism and health inequities in the USA: Evidence and interventions. Lancet 2017, 389, 1453–1463. [Google Scholar] [CrossRef]
- Linde, S.; Walker, R.J.; Campbell, J.A.; Egede, L.E. Historic Residential Redlining and Present-Day Social Determinants of Health, Home Evictions, and Food Insecurity within US Neighborhoods. J. Gen. Intern. Med. 2023, 38, 3321–3328. [Google Scholar] [CrossRef] [PubMed] [PubMed Central]
- Braun, L.; Steurer, M.; Henry, D. Healthcare Utilization of Complex Chronically Ill Children Managed by a Telehealth-Based Team. Front. Pediatr. 2021, 9, 689572. [Google Scholar] [CrossRef] [PubMed] [PubMed Central]
- Van Houten, L.; Deegan, K.; Siemer, M.; Walsh, S. A Telehealth Initiative to Decrease No-Show Rates in a Pediatric Asthma Mobile Clinic. J. Pediatr. Nurs. 2021, 59, 143–150. [Google Scholar] [CrossRef] [PubMed]
- Adepoju, O.E.; Chae, M.; Liaw, W.; Angelocci, T.; Millard, P.; Matuk-Villazon, O. Transition to telemedicine and its impact on missed appointments in community-based clinics. Ann. Med. 2022, 54, 98–107. [Google Scholar] [CrossRef] [PubMed] [PubMed Central]
- Lin, N.Y.; Ramsey, R.R.; Miller, J.L.; McDowell, K.M.; Zhang, N.; Hommel, K.; Guilbert, T.W. Telehealth delivery of adherence and medication management system improves outcomes in inner-city children with asthma. Pediatr. Pulmonol. 2020, 55, 858–865. [Google Scholar] [CrossRef] [PubMed] [PubMed Central]
- Ferro, F.; Tozzi, A.E.; Erba, I.; Dall’oglio, I.; Campana, A.; Cecchetti, C.; Geremia, C.; Rega, M.L.; Tontini, G.; Tiozzo, E.; et al. Impact of telemedicine on health outcomes in children with medical complexity: An integrative review. Eur. J. Pediatr. 2021, 180, 2389–2400. [Google Scholar] [CrossRef] [PubMed] [PubMed Central]
- Notario, P.M.; Gentile, E.; Amidon, M.; Angst, D.; Lefaiver, C.; Webster, K. Home-Based Telemedicine for Children with Medical Complexity. Telemed. E-Health 2019, 25, 1123–1132. [Google Scholar] [CrossRef] [PubMed]
- Johnson, A.M.; Brimhall, A.S.; Johnson, E.T.; Hodgson, J.; Didericksen, K.; Pye, J.; Harmon, G.J.C.; Sewell, K.B. A systematic review of the effectiveness of patient education through patient portals. JAMIA Open 2023, 6, ooac085. [Google Scholar] [CrossRef]
- Ancker, J.S.; Hafeez, B.; Kaushal, R. Socioeconomic disparities in adoption of personal health records over time. Am. J. Manag. Care 2016, 22, 539–540. [Google Scholar]
- Khoong, E.C.; A Butler, B.; Mesina, O.; Su, G.; DeFries, T.B.; Nijagal, M.; Lyles, C.R. Patient interest in and barriers to telemedicine video visits in a multilingual urban safety-net system. J. Am. Med. Inform. Assoc. 2020, 28, 349–353. [Google Scholar] [CrossRef]
- Schickedanz, A.; Huang, D.; Lopez, A.; Cheung, E.; Lyles, C.R.; Bodenheimer, T.; Sarkar, U. Access, interest, and attitudes toward electronic communication for health care among patients in the medical safety net. J. Gen. Intern. Med. 2013, 28, 914–920. [Google Scholar] [CrossRef]
- Mai, F.; Ko, D.-G.; Shan, Z.; Zhang, D. The Impact of Accelerated Digitization on Patient Portal Use by Underprivileged Racial Minority Groups During COVID-19: Longitudinal Study. J. Med. Internet Res. 2023, 25, e44981. [Google Scholar] [CrossRef]
- Zucker, K.J. Epidemiology of gender dysphoria and transgender identity. Sex Health 2017, 14, 404–411. [Google Scholar] [CrossRef] [PubMed]
- van der Miesen, A.I.; Steensma, T.D.; de Vries, A.L.; Bos, H.; Popma, A. Psychological Functioning in Transgender Adolescents Before and After Gender-Affirmative Care Compared With Cisgender General Population Peers. J. Adolesc. Health 2020, 66, 699–704. [Google Scholar] [CrossRef] [PubMed]
- Bakaki, P.M.; Horace, A.; Dawson, N.; Winterstein, A.; Waldron, J.; Staley, J.; Knight, E.M.P.; Meropol, S.B.; Liu, R.; Johnson, H.; et al. Defining pediatric polypharmacy: A scoping review. PLoS ONE 2018, 13, e0208047. [Google Scholar] [CrossRef] [PubMed] [PubMed Central]
- Marquez, C.; Thompson, R.; Feinstein, J.A.; Orth, L.E. Identifying opportunities for pediatric medication therapy management in children with medical complexity. J. Am. Pharm. Assoc. 2022, 62, 1587–1595. [Google Scholar] [CrossRef] [PubMed] [PubMed Central]
- Kind, A.J.; Buckingham, W.R. Making Neighborhood-Disadvantage Metrics Accessible—The Neighborhood Atlas. N. Engl. J. Med. 2018, 378, 2456–2458. [Google Scholar] [CrossRef] [PubMed Central]
- University of Wisconsin School of Medicine and Public Health. 2021 Area Deprivation Index v4.0. Available online: https://www.neighborhoodatlas.medicine.wisc.edu/ (accessed on 1 July 2023).


| Total | |
|---|---|
| N = 14,245 | |
| Age (IQR) | 14 (8–17) |
| Sex assigned at birth | |
| Female | 7080 (50%) |
| Male | 7152 (50%) |
| Non-binary or Unknown | 13 (0%) |
| Race | |
| White | 5371 (38%) |
| Asian | 1689 (12%) |
| Black | 1375 (10%) |
| American Indian or Alaska Native | 150 (1%) |
| Native Hawaiian or other Pacific Islander | 97 (1%) |
| Other | 4998 (35%) |
| Unknown or Declined to State | 565 (3%) |
| Ethnicity | |
| Hispanic or Latine | 4739 (33%) |
| Not Hispanic or Latine | 9013 (63%) |
| Unknown or Declined to State | 493 (4%) |
| Primary Language | |
| English | 11,961 (84%) |
| Spanish | 1953 (14%) |
| Other | 331 (2%) |
| Payor | |
| Private | 6716 (47%) |
| Public (CCS) | 3833 (27%) |
| Public (Non-CCS) | 3573 (25%) |
| Unknown | 123 (1%) |
| Total | |
|---|---|
| N = 14,245 | |
| Median Income for Zip Code (IQR) | USD 108,680 (USD 74,718–142,785) |
| Median Income Quartiles | |
| 1 (Lowest) | 3699 (26%) |
| 2 | 3464 (24%) |
| 3 | 3708 (26%) |
| 4 (Highest) | 3374 (24%) |
| Median Multidimensional Deprivation Index (IQR) | 0.11 (0.10–0.12) |
| MDI Quartiles | |
| 1 (Lowest) | 4380 (31%) |
| 2 | 3555 (25%) |
| 3 | 2778 (20%) |
| 4 (Highest) | 3528 (25%) |
| Missing | 4 (0%) |
| Median Rural–Urban Commuting Area Score (IQR) | 1 (1–1) |
| Total Living in an Urban Population (%) | 13,181 (93%) |
| Live in the Bay Area | 10,212 (72%) |
| Total | |
|---|---|
| N = 14,245 | |
| Median number of visits (IQR) | 12 (6–25) |
| Median number of missed visits (IQR) | 0 (0–2) |
| Median number of telehealth visits (IQR) | 2 (1–4) |
| Proportion (%) of total visits as telehealth (IQR) | 25 (4–50) |
| Median number of medications (IQR) | 6 (3–10) |
| Median number of referrals (IQR) | 4 (1–8) |
| Active online portal users (%) | 9823 (69%) |
| Any ED visit (%) | 2602 (18%) |
| Any elective or non-elective hospitalization (%) | 2199 (15%) |
| Any child-life encounter (%) | 277 (2%) |
| Any nutrition encounter (%) | 1192 (8%) |
| Any social work encounter (%) | 650 (5%) |
| Any telehealth use (%) | 11,039 (78%) |
| Demographic and Socioeconomic Predictors | Unadjusted IRR ** | 95% CI | p-Value | Adjusted * IRR ** | 95% CI | p-Value |
|---|---|---|---|---|---|---|
| Race | ||||||
| White | ||||||
| Asian | 0.83 | 0.76, 0.91 | <0.001 | 0.83 | 0.76, 0.91 | <0.001 |
| Black | 1.90 | 1.74, 2.08 | <0.001 | 1.56 | 1.42, 1.71 | <0.001 |
| American Indian/Alaska Native | 1.30 | 1.01, 1.66 | 0.04 | 1.17 | 0.94, 1.46 | 0.15 |
| Native Hawaiian or other Pacific Islander | 1.33 | 1.02, 1.74 | 0.03 | 1.28 | 1.01, 1.62 | 0.04 |
| Other | 1.28 | 1.20, 1.37 | <0.001 | 1.09 | 1.01, 1.18 | 0.02 |
| Unknown/Declined to State | 1.19 | 1.03, 1.38 | 0.02 | 1.08 | 0.90, 1.29 | 0.42 |
| Ethnicity | ||||||
| Non-Hispanic/Latine | ||||||
| Hispanic or Latine | 1.09 | 1.03, 1.16 | 0.002 | 1.05 | 0.98, 1.14 | 0.16 |
| Unknown/Declined to State | 1.01 | 0.87, 1.17 | 0.90 | 1.07 | 0.88, 1.29 | 0.51 |
| Primary Payor | ||||||
| Private | ||||||
| Public (CCS) | 1.55 | 1.45, 1.65 | <0.001 | 1.54 | 1.42, 1.68 | <0.001 |
| Public (non-CCS) | 1.77 | 1.66, 1.89 | <0.001 | 1.52 | 1.40, 1.65 | <0.001 |
| Unknown | 1.07 | 0.82, 1.39 | 0.64 | 1.02 | 0.78, 1.33 | 0.87 |
| Median Income Quartile | ||||||
| 1 (Lowest) | 1.57 | 1.46, 1.70 | <0.001 | 1.33 | 1.21, 1.46 | <0.001 |
| 2 | 1.41 | 1.30, 1.52 | <0.001 | 1.23 | 1.12, 1.36 | <0.001 |
| 3 | 1.37 | 1.26, 1.48 | <0.001 | 1.20 | 1.11, 1.31 | <0.001 |
| 4 (Highest) | ||||||
| Language | ||||||
| English | ||||||
| Spanish | 1.03 | 0.95, 1.11 | 0.49 | 0.85 | 0.78, 0.93 | 0.001 |
| Other | 0.97 | 0.84, 1.12 | 0.70 | 0.92 | 0.78, 1.08 | 0.30 |
| Demographic and Socioeconomic Predictors | Unadjusted IRR ** | 95% CI | p-Value | Adjusted * IRR ** | 95% CI | p-Value |
|---|---|---|---|---|---|---|
| Race | ||||||
| White | ||||||
| Asian | 0.89 | 0.82, 0.95 | 0.001 | 1.06 | 0.96, 1.17 | 0.26 |
| Black | 0.63 | 0.57, 0.69 | <0.001 | 0.87 | 0.69, 1.09 | 0.21 |
| American Indian/Alaska Native | 0.88 | 0.65, 1.17 | 0.38 | 1.02 | 0.67, 1.55 | 0.92 |
| Native Hawaiian or other Pacific Islander | 0.73 | 0.56, 0.95 | 0.02 | 0.83 | 0.48, 1.43 | 0.50 |
| Other | 0.73 | 0.69, 0.77 | <0.001 | 1.09 | 0.97, 1.22 | 0.13 |
| Unknown/Declined to State | 1.34 | 1.21, 1.48 | <0.001 | 1.36 | 1.16, 1.59 | <0.001 |
| Ethnicity | ||||||
| Non-Hispanic/Latine | ||||||
| Hispanic or Latine | 0.80 | 0.75, 0.84 | <0.001 | 0.96 | 0.90, 1.02 | 0.17 |
| Unknown/Declined to State | 1.49 | 1.32, 1.68 | <0.001 | 0.98 | 0.85, 1.14 | 0.80 |
| Primary Payor | ||||||
| Private | ||||||
| Public (CCS) | 0.62 | 0.59, 0.66 | <0.001 | 0.90 | 0.83, 0.99 | 0.02 |
| Public (non-CCS) | 0.82 | 0.77, 0.88 | <0.001 | 0.96 | 0.86, 1.07 | 0.44 |
| Unknown | 0.70 | 0.48, 1.03 | 0.07 | 0.94 | 0.71, 1.26 | 0.70 |
| Median Income Quartile | ||||||
| 1 (Lowest) | 0.73 | 0.67, 0.78 | <0.001 | 0.91 | 0.81, 1.02 | 0.12 |
| 2 | 0.87 | 0.82, 0.93 | <0.001 | 1.00 | 0.91, 1.09 | 0.92 |
| 3 | 0.92 | 0.85, 0.99 | 0.02 | 1.04 | 0.97, 1.12 | 0.26 |
| 4 (Highest) | ||||||
| Language | ||||||
| English | ||||||
| Spanish | 0.76 | 0.69, 0.83 | <0.001 | 1.02 | 0.93, 1.11 | 0.73 |
| Other | 0.78 | 0.68, 0.91 | 0.001 | 1.11 | 0.98, 1.26 | 0.11 |
| Demographic and Socioeconomic Predictors | Unadjusted OR ** | 95% CI | p-Value | Adjusted * OR ** | 95% CI | p-Value |
|---|---|---|---|---|---|---|
| Race | ||||||
| White | ||||||
| Asian | 1.15 | 1.00, 1.33 | 0.05 | 1.25 | 0.89, 1.73 | 0.20 |
| Black | 0.31 | 0.27, 0.35 | <0.001 | 0.90 | 0.55, 1.46 | 0.66 |
| American Indian/Alaska Native | 1.28 | 0.82, 2.01 | 0.28 | 2.22 | 0.26, 18.85 | 0.47 |
| Native Hawaiian or other Pacific Islander | 0.75 | 0.47, 1.20 | 0.23 | 0.77 | 0.16, 3.77 | 0.75 |
| Other | 0.26 | 0.24, 0.29 | <0.001 | 0.58 | 0.44, 0.75 | <0.001 |
| Unknown/Declined to State | 0.67 | 0.55, 0.81 | <0.001 | 0.67 | 0.40, 1.09 | 0.11 |
| Ethnicity | ||||||
| Non-Hispanic/Latine | ||||||
| Hispanic or Latine | 0.33 | 0.30, 0.35 | <0.001 | 0.97 | 0.85, 1.09 | 0.52 |
| Unknown/Declined to State | 1.12 | 0.90, 1.41 | 0.30 | 1.00 | 0.73, 1.37 | 0.99 |
| Primary Payor | ||||||
| Private | ||||||
| Public (CCS) | 0.19 | 0.17, 0.20 | <0.001 | 0.44 | 0.39, 0.49 | <0.001 |
| Public (non-CCS) | 0.15 | 0.14, 0.17 | <0.001 | 0.33 | 0.29, 0.38 | <0.001 |
| Unknown | 0.30 | 0.21, 0.44 | <0.001 | 0.42 | 0.28, 0.65 | <0.001 |
| Median Income Quartile | ||||||
| 1 (Lowest) | 0.19 | 0.17, 0.22 | <0.001 | 0.68 | 0.53, 0.88 | 0.003 |
| 2 | 0.30 | 0.27, 0.34 | <0.001 | 0.67 | 0.53, 0.85 | 0.001 |
| 3 | 0.41 | 0.36, 0.46 | <0.001 | 0.73 | 0.59, 0.90 | 0.003 |
| 4 (Highest) | ||||||
| Language | ||||||
| English | ||||||
| Spanish | 0.11 | 0.10, 0.12 | <0.001 | 0.20 | 0.17, 0.23 | <0.001 |
| Other | 0.23 | 0.19, 0.29 | <0.001 | 0.36 | 0.25, 0.52 | <0.001 |
Disclaimer/Publisher’s Note: The statements, opinions and data contained in all publications are solely those of the individual author(s) and contributor(s) and not of MDPI and/or the editor(s). MDPI and/or the editor(s) disclaim responsibility for any injury to people or property resulting from any ideas, methods, instructions or products referred to in the content. |
© 2024 by the authors. Licensee MDPI, Basel, Switzerland. This article is an open access article distributed under the terms and conditions of the Creative Commons Attribution (CC BY) license (https://creativecommons.org/licenses/by/4.0/).
Share and Cite
Soulsby, W.D.; Franck, L.S.; Perito, E.; Brakeman, P.; Cuneo, A.; Quill, L.; Boscardin, J.; von Scheven, E. Healthcare Utilization Among Youth with Chronic Illness Receiving Care at a Large Urban Academic Healthcare System. Healthcare 2024, 12, 2278. https://doi.org/10.3390/healthcare12222278
Soulsby WD, Franck LS, Perito E, Brakeman P, Cuneo A, Quill L, Boscardin J, von Scheven E. Healthcare Utilization Among Youth with Chronic Illness Receiving Care at a Large Urban Academic Healthcare System. Healthcare. 2024; 12(22):2278. https://doi.org/10.3390/healthcare12222278
Chicago/Turabian StyleSoulsby, William Daniel, Linda S. Franck, Emily Perito, Paul Brakeman, Addison Cuneo, Laura Quill, John Boscardin, and Emily von Scheven. 2024. "Healthcare Utilization Among Youth with Chronic Illness Receiving Care at a Large Urban Academic Healthcare System" Healthcare 12, no. 22: 2278. https://doi.org/10.3390/healthcare12222278
APA StyleSoulsby, W. D., Franck, L. S., Perito, E., Brakeman, P., Cuneo, A., Quill, L., Boscardin, J., & von Scheven, E. (2024). Healthcare Utilization Among Youth with Chronic Illness Receiving Care at a Large Urban Academic Healthcare System. Healthcare, 12(22), 2278. https://doi.org/10.3390/healthcare12222278