

Interpretable Differential Diagnosis of Non-COVID Viral Pneumonia, Lung Opacity and COVID-19 Using Tuned Transfer Learning and Explainable AI

 ,
,  ,
,  ,
,  ,
, 
Abstract
1. Introduction
- Three CNN models were developed for COVID-19 mass screening (two classes: COVID positive & COVID negative) from chest X-ray images. Afterward, explainable AI was applied to demystify the black box of models.
- Three additional multi-class models were constructed to diagnose non-COVID, COVID, lung opacity and non-COVID viral pneumonia from chest X-ray radio graphs. Furthermore, explainable AI was used to validate and explain the performance of each generated multi-class model and to demystify the black box of individual CNN layers
- Presented a comprehensive performance study of the proposed binary and multi class systems in terms of the confusion matrix, accuracy, sensitivity, specificity, and F1-score. Additionally, we compared test accuracy for the implemented dual class CNN models for different training input image resolutions and investigated the impact of input image size on the models’ accuracy.
2. Background Study
3. Methodology
3.1. Dataset
3.1.1. COVID-19
3.1.2. Non-COVID Viral Pneumonia
3.1.3. Lung Opacity
3.2. Image Processing
3.3. Neural Network Models
3.3.1. VGG19
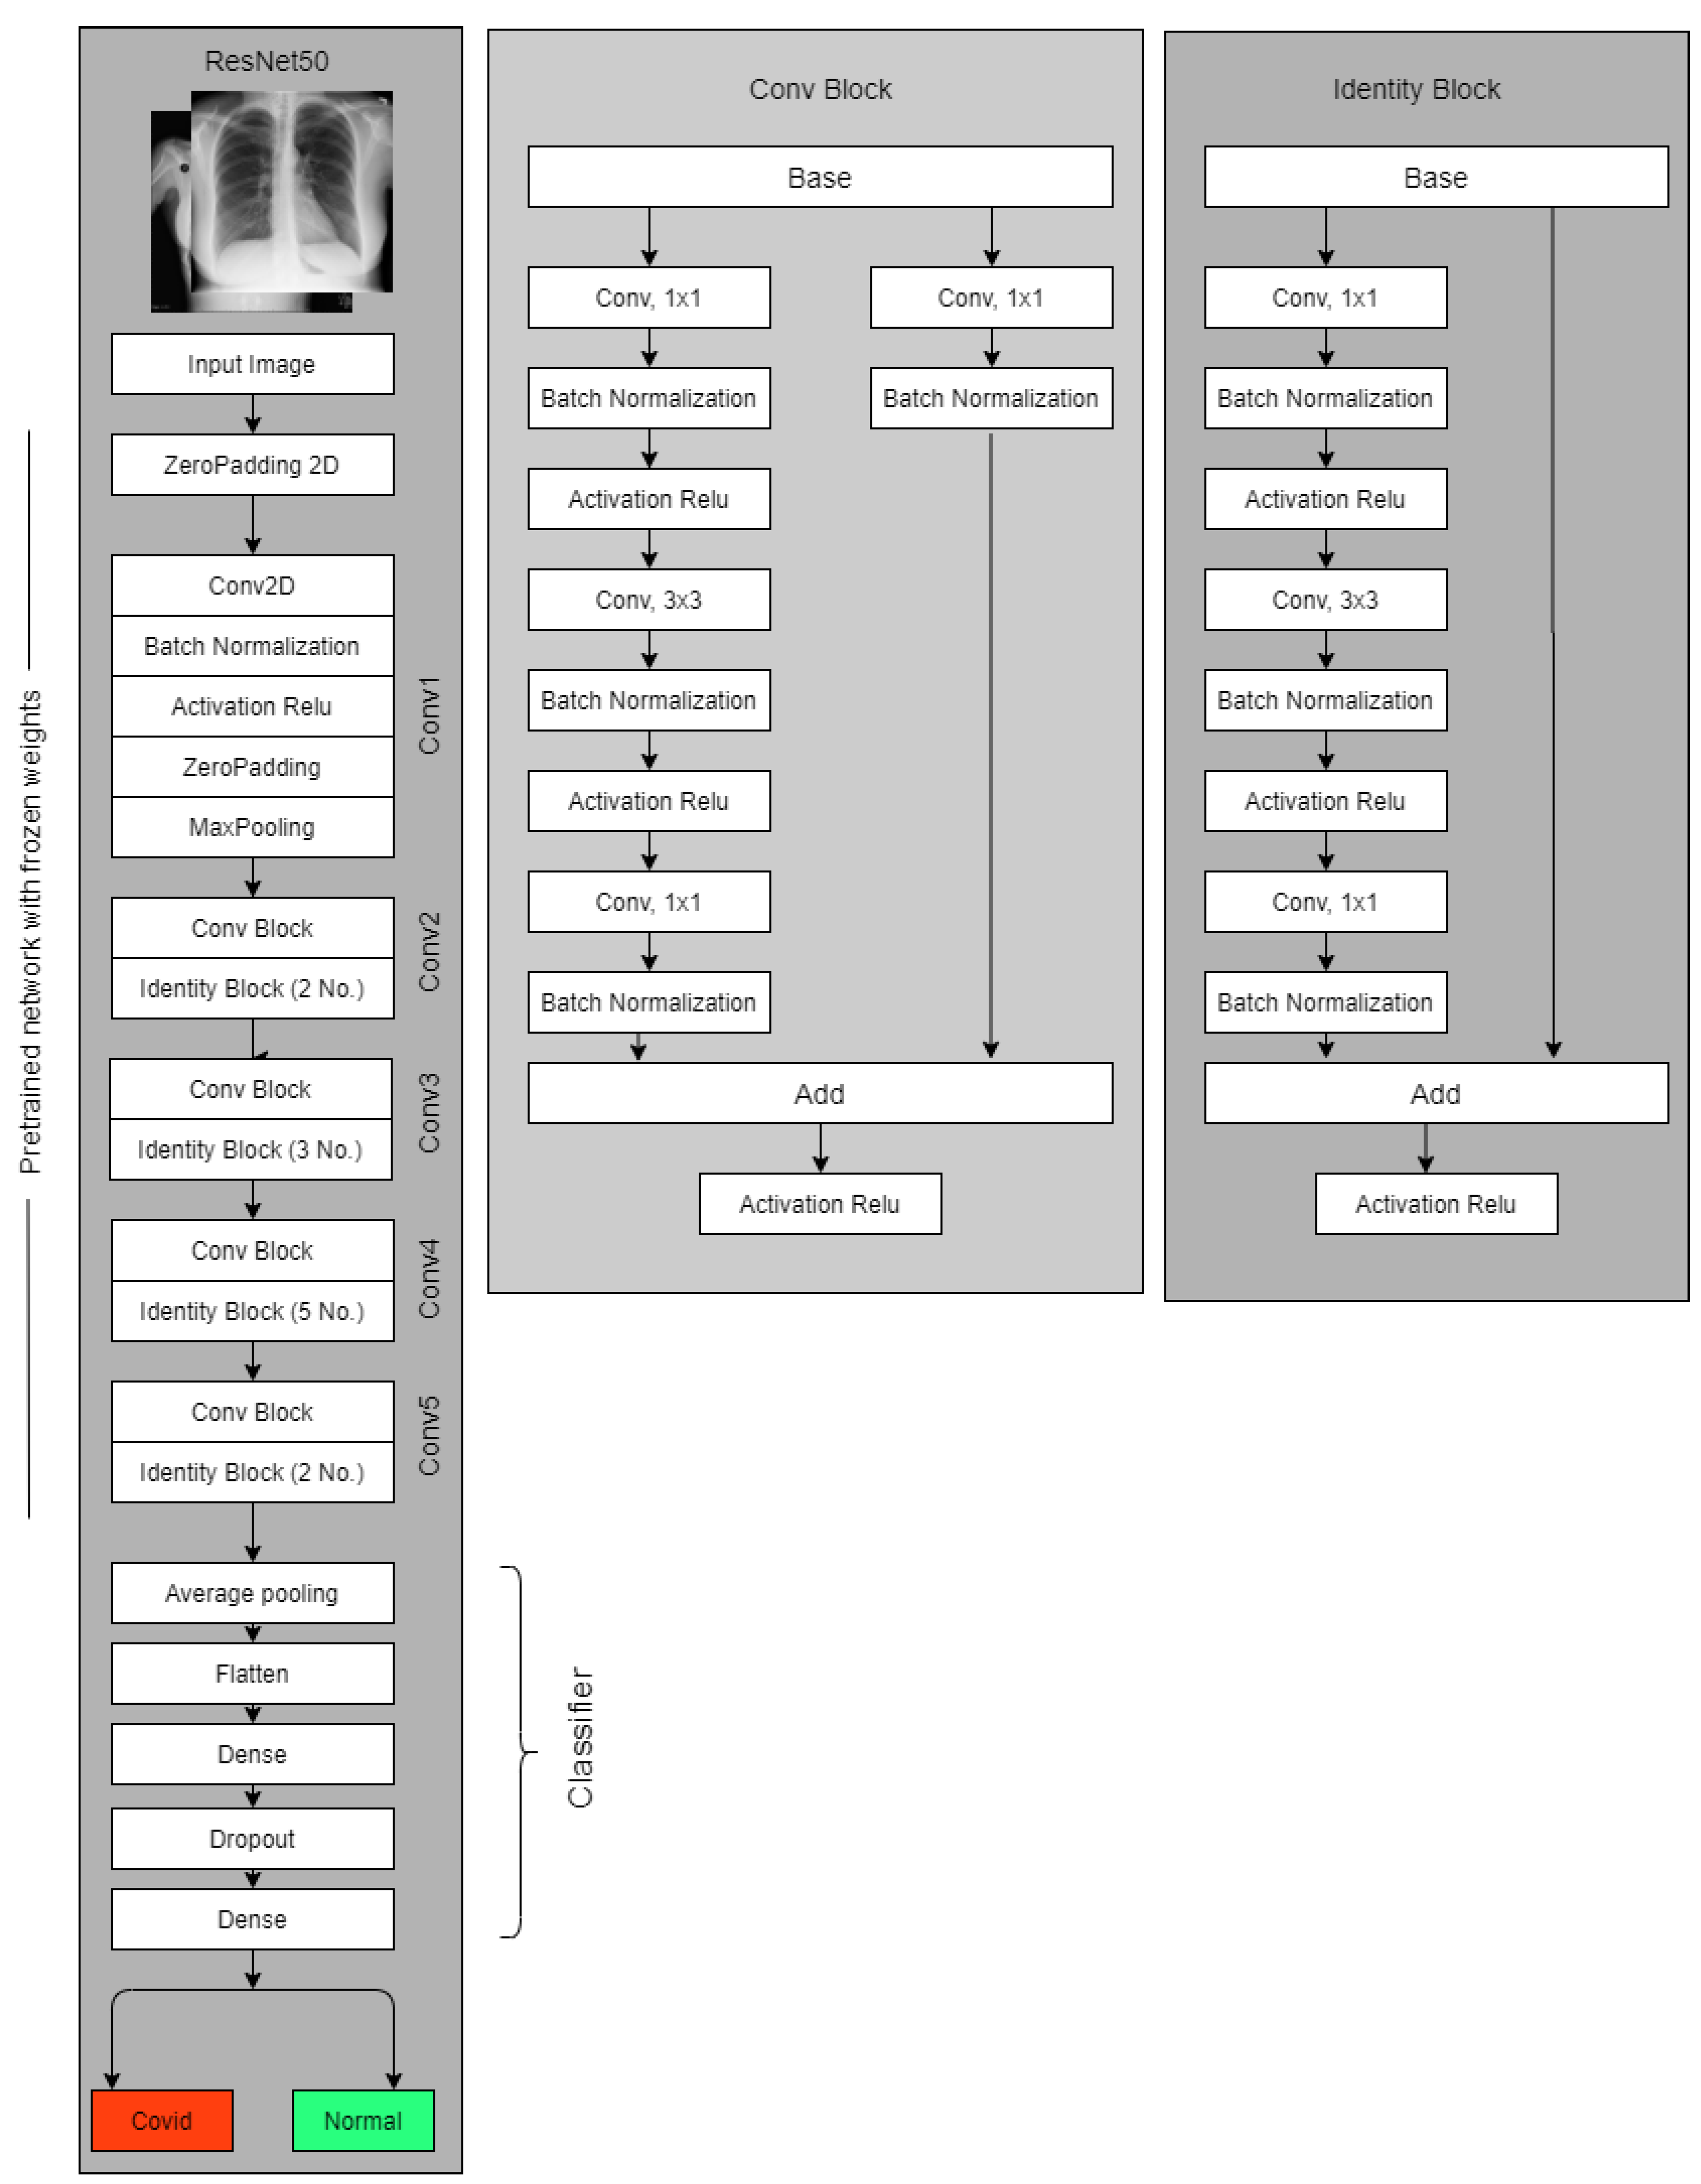
3.3.2. Resnet50
3.3.3. Xception
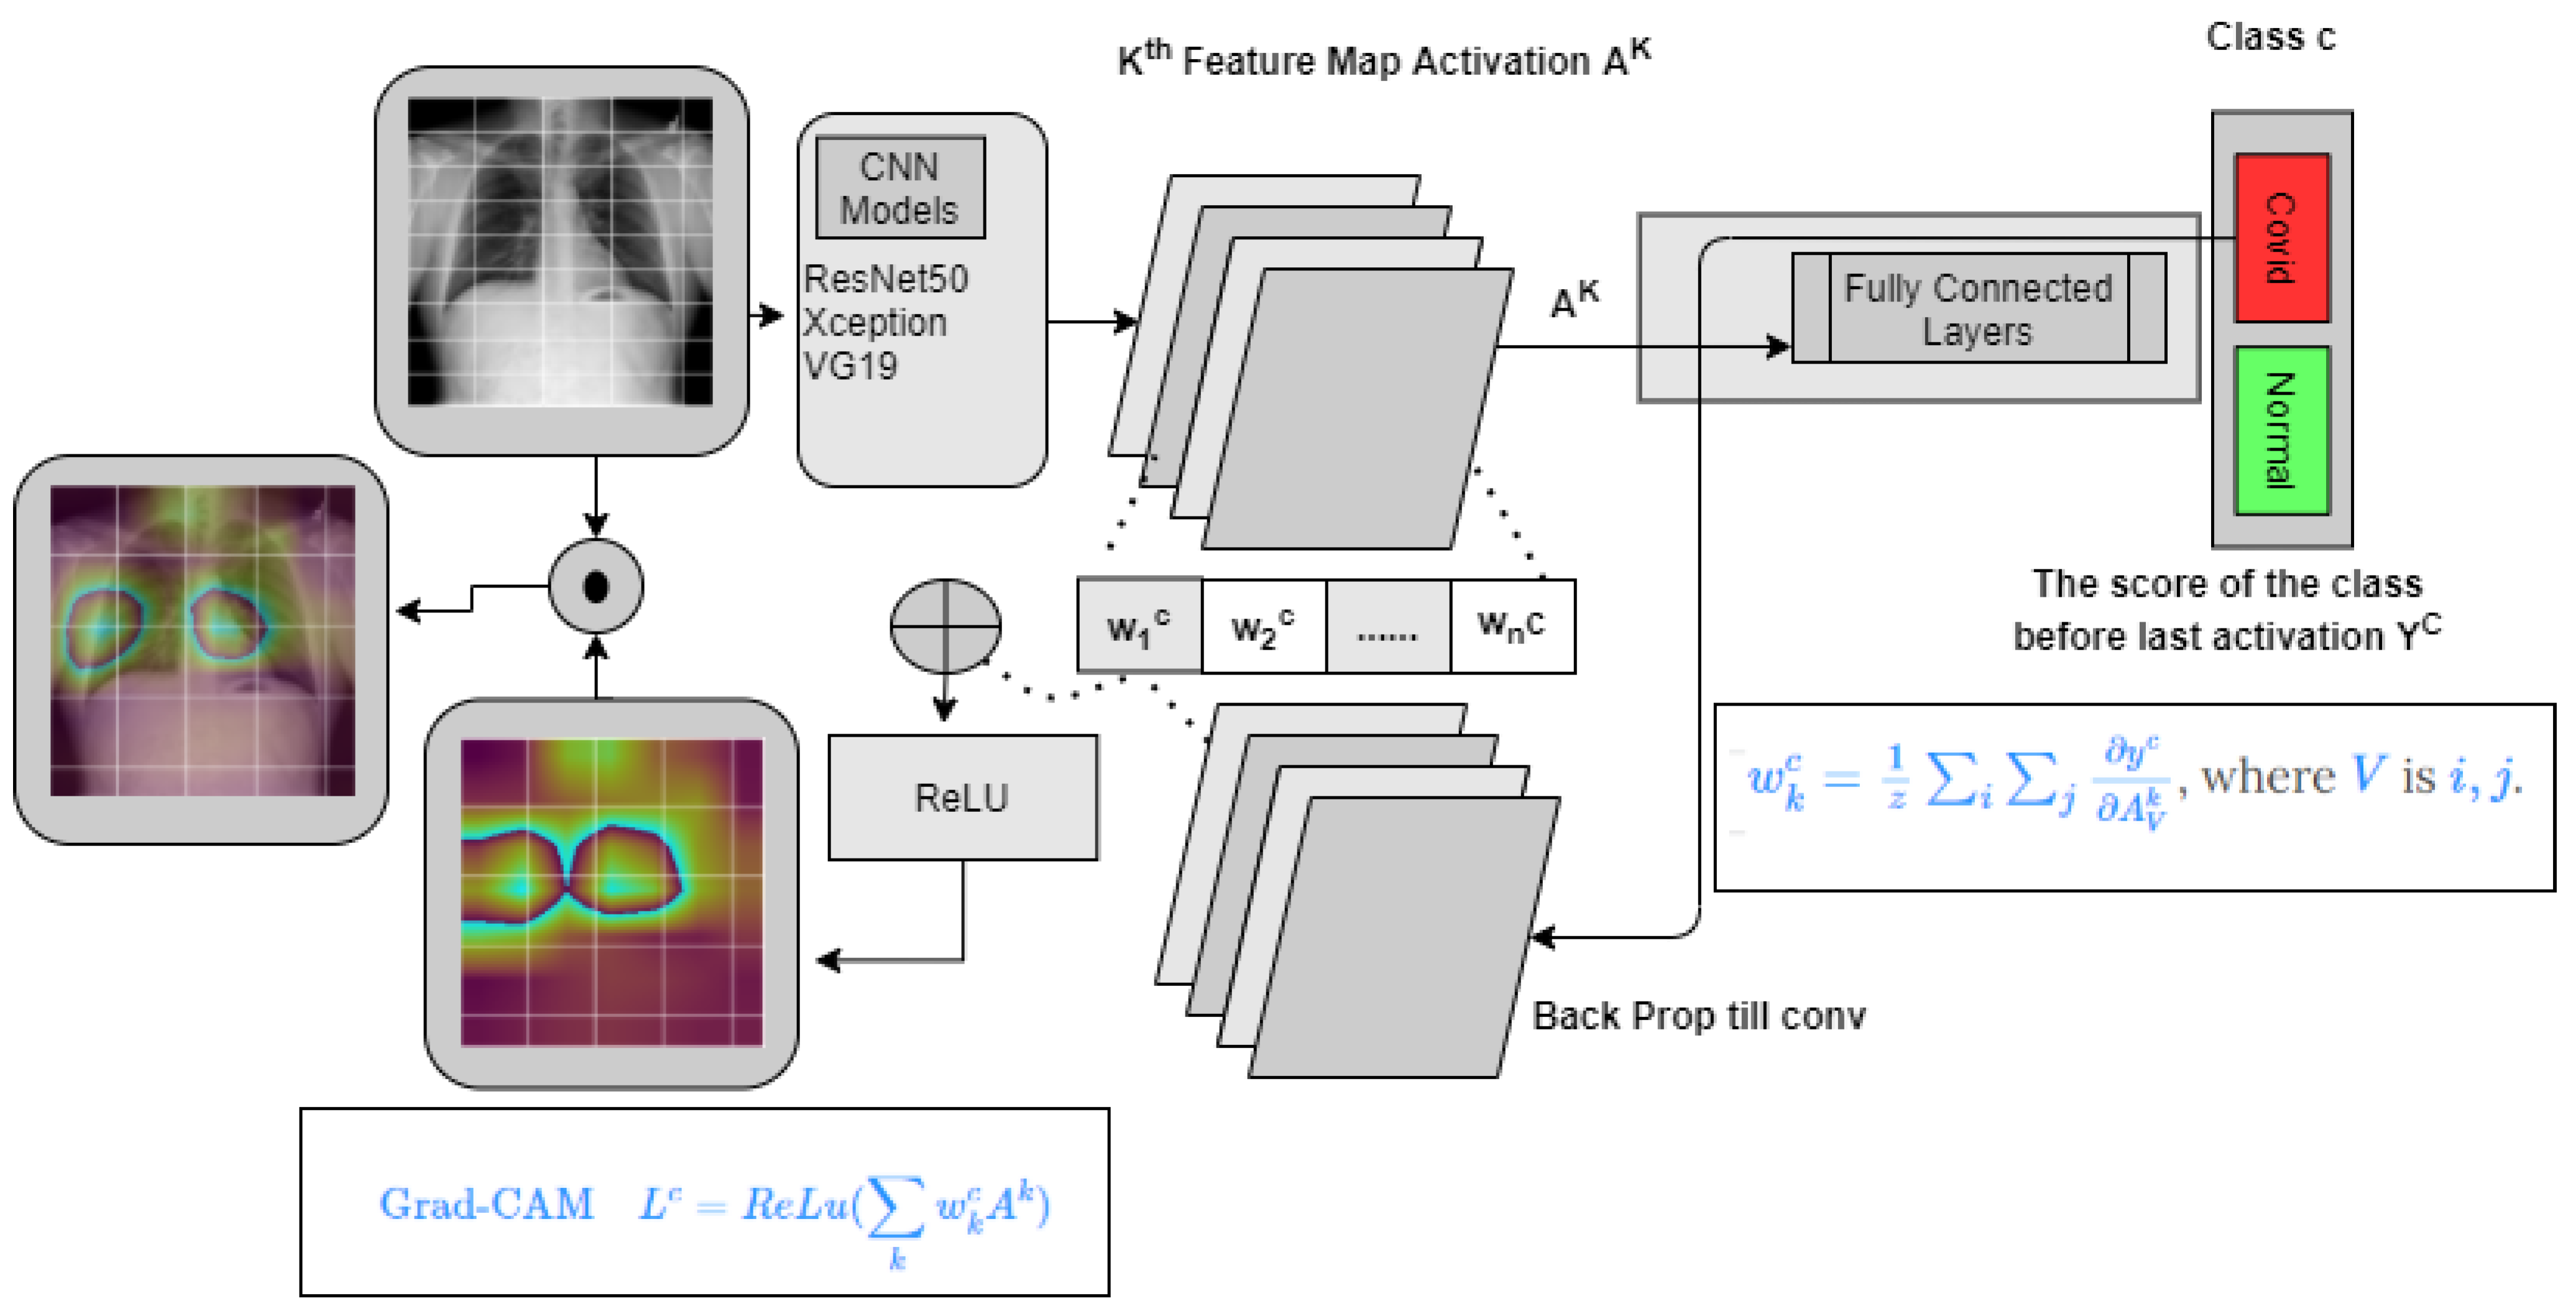
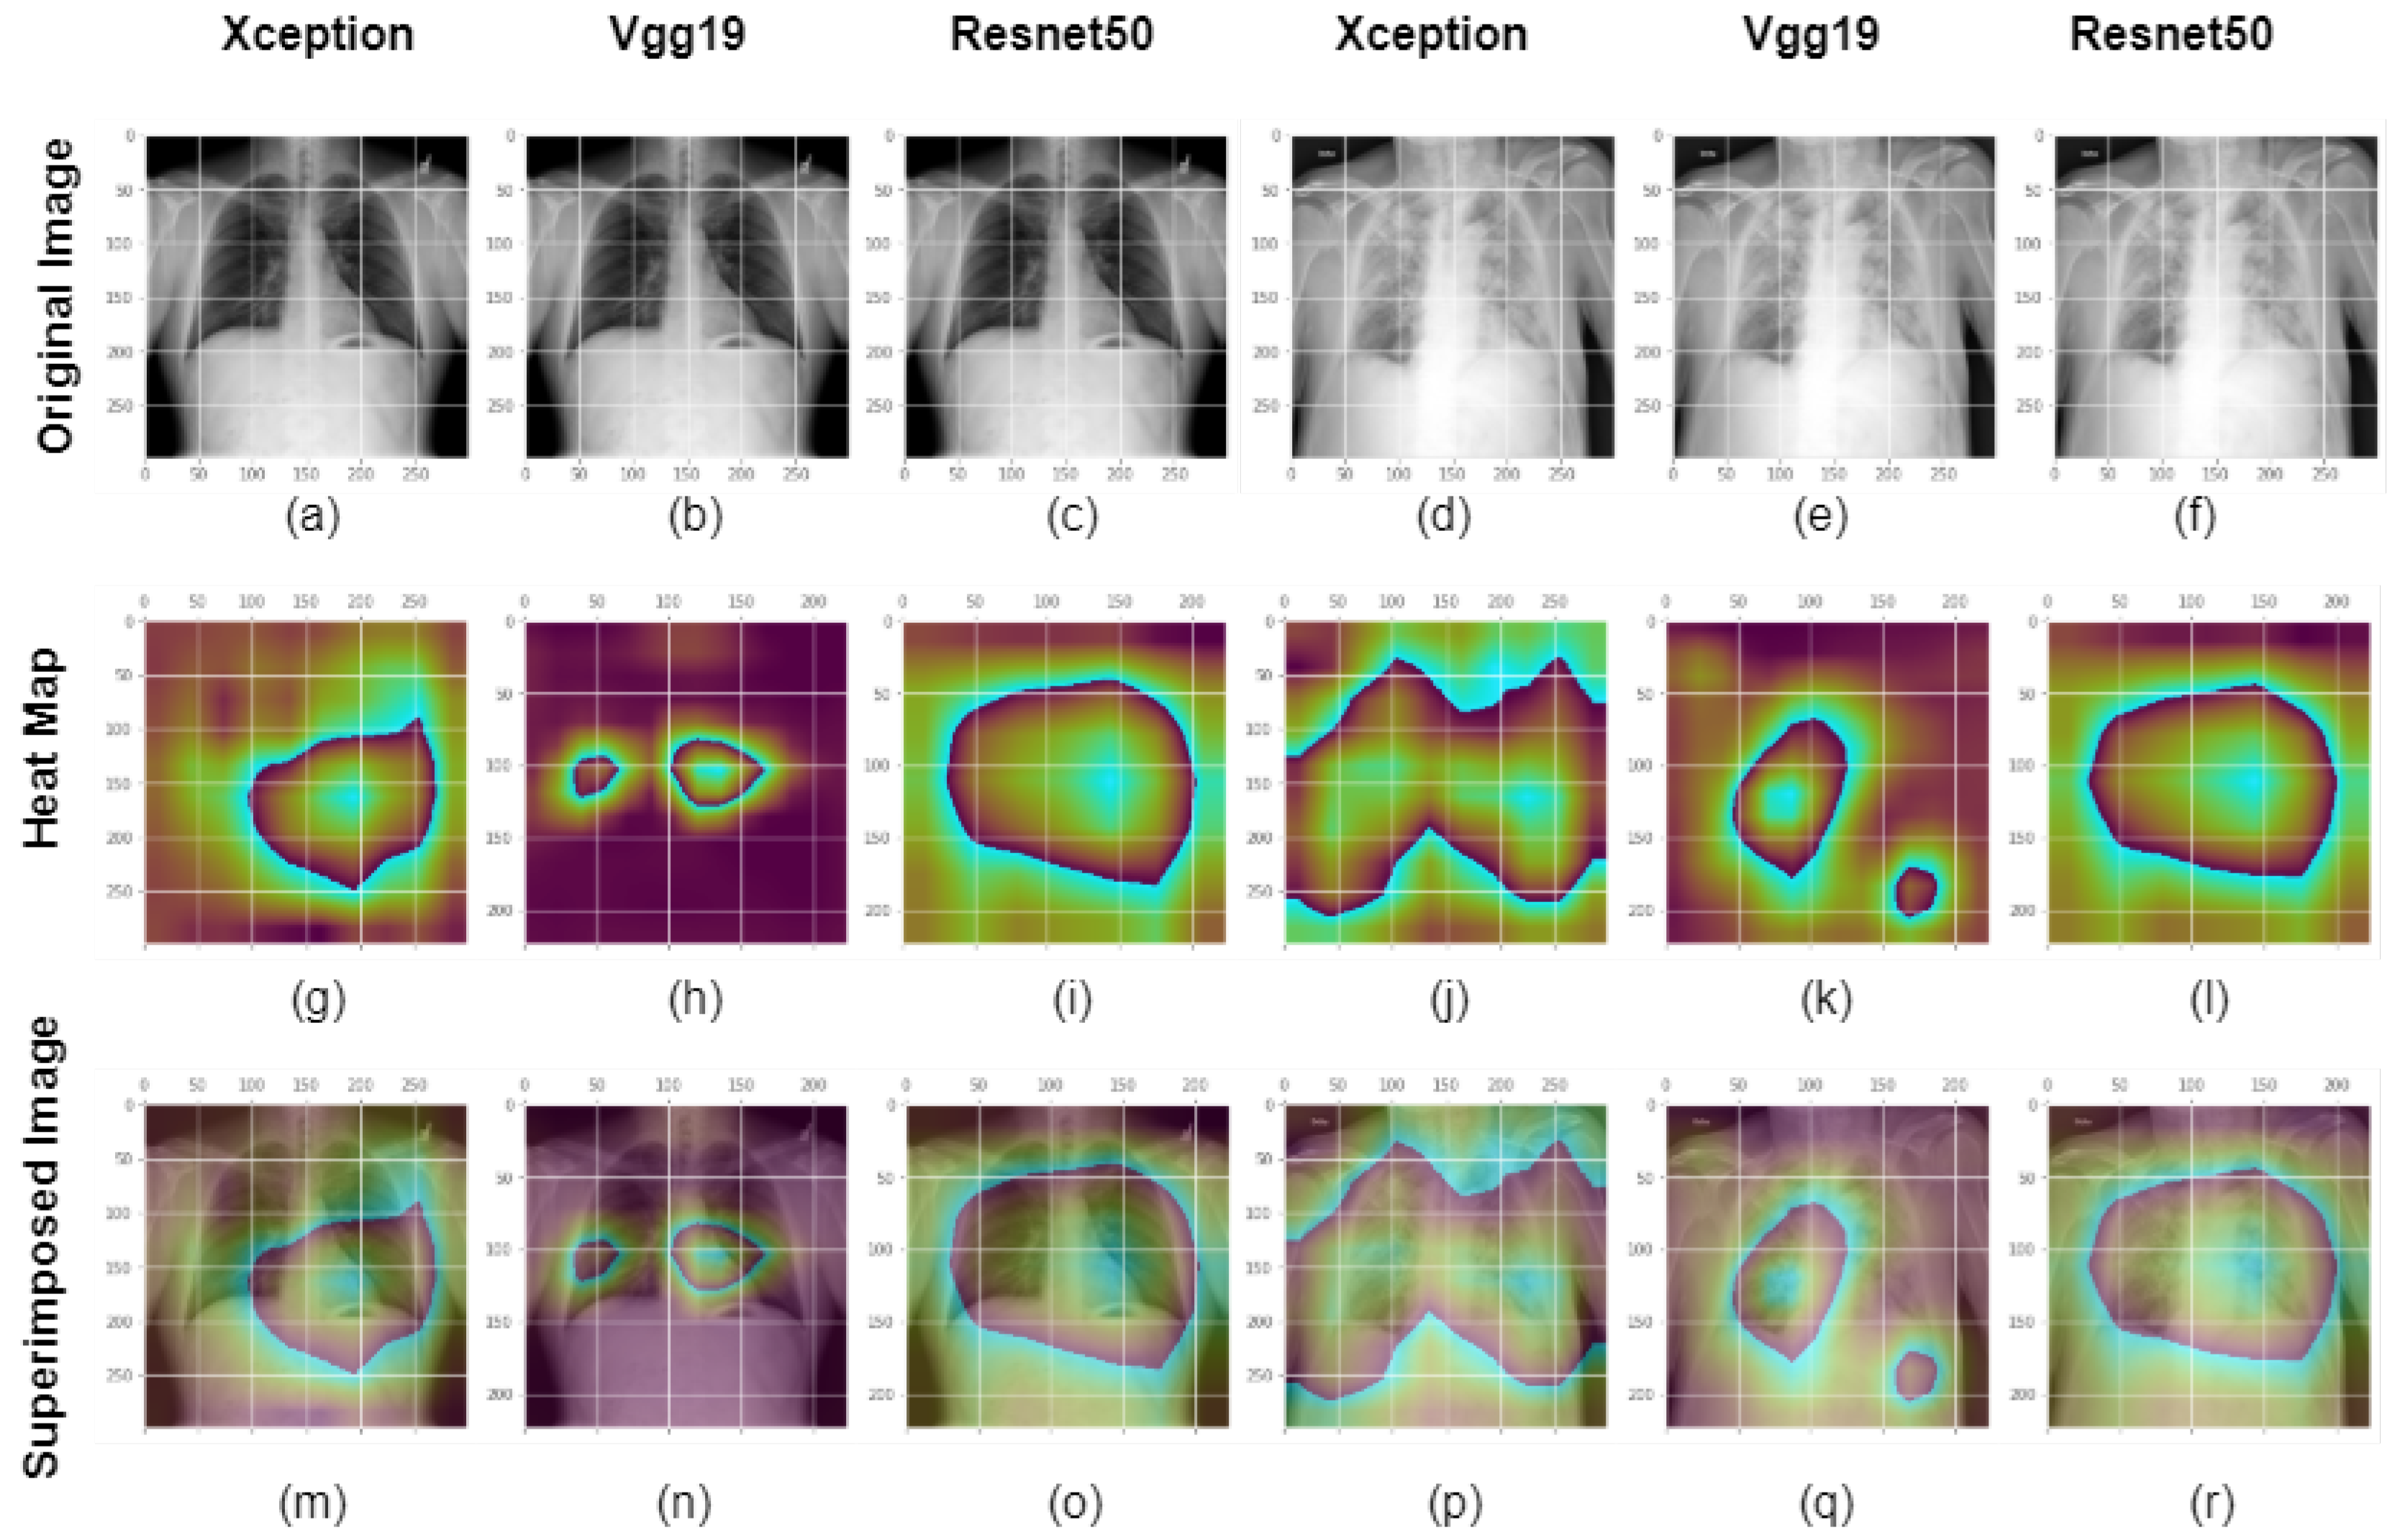
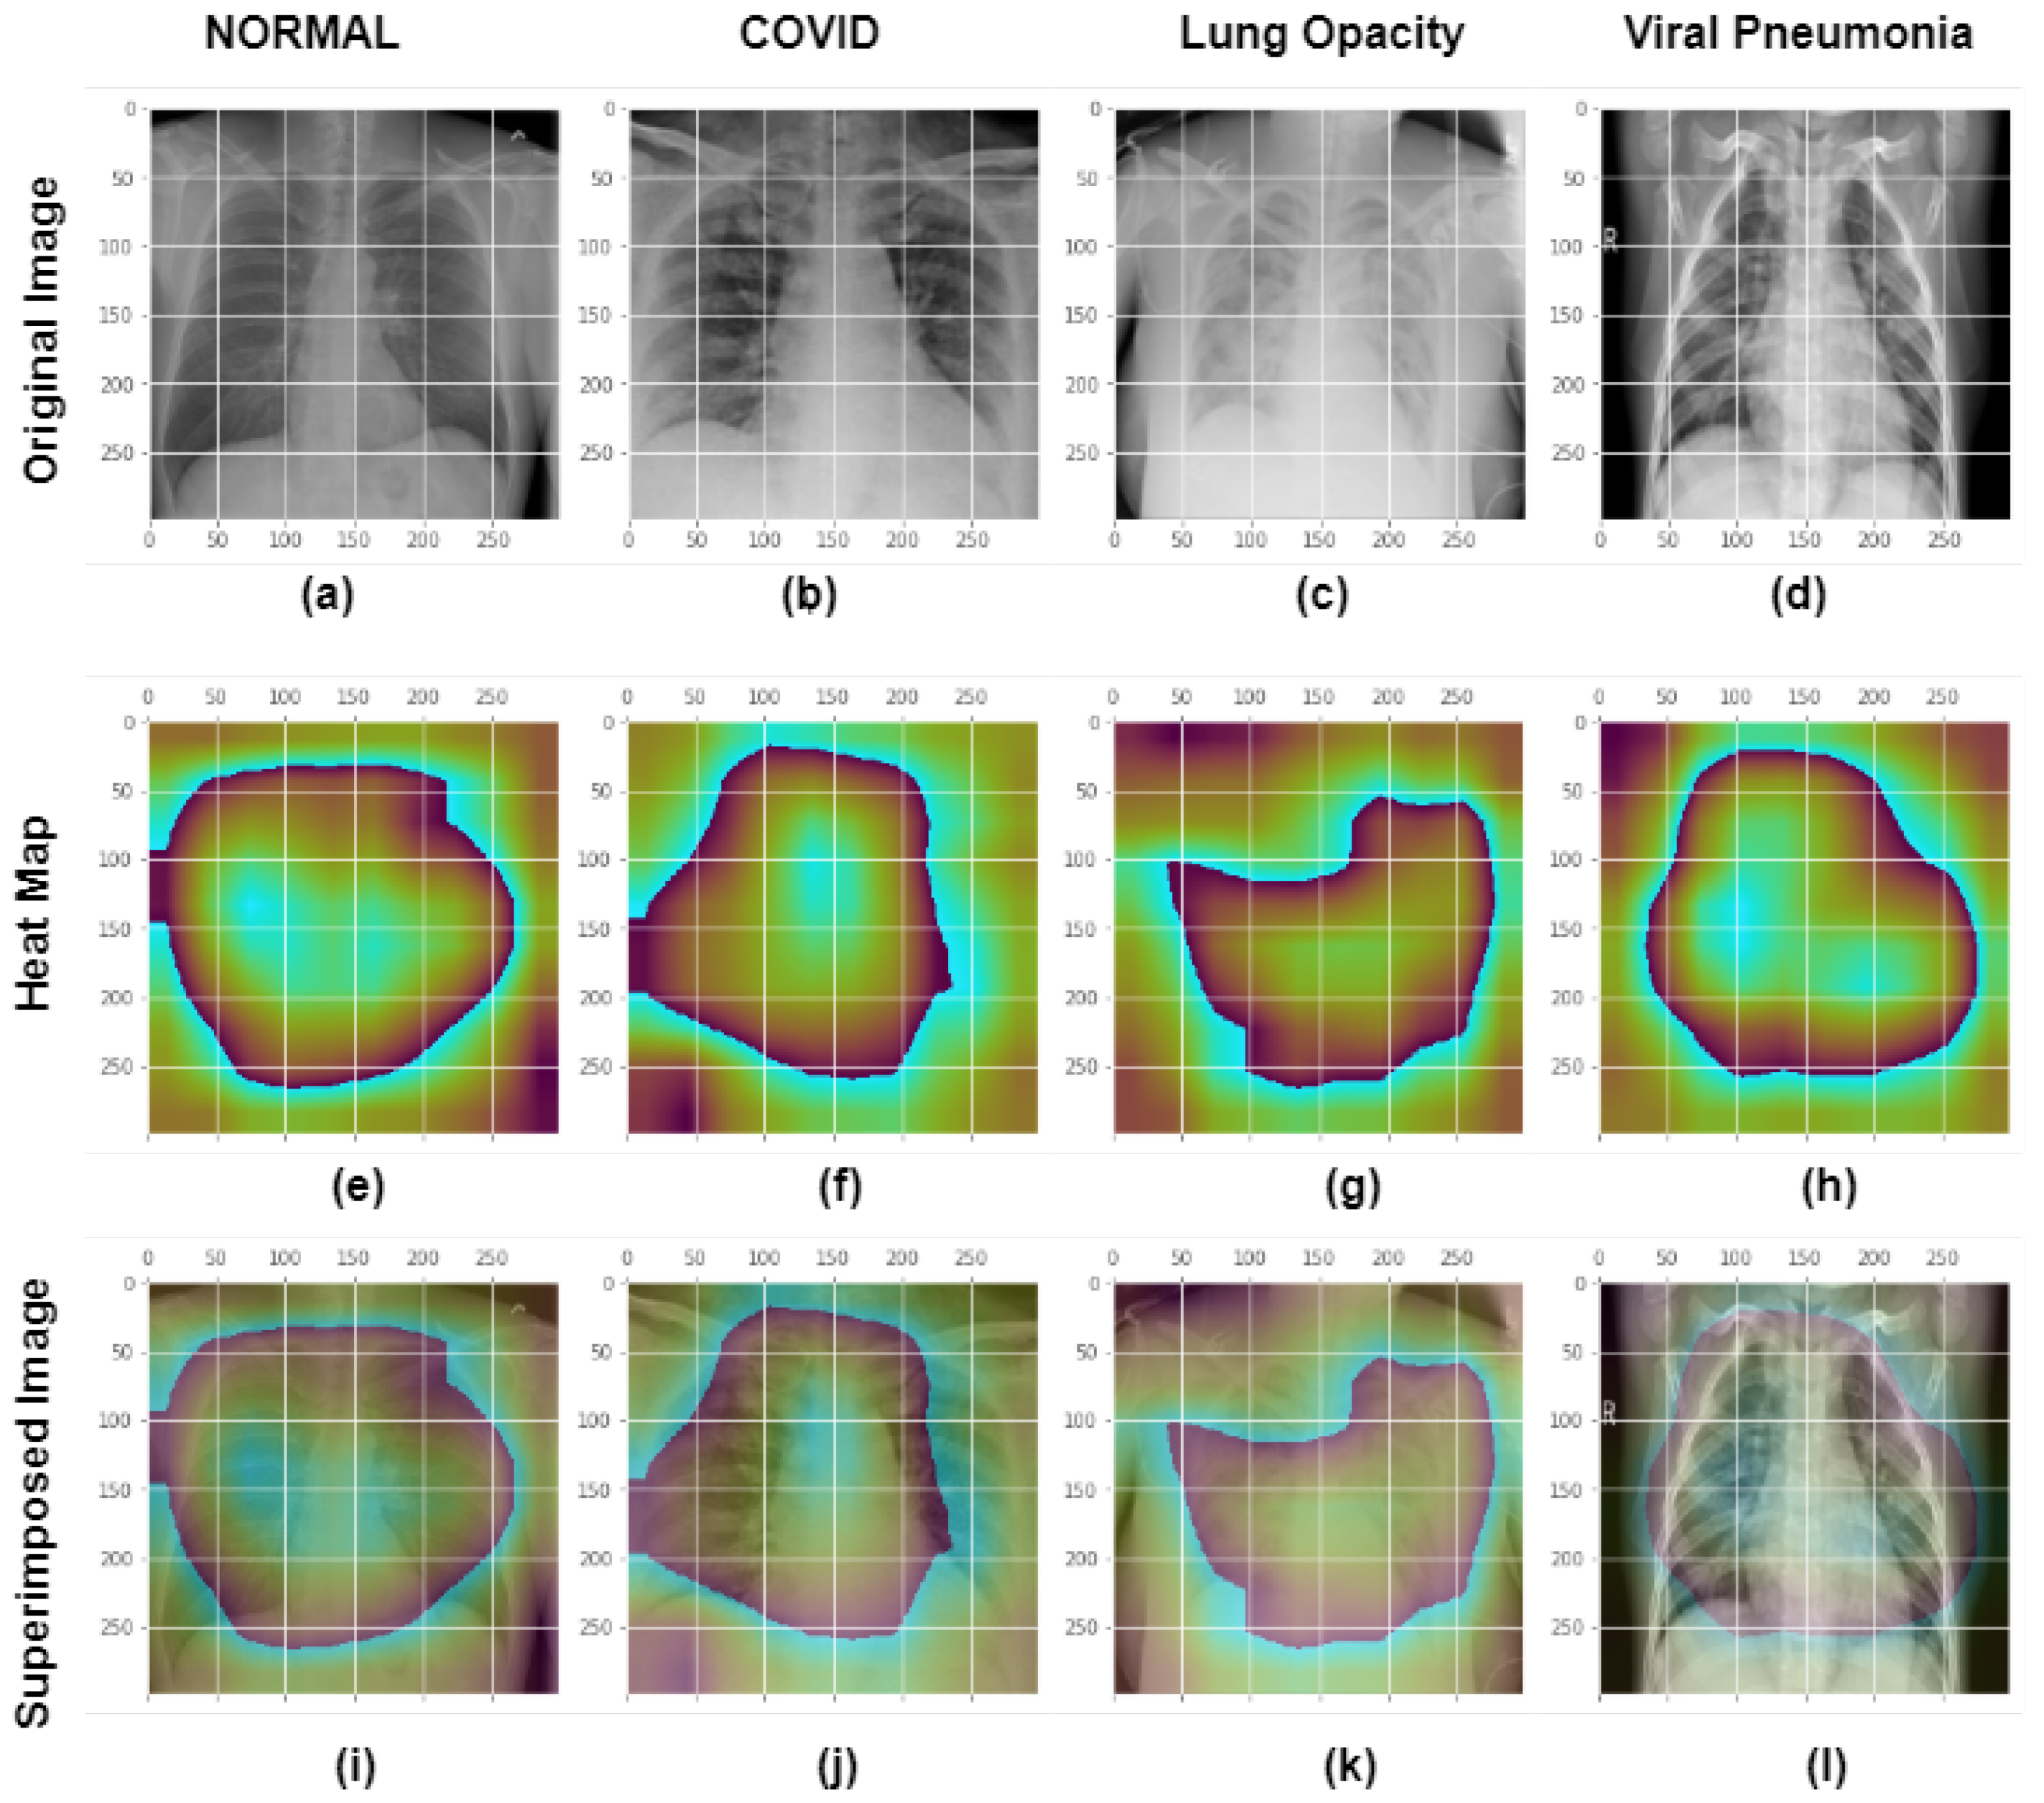
3.4. GradCam
3.5. The Experiments
3.5.1. Two Class Setup
3.5.2. Multi/Four class Setup
3.6. Evaluating Model Performances and Deep Layer Feature Investigation
- i = COVID and Normal for classification problem.
- TP = True Positive
- FN = False Negative.
- TN =True Negative
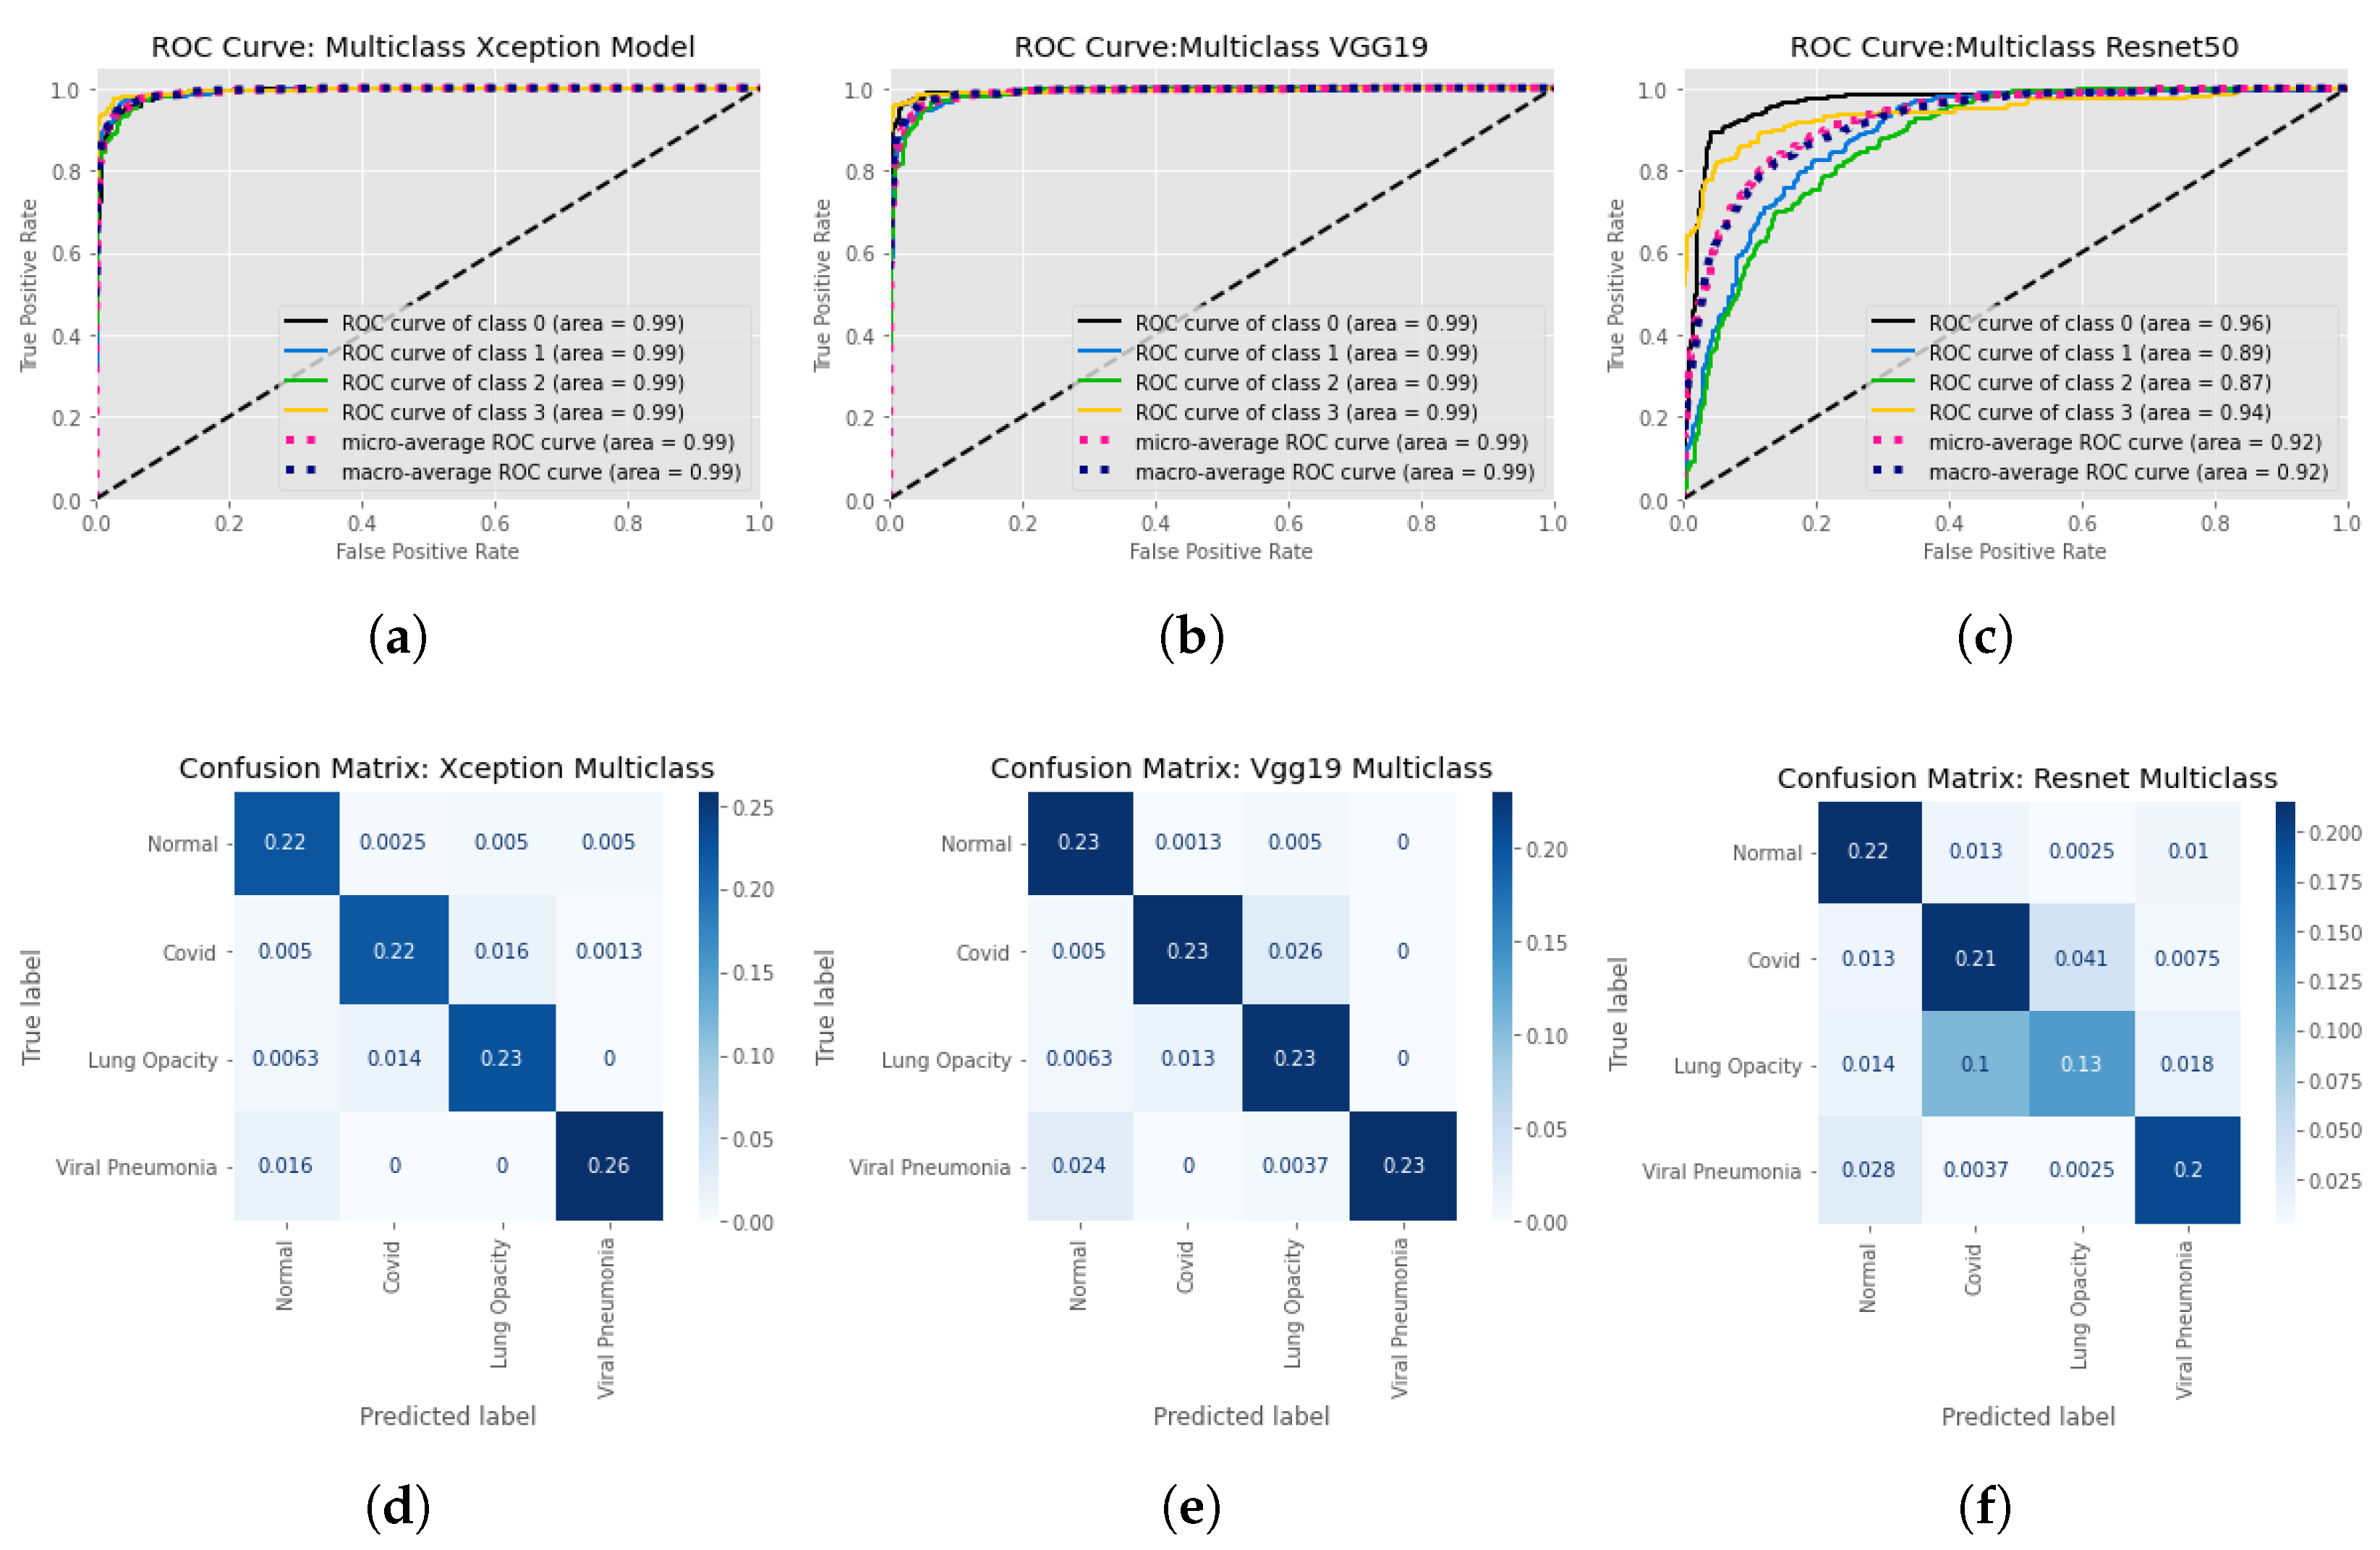
4. Result Analysis
4.1. Statistical Analysis
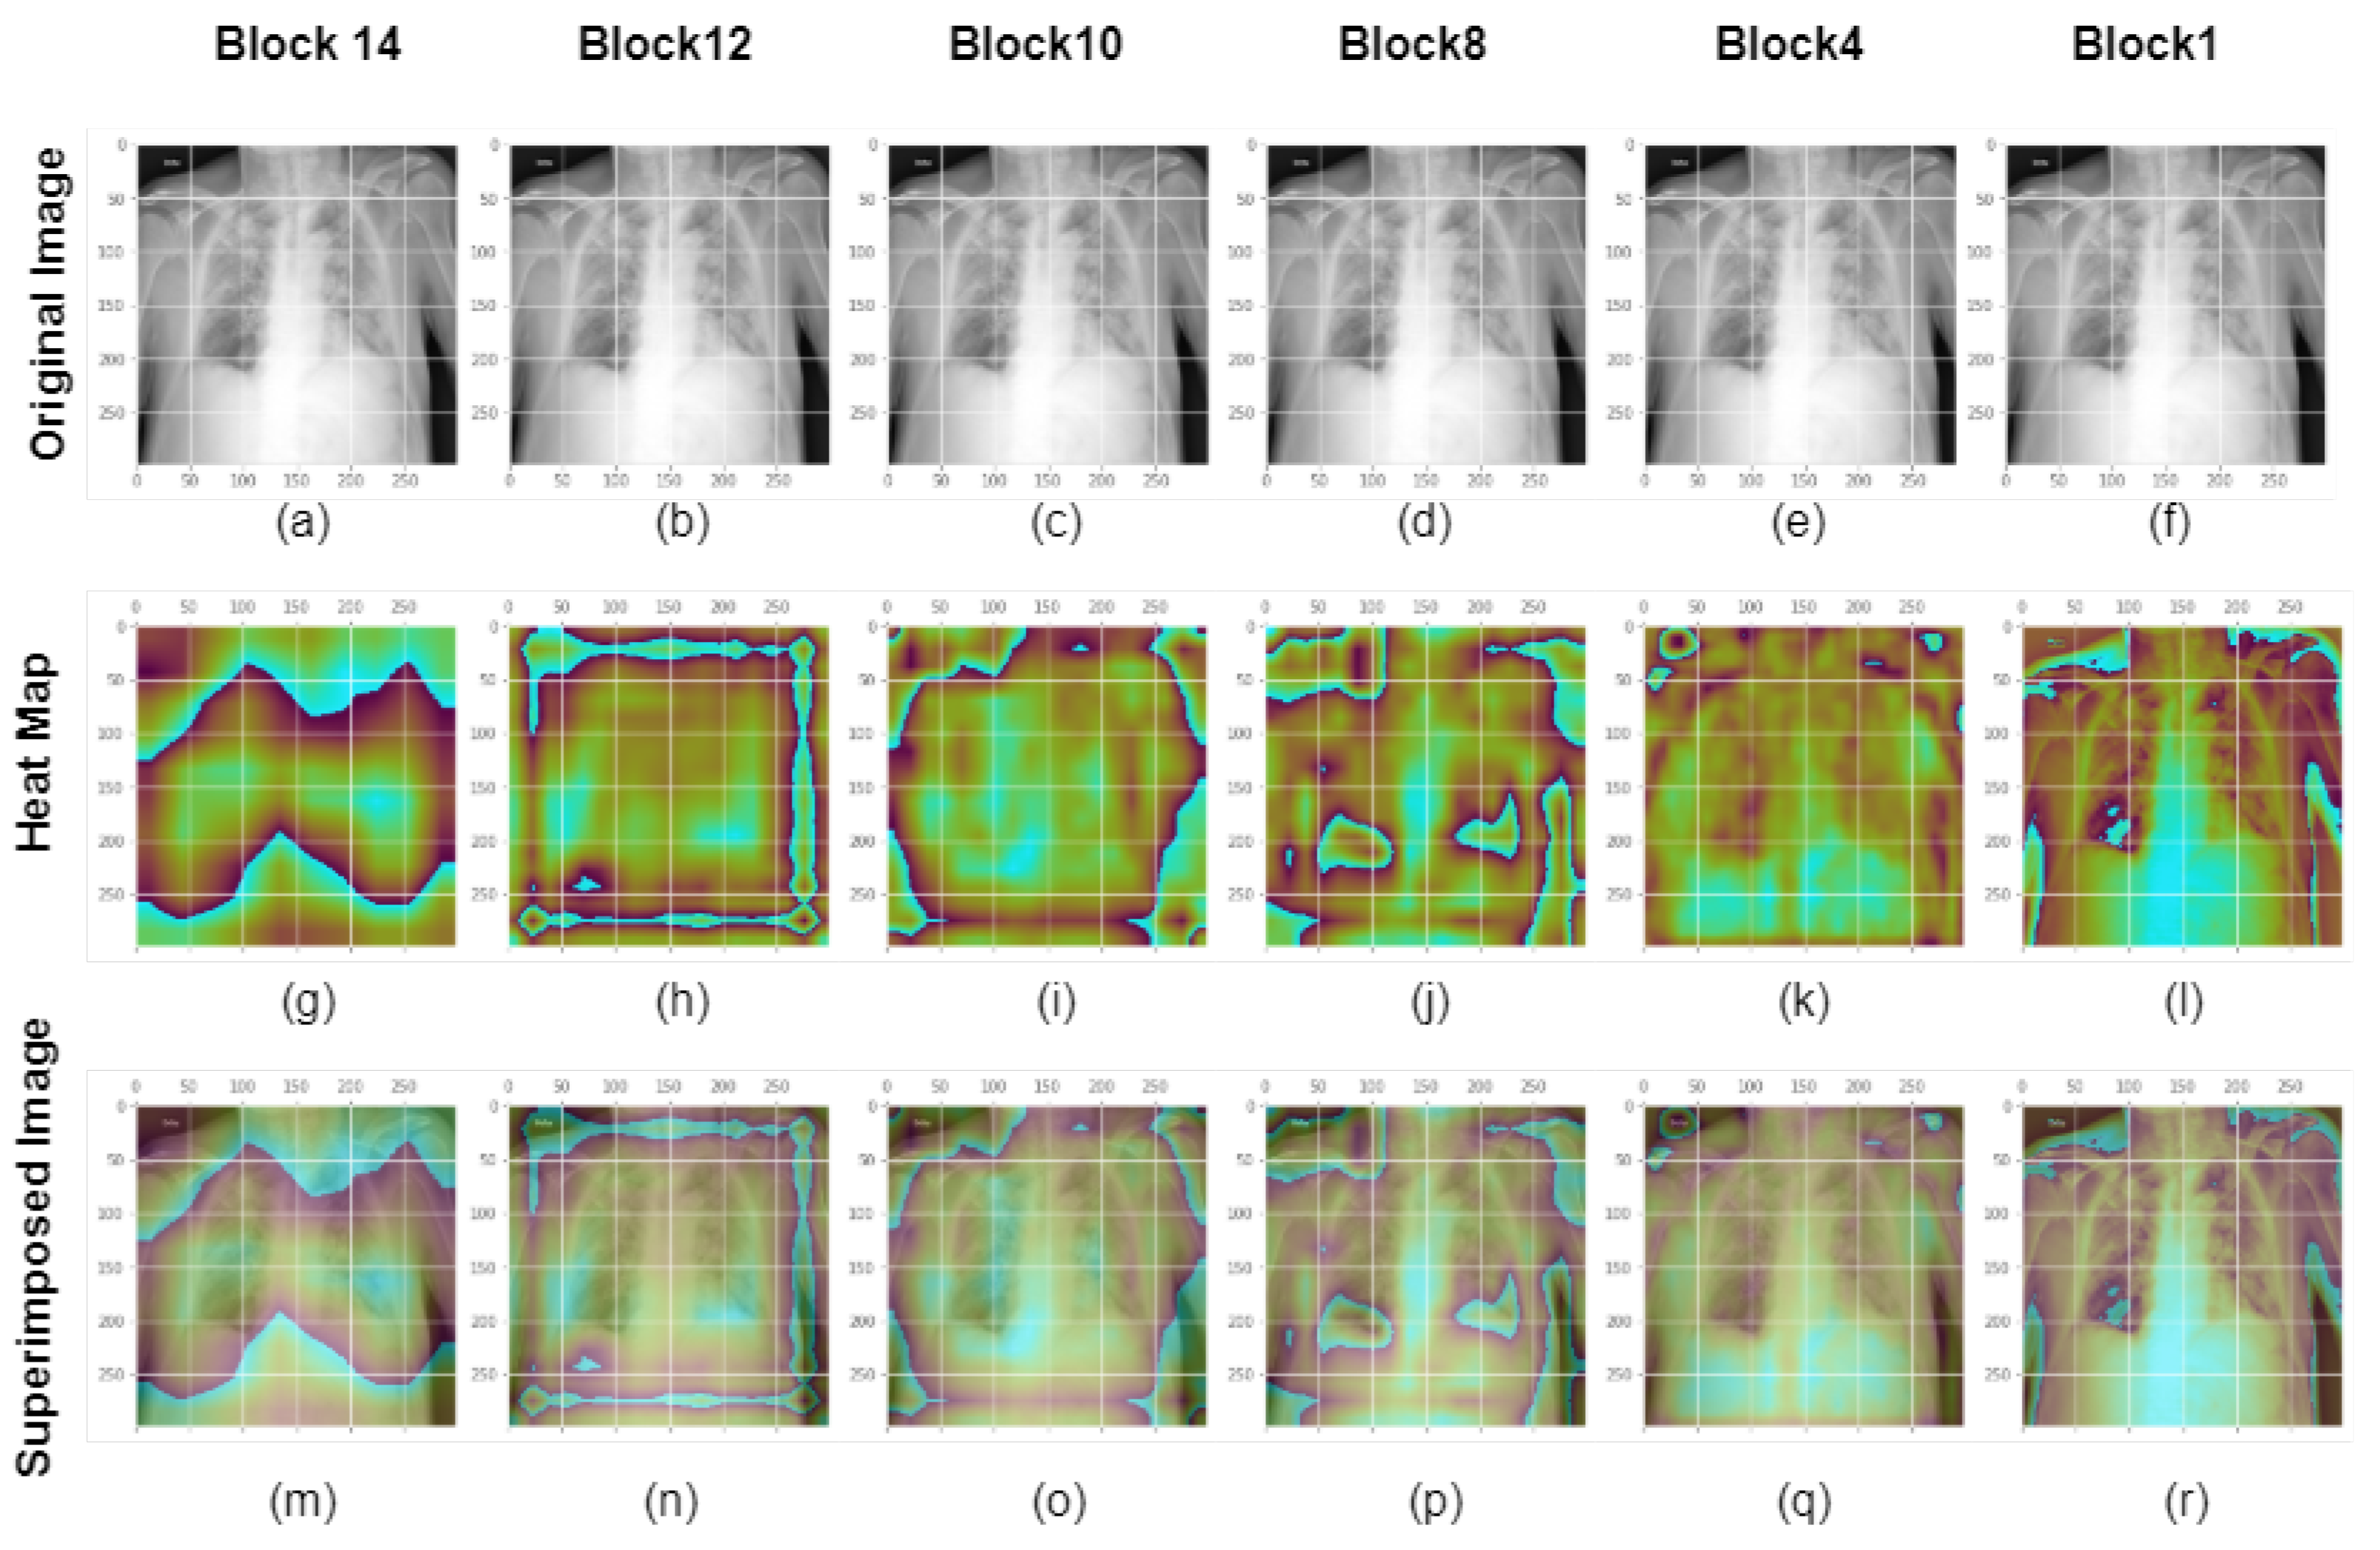
4.2. Model’S Explainability and Interpretability
4.3. Discussion
5. Conclusions
Author Contributions
Funding
Institutional Review Board Statement
Informed Consent Statement
Data Availability Statement
Conflicts of Interest
References
- WHO. World Health Organization. Coronavirus Disease (COVID-19) Pandemic. Available online: https://www.who.int/europe/emergencies/situations/covid-19 (accessed on 27 January 2023).
- WHO. Novel Coronavirus (2019-Ncov)—World Health Organization. Available online: https://www.who.int/docs/default-source/coronaviruse/situation-reports/20200121-sitrep-1-2019-ncov.pdf?sfvrsn (accessed on 30 January 2019).
- World Health Organization. Who Coronavirus (COVID-19) Dashboard. Available online: https://covid19.who.int/ (accessed on 27 January 2023).
- Cui, J.; Li, F.; Shi, Z.L. Origin and evolution of pathogenic coronaviruses. Nat. Rev. Microbiol. 2019, 17, 181–192. [Google Scholar] [CrossRef]
- Centers for Disease Control and Prevention. Coronavirus Disease 2019 (COVID-19). Available online: https://www.cdc.gov/coronavirus/2019-ncov/index.html (accessed on 27 January 2023).
- CDC. Centers for Disease Control and Prevention. COVID-19 Vaccines for Specific Groups of People. Centers for Disease Control and Prevention. Available online: https://www.cdc.gov/coronavirus/2019-ncov/vaccines/recommendations/specific-groups.html (accessed on 27 January 2023).
- WHO. World Health Organization. Tracking SARS-CoV-2 Variants. Available online: https://www.who.int/activities/tracking-SARS-CoV-2-variants (accessed on 27 January 2023).
- World Health Organization. Criteria for Releasing COVID-19 Patients from Isolation. Available online: https://www.who.int/publications/i/item/criteria-for-releasing-covid-19-patients-from-isolation (accessed on 27 January 2023).
- Wang, W.; Xu, Y.; Gao, R.; Lu, R.; Han, K.; Wu, G.; Tan, W. Detection of SARS-CoV-2 in Different Types of Clinical Specimens. JAMA-J. Am. Med. Assoc. 2020, 323, 1843–1844. [Google Scholar] [CrossRef] [PubMed]
- Administrator, J.H.C.H.S. Antigen and Molecular Tests for COVID-19. COVID-19 Testing Toolkit. Available online: https://www.centerforhealthsecurity.org/covid-19TestingToolkit/molecular-based-tests/current-molecular-and-antigen-tests.html (accessed on 9 January 2023).
- Sverzellati, N.; Ryerson, C.J.; Milanese, G.; Renzoni, E.A.; Volpi, A.; Spagnolo, P.; Bonella, F.; Comelli, I.; Affanni, P.; Veronesi, L.; et al. Chest X-ray or CT for COVID-19 pneumonia? Comparative study in a simulated triage setting. Eur. Respir. J. 2021, 2004188, 13993003-04188. [Google Scholar] [CrossRef]
- RSNA. Rural Areas Face Imaging Obstacles on the Road to Health Care Equity. Available online: https://www.rsna.org/news/2021/june/rural-radiology-equity (accessed on 27 January 2023).
- BC Emergency Medicine Network. How Long Is Too Long for Emergent CT Imaging in Rural Communities? Available online: https://www.bcemergencynetwork.ca/lounge/how-long-is-too-long-for-emergent-ct-imaging-in-rural-communities/ (accessed on 27 January 2023).
- Bai, H.X.; Hsieh, B.; Xiong, Z.; Halsey, K.; Choi, J.W.; Tran, T.M.L.; Pan, I.; Shi, L.B.; Wang, D.C.; Mei, J.; et al. Performance of Radiologists in Differentiating COVID-19 from Non-COVID-19 Viral Pneumonia at Chest CT. Radiology 2020, 296, E46–E54. [Google Scholar] [CrossRef]
- Doctors, Nurses ‘Can’t Take Much More’ Amid COVID-19 Surge in Southern California. Physicians News. Available online: https://physiciansnews.com/2020/12/31/doctors-nurses-cant-take-much-more-amid-covid-19-surge-in-southern-california/ (accessed on 27 January 2023).
- Harmon, K. COVID-Overwhelmed Hospitals Strain Staff and Hope to Avoid Rationing Care. Sci. Am. 2021, 27. [Google Scholar]
- Soda, P.; D’Amico, N.C.; Tessadori, J.; Valbusa, G.; Guarrasi, V.; Bortolotto, C.; Akbar, M.U.; Sicilia, R.; Cordelli, E.; Fazzini, D.; et al. AIforCOVID: Predicting the clinical outcomes in patients with COVID-19 applying AI to chest-X-rays. An Italian multicentre study. Med. Image Anal. 2021. [Google Scholar] [CrossRef]
- Santa Cruz, B.G.; Bossa, M.N.; Soelter, J.; Husch, A.D. Public COVID-19 X-ray datasets and their impact on model bias-a systematic review of a significant problem. medRxiv 2021. [Google Scholar] [CrossRef]
- Liu, J.; Dong, B.; Wang, S.; Cui, H.; Fan, D.P.; Ma, J.; Chen, G. COVID-19 lung infection segmentation with a novel two-stage cross-domain transfer learning framework. Med Image Anal. 2021, 74, 102205. [Google Scholar] [CrossRef]
- Wang, L.; Lin, Z.Q.; Wong, A. COVID-Net: A tailored deep convolutional neural network design for detection of COVID-19 cases from chest X-ray images. Sci. Rep. 2020, 10, 1–12. [Google Scholar] [CrossRef]
- Khan, A.I.; Shah, J.L.; Bhat, M.M. CoroNet: A deep neural network for detection and diagnosis of COVID-19 from chest X-ray images. Comput. Methods Programs Biomed. 2020, 196, 105581. [Google Scholar] [CrossRef]
- Oh, Y.; Park, S.; Ye, J.C. Deep Learning COVID-19 Features on CXR Using Limited Training Data Sets. IEEE Trans. Med. Imaging 2020, 39, 2688–2700. [Google Scholar] [CrossRef] [PubMed]
- Ozturk, T.; Talo, M.; Yildirim, E.A.; Baloglu, U.B.; Yildirim, O.; Rajendra Acharya, U. Automated detection of COVID-19 cases using deep neural networks with X-ray images. Comput. Biol. Med. 2020, 121, 103792. [Google Scholar] [CrossRef] [PubMed]
- Altan, A.; Karasu, S. Recognition of COVID-19 disease from X-ray images by hybrid model consisting of 2D curvelet transform, chaotic salp swarm algorithm and deep learning technique. Chaos Solitons Fractals 2020, 140, 110071. [Google Scholar] [CrossRef]
- Civit-Masot, J.; Luna-Perejón, F.; Morales, M.D.; Civit, A. Deep learning system for COVID-19 diagnosis aid using X-ray pulmonary images. Appl. Sci. 2020, 10, 4640. [Google Scholar] [CrossRef]
- Narin, A.; Kaya, C.; Pamuk, Z. Automatic detection of coronavirus disease (COVID-19) using X-ray images and deep convolutional neural networks. Pattern Anal. Appl. 2021, 24, 1207–1220. [Google Scholar] [CrossRef]
- Waheed, A.; Goyal, M.; Gupta, D.; Khanna, A.; Al-Turjman, F.; Pinheiro, P.R. CovidGAN: Data Augmentation Using Auxiliary Classifier GAN for Improved COVID-19 Detection. IEEE Access 2020, 8, 91916–91923. [Google Scholar] [CrossRef]
- Loey, M.; Smarandache, F.; Khalifa, N.E.M. Within the lack of chest COVID-19 X-ray dataset: A novel detection model based on GAN and deep transfer learning. Symmetry 2020, 12, 651. [Google Scholar] [CrossRef]
- Arias-Londono, J.D.; Gomez-Garcia, J.A.; Moro-Velazquez, L.; Godino-Llorente, J.I. Artificial Intelligence applied to chest X-Ray images for the automatic detection of COVID-19. A thoughtful evaluation approach. IEEE Access 2020, 8, 226811–226827. [Google Scholar] [CrossRef] [PubMed]
- Hemdan, E.E.D.; Shouman, M.A.; Karar, M.E. COVIDX-Net: A Framework of Deep Learning Classifiers to Diagnose COVID-19 in X-Ray Images. arXiv 2020, arXiv:2003.11055. [Google Scholar]
- Zhang, J.; Xie, Y.; Pang, G.; Liao, Z.; Verjans, J.; Li, W.; Sun, Z.; He, J.; Li, Y.; Shen, C.; et al. Viral Pneumonia Screening on Chest X-Rays Using Confidence-Aware Anomaly Detection. IEEE Trans. Med. Imaging 2021, 40, 879–890. [Google Scholar] [CrossRef]
- El Asnaoui, K.; Chawki, Y. Using X-ray images and deep learning for automated detection of coronavirus disease. J. Biomol. Struct. Dyn. 2020, 39, 1–12. [Google Scholar] [CrossRef] [PubMed]
- Rahman, T. COVID-19 Radiography Database. Kaggle. Available online: https://www.kaggle.com/datasets/tawsifurrahman/covid19-radiography-database (accessed on 27 January 2023).
- Chowdhury, M.E.; Rahman, T.; Khandakar, A.; Mazhar, R.; Kadir, M.A.; Mahbub, Z.B.; Islam, K.R.; Khan, M.S.; Iqbal, A.; Emadi, N.A.; et al. Can AI Help in Screening Viral and COVID-19 Pneumonia? IEEE Access 2020, 8, 132665–132676. [Google Scholar] [CrossRef]
- Medical Imaging Databank of the Valencia region BIMCV. BIMCV. Available online: https://bimcv.cipf.es/bimcv-projects/bimcv-covid19 (accessed on 27 January 2023).
- Liob. Anonymized dataset of COVID-19 cases with a focus on radiological imaging. this includes images (x-ray/CT) with extensive metadata, such as admission-, ICU-, laboratory-, and patient master-data. GitHub. Available online: https://github.com/ml-workgroup/covid-19-image-repository (accessed on 27 January 2023).
- Haghanifar, A.; Majdabadi, M.M.; Choi, Y.; Deivalakshmi, S.; Ko, S. COVID-cxnet: Detecting COVID-19 in frontal chest X-ray images using deep learning. Multimed. Tools Appl. 2020, 81, 30615–30645. [Google Scholar] [CrossRef]
- RSNA Pneumonia Detection Challenge. Kaggle. Available online: https://www.kaggle.com/c/rsna-pneumonia-detection-challenge (accessed on 27 January 2023).
- Mooney, P. Chest X-ray images (pneumonia). Kaggle. Available online: https://www.kaggle.com/datasets/paultimothymooney/chest-xray-pneumonia (accessed on 27 January 2023).
- Haghanifar, A.; Majdabadi, M.M.; Choi, Y.; Deivalakshmi, S.; Ko, S. COVID-CXNet: Detecting COVID-19 in Frontal Chest X-ray Images using Deep Learning. arXiv 2020, arXiv:2006.13807. [Google Scholar] [CrossRef]
- Redazione. COVID-19 Database. SIRM. Available online: https://sirm.org/category/covid-19/ (accessed on 27 January 2023).
- Cohen, J.P.; Morrison, P.; Dao, L. COVID-19 Image Data Collection. arXiv 2020, arXiv:2003.11597. [Google Scholar]
- Goodman, L.R. Felson’s Principles of Chest Roentgenology, a Programmed Text; Elsevier Health Sciences: Amsterdam, The Netherlands, 2014. [Google Scholar]
- Simonyan, K.; Zisserman, A. Very deep convolutional networks for large-scale image recognition. arXiv 2014, arXiv:1409.1556. [Google Scholar]
- He, K.; Zhang, X.; Ren, S.; Sun, J. Deep residual learning for image recognition. Proc. IEEE Comput. Soc. Conf. Comput. Vis. Pattern Recognit. 2016, 2016, 770–778. [Google Scholar] [CrossRef]
- Deng, J.; Dong, W.; Socher, R.; Li, L.J.; Li, K.; Fei-Fei, L. Imagenet: A large-scale hierarchical image database. In Proceedings of the 2009 IEEE Conference on Computer Vision and Pattern Recognition, Miami, FL, USA, 20–25 June 2009; pp. 248–255. [Google Scholar] [CrossRef]
- Chollet, F. Xception: Deep learning with depthwise separable convolutions. In Proceedings of the IEEE Conference on Computer Vision and Pattern Recognition, Honolulu, HI, USA, 21–26 July 2017; pp. 1800–1807. [Google Scholar] [CrossRef]
- van Rijsbergen, C.J. An algorithm for information structuring and retrieval. Comput. J. 1971, 14, 407–412. [Google Scholar] [CrossRef]
- Selvaraju, R.R.; Cogswell, M.; Das, A.; Vedantam, R.; Parikh, D.; Batra, D. Grad-CAM: Visual Explanations from Deep Networks via Gradient-Based Localization. Int. J. Comput. Vis. 2020, 128, 336–359. [Google Scholar] [CrossRef]


| Reference Number | Number of Images | Architecture | Performance Matrix | Explainable | ||
|---|---|---|---|---|---|---|
| COVID-19 | Normal | Others | ||||
| Loey et al. [28] | 69 | 79 | 158 | AlexNet, Google Net, Resnet18 | Acc = 99% | NO |
| Civit-Masot et al. [25] | 132 | 132 | 132 | VGG16 | avF1 = 0.85 | NO |
| Altan et al. [24] | 219 | 1341 | 1345 | EfficientNetB | Acc = 99% | NO |
| Hemdan et al. [30] | 25 | 50 | - | VGG19, DenseNet | AvF1 = 0.90 | NO |
| Narin et al. [26] | 50 | 50 | - | Inception v3, InceptionResNetv2, Resnet50 | Acc = 98% | NO |
| Arias-Londono et al. [29] | 7716 | 45,022 | 21,707 | CovidNet | Acc = 91.53% | YES |
| Oh et al. [22] | 180 | 191 | 131 | Resnet18 | Acc = 89% | YES |
| Khan et al. [21] | 310 | 284 | 657 | CoroNet | Acc = 89.5% | NO |
| Ozturk et al. [23] | 127 | 500 | 600 | DarkNet | Acc = 87% | NO |
| Zhang et al. [31] | 100 | 1431 | - | EficientNet | se = 96%, sp = 70% | NO |
| Asnaoui et al. [32] | 48 | 11,203 | 1591 | Inception Resnetv2 | Acc = 92.2% | NO |
| Input Image Size | Models | Accuracy | Class | Precision (PPV) | Recall (Sensitivity) | F1 Score | AUC | Explainable AI |
|---|---|---|---|---|---|---|---|---|
| 299 × 299 | Xception | 0.97 | Normal | 0.981 | 0.962 | 0.971 | 0.99 | Y |
| COVID | 0.959 | 0.979 | 0.969 | 0.99 | ||||
| 224 × 224 | VGG19 | 0.97 | Normal | 0.962 | 0.973 | 0.967 | 0.99 | Y |
| COVID | 0.977 | 0.968 | 0.972 | 0.99 | ||||
| 224 × 224 | Resnet50 | 0.925 | Normal | 0.958 | 0.892 | 0.923 | 0.97 | Y |
| COVID | 0.896 | 0.959 | 0.926 | 0.97 | ||||
| 512 × 512 | Xception | 0.975 | Normal | 0.995 | 0.953 | 0.973 | 1 | Y |
| COVID | 0.958 | 0.995 | 0.976 | 0.99 | ||||
| VGG19 | 0.975 | Normal | 0.961 | 0.99 | 0.975 | 0.99 | Y | |
| COVID | 0.99 | 0.961 | 0.975 | 0.99 | ||||
| Resnet50 | 0.933 | Normal | 0.983 | 0.881 | 0.93 | 0.98 | Y | |
| COVID | 0.89 | 0.985 | 0.935 | 0.98 |
| Input Image Size | Models | Accuracy | Class | Precision (PPV) | Recall (Sensitivity) | F1 Score | AUC | Explainable AI |
|---|---|---|---|---|---|---|---|---|
| 299 × 299 | Xception | 0.93 | Normal | 0.89 | 0.95 | 0.92 | 0.99 | Y |
| COVID | 0.93 | 0.91 | 0.92 | 0.99 | ||||
| Lung Opacity | 0.91 | 0.92 | 0.92 | 0.99 | ||||
| non-COVID viral pneumonia | 0.98 | 0.94 | 0.96 | 0.99 | ||||
| 224 × 224 | VGG19 | 0.92 | Normal | 0.87 | 0.97 | 0.92 | 0.99 | Y |
| COVID | 0.94 | 0.88 | 0.91 | 0.99 | ||||
| Lung Opacity | 0.87 | 0.92 | 0.89 | 0.99 | ||||
| non-COVID viral pneumonia | 1 | 0.89 | 0.94 | 0.99 | ||||
| 224 × 224 | Resnet50 | 0.75 | Normal | 0.8 | 0.9 | 0.85 | 0.96 | Y |
| COVID | 0.65 | 0.78 | 0.7 | 0.89 | ||||
| Lung Opacity | 0.73 | 0.49 | 0.59 | 0.87 | ||||
| non-COVID viral pneumonia | 0.85 | 0.85 | 0.85 | 0.94 |
Disclaimer/Publisher’s Note: The statements, opinions and data contained in all publications are solely those of the individual author(s) and contributor(s) and not of MDPI and/or the editor(s). MDPI and/or the editor(s) disclaim responsibility for any injury to people or property resulting from any ideas, methods, instructions or products referred to in the content. |
© 2023 by the authors. Licensee MDPI, Basel, Switzerland. This article is an open access article distributed under the terms and conditions of the Creative Commons Attribution (CC BY) license (https://creativecommons.org/licenses/by/4.0/).
Share and Cite
Islam, M.N.; Alam, M.G.R.; Apon, T.S.; Uddin, M.Z.; Allheeib, N.; Menshawi, A.; Hassan, M.M. Interpretable Differential Diagnosis of Non-COVID Viral Pneumonia, Lung Opacity and COVID-19 Using Tuned Transfer Learning and Explainable AI. Healthcare 2023, 11, 410. https://doi.org/10.3390/healthcare11030410
Islam MN, Alam MGR, Apon TS, Uddin MZ, Allheeib N, Menshawi A, Hassan MM. Interpretable Differential Diagnosis of Non-COVID Viral Pneumonia, Lung Opacity and COVID-19 Using Tuned Transfer Learning and Explainable AI. Healthcare. 2023; 11(3):410. https://doi.org/10.3390/healthcare11030410
Chicago/Turabian StyleIslam, Md. Nazmul, Md. Golam Rabiul Alam, Tasnim Sakib Apon, Md. Zia Uddin, Nasser Allheeib, Alaa Menshawi, and Mohammad Mehedi Hassan. 2023. "Interpretable Differential Diagnosis of Non-COVID Viral Pneumonia, Lung Opacity and COVID-19 Using Tuned Transfer Learning and Explainable AI" Healthcare 11, no. 3: 410. https://doi.org/10.3390/healthcare11030410
APA StyleIslam, M. N., Alam, M. G. R., Apon, T. S., Uddin, M. Z., Allheeib, N., Menshawi, A., & Hassan, M. M. (2023). Interpretable Differential Diagnosis of Non-COVID Viral Pneumonia, Lung Opacity and COVID-19 Using Tuned Transfer Learning and Explainable AI. Healthcare, 11(3), 410. https://doi.org/10.3390/healthcare11030410