

Validating the German Short Basic Psychological Need Satisfaction and Frustration Scale in Individuals with Depression

 ,
,
Abstract
1. Introduction
2. Materials and Methods
2.1. Participants and Procedure
2.2. Measures
2.3. Analytical Strategy
3. Results
3.1. Descriptive Statistics and Correlations
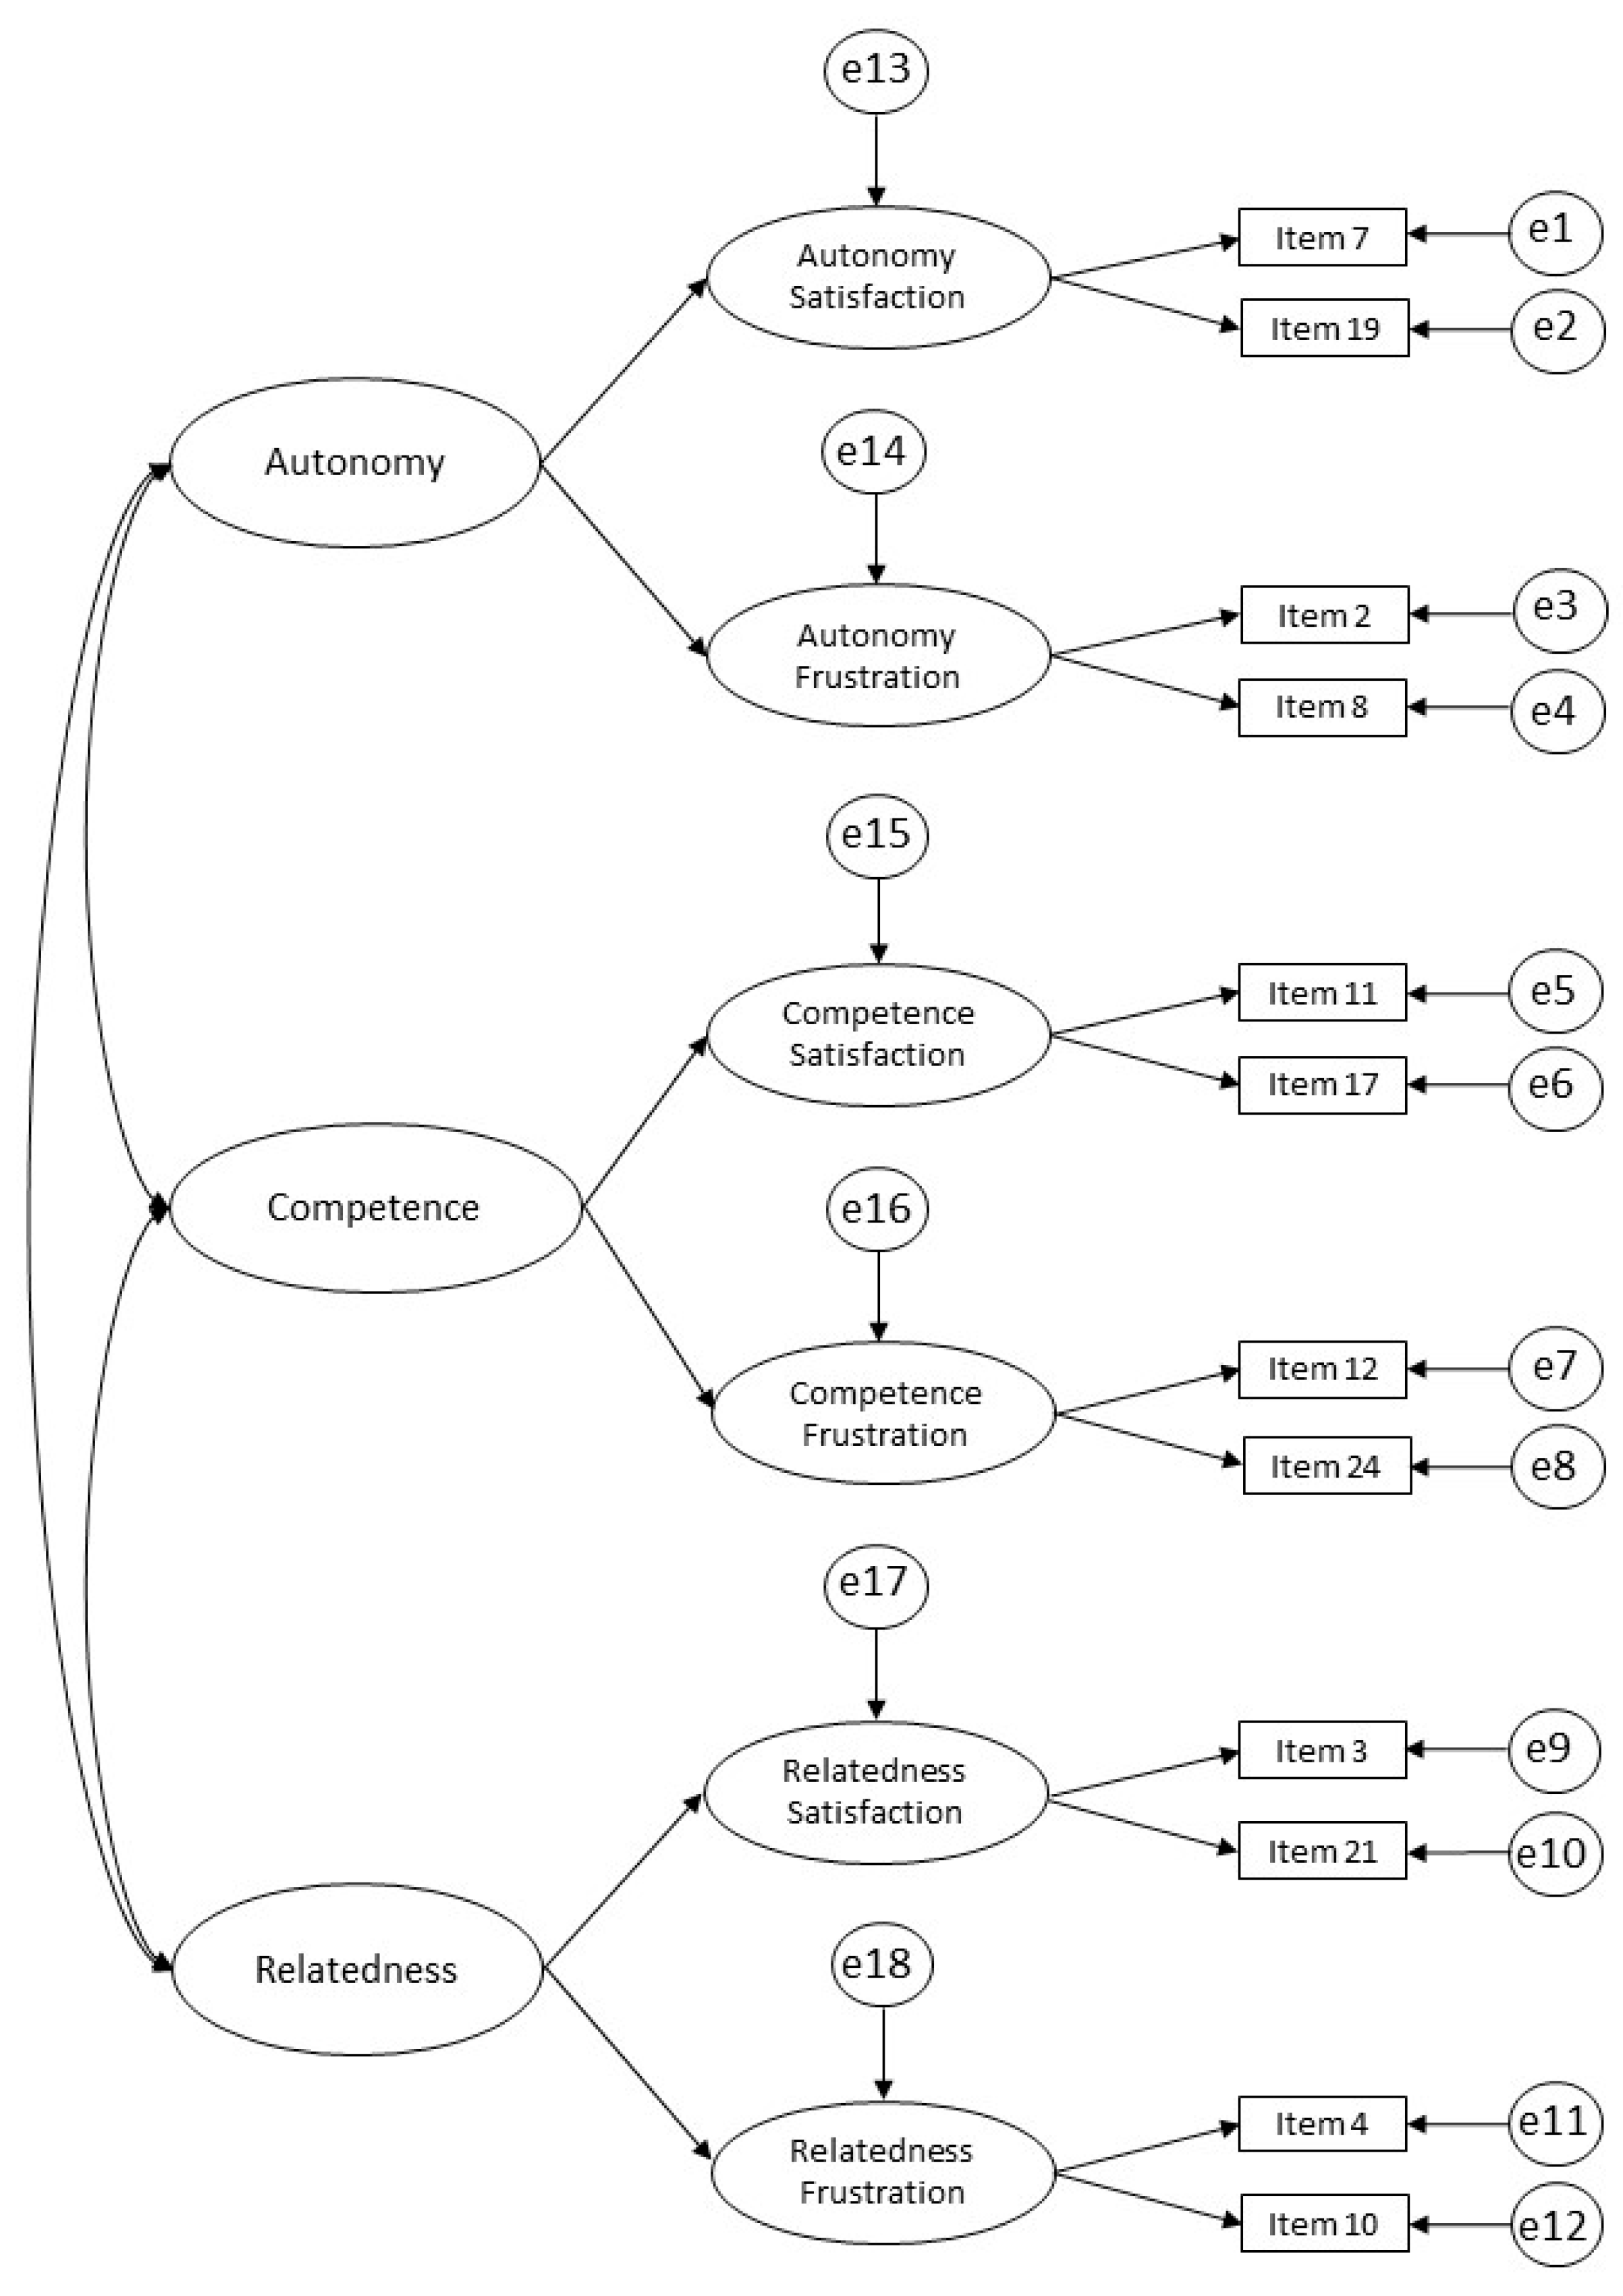
3.2. Confirmatory Factor Analyses
3.3. Reliability, Convergent, and Discriminant Validity
3.4. Measurement Invariance across Patients with Different Severities of Depression
3.5. Predictive Validity
4. Discussion
Limitations
5. Conclusions
Author Contributions
Funding
Institutional Review Board Statement
Informed Consent Statement
Data Availability Statement
Acknowledgments
Conflicts of Interest
Appendix A. Supplementary Text
Appendix A.1. Additional Information of Patient Characteristics at Baseline
Education Level and Income
Appendix A.2. Additional Information on Hypothetical Models
Appendix A.3. Additional Information on Measures
Appendix A.4. Additional Information on Analytical Strategy
Appendix A.4.1. Measurement Invariance
Appendix A.4.2. Predictive Validity
Appendix B. Supplementary Figures


Appendix C. Supplementary Tables

| n | No. (%) | |
|---|---|---|
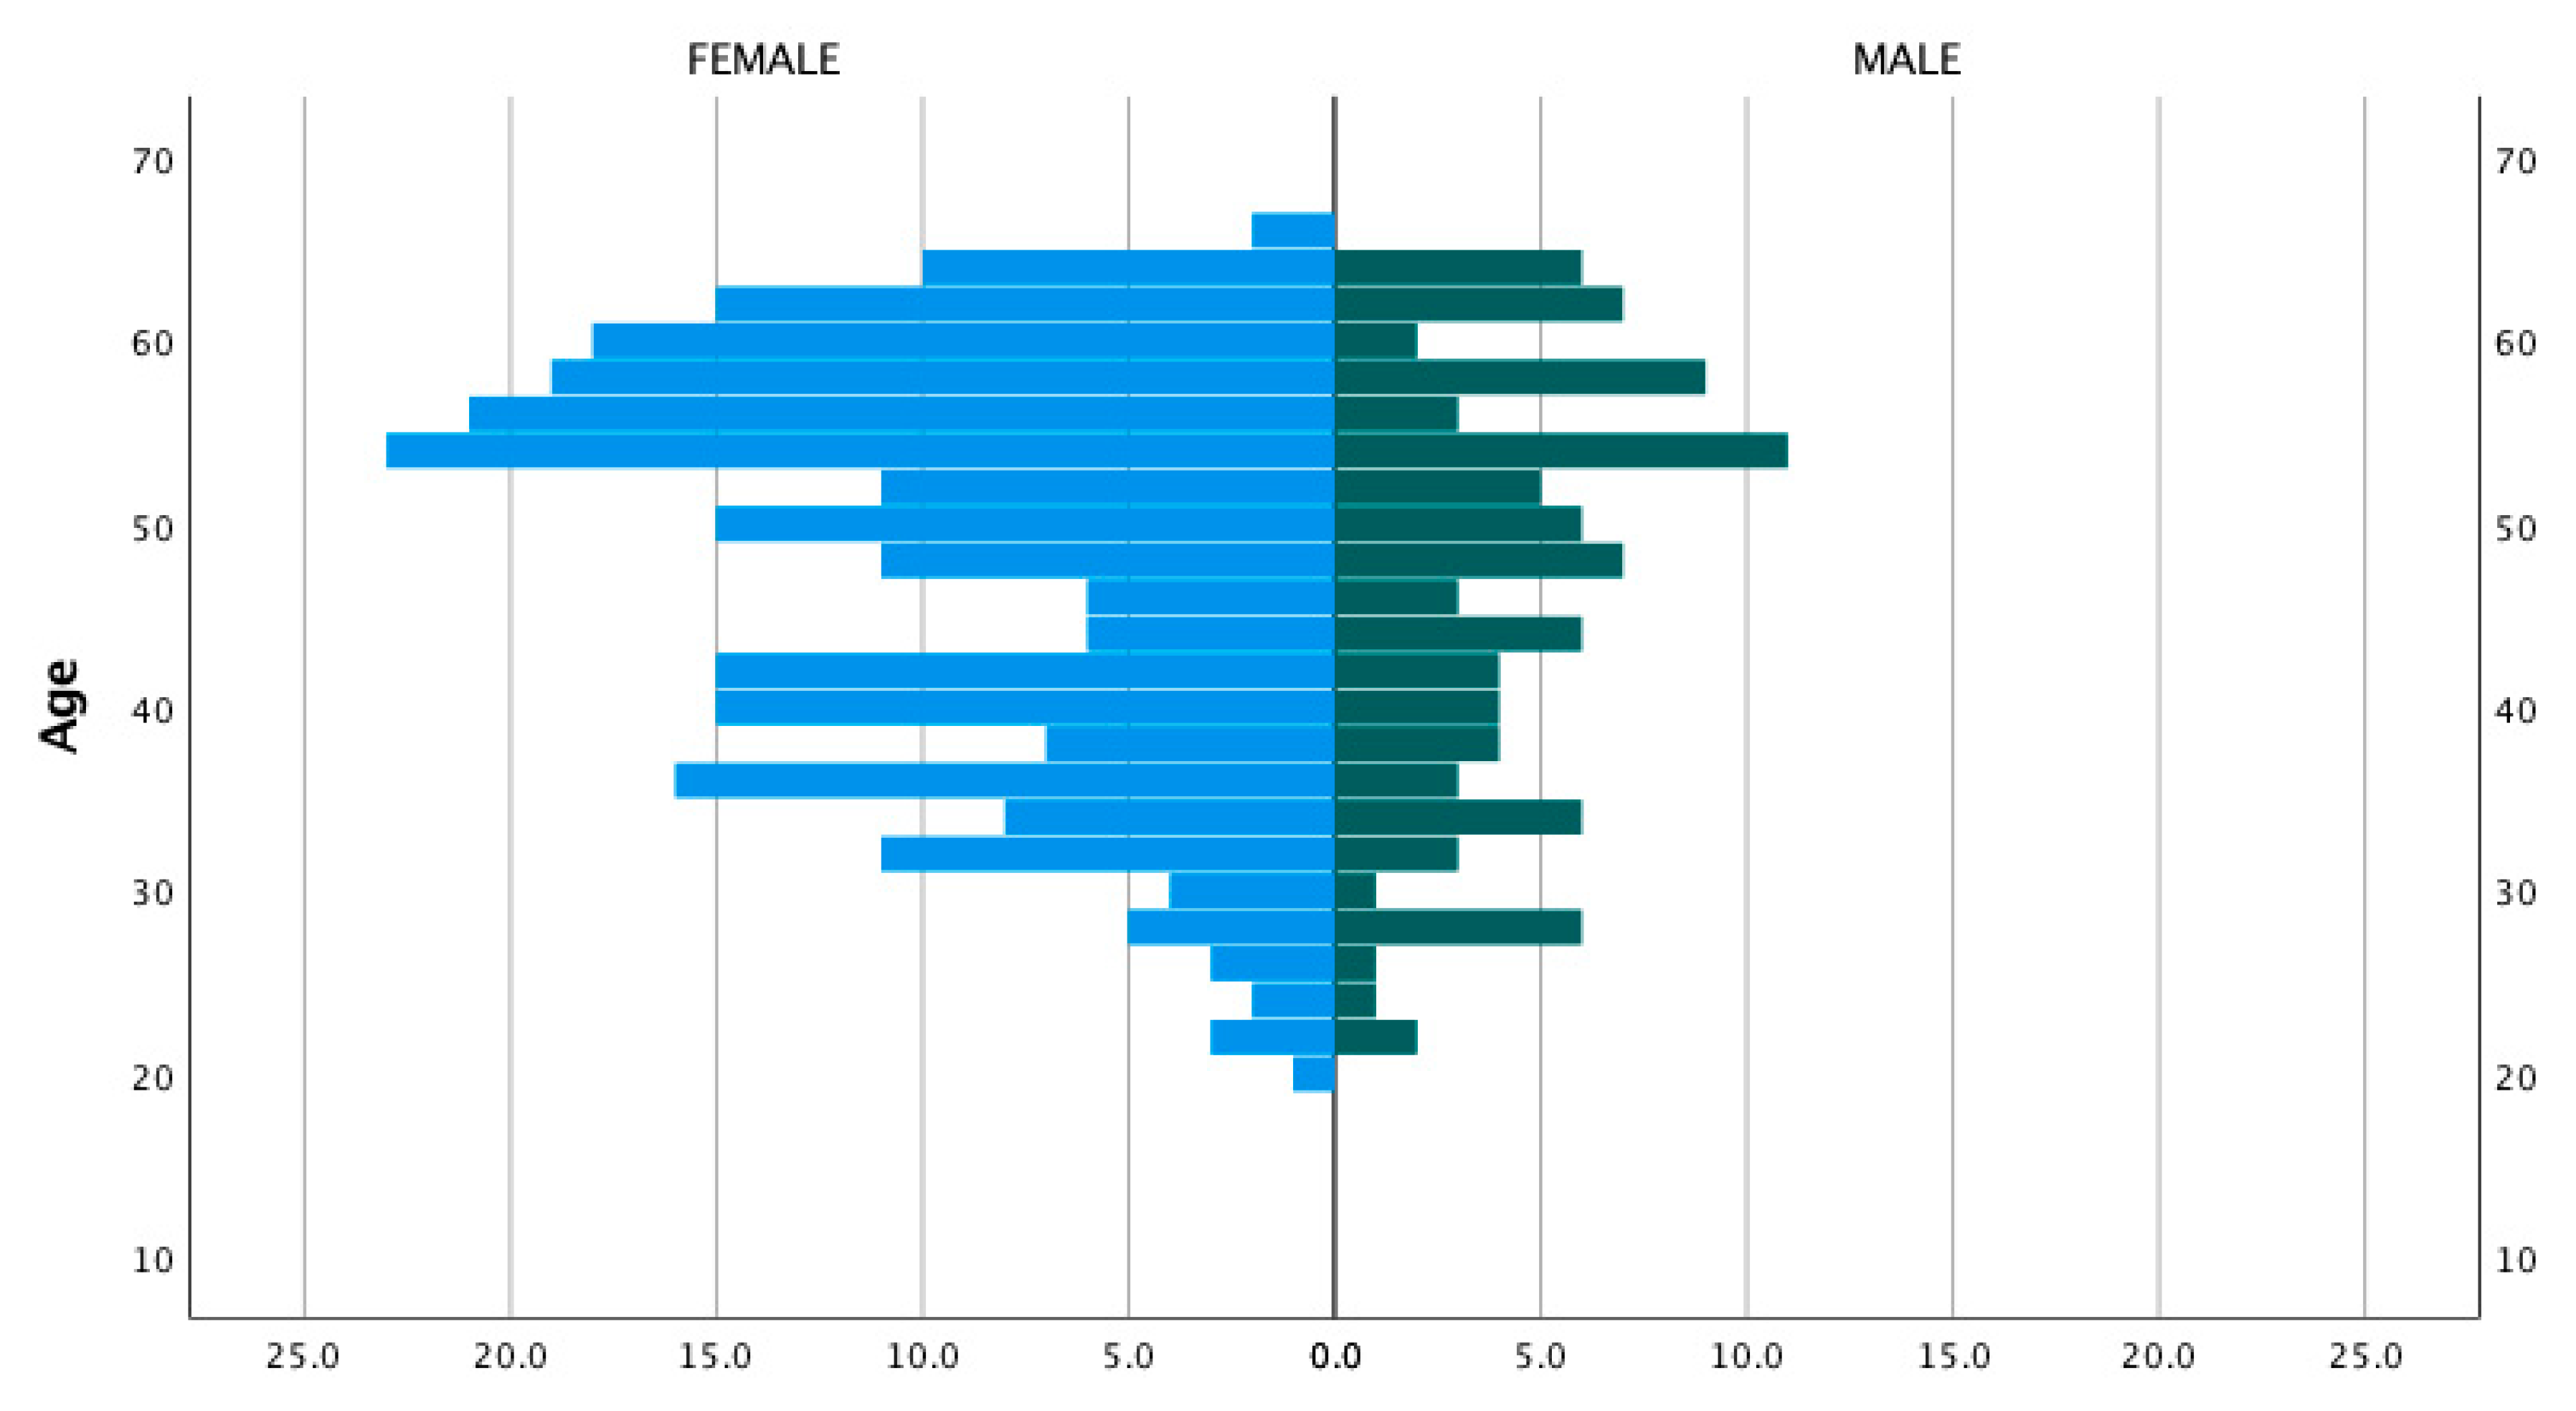
| Age (years), M (SD), range | 339 | 47.5 (11.1), 20–65 |
| Gender | 341 | |
| Female | 245 (71.8) | |
| Male | 96 (28.2) | |
| Marital status | 338 | |
| Single | 89 (26.3) | |
| Married/cohabiting | 200 (59.1) | |
| Separated/divorced | 37 (10.9) | |
| Widowed | 12 (3.6) | |
| Education level | 332 | |
| Lower secondary school | 34 (9.0) | |
| Secondary school | 186 (56.0) | |
| Higher education | 116 (34.9) | |
| Net income | 327 | |
| Low income | 34 (10.4) | |
| Middle income | 188 (57.5) | |
| High income | 105 (32.1) | |
| Worked within the last 3 months | 338 | |
| Yes | 278 (82.2) | |
| No | 60 (17.8) | |
| First language | 328 | |
| German | 318 (97.0) | |
| Other | 10 (3.0) | |
| Depressive symptoms (BDI-II) | 344 | |
| Minimal | 63 (18.3) | |
| Mild | 74 (21.5) | |
| Moderate | 105 (30.5) | |
| Severe | 102 (29.7) |
| Items * | Satisfaction | Frustration | R2 | ||||
|---|---|---|---|---|---|---|---|
| Aut | Comp | Relate | Aut | Comp | Relate | ||
| 7. I feel that my decisions reflect what I really want. | 0.55 | 0.30 | |||||
| 19. I feel I have been doing what really interests me. | 0.65 | 0.42 | |||||
| 11. I feel capable at what I do. | 0.68 | 0.46 | |||||
| 17. I feel competent to achieve my goals. | 0.80 | 0.63 | |||||
| 3. I feel that the people I care about also care about me. | 0.72 | 0.53 | |||||
| 21. I experience a warm feeling with the people I spend time with. | 0.50 | 0.25 | |||||
| 2. Most of the things I do feel like “I have to.” | 0.54 | 0.29 | |||||
| 8. I feel forced to do many things I wouldn’t choose to do. | 0.59 | 0.35 | |||||
| 12. I feel disappointed with much of my performance. | 0.71 | 0.51 | |||||
| 24. I feel like a failure because of the mistakes I make. | 0.76 | 0.57 | |||||
| 4. I feel excluded from the group I want to belong to. | 0.63 | 0.40 | |||||
| 10. I feel that people who are important to me are cold and distant toward me. | 0.61 | 0.37 | |||||
| Coefficient Omega | AVE | Cronbach’s Alpha | |
|---|---|---|---|
| Autonomy satisfaction | 0.53 | 0.37 | 0.52 |
| Competence satisfaction | 0.71 | 0.55 | 0.7 |
| Relatedness satisfaction | 0.56 | 0.36 | 0.53 |
| Autonomy frustration | 0.48 | 0.32 | 0.48 |
| Competence frustration | 0.70 | 0.54 | 0.70 |
| Relatedness frustration | 0.56 | 0.42 | 0.55 |
| 1 | 2 | 3 | 4 | 5 | 6 | |
|---|---|---|---|---|---|---|
| 1. Autonomy satisfaction | 0.76 | 0.53 | 0.21 | 0.3 | 0.08 | |
| 2. Competence satisfaction | 0.87 | 0.40 | 0.16 | 0.45 | 0.19 | |
| 3. Relatedness satisfaction | 0.73 | 0.63 | 0.14 | 0.14 | 0.30 | |
| 4. Autonomy frustration | −0.46 | −0.40 | −0.37 | 0.40 | 0.19 | |
| 5. Competence frustration | −0.56 | −0.67 | −0.37 | 0.63 | 0.44 | |
| 6. Relatedness frustration | −0.28 | −0.44 | −0.55 | 0.44 | 0.66 |
| SBχ2 | df | SBχ2/df | ΔSBSχ2 (Δdf) | CFI | ΔCFI | SRMR | ΔSRMR | RMSEA | ΔRMSEA | |
|---|---|---|---|---|---|---|---|---|---|---|
| Sample | ||||||||||
| Overall (N = 344) | 50.12 | 38 | 1.32 g | 0.985 g | 0.029 g | 0.032 g | ||||
| Minimal/mild depressive symptoms (n = 137) | 46.81 | 38 | 1.23 g | 0.967 g | 0.049 g | 0.041 g | ||||
| Moderate/severe depressive symptoms (n = 207) | 58.54 * | 38 | 1.72 g | 0.939 a | 0.045 g | 0.053 a | ||||
| Invariance level | ||||||||||
| Configural | 105.839 * | 76 | 1.39 | 0.950 | 0.047 | 0.048 | ||||
| Weak | 118.128 ** | 82 | 1.44 | 12.29 (6) | 0.937 | −0.013 | 0.056 | 0.009 | 0.052 | 0.004 |
| Strong | 133.221 ** | 88 | 1.51 | 15.09 (6) | 0.922 | −0.015 | 0.063 | 0.007 | 0.056 | 0.004 |
References
- Ryan, R.M.; Deci, E.L. Self-Determination Theory: Basic Psychological Needs in Motivation, Development, and Wellness; Guilford Press: New York, NY, USA, 2017; ISBN 978-1-4625-2876-9. [Google Scholar]
- Deci, E.L.; Ryan, R.M. The “What” and “Why” of Goal Pursuits: Human Needs and the Self-Determination of Behavior. Psychol. Inq. 2000, 11, 227–268. [Google Scholar] [CrossRef]
- Vansteenkiste, M.; Ryan, R.M. On Psychological Growth and Vulnerability: Basic Psychological Need Satisfaction and Need Frustration as a Unifying Principle. J. Psychother. Integr. 2013, 23, 263–280. [Google Scholar] [CrossRef]
- van der Kaap-Deeder, J.; Sanchez, A.; Johannessen, M.R.A.; Stenseng, F.; Saksvik-Lehouillier, I.; Heissel, A. The Validation of the Norwegian Basic Psychological Need Satisfaction and Frustration Scale: A Stratified Sampling Procedure. Front. Psychol. 2022, 13, 1032006. [Google Scholar] [CrossRef]
- Namlı, Z.; Demirkol, M.E.; Tamam, L.; Karaytuğ, M.O.; Yeşiloğlu, C. Validity and Reliability Study of the Turkish Version of the Unbearable Psychache Scale. Alpha Psychiatry 2022, 23, 166. [Google Scholar] [CrossRef]
- Shneidman, E.S. Suicide as Psychache: A Clinical Approach to Self-Destructive Behavior; Jason Aronson: Lanham, MD, USA, 1993; ISBN 0-87668-151-8. [Google Scholar]
- Ryan, R.M.; Deci, E.L.; Vansteenkiste, M. Autonomy and Autonomy Disturbances in Self-Development and Psychopathology: Research on Motivation, Attachment, and Clinical Process. In Developmental Psychopathology; Cicchetti, D., Ed.; John Wiley & Sons, Inc.: Hoboken, NJ, USA, 2016; pp. 1–54. ISBN 978-1-119-12555-6. [Google Scholar]
- Bartholomew, K.J.; Ntoumanis, N.; Thøgersen-Ntoumani, C. Self-Determination Theory and the Darker Side of Athletic Experience: The Role of Interpersonal Control and Need Thwarting. Sport Exerc. Psychol. Rev. 2011, 7, 23–27. [Google Scholar] [CrossRef]
- Heissel, A.; Pietrek, A.; Flunger, B.; Fydrich, T.; Rapp, M.A.; Heinzel, S.; Vansteenkiste, M. The Validation of the German Basic Psychological Need Satisfaction and Frustration Scale in the Context of Mental Health. Eur. J. Health Psychol. 2018, 25, 119–132. [Google Scholar] [CrossRef]
- Campbell, R.; Tobback, E.; Delesie, L.; Vogelaers, D.; Mariman, A.; Vansteenkiste, M. Basic Psychological Need Experiences, Fatigue, and Sleep in Individuals with Unexplained Chronic Fatigue. Stress Health 2017, 33, 645–655. [Google Scholar] [CrossRef] [PubMed]
- Tóth-Király, I.; Bőthe, B.; Márki, A.N.; Rigó, A.; Orosz, G. Two Sides of the Same Coin: The Differentiating Role of Need Satisfaction and Frustration in Passion for Screen-based Activities. Eur. J. Soc. Psychol. 2019, 49, 1190–1205. [Google Scholar] [CrossRef]
- Campbell, R.; Boone, L.; Vansteenkiste, M.; Soenens, B. Psychological Need Frustration as a Transdiagnostic Process in Associations of Self-Critical Perfectionism with Depressive Symptoms and Eating Pathology. J. Clin. Psychol. 2018, 74, 1775–1790. [Google Scholar] [CrossRef]
- Chen, B.; Vansteenkiste, M.; Beyers, W.; Boone, L.; Deci, E.L.; Van der Kaap-Deeder, J.; Duriez, B.; Lens, W.; Matos, L.; Mouratidis, A.; et al. Basic Psychological Need Satisfaction, Need Frustration, and Need Strength across Four Cultures. Motiv. Emot. 2015, 39, 216–236. [Google Scholar] [CrossRef]
- Nishimura, T.; Suzuki, T. Basic Psychological Need Satisfaction and Frustration in Japan: Controlling for the Big Five Personality Traits: Need Satisfaction and Frustration in Japan. Jpn. Psychol. Res. 2016, 58, 320–331. [Google Scholar] [CrossRef]
- Rodríguez-Meirinhos, A.; Antolín-Suárez, L.; Brenning, K.; Vansteenkiste, M.; Oliva, A. A Bright and a Dark Path to Adolescents’ Functioning: The Role of Need Satisfaction and Need Frustration across Gender, Age, and Socioeconomic Status. J. Happiness Stud. 2020, 21, 95–116. [Google Scholar] [CrossRef]
- Haerens, L.; Aelterman, N.; Vansteenkiste, M.; Soenens, B.; Van Petegem, S. Do Perceived Autonomy-Supportive and Controlling Teaching Relate to Physical Education Students’ Motivational Experiences through Unique Pathways? Distinguishing between the Bright and Dark Side of Motivation. Psychol. Sport Exerc. 2015, 16, 26–36. [Google Scholar] [CrossRef]
- Liga, F.; Ingoglia, S.; Cuzzocrea, F.; Inguglia, C.; Costa, S.; Lo Coco, A.; Larcan, R. The Basic Psychological Need Satisfaction and Frustration Scale: Construct and Predictive Validity in the Italian Context. J. Personal. Assess. 2020, 102, 102–112. [Google Scholar] [CrossRef] [PubMed]
- Frielink, N.; Schuengel, C.; Embregts, P.J.C.M. Psychometric Properties of the Basic Psychological Need Satisfaction and Frustration Scale—Intellectual Disability (BPNSFS-ID). Eur. J. Psychol. Assess. 2019, 35, 37–45. [Google Scholar] [CrossRef]
- Heissel, A.; Pietrek, A.; Kangas, M.; der Kaap-Deeder, V.; Rapp, M.A. The Mediating Role of Rumination in the Relation between Basic Psychological Need Frustration and Depressive Symptoms. J. Clin. Med. 2023, 12, 395. [Google Scholar] [CrossRef]
- Pietrek, A.; Kangas, M.; Kliegl, R.; Rapp, M.A.; Heinzel, S.; van der Kaap-Deeder, J.; Heissel, A. Basic Psychological Need Satisfaction and Frustration in Major Depressive Disorder. Front. Psychiatry 2022, 13, 962501. [Google Scholar] [CrossRef]
- Eriksson, M.; Boman, E. Short Is Beautiful: Dimensionality and Measurement Invariance in Two Length of the Basic Psychological Need Satisfaction at Work Scale. Front. Psychol. 2018, 9, 965. [Google Scholar] [CrossRef]
- Heissel, A.; Pietrek, A.; Schwefel, M.; Abula, K.; Wilbertz, G.; Heinzel, S.; Rapp, M. STEP.De Study—A Multicentre Cluster-Randomised Effectiveness Trial of Exercise Therapy for Patients with Depressive Symptoms in Healthcare Services: Study Protocol. BMJ Open 2020, 10, e036287. [Google Scholar] [CrossRef]
- Wittchen, H.-U.; Zaudig, M.; Fydrich, T. Skid. In Strukturiertes Klinisches Interview für DSM-IV; Achse I Und II; Hogrefe: Göttingen, Germany, 1997. [Google Scholar]
- Qi, H.; Zhu, F. Sample Size Calculation for the Comparison of Means or Proportions in Phase III Clinical Trials. Available online: https://cran.r-project.org/web/packages/SampleSize4ClinicalTrials/SampleSize4ClinicalTrials.pdf (accessed on 6 October 2022).
- Hautzinger, M.; Keller, F.; Kühner, C. BDI-II. Beck-Depressions-Inventar; Pearson Assessment: Frankfurt, Germany, 2009; ISBN 3-8409-2349-2. [Google Scholar]
- Beck, A.T.; Steer, R.A.; Brown, G.K. BDI-II: Beck Depression Inventory; Pearson: London, UK, 1996. [Google Scholar]
- Sulz, S.K.D.; Grethe, C. Die VDS90-Symptomliste—Eine Alternative zur SCL90-R für Die Ambulante Psychotherapie-Praxis und das Interne Qualitätsmanagement? Psychotherapie 2005, 10, 38–48. [Google Scholar]
- Ware, J.E.; Kosinski, M.; Keller, S.D. A 12-Item Short-Form Health Survey: Construction of Scales and Preliminary Tests of Reliability and Validity. Med. Care 1996, 34, 220–233. [Google Scholar] [CrossRef] [PubMed]
- Rosseel, Y.; Jorgensen, T.D.; Rockwood, N.; Oberski, D.; Byrnes, J.; Vanbrabant, L.; Savalei, V.; Merkle, E.; Hallquist, M.; Rhemtulla, M.; et al. Lavaan: Latent Variable Analysis. 2020. Available online: https://research.tilburguniversity.edu/en/publications/lavaan-latent-variable-analysis (accessed on 6 October 2020).
- Raykov, T. Estimation of Composite Reliability for Congeneric Measures. Appl. Psychol. Meas. 1997, 21, 173–184. [Google Scholar] [CrossRef]
- Dunn, T.J.; Baguley, T.; Brunsden, V. From Alpha to Omega: A Practical Solution to the Pervasive Problem of Internal Consistency Estimation. Br. J. Psychol. 2014, 105, 399–412. [Google Scholar] [CrossRef] [PubMed]
- Hair Jr, J.F.; Black, W.C.; Babin, B.J.; Anderson, R.E. Multivariate Data Analysis; Prentice Hall: London, UK, 2010; p. 785. [Google Scholar]
- Fornell, C.; Larcker, D.F. Evaluating Structural Equation Models with Unobservable Variables and Measurement Error. J. Mark. Res. 1981, 18, 39. [Google Scholar] [CrossRef]
- Zayed, K.N.; Omara, E.N.; Al-Rawahi, N.Y.; Al-Shamli, A.K.; Al-Atiyah, A.A.; Al-Haramleh, A.A.; Azab, M.S.; Al-Khasawneh, G.M.; Hassan, M.A. Psychometric Properties of the Arabic Version of the Basic Psychological Needs Satisfaction-Frustration Scale (BPNSFS). BMC Psychol. 2021, 9, 15. [Google Scholar] [CrossRef]
- Costa, S.; Ingoglia, S.; Inguglia, C.; Liga, F.; Lo Coco, A.; Larcan, R. Psychometric Evaluation of the Basic Psychological Need Satisfaction and Frustration Scale (BPNSFS) in Italy. Meas. Eval. Couns. Dev. 2018, 51, 193–206. [Google Scholar] [CrossRef]
- Hoyle, R.H.; Gottfredson, N.C. Sample Size Considerations in Prevention Research Applications of Multilevel Modeling and Structural Equation Modeling. Prev. Sci. 2015, 16, 987–996. [Google Scholar] [CrossRef]
- Hayduk, L.A.; Littvay, L. Should Researchers Use Single Indicators, Best Indicators, or Multiple Indicators in Structural Equation Models? BMC Med. Res. Methodol. 2012, 12, 159. [Google Scholar] [CrossRef]
- World Health Organization. International Statistical Classification of Diseases and Related Health Problems: Instruction Manual; World Health Organization: Geneva, Switzerland, 2004; Volume 2, ISBN 92-4-154653-0. [Google Scholar]
- Barrett, P. Structural Equation Modelling: Adjudging Model Fit. Personal. Individ. Differ. 2007, 42, 815–824. [Google Scholar] [CrossRef]
- Bollen, K.A. Structural Equation Models with Observed Variables. In Structural Equations with Latent Variables; John Wiley & Sons, Ltd.: Hoboken, NJ, USA, 2014; pp. 80–150. ISBN 978-1-118-61917-9. [Google Scholar]
- Kline, R.B. Principles and Practice of Structural Equation Modeling, 4th ed.; Methodology in the Social Sciences; The Guilford Press: New York, NY, USA, 2015; ISBN 978-1-4625-2334-4. [Google Scholar]
- Browne, M.W.; Cudeck, R. Alternative Ways of Assessing Model Fit. Sociol. Methods Res. 1992, 21, 230–258. [Google Scholar] [CrossRef]
- Hu, L.; Bentler, P.M. Cutoff Criteria for Fit Indexes in Covariance Structure Analysis: Conventional Criteria versus New Alternatives. Struct. Equ. Model. Multidiscip. J. 1999, 6, 1–55. [Google Scholar] [CrossRef]
- Satorra, A.; Bentler, P.M. A Scaled Difference Chi-Square Test Statistic for Moment Structure Analysis. Psychometrika 1999, 66, 507–514. [Google Scholar] [CrossRef]
- Cheung, G.W.; Rensvold, R.B. Evaluating Goodness-of-Fit Indexes for Testing Measurement Invariance. Struct. Equ. Model. Multidiscip. J. 2002, 9, 233–255. [Google Scholar] [CrossRef]
- Akaike, H. Factor Analysis and AIC; Springer: New York, NY, USA, 1987; Volume 16. [Google Scholar]
- Chen, F.F. Sensitivity of Goodness of Fit Indexes to Lack of Measurement Invariance. Struct. Equ. Model. Multidiscip. J. 2007, 14, 464–504. [Google Scholar] [CrossRef]
- von Oertzen, T.; Brandmaier, A.M.; Tsang, S. Structural Equation Modeling With Ωnyx. Struct. Equ. Model. Multidiscip. J. 2015, 22, 148–161. [Google Scholar] [CrossRef]
- Bandalos, D.L. Finney Item Parceling Issues in Structural Equation Modeling. In New Developments and Techniques in Structural Equation Modeling; Marcoulides, G.A., Schumacker, R.E., Eds.; Lawrence Erlbaum Associates: Mahwah, NJ, USA, 2001; pp. 269–296. ISBN 978-0-8058-3593-9. [Google Scholar]
- Bentler, P.M.; Chou, C.-P. Practical Issues in Structural Modeling. Sociol. Methods Res. 1987, 16, 78–117. [Google Scholar] [CrossRef]
| Measure | M | SD | 1 | 2 | 3 | 4 | 5 | 6 | 7 | 8 | 9 | 10 | 11 | 12 |
|---|---|---|---|---|---|---|---|---|---|---|---|---|---|---|
| 1. Need satisfaction a | 19.69 | 4.72 | 1 | |||||||||||
| 2. Autonomy satisfaction | 5.77 | 1.94 | 0.81 *** | 1 | ||||||||||
| 3. Competence satisfaction | 6.19 | 2.09 | 0.80 *** | 0.53 *** | 1 | |||||||||
| 4. Relatedness satisfaction | 7.71 | 1.92 | 0.73 *** | 0.39 *** | 0.37 *** | 1 | ||||||||
| 5. Need frustration a | 15.79 | 4.78 | −0.51 *** | −0.34 *** | −0.46 *** | −0.39 *** | 1 | |||||||
| 6. Autonomy frustration | 6.51 | 2.04 | −0.29 *** | −0.23 *** | −0.26 *** | −0.20 *** | 0.68 *** | 1 | ||||||
| 7. Competence frustration | 5.21 | 2.25 | −0.46 *** | −0.34 *** | −0.49 *** | −0.25 *** | 0.81 *** | 0.38 *** | 1 | |||||
| 8. Relatedness frustration | 4.11 | 2.10 | −0.41 *** | −0.20 *** | −0.31 *** | −0.44 *** | 0.74 *** | 0.24 *** | 0.43 *** | 1 | ||||
| 9. Depressive symptoms | 22.63 | 9.89 | −0.53 *** | −0.41 *** | −0.48 *** | −0.33 *** | 0.64 *** | 0.44 *** | 0.60 *** | 0.41 *** | 1 | |||
| 10. Anxiety symptoms | 0.92 | 0.74 | −0.26 *** | −0.17 ** | −0.29 *** | −0.15 ** | 0.28 *** | 0.14 * | 0.23 *** | 0.23 *** | 0.41 *** | 1 | ||
| 11. Physical quality of life | 43.67 | 9.14 | 0.14 *** | 0.03 | 0.19 ** | 0.14 * | −0.22 *** | −0.23 *** | −0.20 *** | −0.10 | −0.37 *** | −0.26 *** | 1 | |
| 12. Mental quality of life | 31.52 | 9.16 | 0.36 ** | 0.28 *** | 0.35 *** | 0.17 ** | −0.54 *** | −0.39 *** | −0.46 *** | −0.33 *** | −0.65 *** | −0.30 *** | 0.01 | 1 |
| χ2 | df | χ2/df | CFI | TLI | SRMR | RMSEA (90% CI) | AIC | BIC | Model Comparison ΔSBS-χ2 (Δdf) | |
|---|---|---|---|---|---|---|---|---|---|---|
| 6-factor model | 68.869 ** | 39 | 1.77 g | 0.963 g | 0.937 | 0.039 g | 0.049 g (0.029, 0.068) | 12,536.838 | 12,570.926 | |
| 3-factor model | 190.819 *** | 51 | 3.74 n | 0.821 n | 0.768 | 0.068 a | 0.095 n (0.081, 0.109) | 12,653.019 | 12,679.086 | 112.42 (12) *** |
| 62-factor hierarchical model | 108.419 *** | 47 | 2.31 a | 0.920 a | 0.888 | 0.051 a | 0.066 a (0.050, 0.082) | 12,569.265 | 12,598.005 | 35.22 (8) *** |
| 63-factor hierarchical model | 130.759 *** | 45 | 2.91 a | 0.894 n | 0.845 | 0.060 a | 0.078 a (0.062, 0.093) | 12,591.771 | 12,621.849 | 63.575 (6) *** |
Disclaimer/Publisher’s Note: The statements, opinions and data contained in all publications are solely those of the individual author(s) and contributor(s) and not of MDPI and/or the editor(s). MDPI and/or the editor(s) disclaim responsibility for any injury to people or property resulting from any ideas, methods, instructions or products referred to in the content. |
© 2023 by the authors. Licensee MDPI, Basel, Switzerland. This article is an open access article distributed under the terms and conditions of the Creative Commons Attribution (CC BY) license (https://creativecommons.org/licenses/by/4.0/).
Share and Cite
Heissel, A.; Sanchez, A.; Pietrek, A.; Bergau, T.; Stielow, C.; Rapp, M.A.; Van der Kaap-Deeder, J. Validating the German Short Basic Psychological Need Satisfaction and Frustration Scale in Individuals with Depression. Healthcare 2023, 11, 412. https://doi.org/10.3390/healthcare11030412
Heissel A, Sanchez A, Pietrek A, Bergau T, Stielow C, Rapp MA, Van der Kaap-Deeder J. Validating the German Short Basic Psychological Need Satisfaction and Frustration Scale in Individuals with Depression. Healthcare. 2023; 11(3):412. https://doi.org/10.3390/healthcare11030412
Chicago/Turabian StyleHeissel, Andreas, Alba Sanchez, Anou Pietrek, Theresa Bergau, Christiane Stielow, Michael A. Rapp, and Jolene Van der Kaap-Deeder. 2023. "Validating the German Short Basic Psychological Need Satisfaction and Frustration Scale in Individuals with Depression" Healthcare 11, no. 3: 412. https://doi.org/10.3390/healthcare11030412
APA StyleHeissel, A., Sanchez, A., Pietrek, A., Bergau, T., Stielow, C., Rapp, M. A., & Van der Kaap-Deeder, J. (2023). Validating the German Short Basic Psychological Need Satisfaction and Frustration Scale in Individuals with Depression. Healthcare, 11(3), 412. https://doi.org/10.3390/healthcare11030412