
How to Use Lean Thinking for the Optimization of Clinical Pathways: A Systematic Review and a Proposed Framework to Analyze Pathways on a System Level

 , ,
, ,
Abstract
:1. Introduction
1.1. Theoretical Background
1.2. Research on Lean Thinking in Healthcare
1.3. Importance of a Holistic View
1.4. Clinical Pathways
1.5. Quantifying Lean Thinking
1.6. Objectives
- What is known in the current literature on Lean Thinking when used in clinical pathways?
- What definitions can be used to systemically quantify value (waste, flow, push/pull) in a clinical pathway?
2. Methods
2.1. Eligibility Criteria
- Study context: Focused on a clinical pathway in healthcare.
- Clinical pathway definitions: The pathway was focused on a well-defined group of patients. The paper had to study a pathway optimization with Lean Thinking.
- Lean Thinking application: The authors explicitly mentioned using Lean for optimization in the methodology.
- Study types: All study designs were considered, but only peer-reviewed articles were included.
- Report language: Published in English.
- Publication years: All publication years were considered eligible for this review.
2.2. Information Sources
2.3. Search Strategy
2.4. Selection Process
2.5. Data Collection Process
2.6. Data Items
2.7. Analysis and Presentation of Results
2.8. Development Proposed Framework
3. Results
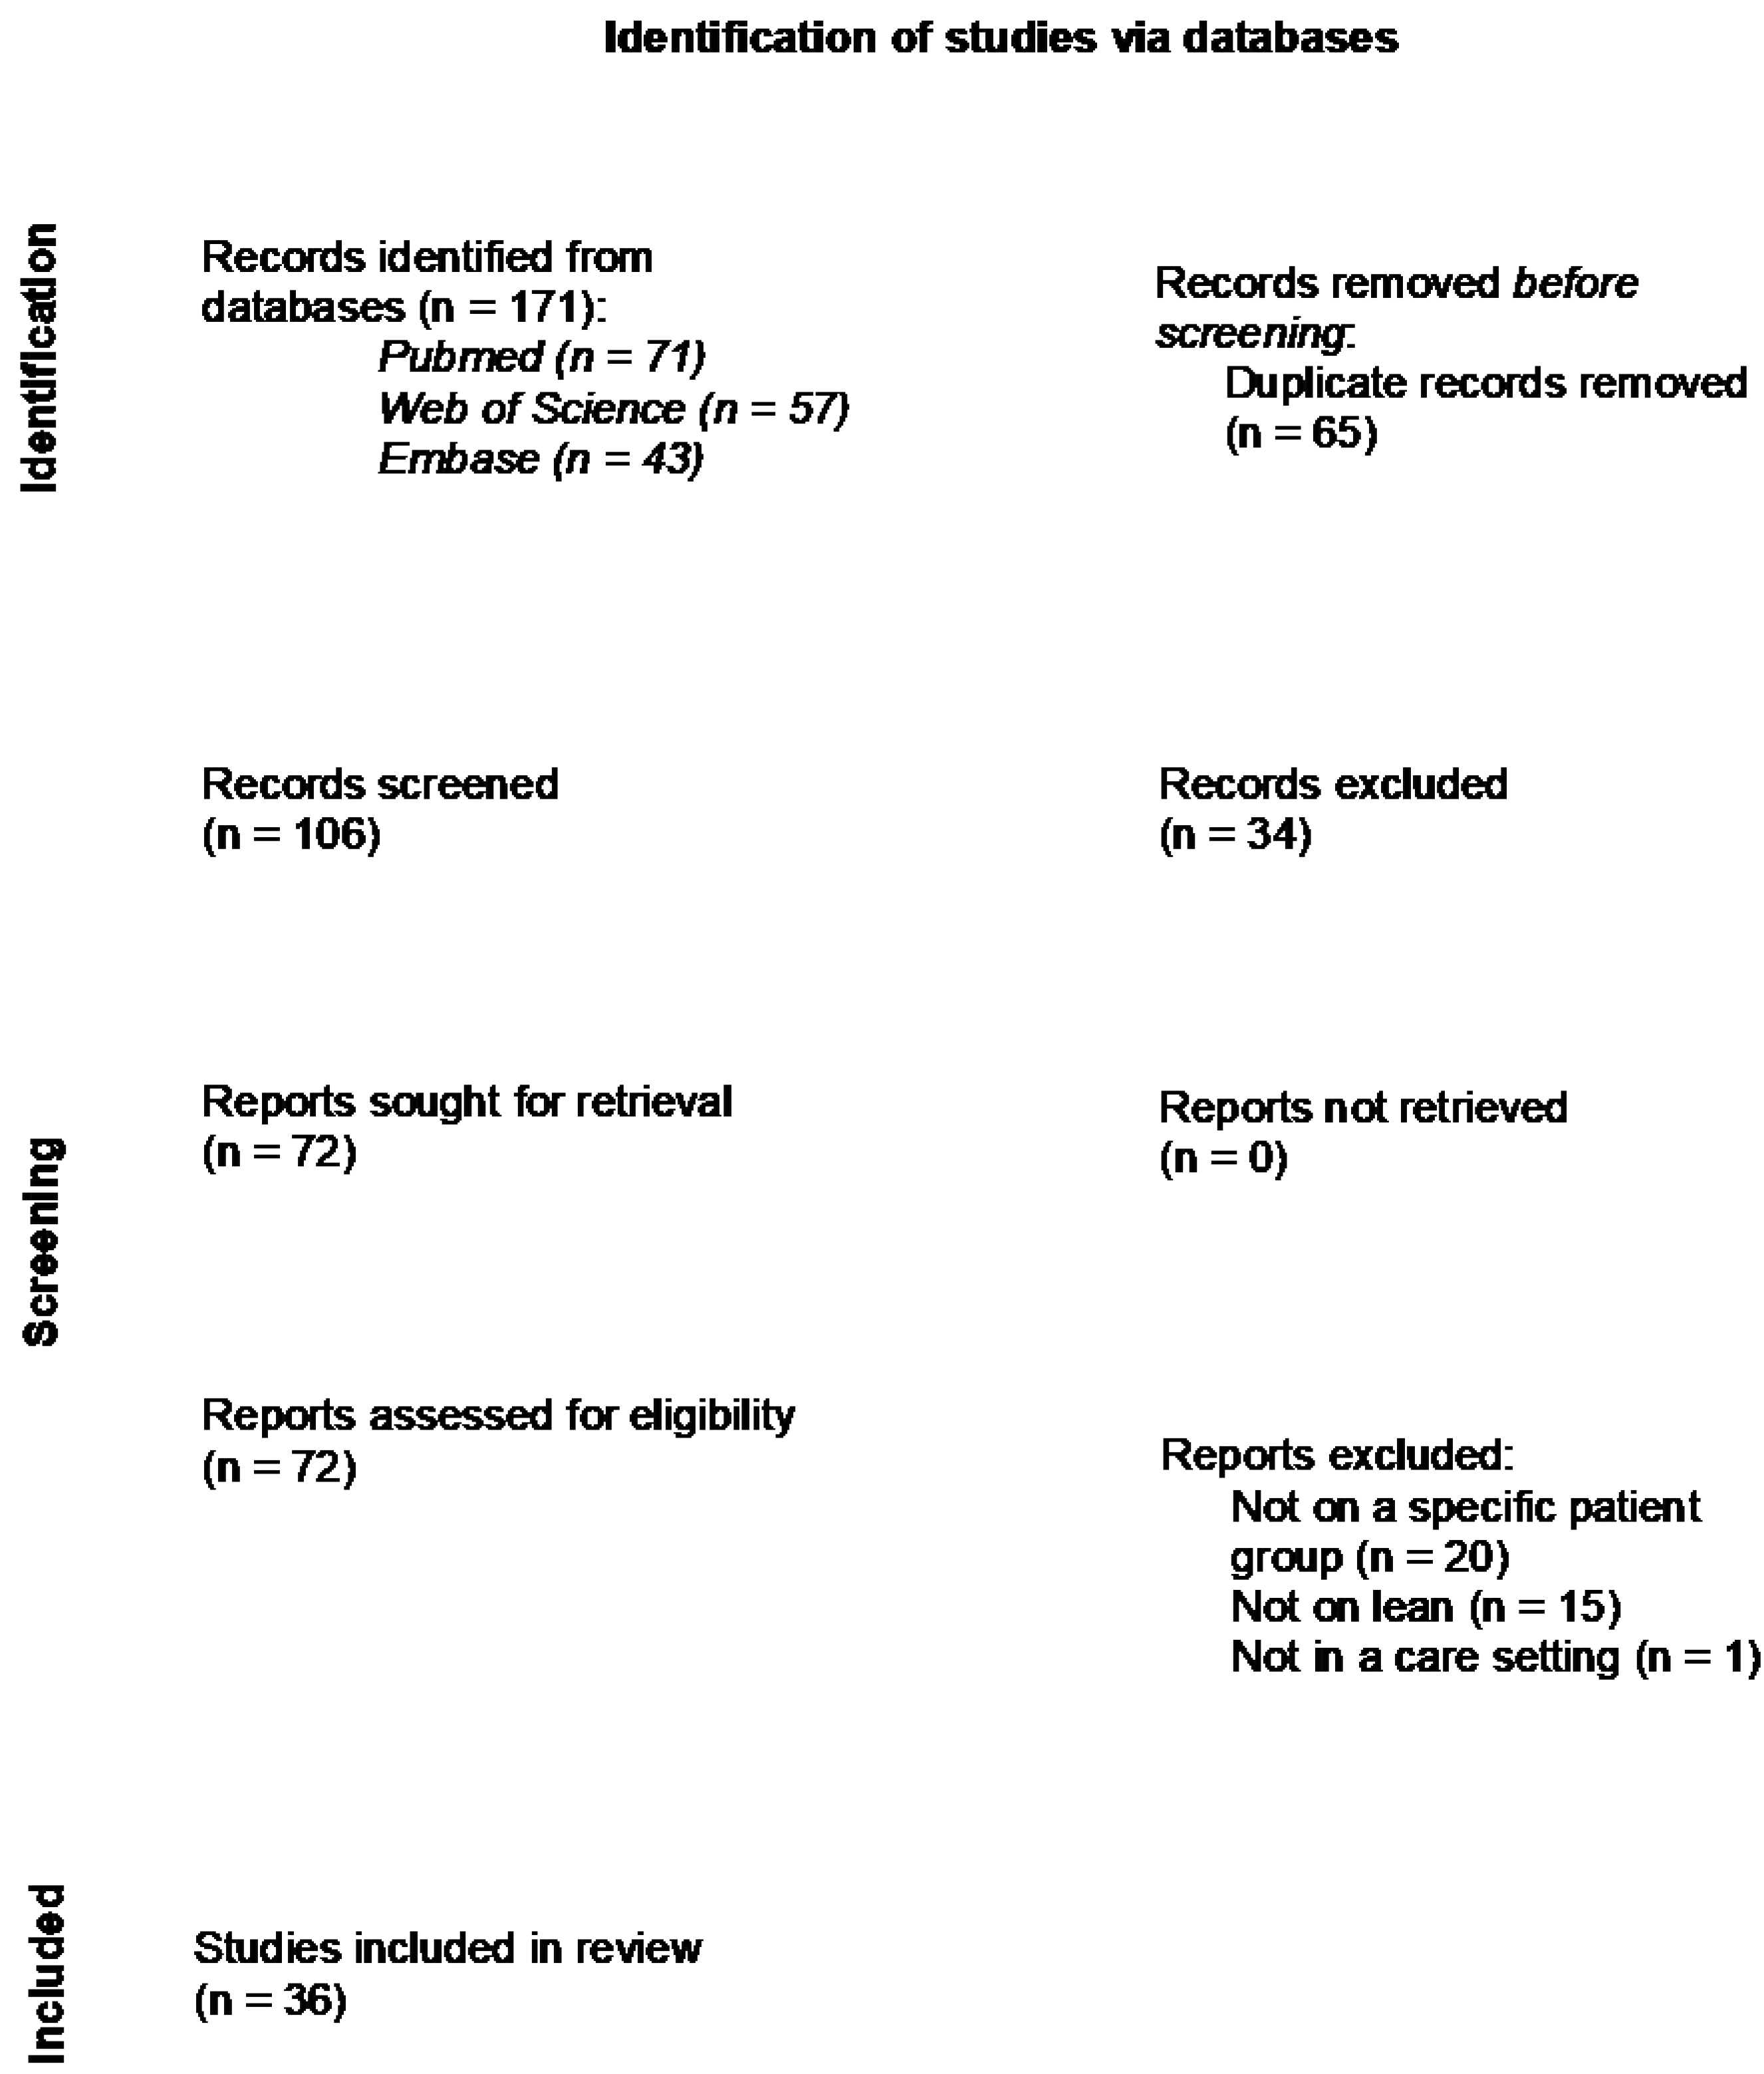
3.1. Selection
3.2. Review Findings
3.2.1. General
3.2.2. Lean Thinking
3.2.3. Clinical Pathways
3.2.4. Measures
3.3. Linking Found Measures with Lean Thinking
3.4. The Framework for Measuring Lean Thinking in a Clinical Pathway
3.4.1. Waste
- 2.
- In the literature found in this review, waiting time between process steps was often measured and could be an indicator of the waste waiting. We suggest quantifying waiting as the time a patient is waiting between two steps in the system. An example is the time between an appointment at the outpatient clinic for an intake with a gastroenterologist and the next step, a diagnostic colonoscopy. Nota bene, sometimes there is useful waiting in a clinical pathway, for instance when a patient needs to revisit the outpatient clinic after six months for follow-up or when a patient needs two days of colon preparation before a colonoscopy.
- 3.
- Conveyance (transport) was not linked to any of the measures found in the literature review. The movement of a patient or materials necessary in the process can often be improved mainly at process step level and is not easily reflected in a clinical pathway. A solution is to indicate the location of each step in the pathway. By measuring the physical distance between the different locations where a patient moves to on a single day, the conveyance can be expressed. In addition, if an outpatient appointment takes place in the hospital instead of digitally the patient experiences extra transport. This should be considered when calculating conveyance.
- 4.
- With overprocessing, there are steps in the process that are unneeded or not the right step or the processing takes unnecessary precision [5,18]. In the literature review, three measures were linked to overprocessing: (1) the duration of a process step; (2) the number of certain process steps in a trajectory; (3) pathway or guideline compliance and protocol utilization. The first is on the level of a process step, the second on the level of a process trajectory and the third is on a value stream map level. The last one can be used in a clinical pathway to observe an undesirable deviation from the pathway. Like when a patient is given an appointment after the colonoscopy for the results and is then referred to another specialist for treatment. These two steps can be combined into one step by giving the patient the results of the colonoscopy by the treating specialist. In this way, the patient does not need to visit the hospital twice and receives information about the possible next treatment steps. We suggest quantifying overprocessing as the number of extra, undesirable steps for a patient that took place compared to the desired pathway. The healthcare professionals who work within the clinical pathway should jointly determine what the desired pathway is.
- 5.
- Excess inventory is idle stock. In healthcare, patients that are waiting for appointments or treatment could be considered as inventory. In this review, the number of patients in certain process steps/trajectory was linked to inventory. To map the inventory in the pathway, the number of patients in a certain trajectory, equivalent to the work in process (WIP), can be measured. For example, all patients waiting for surgery are WIP in this certain trajectory.
- 6.
- Unnecessary movement is motion that does not create added value or searching for information [18]. This is mostly noticeable locally for the staff, but less over the entire clinical pathway. A nurse will need different materials, such as a scale, to measure the weight of the patient. This may not be present at the location where the patient is, and the nurse will get the scale somewhere else. This causes unnecessary movement and makes the step take longer. The extra movement will not cause waste on value stream level but may cause waste at process step level because the step possibly takes longer. Unnecessary movement on process step level could be measured as the number of physical steps taken by a staff member during a process step. We propose to exclude movement when quantifying the clinical pathway because measuring movement does not add value on value stream map level.
- 7.
- Defects are the production of defective parts, and this needs correction [5]. In the literature, we found ten measures to calculate defects. To measure defects on the level of the value stream map, patient satisfaction of the entire pathway, complications, mortality, and functional recovery could be used. These are important outcome measures in creating value for the patient.
3.4.2. Flow and Pull
- Flow is a continuous process in which there is little waste and a stable output. We linked flow to the found measure: duration of the whole trajectory. To specify flow further, we propose to include waiting time in the calculation. This results in the ratio of total waiting time to the cycle time in the system to quantify flow. Waiting time is defined in the section above. The cycle time is defined as the total duration between the time a patient enters the clinical pathway and the time a patient leaves the clinical pathway. The access time (time between referral and first appointment) is not part of the cycle time.
- No found measures were linked to pull. Munavalli links open and closed loop systems to push and pull systems [20], explained under 1. overproduction. In a push system, there is no limit to the work in process (WIP) and no feedback to determine the input, thus an open loop system. The opposite applies for pull systems: the system determines if new input can be admitted and it uses the system status to determine this, thus a closed loop system. The WIP can be used to create a feedback system where new input (a patient) in the clinical pathway is admitted when another patient leaves the system, like CONWIP (constant work in process) [21]. To measure pull in a clinical pathway, the WIP of the entire system should be calculated: the total amount of patients in the system at a given time.
4. Discussion
4.1. Main Findings
4.2. System Level
4.3. Clinical Pathways in Integrated Practice Units
4.4. Focus on Orthopedic Surgery
4.5. Strengths and Limitations
4.6. Implications
Supplementary Materials
Author Contributions
Funding
Institutional Review Board Statement
Informed Consent Statement
Data Availability Statement
Conflicts of Interest
References
- Vijverberg, J.R.; Daniels, K.; Steinmann, G.; Garvelink, M.M.; van der Voort, M.B.R.; Biesma, D.; Bos, W.J.W.; van Merode, F.; van der Nat, P. Mapping the extent, range and nature of research activity on value-based healthcare in the 15 years following its introduction (2006–2021): A scoping review. BMJ Open 2022, 12, e064983. [Google Scholar] [CrossRef] [PubMed]
- Henrique, D.B.; Filho, M.G. A systematic literature review of empirical research in Lean and Six Sigma in healthcare. Total Qual. Manag. Bus. Excell. 2020, 31, 429–449. [Google Scholar] [CrossRef]
- Womack, J.P.; Jones, D.T. Lean thinking—Banish waste and create wealth in your corporation. J. Oper. Res. Soc. 1997, 48, 1148. [Google Scholar] [CrossRef]
- van Merode, F. Capaciteitsmanagement in relatie tot de besturing en organisatie van zorg. In Capaciteitsplanning in de Zorg; Berden, B., Berrevoets, L., van Merode, F., Winasti, W., Eds.; Bohn Stafleu van Loghum: Houten, The Netherlands, 2021; pp. 3–22. [Google Scholar]
- Liker, J.K. Toyota Way: 14 Management Principles from the World’s Greatest Manufacturer; McGraw-Hill Education: New York, NY, USA, 2004. [Google Scholar]
- Shingo Intitute. The Shingo Model. Available online: https://shingo.org/shingo-model/ (accessed on 3 April 2023).
- D’Andreamatteo, A.; Ianni, L.; Lega, F.; Sargiacomo, M. Lean in healthcare: A comprehensive review. Health Policy 2015, 119, 1197–1209. [Google Scholar] [CrossRef]
- Mazzocato, P.; Savage, C.; Brommels, M.; Aronsson, H.; Thor, J. Lean thinking in healthcare: A realist review of the literature. BMJ Qual. Saf. 2010, 19, 376–382. [Google Scholar] [CrossRef] [PubMed]
- Lima, R.M.; Dinis-Carvalho, J.; Souza, T.A.; Vieira, E.; Gonçalves, B. Implementation of lean in health care environments: An update of systematic reviews. Int. J. Lean Six Sigma 2021, 12, 399–431. [Google Scholar] [CrossRef]
- Costa, L.B.M.; Filho, M.G.; Rentes, A.F.; Bertani, T.M.; Mardegan, R. Lean healthcare in developing countries: Evidence from Brazilian hospitals. Int. J. Health Plan. Manag. 2017, 32, e99–e120. [Google Scholar] [CrossRef] [PubMed]
- Ludwig, M.; Van Merode, F.; Groot, W. Principal agent relationships and the efficiency of hospitals. Eur. J. Health Econ. 2010, 11, 291–304. [Google Scholar] [CrossRef] [PubMed]
- De Bleser, L.; Depreitere, R.; Waele, K.D.; Vanhaecht, K.; Vlayen, J.; Sermeus, W. Defining pathways. J. Nurs. Manag. 2006, 14, 553–563. [Google Scholar] [CrossRef] [PubMed]
- Rayyan. Available online: http://rayyan.qcri.org (accessed on 7 August 2023).
- Mead, E.; Stark, C.; Thompson, M. International Examples of Lean in Healthcare: Case Studies of Best Practices; CRC Press: Boca Raton, FL, USA, 2022. [Google Scholar]
- Page, M.J.; McKenzie, J.E.; Bossuyt, P.M.; Boutron, I.; Hoffmann, T.C.; Mulrow, C.D.; Shamseer, L.; Tetzlaff, J.M.; Akl, E.A.; Brennan, S.E. The PRISMA 2020 statement: An updated guideline for reporting systematic reviews. Syst. Rev. 2021, 88, 105906. [Google Scholar]
- Specialty and Subspecialty Certificates. Available online: https://www.abms.org/member-boards/specialty-subspecialty-certificates/ (accessed on 7 August 2023).
- Donabedian, A. An Introduction to Quality Assurance in Health Care; Oxford University Press: Oxford, UK, 2002. [Google Scholar]
- Toyota Engineering Corporation. Total-TPS (Basic)—Toyota Production System Textbook (Grade 4); Toyota Engineering Corporation: Nagoya, Japan, 2015. [Google Scholar]
- Munavalli, J.R.; Boersma, H.J.; Rao, S.V.; Van Merode, G. Real-time capacity management and patient flow optimization in hospitals using AI methods. In Artificial Intelligence and Data Mining in Healthcare; Springer: Cham, Switzerland, 2021; pp. 55–69. [Google Scholar]
- Munavalli, J.R. Real-Time Scheduling in Outpatient Clinics. Ph.D. Thesis, Maastricht University, Maastricht, The Netherlands, 2017. [Google Scholar]
- Hopp, W.J.; Spearman, M.L. Factory Physics; Waveland Press: Long Grove, IL, USA, 2011. [Google Scholar]
- van der Ham, A.; Boersma, H.; van Raak, A.; Ruwaard, D.; van Merode, F. Identifying logistical parameters in hospitals: Does literature reflect integration in hospitals? A scoping study. Health Serv. Manag. Res. 2019, 32, 158–165. [Google Scholar] [CrossRef] [PubMed]
- Porter, M.E.; Lee, T.H. The strategy that will fix health care. Harv. Bus. Rev. 2013, 91, 24. [Google Scholar]
- Isfahani, H.M.; Tourani, S.; Seyedin, H. Lean management approach in hospitals: A systematic review. Int. J. Lean Six Sigma 2019, 10, 161–188. [Google Scholar] [CrossRef]
- Shortell, S.M.; Blodgett, J.C.; Rundall, T.G.; Kralovec, P. Use of Lean and related transformational performance improvement systems in hospitals in the United States: Results from a national survey. Jt. Comm. J. Qual. Patient Saf. 2018, 44, 574–582. [Google Scholar] [CrossRef] [PubMed]


| Waste | Definition Liker |
|---|---|
| Overproduction | Producing items for which there are no orders, which generates such wastes as overstaffing and storage and transportation costs because of excess inventory. |
| Waiting | Workers merely serving to watch an automated machine or having to stand around waiting for the next processing step, tool, supply, part, etc., or just plain having no work because of stock-outs, lot processing delays, equipment downtime, and capacity bottlenecks. |
| Conveyance or unnecessary transport | Carrying work in process (WIP) long distances, creating inefficient transport, or moving materials, parts, or finished goods into or out of storage or between processes. |
| Overprocessing or incorrect processing | Taking unneeded steps to process the parts. Inefficiently processing due to poor tool and product design, causing unnecessary motion and producing defects. Waste is generated when providing higher-quality products than is necessary. |
| (Excess) inventory | Excess raw material, WIP, or finished goods causing longer lead times, obsolescence, damaged goods, transportation and storage costs, and delay. In addition, extra inventory hides problems such as production imbalances, late deliveries from suppliers, defects, equipment downtime, and long setup times. |
| Motion/unnecessary movement | Any wasted motion employees have to perform during the course of their work, such as looking for, reaching for, or stacking parts, tools, etc. In addition, walking is waste. |
| Correction or defects | Production of defective parts or correction. Repair or rework, scrap, replacement production, and inspection mean wasteful handling, time, and effort. |
| Medical (Sub) Specialty # | Number of Articles | Percentage of Articles |
|---|---|---|
| Internal medicine: Cardiology | 3 | 8% |
| Internal medicine: Gastroenterology | 1 | 3% |
| Internal medicine: Geriatric medicine | 2 | 6% |
| Internal medicine: Infectious disease | 1 | 3% |
| Internal medicine: Pulmonary disease | 2 | 6% |
| Neurological surgery | 1 | 3% |
| Neurology | 2 | 6% |
| Ophthalmology | 3 | 8% |
| Orthopedic surgery | 14 | 39% |
| Otolaryngology | 1 | 3% |
| Pediatrics | 1 | 3% |
| Plastic surgery | 2 | 6% |
| Psychiatry | 1 | 3% |
| Surgery: General surgery | 1 | 3% |
| Surgery: Transplant surgery | 1 | 3% |
| “4 P” Model | Lean Method | Number of Articles | Percentage of Articles # |
|---|---|---|---|
| Philosophy | - | - | - |
| Process | Value stream mapping | 19 | 53% |
| Process mapping | 12 | 33% | |
| Waste reduction | 5 | 14% | |
| SIPOC | 4 | 11% | |
| Standardization of Work | 3 | 8% | |
| Continuous Flow | 2 | 6% | |
| Single-piece flow | 1 | 3% | |
| People and Partners | - | - | - |
| Problem Solving | Cause-and-Effect Diagram | 7 | 19% |
| 5 Whys | 4 | 11% | |
| A3 | 2 | 6% | |
| Kaizen | 2 | 6% | |
| Gemba Walk | 1 | 3% | |
| Pareto | 1 | 3% | |
| PICK Chart | 1 | 3% |
| Type of Process Measures | Number of Articles | Percentage of Articles # |
|---|---|---|
| Length of stay in hospital | 16 | 44% |
| Time between process steps | 13 | 36% |
| Duration of process steps | 10 | 28% |
| Number of patients in certain process steps/trajectory | 7 | 19% |
| Number of certain process steps in trajectory | 6 | 17% |
| Pathway/guidelines compliance | 3 | 8% |
| Duration of the whole trajectory | 2 | 6% |
| Identification of bottlenecks (long tasks commonly performed) | 2 | 6% |
| Treatment rate | 2 | 6% |
| Protocol utilization | 1 | 3% |
| Count of wastes in process | 1 | 3% |
| Number of staff interactions | 1 | 3% |
| Percentage of cancellations | 1 | 3% |
| Type of outcome measures | Number of articles | Percentage of articles # |
| Patient satisfaction | 5 | 14% |
| Readmissions | 5 | 14% |
| Complications | 3 | 8% |
| Extra treatment needed | 3 | 8% |
| Medication requirements | 3 | 8% |
| Pain scores | 3 | 8% |
| Mortality | 2 | 6% |
| Perioperative scores | 2 | 6% |
| Acute care utilization | 1 | 3% |
| Discharge to which location | 1 | 3% |
| Functional recovery | 1 | 3% |
| Type of cost measures | Number of articles | Percentage of articles # |
| Total cost | 3 | 8% |
| Cost reductions | 1 | 3% |
| Lean Thinking Concept | Found Measures | Clarification |
|---|---|---|
| Overproduction | - | - |
| Waiting | Time between process steps | Waiting can be expressed as time a patient is waiting between process steps. |
| Transport | - | - |
| Overprocessing | Duration of process steps | On a process step level, if a process step takes longer than necessary, the step is overprocessed. |
| Number of certain process steps in trajectory | On a process trajectory level, if the trajectory consists of too many steps, too little steps, or the wrong steps, then there is overprocessing. | |
| Pathway/guidelines compliance or protocol utilization | On a value stream map level, if the compliance/utilization is low, the wrong steps or too little/many steps are performed. | |
| Inventory | Number of patients in certain process steps/trajectory | Inventory is defined, among other things, as work in process (WIP). The number of patients that are in a certain part of the value stream map, patients in process, can be seen as stock at a process trajectory level. |
| Movement | - | - |
| Defects | Length of stay in hospital | The duration of hospitalization is often seen in medical literature as an outcome measure. A hospitalization that is longer than usual is regarded as a defect (an undesirable outcome). |
| Percentage of cancellations | The cancellation of an appointment or another process step is an undesirable outcome and often needs a correction (rescheduling). | |
| Patient satisfaction | If a patient is not satisfied with the given care, it has an undesired outcome. | |
| Readmissions | If a patient needs to be readmitted, it means that rework is taking place. | |
| Complications | A complication is not the correct outcome of care. It leads to extra work and is a defect. | |
| Extra treatment needed or extra medication required | If additional treatment is required, the previous treatment has not had the correct outcome and rework is required. | |
| Pain scores | An unnecessarily high pain score is an undesired outcome. | |
| Mortality | The mortality is an undesirable outcome and thus a defect. | |
| Acute care utilization | A visit to the emergency department could be prevented by providing care earlier. Acute care utilization is undesirable and a defect. | |
| Functional recovery | Functional recovery indicates whether the desired outcome is met with the care process. If the recovery is worse than desired, this is a defect. | |
| Flow | Duration of the whole trajectory | When flow occurs, patients move smoothly through the value stream map. The duration of the whole trajectory can be an indication of flow, where a shorter duration would indicate more flow. |
| Pull | - | - |
| No link | Identification of bottlenecks (long tasks commonly performed) | A bottleneck is defined here as a process step that takes a long time and is performed frequently. Identifying these bottlenecks can be used to level the process (heijunka) and thus create flow. But a bottleneck is not a quantification of flow itself. |
| Treatment rate | The percentage that a certain treatment took place in the hospital is not a measure that can be linked to Lean Thinking in a clinical pathway. | |
| Count of wastes in process | Because this measure has no further specification on how it is counted, it cannot be linked to quantifying Lean Thinking. | |
| Number of staff interactions | In Lean Thinking there is no valuing of more or less staff interactions. | |
| Discharge to which location | The location to which a patient is discharged can be seen as an outcome measure, but it is outside the scope of the process within the hospital. | |
| Total cost | Cost is often a measure in Lean Thinking to express the effect of improvements but is not seen as one of the wastes. | |
| Cost reductions | Cost is often a measure in Lean Thinking to express the effect of improvements but is not seen as one of the wastes. |
| Lean Element | Description | Variable or Formula |
|---|---|---|
| Overproduction | Number of people waiting for step (x) per day. | n_step(x) |
| Waiting | Average waiting time of patients before step (x) in days for chosen period. | t_wait(x) |
| Conveyance | Physical distance to step x from step x-1, categorized as e.g., zero (for same location or digital), at department, in building, outside building. | d(x) |
| Overprocessing | Steps that deviate from the desired clinical pathway established by healthcare professionals. | s_repeat s_added s_skipped |
| Inventory | Total number of patients waiting in a certain trajectory per day. | n_trajectory(x) |
| Defects | E.g., patient satisfaction of the entire pathway, complications, mortality, and functional recovery. | defect_satisfaction defect_complication defect_mortality defect_PROM defect_PREM |
| Flow | Ratio between total waiting time and cycle time (time between first meeting to end of trajectory) per patient. | |
| Pull | Total number of patients waiting in clinical pathway per day. |
Disclaimer/Publisher’s Note: The statements, opinions and data contained in all publications are solely those of the individual author(s) and contributor(s) and not of MDPI and/or the editor(s). MDPI and/or the editor(s) disclaim responsibility for any injury to people or property resulting from any ideas, methods, instructions or products referred to in the content. |
© 2023 by the authors. Licensee MDPI, Basel, Switzerland. This article is an open access article distributed under the terms and conditions of the Creative Commons Attribution (CC BY) license (https://creativecommons.org/licenses/by/4.0/).
Share and Cite
Vijverberg, J.R.G.; Rouppe van der Voort, M.B.V.; van der Nat, P.B.; Mosselman, M.J.; Rigter, S.; Biesma, D.H.; van Merode, F. How to Use Lean Thinking for the Optimization of Clinical Pathways: A Systematic Review and a Proposed Framework to Analyze Pathways on a System Level. Healthcare 2023, 11, 2488. https://doi.org/10.3390/healthcare11182488
Vijverberg JRG, Rouppe van der Voort MBV, van der Nat PB, Mosselman MJ, Rigter S, Biesma DH, van Merode F. How to Use Lean Thinking for the Optimization of Clinical Pathways: A Systematic Review and a Proposed Framework to Analyze Pathways on a System Level. Healthcare. 2023; 11(18):2488. https://doi.org/10.3390/healthcare11182488
Chicago/Turabian StyleVijverberg, Joanna R. G., Marc B. V. Rouppe van der Voort, Paul B. van der Nat, Machteld J. Mosselman, Sander Rigter, Douwe H. Biesma, and Frits van Merode. 2023. "How to Use Lean Thinking for the Optimization of Clinical Pathways: A Systematic Review and a Proposed Framework to Analyze Pathways on a System Level" Healthcare 11, no. 18: 2488. https://doi.org/10.3390/healthcare11182488
APA StyleVijverberg, J. R. G., Rouppe van der Voort, M. B. V., van der Nat, P. B., Mosselman, M. J., Rigter, S., Biesma, D. H., & van Merode, F. (2023). How to Use Lean Thinking for the Optimization of Clinical Pathways: A Systematic Review and a Proposed Framework to Analyze Pathways on a System Level. Healthcare, 11(18), 2488. https://doi.org/10.3390/healthcare11182488