Article

The Effectiveness of Home-Based Inspiratory Muscle Training on Small Airway Function and Disease-Associated Symptoms in Patients with Chronic Obstructive Pulmonary Disease

1
Department of Nursing, Chang Gung University of Science and Technology, Taoyuan 33303, Taiwan
2
Department of Thoracic Medicine, Chang Gung Memorial Hospital Linkou Main Branch, Taoyuan 33303, Taiwan
3
College of Medicine, Chang Gung University, Taoyuan 33303, Taiwan
4
School of Nursing, College of Medicine, Chang Gung University, Taoyuan 33303, Taiwan
5
New Taipei Municipal TuCheng Hospital, Chang Gung Medical Foundation, New Taipei City 236017, Taiwan
*
Author to whom correspondence should be addressed.
Healthcare 2023, 11(16), 2310; https://doi.org/10.3390/healthcare11162310
Submission received: 28 June 2023 / Revised: 1 August 2023 / Accepted: 14 August 2023 / Published: 16 August 2023
(This article belongs to the Special Issue Exercise as Medicine in Chronic Conditions)

Abstract

:
Chronic obstructive pulmonary disease (COPD) is characterized by persistent airflow limitations, occurring mainly in the small airways. Weakness in the respiratory muscles contributes to dyspnea and a decreased exercise capacity in COPD patients. This study aimed to investigate the effectiveness of home-based inspiratory muscle training (IMT) on small airway function and symptoms in COPD patients. This research adopted a non-randomized controlled-study quasi-experimental design. The IMT program consisted of two 15 min sessions·d−1, 5 d·wk−1, with 40% of the maximal inspiratory pressure (PImax) on each participant’s assessment results and lasted for 12 weeks. Small airway function was assessed using plethysmography at baseline and after 12 weeks. The modified British Medical Research Council (mMRC), COPD assessment test (CAT), PImax, and 6 min walking distance (6MWD) were recorded at baseline as well as four, eight, and twelve weeks. Twenty-three participants with at least moderate COPD were enrolled in IMT (n = 16) or in the control group (n = 7) in this study. The study participants were mostly male (82.6%), and the average age was 68.29 ± 10.87 years, with a mean body mass index (BMI) of 23.54 ± 4.79. After 12 weeks, the ratios of the first second of forced expiration to the forced vital capacity (FEV1/FVC%) (B coefficient [95% Wald confidence interval] of 5.21 [0.46 to 9.96], p = 0.032), forced expiratory flow (FEF25–75%) (0.20 [0.04 to 0.35] L/s, p = 0.012), and FEF50% (0.26 [0.08 to 0.43] L/s, p = 0.004) in the IMT group were significantly better than in the control group. The IMT group showed significantly lower CAT scores at week 8 (−5.50 [−10.31 to −0.695] scores, p = 0.025) than the control group. The mMRC grade, CAT score, PImax, and 6MWD were significantly improved compared to their values at baseline in the IMT group. Home-based IMT effectively improved post-bronchodilator small airway function and disease-associated symptoms in COPD patients.

1. Introduction

Chronic obstructive pulmonary disease (COPD) is a serious global public health issue. It is one of the top three leading causes of deaths worldwide with a high rate of mortality and morbidity and with impacts on patients’ quality of life [1]. COPD is a chronic and progressive disease of the lung characterized by irreversible airflow limitations. The main sites of airflow obstruction in COPD are the small airways [1,2]. Spirometry has long been used clinically to evaluate the lung function of patients with respiratory diseases and to diagnose COPD [3]. There are limitations when using routine spirometry to evaluate the extensive lesions in the small airways of COPD patients because spirometry is insensitive to peripheral airway obstruction [4]. The literature indicates that small airway function offers a novel perspective on COPD, providing extensive insight into the correlations between the pathological mechanisms of COPD and lung function [5]. Body plethysmography is a sensitive lung measurement used to detect lung pathologies, and these measurements have been demonstrated to confer clinical information that might be missed by conventional pulmonary function tests, especially in obstructive airway diseases [6]. Small airway function, therefore, should be considered to be one of the essential clinical evaluation items of treatment effectiveness in patients with COPD.
The main goals of the treatment of stable COPD patients are reductions in both the symptoms and the future risk of exacerbation [1], and the management strategies include both pharmacological treatments and non-pharmacological interventions [7]. Respiratory muscle weakness, especially in the inspiratory muscles, is prevalent in patients with COPD [8,9] and contributes to dyspnea and exercise limitations [10,11]. Pulmonary rehabilitation is a comprehensive intervention aimed at improving the physical and psychological condition of patients with COPD [1]. The outcomes of pulmonary rehabilitation for patients include improvements in their exercise capacity and quality of life [12]. It is also suggested as an appropriate intervention for most patients with COPD [1].
Inspiratory muscle training (IMT) is a type of resistance training that is chosen for patients with COPD who are unable to participate in exercise training [13]. IMT is a convenient and safe exercise method that can be carried out in a home setting [9,14,15,16]. Studies have demonstrated that a standard protocol of 30% or higher (30–80%) of PImax for a duration of 20 to 30 min per day for 10 to 12 weeks increases the strength in the inspiratory muscles and results in improvements in dyspnea, quality of life, and exercise performance [14,17,18]. However, the previous studies in this field have methodological heterogeneity [16], and the benefits that can be attributed to IMT in isolation and to its association with other interventions are unclear [19]. It is also unclear whether IMT improves the symptoms associated with the condition by enhancing the small airway function of COPD patients. These are challenges to applying the outcomes of IMT on COPD patients, and more research is required to clarify them.
In Taiwan, COPD is ranked eighth in the top ten leading causes of death and had an increased rate of 10.3% in 2021 [20]. COPD occurs in smokers over the age of 40, and it occurs more in men than in women; the prevalence rate is 6.1% in adults aged over 40 [21], and the prevalence rate of moderate to severe COPD is 5.4% [22] compared with the 10.3% global prevalence of COPD [1]. COPD is associated with a significant financial burden for patients, caregivers, and society as a whole. The budget spent on COPD is EUR 38.6 billion in Europe annually [1]. Home-based COPD patients with stable conditions are managed through outpatient clinic follow-ups every three months, daily drug treatments, and regular pulmonary function testing through spirometry and chest X-ray assessments without routine pulmonary rehabilitation in Taiwan. The literature indicates that the issues related to home-based care for COPD patients need to be emphasized [1]. However, little attention has been paid to the effectiveness of home-based IMT in patients with COPD in Taiwan. The aim of this study was to investigate the effectiveness of home-based IMT on small airway function, dyspnea, quality of life, exercise endurance, and inspiratory muscle improvement in patients with COPD. It was hypothesized that home-based IMT would improve small airway function and disease-related health conditions in COPD patients.

2. Materials and Methods

2.1. Study Design

This non-randomized controlled study adopted a quasi-experimental design for 12 weeks for stable COPD patients. From October 2014 to October 2017, subjects with COPD were enrolled in the pulmonary outpatient clinic of Chang Gung Memorial Hospital (Linkou Branch), where there is a level III medical center with 3700 beds, in Taiwan.

2.2. Participants

Participants who were determined to be eligible by thoracic medical specialists and were willing to participate were referred to the investigators. The investigators explained the study procedure, and the participants decided whether to be given home-based IMT (IMT group) or to receive standard care (control group) for 12 weeks. The participants in both groups received the same care, including regular medical treatments and assessments. The experimental group was provided with IMT, and all participants returned to the pulmonary outpatient clinic once a month for study assessments. The inclusion criteria were as follows: (1) patients with a diagnosis of COPD with post-bronchodilator forced vital capacity (FEV1/FVC) < 0.7 according to the 2011 Global Initiative for Chronic Obstructive Lung Disease (GOLD) criteria [1] and at least moderate airflow limitation, as patients with mild airflow limitations often had no obvious symptoms and were easily ignored without seeking medical aid [23]; (2) patients who were living at home and able to receive regular follow-ups in the outpatient clinic; (3) patients with no previous receipt of IMT; (4) patients with stable condition and no hospital stays or emergency treatments for COPD acute exacerbations in the preceding three months; (5) patients with ability to communicate in Mandarin Chinese or Taiwanese and willingness to participate; and (6) patients who were adults aged 40 years or older. The exclusion criteria were as follows: (1) comorbid left-sided heart failure, (2) acute myocardial infarction in the past three months, or (3) the requirement of partial or complete assistance in daily activities (e.g., as a result of bone fracture or cerebrovascular accidents).

2.3. Procedures

Based on 2011 GOLD strategy document, modified British Medical Research Council (mMRC) and COPD assessment test (CAT) were recommended as the standard for evaluating the impact of COPD symptoms on patients [1]. A 6 min walk test (6MWT), as one of the most utilized exercise tests for COPD, was used to evaluate exercise capacity and intervention outcomes [24]. Participants undertook assessments to determine their mMRC grade, CAT score, maximal inspiratory pressure (PImax), maximal expiratory pressure (PEmax), and 6 min walking distance (6MWD), and they received total-body plethysmography; these data were recorded as the baseline data (T1). Data were collected again at four weeks (T2), eight weeks (T3), and twelve weeks (T4) except total-body plethysmography, which was performed at T1 and T4. This study was approved by the Institutional Review Board of the medical center (No: 103-4903B), and it received permission from the study site prior to participant enrolment. Participants were enrolled in this study only after giving written informed consent.

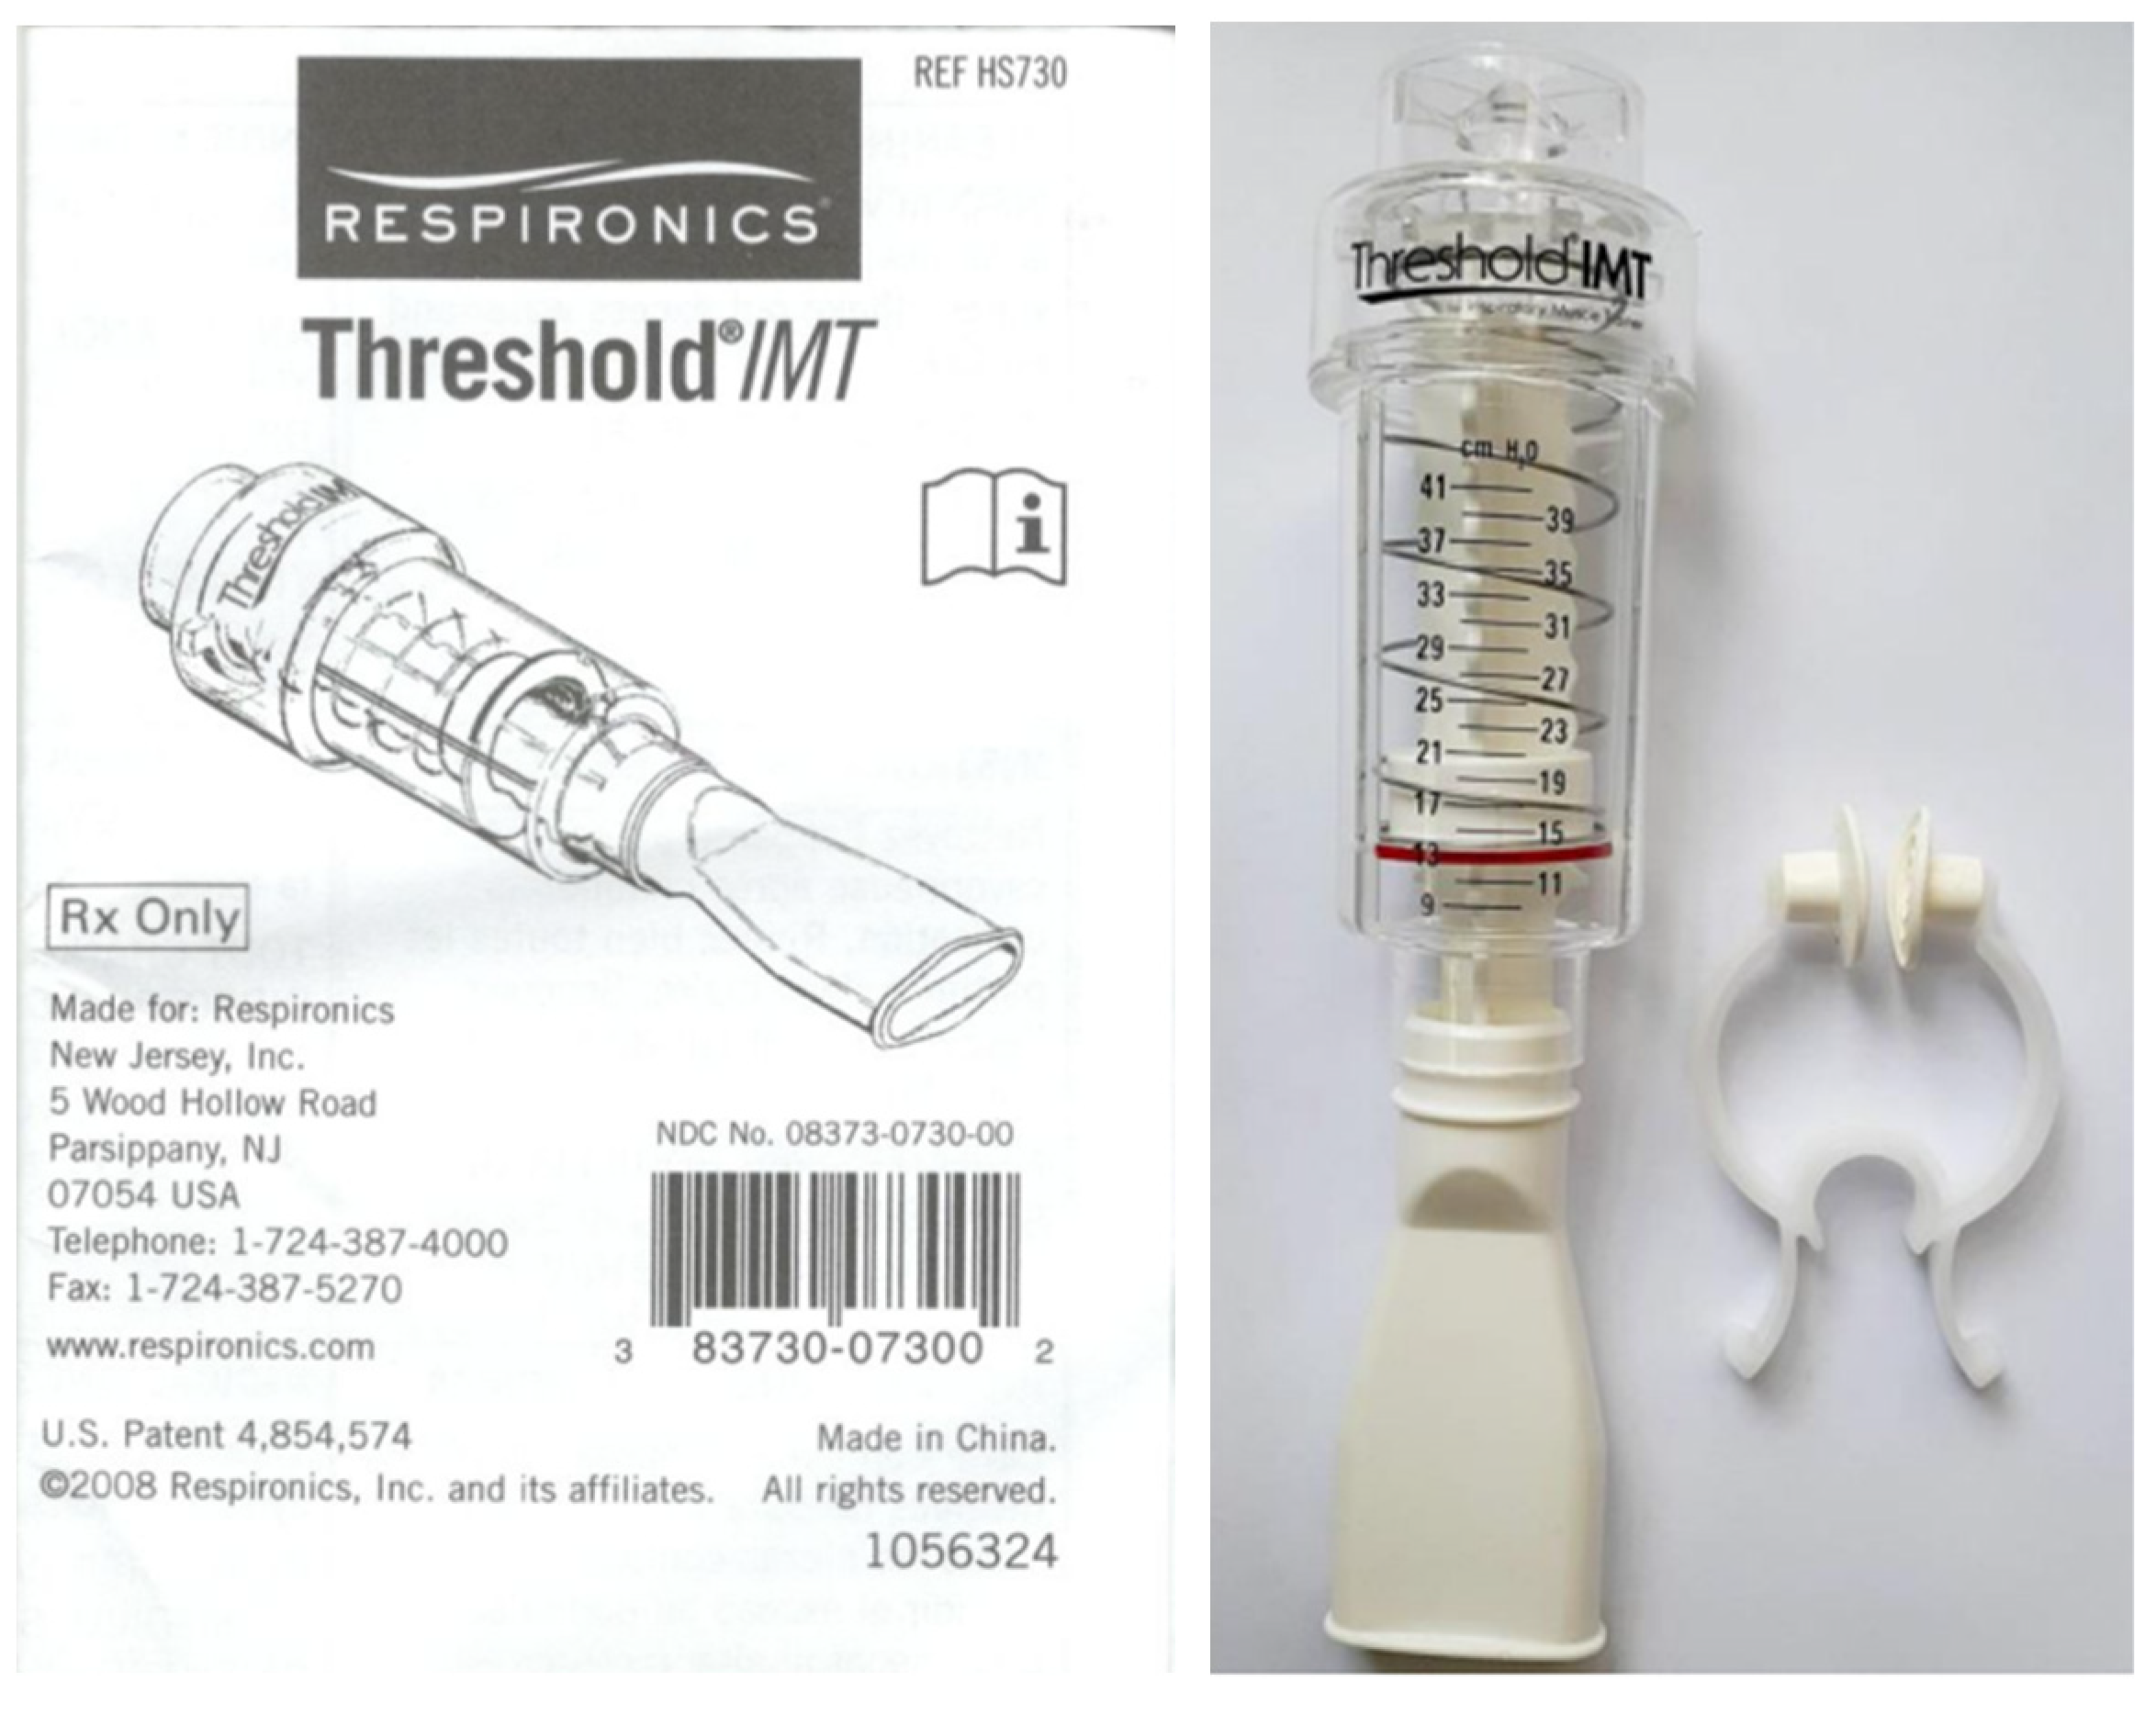
2.3.1. The IMT Device and Prescribed Training

The selection of IMT device and training prescription was based on recommendations from the American College of Sports Medicine (ACSM) [13,25] as well as other published literature [10,14,16,18] and the safety and convenience of the participants’ home-based training [15]. The threshold IMT device (RESPIRONICS Threshold IMT, Respironics Respiratory Drug Delivery, UK, NDC NO:08373-0730-00, Medical Device permit: Taiwan Department of Health Medical Device Import Number 010248) (Figure 1) was adopted as the training device in the experimental group (IMT group). The threshold IMT device has an inspiratory threshold loading design with a spring that provides adjustable resistance (range of 9–41 cmH2O ± 2 cmH2O). The user breathes against a spring-loaded valve, and the load of the valve can be adjusted to accommodate the user’s capacity. Based on the literature [10,14,16,18], the training program consisted of 15 min sessions performed twice daily, five days a week, using 40% PImax as the loading threshold and was adjusted every four weeks based on each participant’s assessment results. The training program lasted 12 weeks.

2.3.2. Clinical Disease Symptom Severity Evaluations

The Modified British Medical Research Council (mMRC) Dyspnea Scale

The mMRC scale was modified from the British Medical Research Council dyspnea scale by the American Thoracic Society (ATS) [26]. The mMRC scale is graded from 0 to 4 and quantifies patient-reported daily breathlessness [27]. The 2011 Global Initiative for Chronic Obstructive Lung Disease (GOLD) strategy document recommends assessment of COPD using symptoms and future exacerbation risk, employing mMRC grade ≥ 2 as equivalent symptom cut points and categorizing patients into low- or high-symptom groups [28].

The COPD Assessment Test (CAT) Score

The COPD assessment test (CAT) score consists of eight questions, each scored 0–5 from the least to most severe impairment [29]. CAT is sensitive to COPD disease severity [30] and has been recommended by GOLD since 2011 as the standard test for evaluating the impact of COPD symptoms on patients. A CAT score of <10 indicates a less symptomatic state, while a score of ≥10 indicates a more symptomatic state [1,26].

2.3.3. Measurement of Lung Function, Pulmonary Physiology, and Exercise Tests

Total-Body Plethysmography

The VIASYS body Box Vmax 22D model (Viasys Healthcare, Conshohocken, PA, USA) was used for taking measurements, including spirometry, lung volume, and diffusion capacity, and was operated by the study site’s lung function analysts. The study participants sat in the “body box” (body plethysmography) and closed the door to form a sealed chamber. When the door was closed, the study participants inhaled and exhaled as instructed by the analyst. By measuring the airway pressure of the participants and the change in the volume of the box, the body box calculated the participants’ lung volume through the detection of the electronic converter [31]. To illustrate lung function prior to and after the use of bronchodilators, participants were given bronchodilators upon completion of the primary tests and then took a 15 min rest before undergoing the secondary tests.

Manovacuometry

Manovacuometry was used to measure the respiratory muscles, including PImax and PEmax. The pressure range between inhalation (negative values) and exhalation (positive values) was ±120 cmH2O. The standard protocol for respiratory muscle measurements in this study is described below. Each participant was assessed individually for their PImax and PEmax values. Prior to each measurement, manovacuometry was returned to zero. Participants were instructed to sit on a chair, to breathe naturally, and to adjust their breaths at will. After complete expiration, participants inhaled fully through a mouthpiece held in their mouths with their noses covered, and, from this, the PImax was derived. In reverse, when participants exhaled fully after full inhalation, the PEmax was derived. Participants were asked to repeat this procedure 3 to 5 times during each assessment, and the best values were recorded for further analysis.

The 6 min Walking Test

This study complied with European Respiratory Society and American Thoracic Society’s walking test technical standards for chronic respiratory disease [32]. The test was performed along a test corridor at the Pulmonary Recovery Center of the study site after the test site was deemed to be qualified through a hospital evaluation of the medical center. Professional personnel in the Pulmonary Recover Center undertook the evaluation and provided verbal encouragement using specific terms every minute during the test. The participants, equipped with a pulse oximeter, were asked to walk at their fastest pace and to adjust the in-between pace on their own until the end of the 6 min test period. Spirometry was performed before and after the exercise. Investigators recorded the full walking distance achieved within 6 min (6MWD) by each participant, the extent of breathlessness before and after exercise determined by modified Borg scale (MBS) [33], and their pulse rate and oxygen saturation through the course of the exercise. The MBS, pulse rate, and oximetry measurements served as a safety monitoring tool during the exercise assessment [32,33].

2.4. Statistical Analysis

The primary outcome was the difference of forced expiratory flow (FEF25–75%) and FEF50% between the IMT and the control groups at week 12. Secondary outcomes included the mMRC grade, CAT score, PImax, forced expiration volume in one second (FEV1), forced vital capacity (FVC), and 6MWD at week 12. Statistical analysis was performed using IBM SPSS statistics 19.0 software (IBM Corp., Armonk, NY, USA). Descriptive analysis was conducted for demographics and was presented as number, percentage, mean, and standard deviation as appropriate. The baseline characteristics, demographics, and comparisons of the variables in the IMT and control groups were analyzed using chi-square test for categorical variables and Mann–Whitney U test for continuous variables. Wilcoxon signed-rank test was used to analyze and compare the respective changes in the IMT group and control group during the study period. A generalized estimating equations (GEE) method is a marginal semi-parametric approach that analyzes measurements repeated over time. A GEE model was utilized to analyze and compare the study variables in the IMT group and control group in order to determine the interactions and differences between the study groups and time points (T2, T3, and T4 vs. T1) and to understand the outcomes after the IMT intervention. p < 0.05 (one-tailed test) was taken to indicate statistical significance.

3. Results

A total of 31 participants was initially enrolled in this study. During the study period, a few participants were lost to follow-up or had missing data due to an inability to adapt to procedural or environmental issues during the small airway assessment (n = 2), moving from Northern Taiwan due to work (n = 1), admittance to a hospital for an unrelated condition (n = 1), and non-adherence to the return visit schedule (n = 4). Finally, 23 participants completed the study, 16 in the IMT group and 7 in the control group (Figure 2).

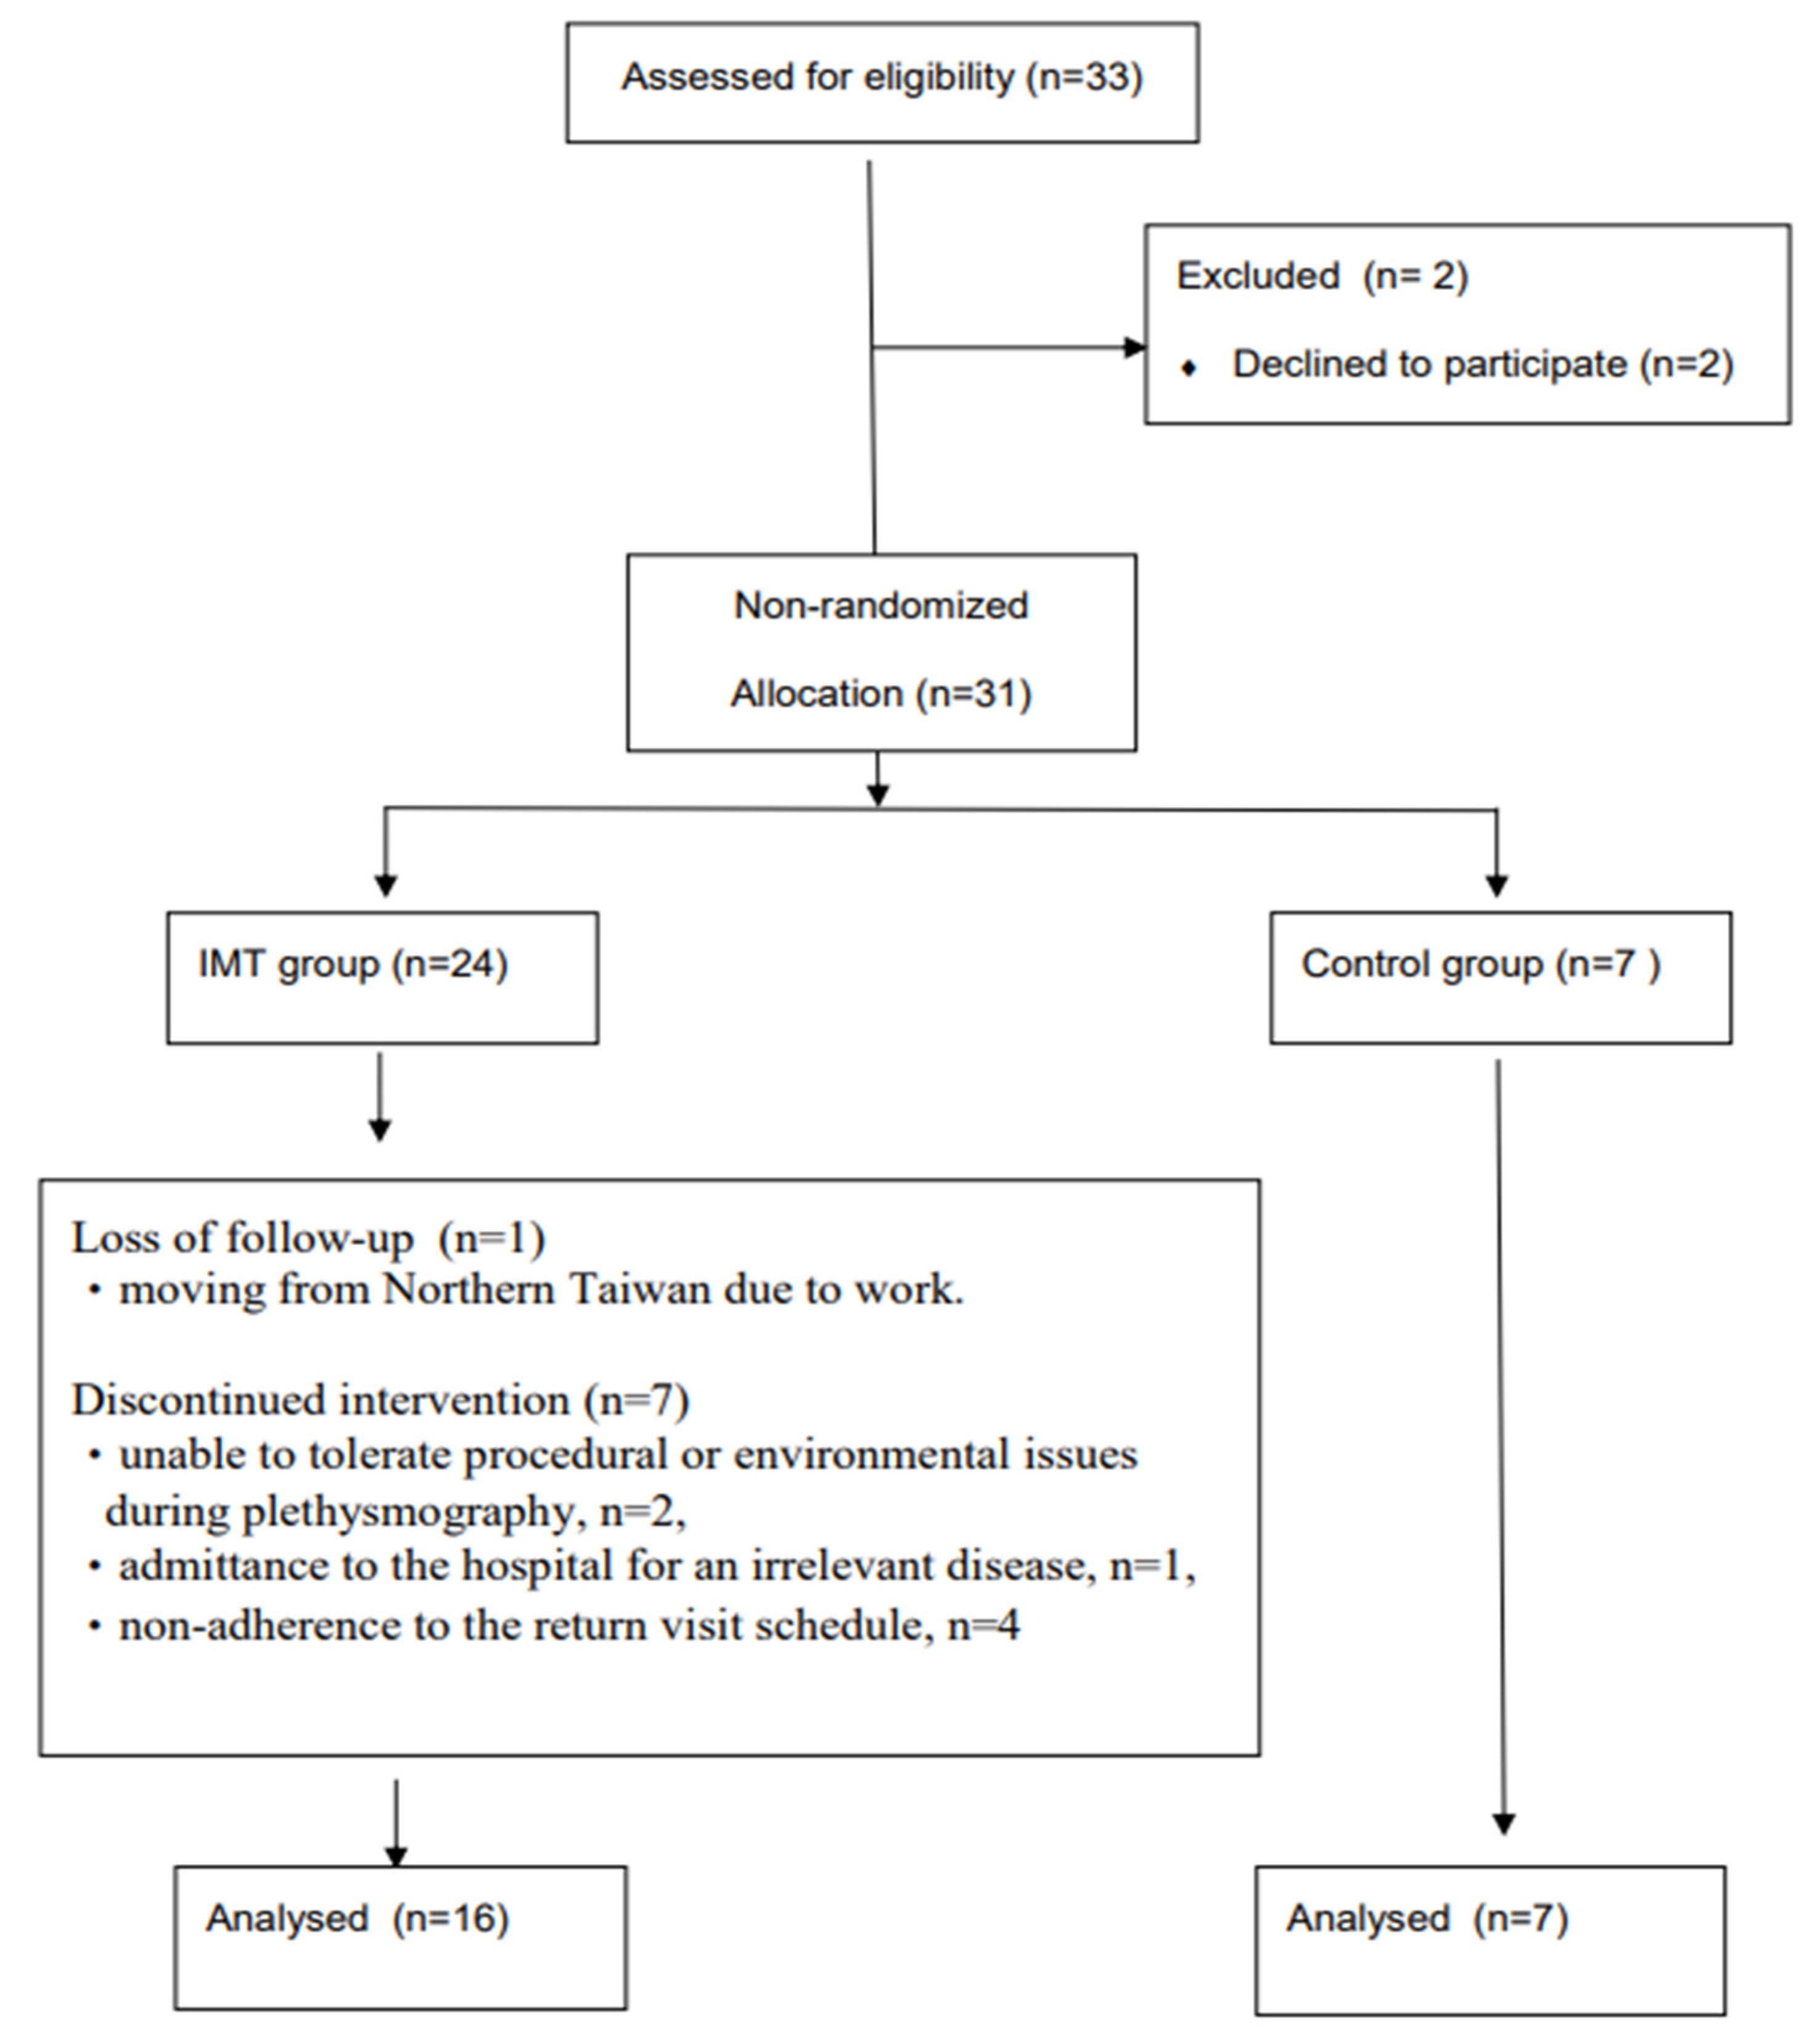
3.1. Participant Demographics

The study participants were mostly male (82.6%), and the average age was 68.29 ± 10.87 years, with a mean body mass index of 23.54 ± 4.79. Most of the study cohort had a history of smoking (56.5%), and the majority had moderate (65.2%) or severe (30.4%) airflow limitations. The most common medications in use were long-acting β2 agonists (LABAs)/long-acting muscarinic antagonists (LAMAs), inhaled corticosteroids (ICSs)/LABAs, or ICSs/LAMAs/LABAs (26.1% each). The mean number of acute exacerbations experienced in the previous year was 1.61 ± 1.95 for the total cohort, with numerically more participants in the IMT group than in the control group having ≥2 exacerbations per year (50% vs. 14.3%, p = 0.176) (Table 1). No statistically significant differences in the demographic data were noted between the two groups.

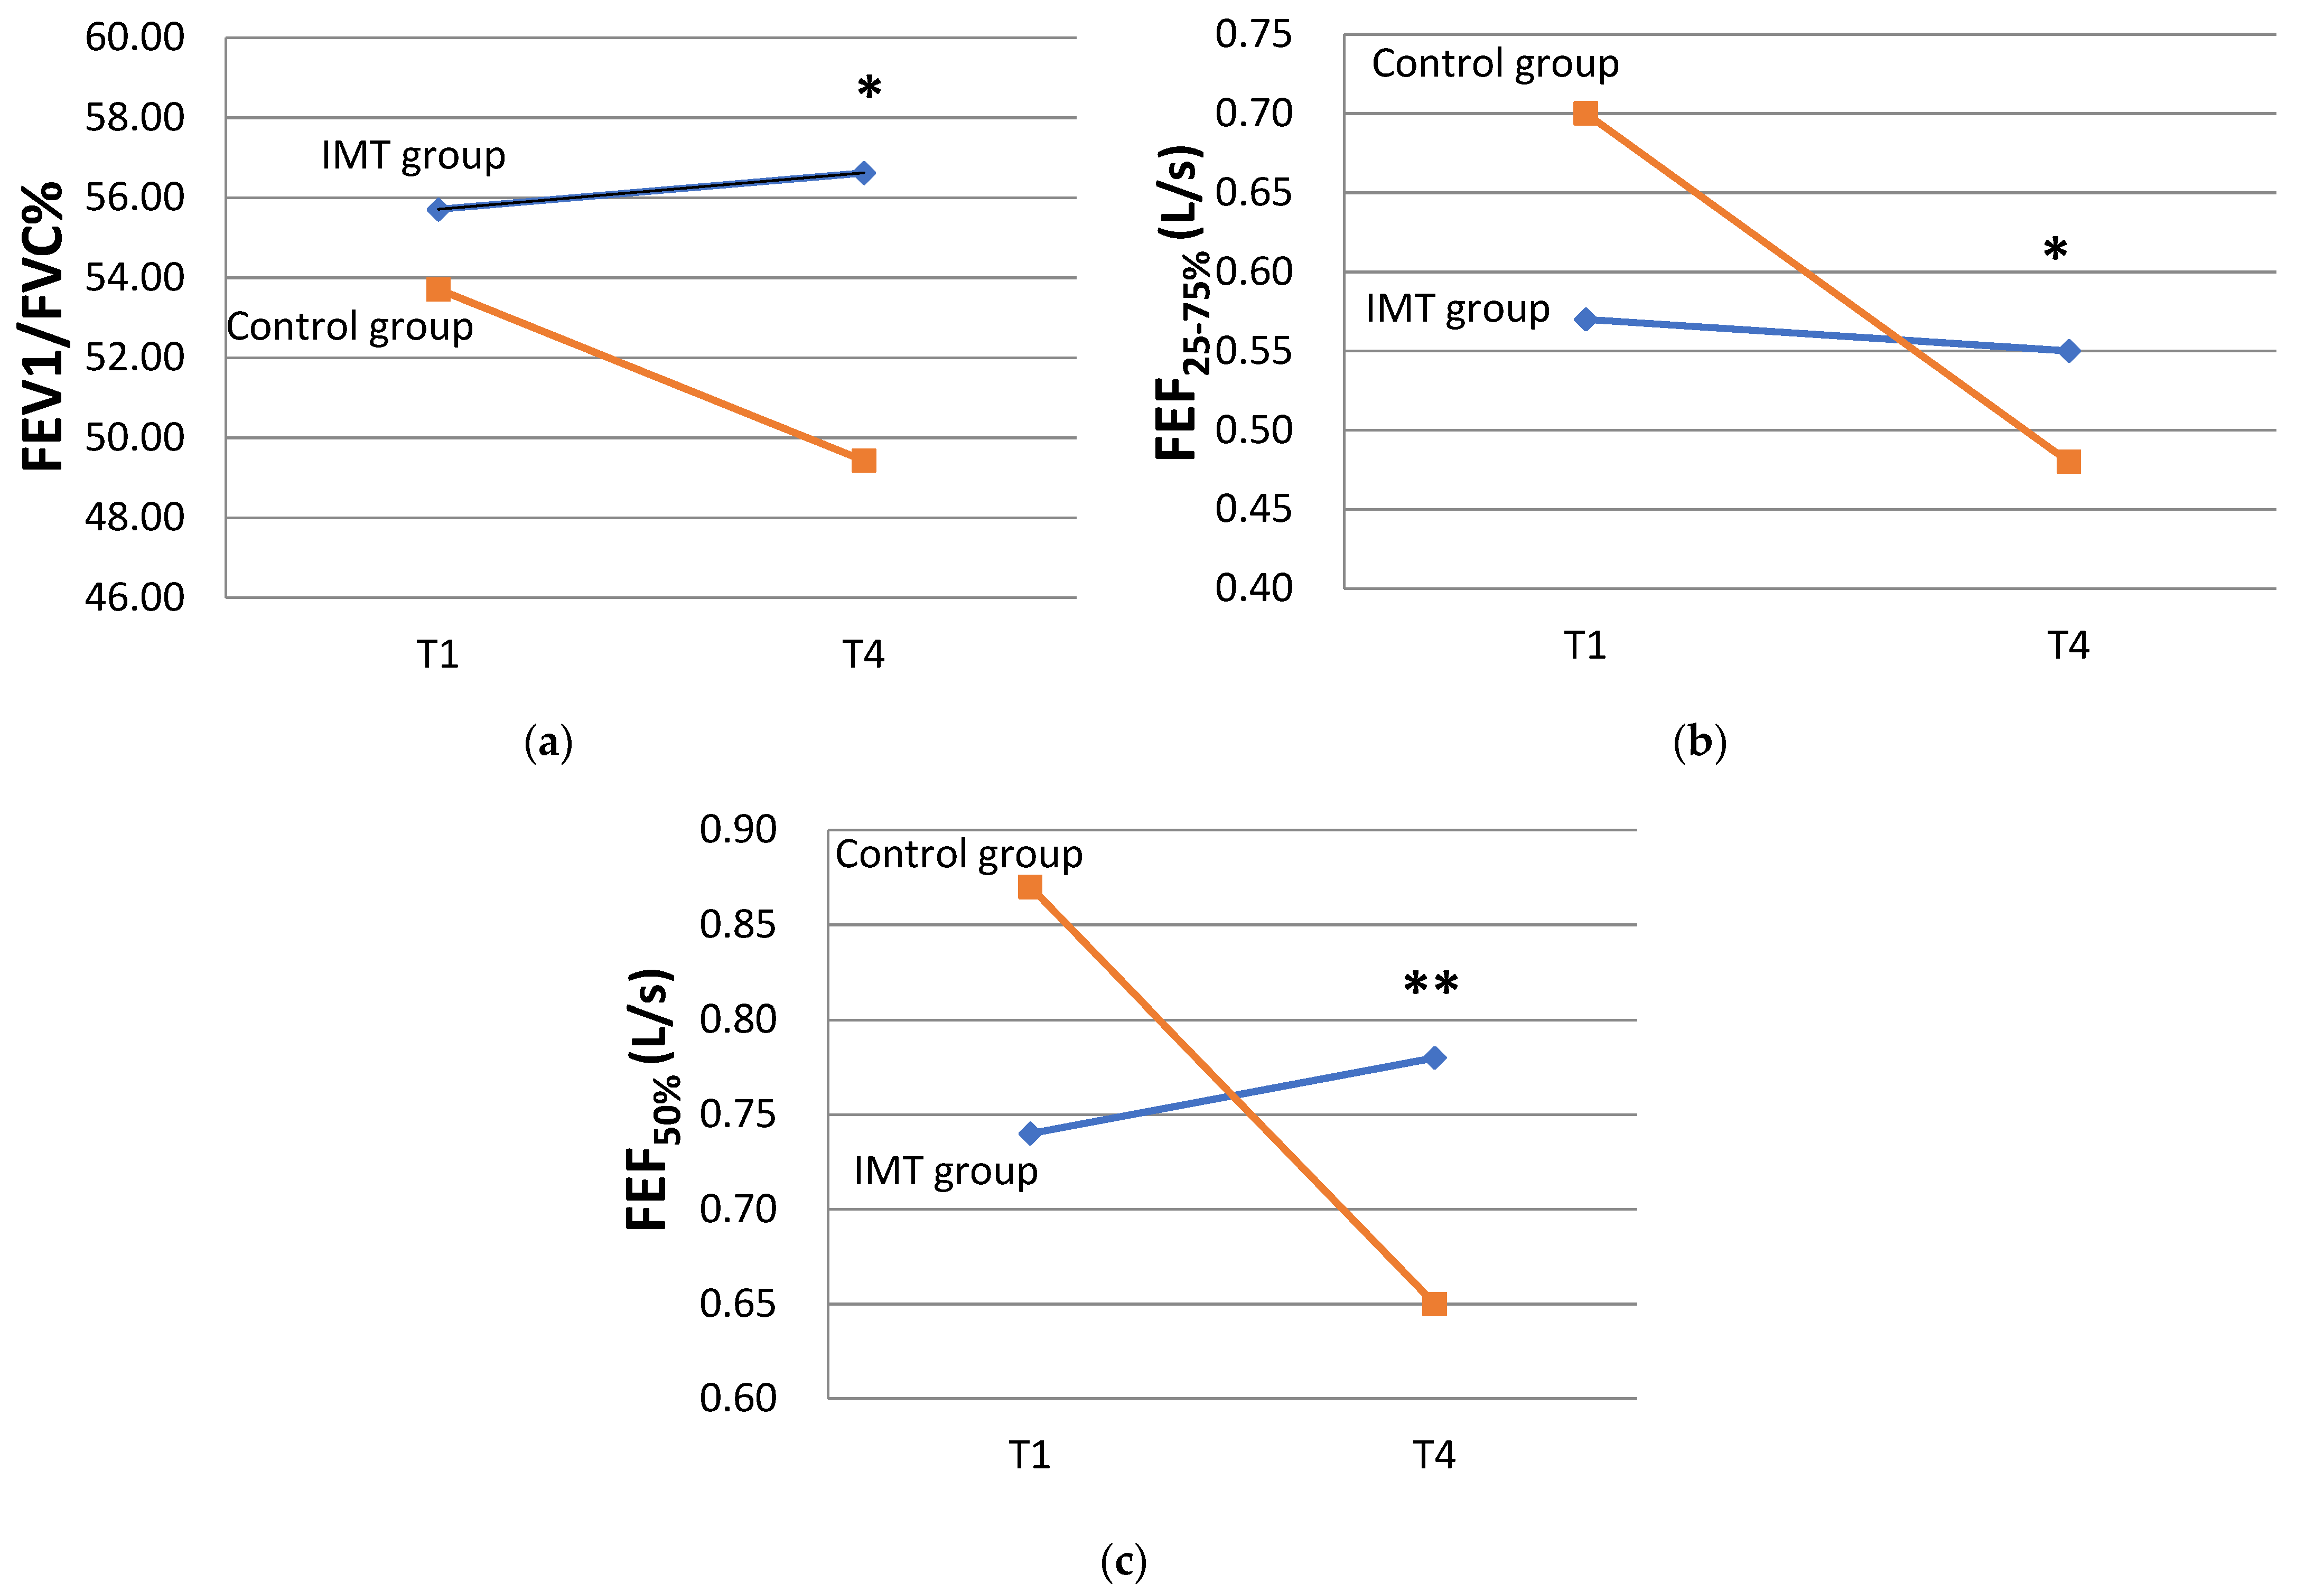
3.2. Effects of IMT on Lung Function in COPD Participants

The study variables representing the pulmonary volume, gas diffusion capacity of the lung, and post-bronchodilator expiratory flow of the IMT and control groups at baseline (T1) and at the study endpoint (T4) are shown in Table 2. After 12 weeks of training, the expiratory flow of the VC (2.42 ± 0.73 L (T4) vs. 2.09 ± 0.47 L (T1), p = 0.011) and ERV (0.90 ± 0.41 L (T4) vs. 0.56 ± 0.38 L (T1), p = 0.012) was significantly more than at baseline in the IMT group. In the control group, the expiratory flow of the FVC (2.61 ± 0.51 L (T4) vs. 2.35 ± 0.44 L (T1), p = 0.043), FEV1/FVC% (48.00 ± 14.36% (T4) vs. 54.00 ± 11.76% (T1), p = 0.027), FEF25–75% (0.49 ± 023 L/s (T4) vs. 0.71 ± 0.40 L/s (T1), p = 0.018), post-bronchodilator FEF25–75% (0.48 ± 0.22 L/s (T4) vs. 0.70 ± 0.33 L/s (T1), p = 0.018), and FEF50% (0.65 ± 0.35 L/s (T4) vs. 0.87 ± 0.51 L/s (T1), p = 0.018) statistically significantly changed from T1 to T4. None of the other variables of lung function (body plethysmography or spirometry) showed statistical significance regarding changes in either group.
In order to avoid bias resulting from the differences in small airway function observed between the two groups at baseline, the GEE model was used to analyze and compare the individual variables of the groups (IMT group and control group) between the study endpoint (T4) and baseline (T1). The analysis of the time points shown in Table 3 indicated that the change in the regression coefficient of FEV1/FVC% between T4 and T1 was statistically significant (B coefficient [95% Wald confidence interval] of −4.29 [−7.24 to −1.33], p = 0.004), suggesting that the total study cohort’s FEV1/FVC% at 12 weeks decreased by 4.29% compared with that at baseline. The interaction between the study groups and study time points showed that the regression coefficient of the interaction variable of IMT × (T4–T1) for FEV1/FVC% was statistically significant (B = 5.21 [0.46 to 9.96], p = 0.032), with FEV1/FVC% after 12 weeks of intervention significantly increasing by 5.21% in the IMT group compared with the control group (Figure 3). The regression coefficients for the changes in FEF25-75% and FEF50% between T4 and T1 were also statistically significant (FEF25–75%: −0.22 [−0.32 to −0.12] L/s, p < 0.001) (FEF50%: −0.22 [−0.36 to −0.09] L/s, p < 0.001), showing that the total study cohort’s FEF25–75% and FEF50% at 12 weeks decreased by 0.22 L/s compared to those at baseline. The interaction between the study groups and study time points showed that the FEF25–75% and FEF50% were statistically significant (FEF25–75%: 0.20 [0.04 to 0.35] L/s, p = 0.012) (FEF50%: 0.26 [0.08 to 0.43] L/s, p = 0.004), demonstrating that FEF25–75% and FEF50% significantly increased in the IMT group after 12 weeks of intervention compared with those in the control group (Figure 3). None of the other interaction variables showed statistical significance regarding changes in lung function.

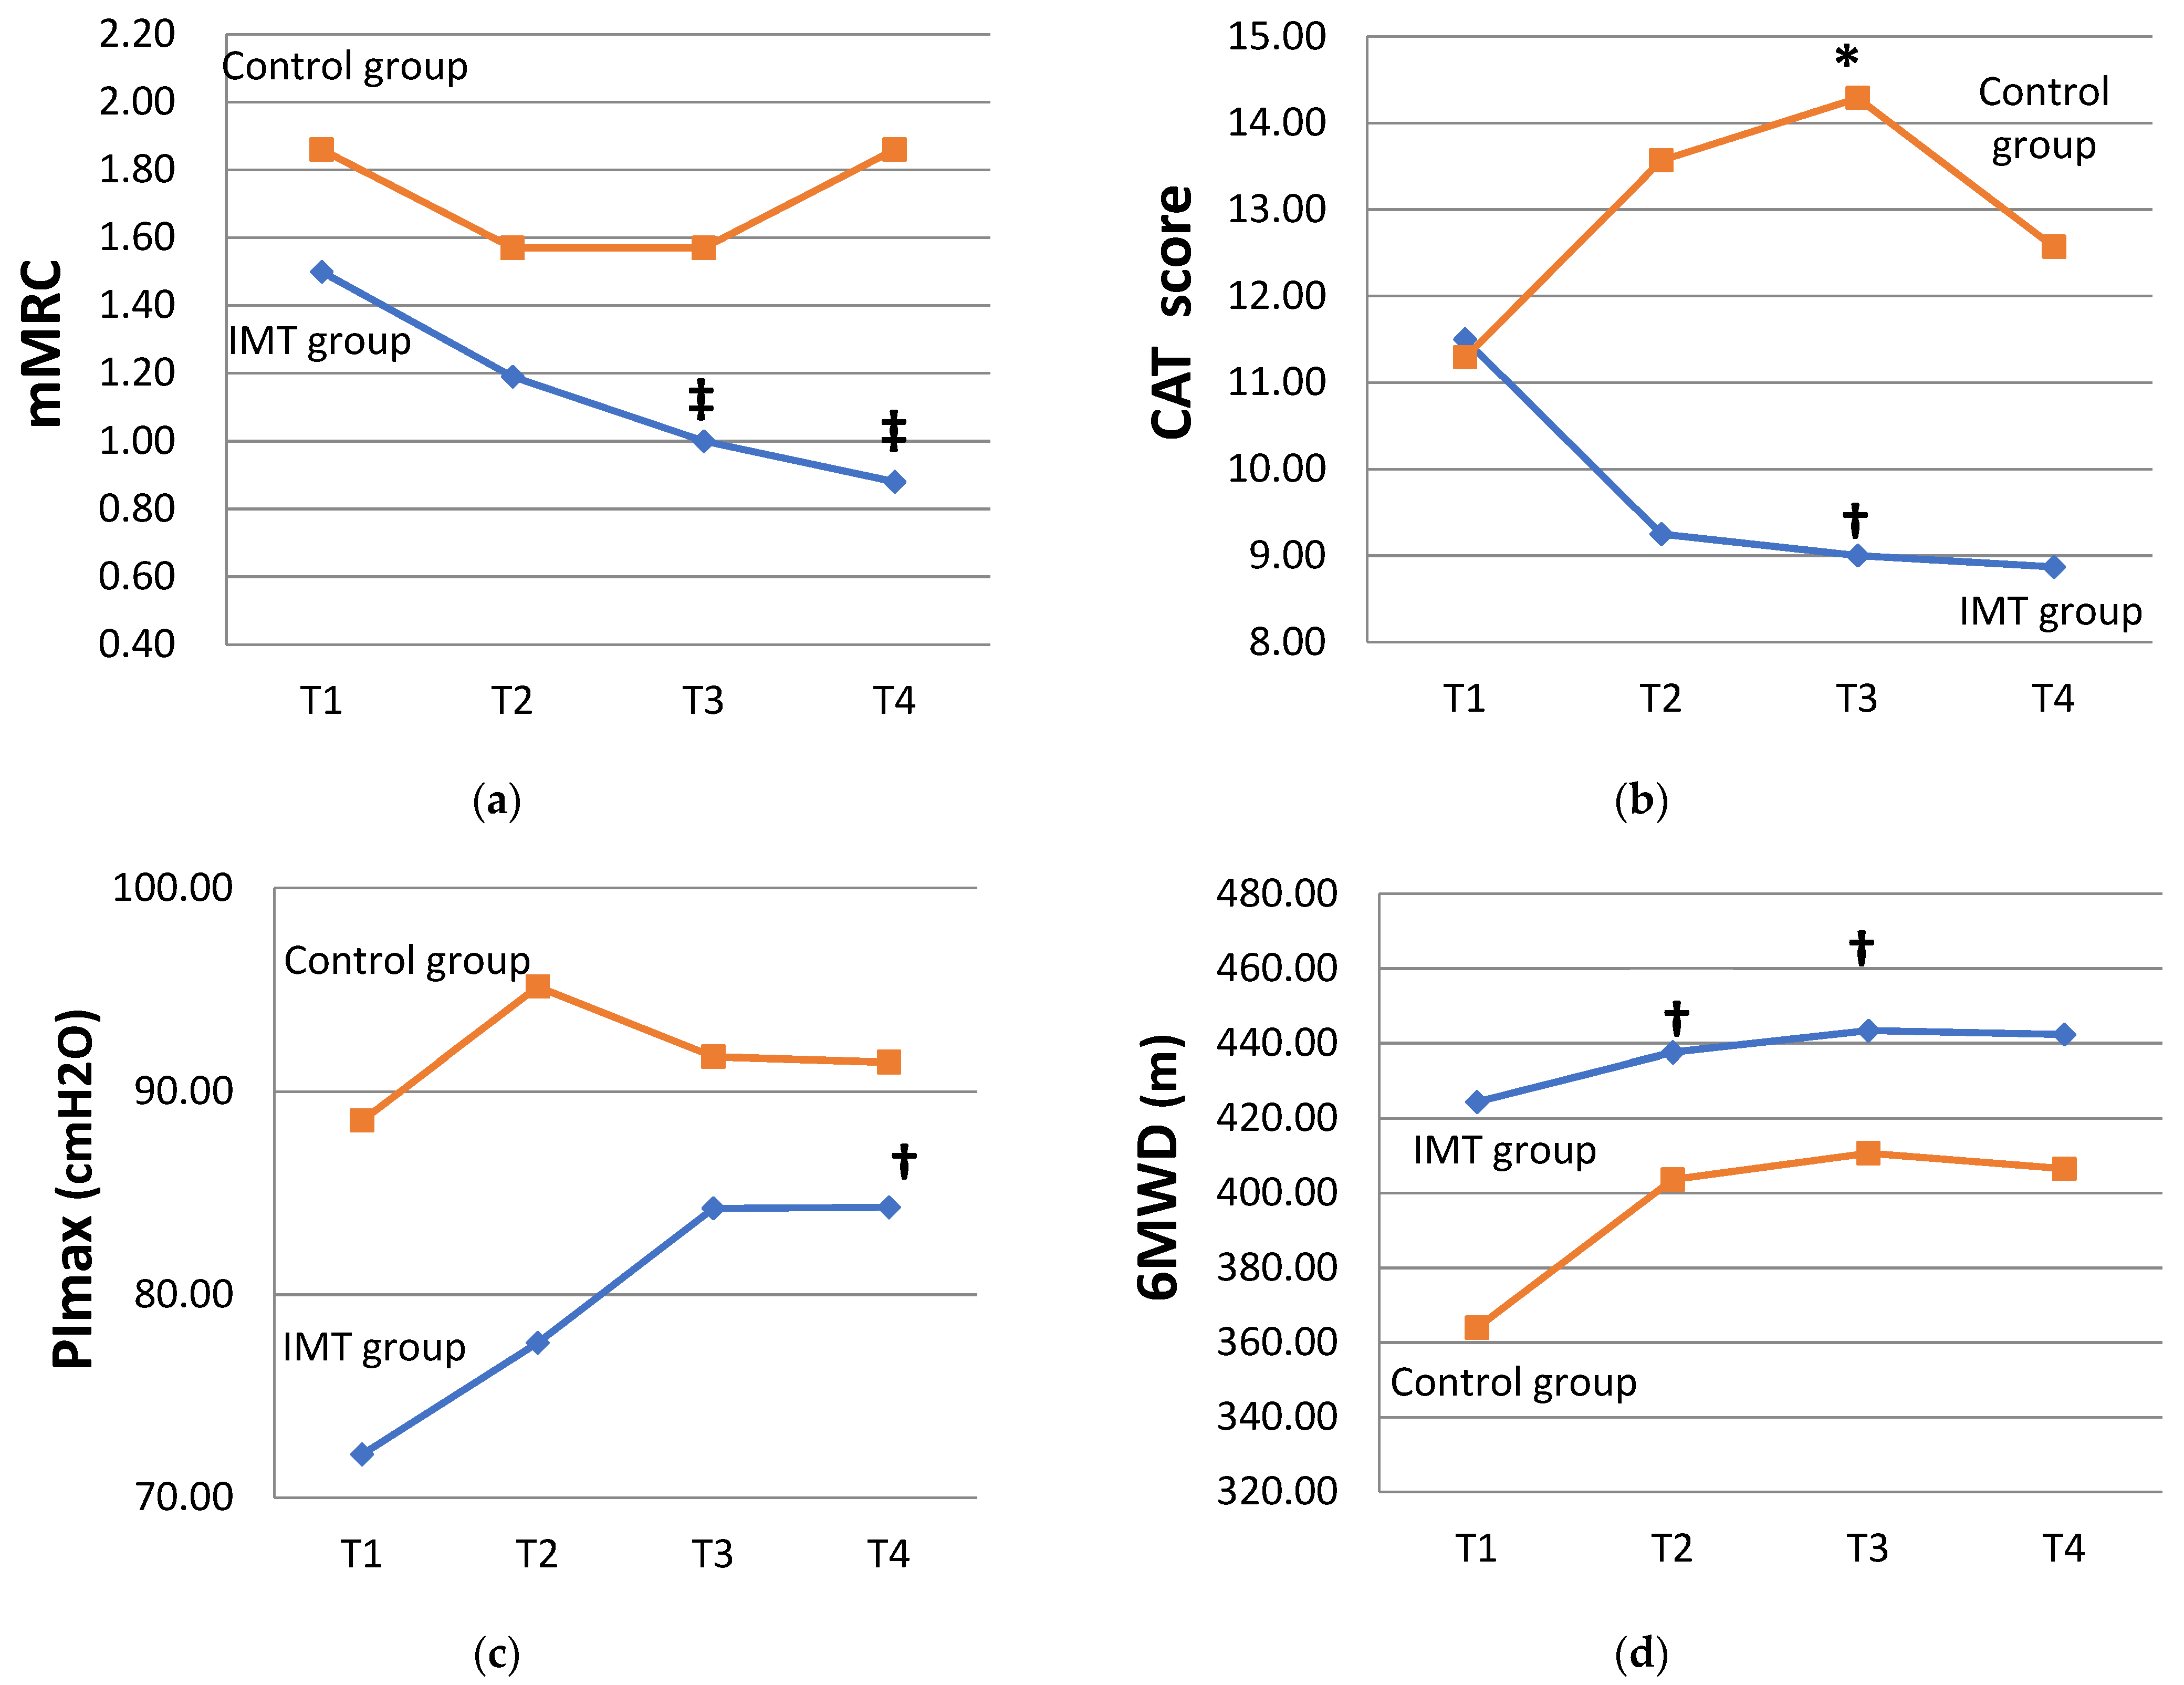
3.3. Effects of IMT on Disease-Associated Symptoms in COPD Participants

The comparison of the individual variables at different time points within the IMT group and control group (Table 2) showed that the mMRC grade in the IMT group decreased over time and that, at T3 and T4, it was significantly lower than that at T1, respectively (1.00 ± 0.52 (T3) vs. 1.50 ± 0.63 (T1), p = 0.005; 0.88 ± 0.62 (T4) < T1, p = 0.008). In the control group, no statistically significant differences were noted in the mMRC scale. This result indicates that the dyspnea during daily activities in the IMT group significantly improved as the training program progressed, and the benefit was readily observable at eight weeks, with a continuous improvement throughout the intervention period. The CAT score decreased from scores of 11.50 ± 6.16 (T1) to scores of 8.88 ± 6.54 (T4) in the IMT group, and T3 was significantly lower than T1 (9.00 ± 6.07 scores (T3) < T1, p = 0.032); however, it increased from scores of 11.29 ± 9.01(T1) to scores of 12.57 ± 10.47 (T4) in the control group, illustrating that the impact of the symptoms on the participants’ quality of life improved in the IMT group (Figure 4), with a mean CAT score of > 10 prior to the intervention, progressing to ≤10 after 12 weeks of intervention. In contrast, the CAT scores in the control group increased over time and were >10 points at both study time points. Changes in PImax (84.31 ± 23.72 cmH2O (T4) vs. 72.13 ± 26.75 cmH2O (T1), p = 0.011) also showed statistical significance, demonstrating that PImax significantly increased after 12 weeks of training in the IMT group (Figure 4). Additionally, in the IMT group, the 6MWDs at T2 and T3 (437.63 ± 64.74 m (T2) vs. 424.44 ± 66.40 m (T1), p = 0.012; 443.38 ± 59.07 m (T3) > T1, p = 0.017) were significantly improved compared to those at baseline (Figure 4), suggesting that the benefit of enhanced exercise endurance was readily observable at four weeks, with continuous improvement at both week 4 and week 8. In the control group, no statistically significant differences were noted in PImax or the 6MWD during the study period.
Although the resting heart rate (RHR) was significantly higher in the IMT group than in the control group at the study baseline, it decreased over time in the IMT group (80.13 ± 10.23 bpm (T4) vs. 87.56 ± 13.04 bpm (T1), p = 0.011), but the RHR significantly increased from baseline to week 12 (79.86 ± 10.42 bpm (T4) vs. 70.71 ± 12.83 bpm (T1), p = 0.028) in the control group (Figure 5). PEmax was not analyzed in the current study, as it fell outside of the detection range (>120 cmH2O) in some participants.
The GEE model was utilized to compare the changes in the two study groups during the study period and to understand the outcomes after the IMT intervention. As shown in Table 3, the regression coefficient of IMT × (T3–T1) for the changes in the CAT scores was statistically significant (−5.50 [−10.31 to −0.695] scores, p = 0.025), indicating that the impact of the disease symptoms on the participants’ quality of life further improved by 5.50 points in the IMT group compared with the control group at week 8 (Figure 4). The regression coefficient of the study group for the changes in RHR was statistically significant at baseline (p = 0.002), showing that RHR in the two groups was not comparable. After eliminating the non-comparability of RHR between the two groups at baseline, the change in the RHR between T3 and T4 was statistically significant (7.00 [2.37 to 11.64] bpm (T3), p = 0.003; 9.14 [3.82 to 14.46] bpm (T4), p = 0.001), suggesting that the total study cohort’s RHR at 8 weeks increased by 7 bpm and that, at 12 weeks, it increased by 9.14 bpm compared with the value at baseline. The interaction between the study groups and study time points showed the regression coefficients of the IMT × (T3–T1) and IMT × (T4–T1) interaction variables were statistically significant (IMT × (T3–T1) of −10.88 [−18.22 to −3.53] bpm, p = 0.004; IMT × (T4–T1) of −16.58 [−23.51 to −9.65] bpm, p < 0.001), indicating that the changes in RHR achieved at 8 weeks and 12 weeks in the IMT group were significantly lower than those in the control group by 10.88 bpm and 16.58 bpm, respectively (Figure 5). The 6MWD and PImax were significantly increased after training in the IMT group compared to those at baseline, but none of the changes in the 6MWD and PImax achieved a statistically significant difference between the two groups.

4. Discussion

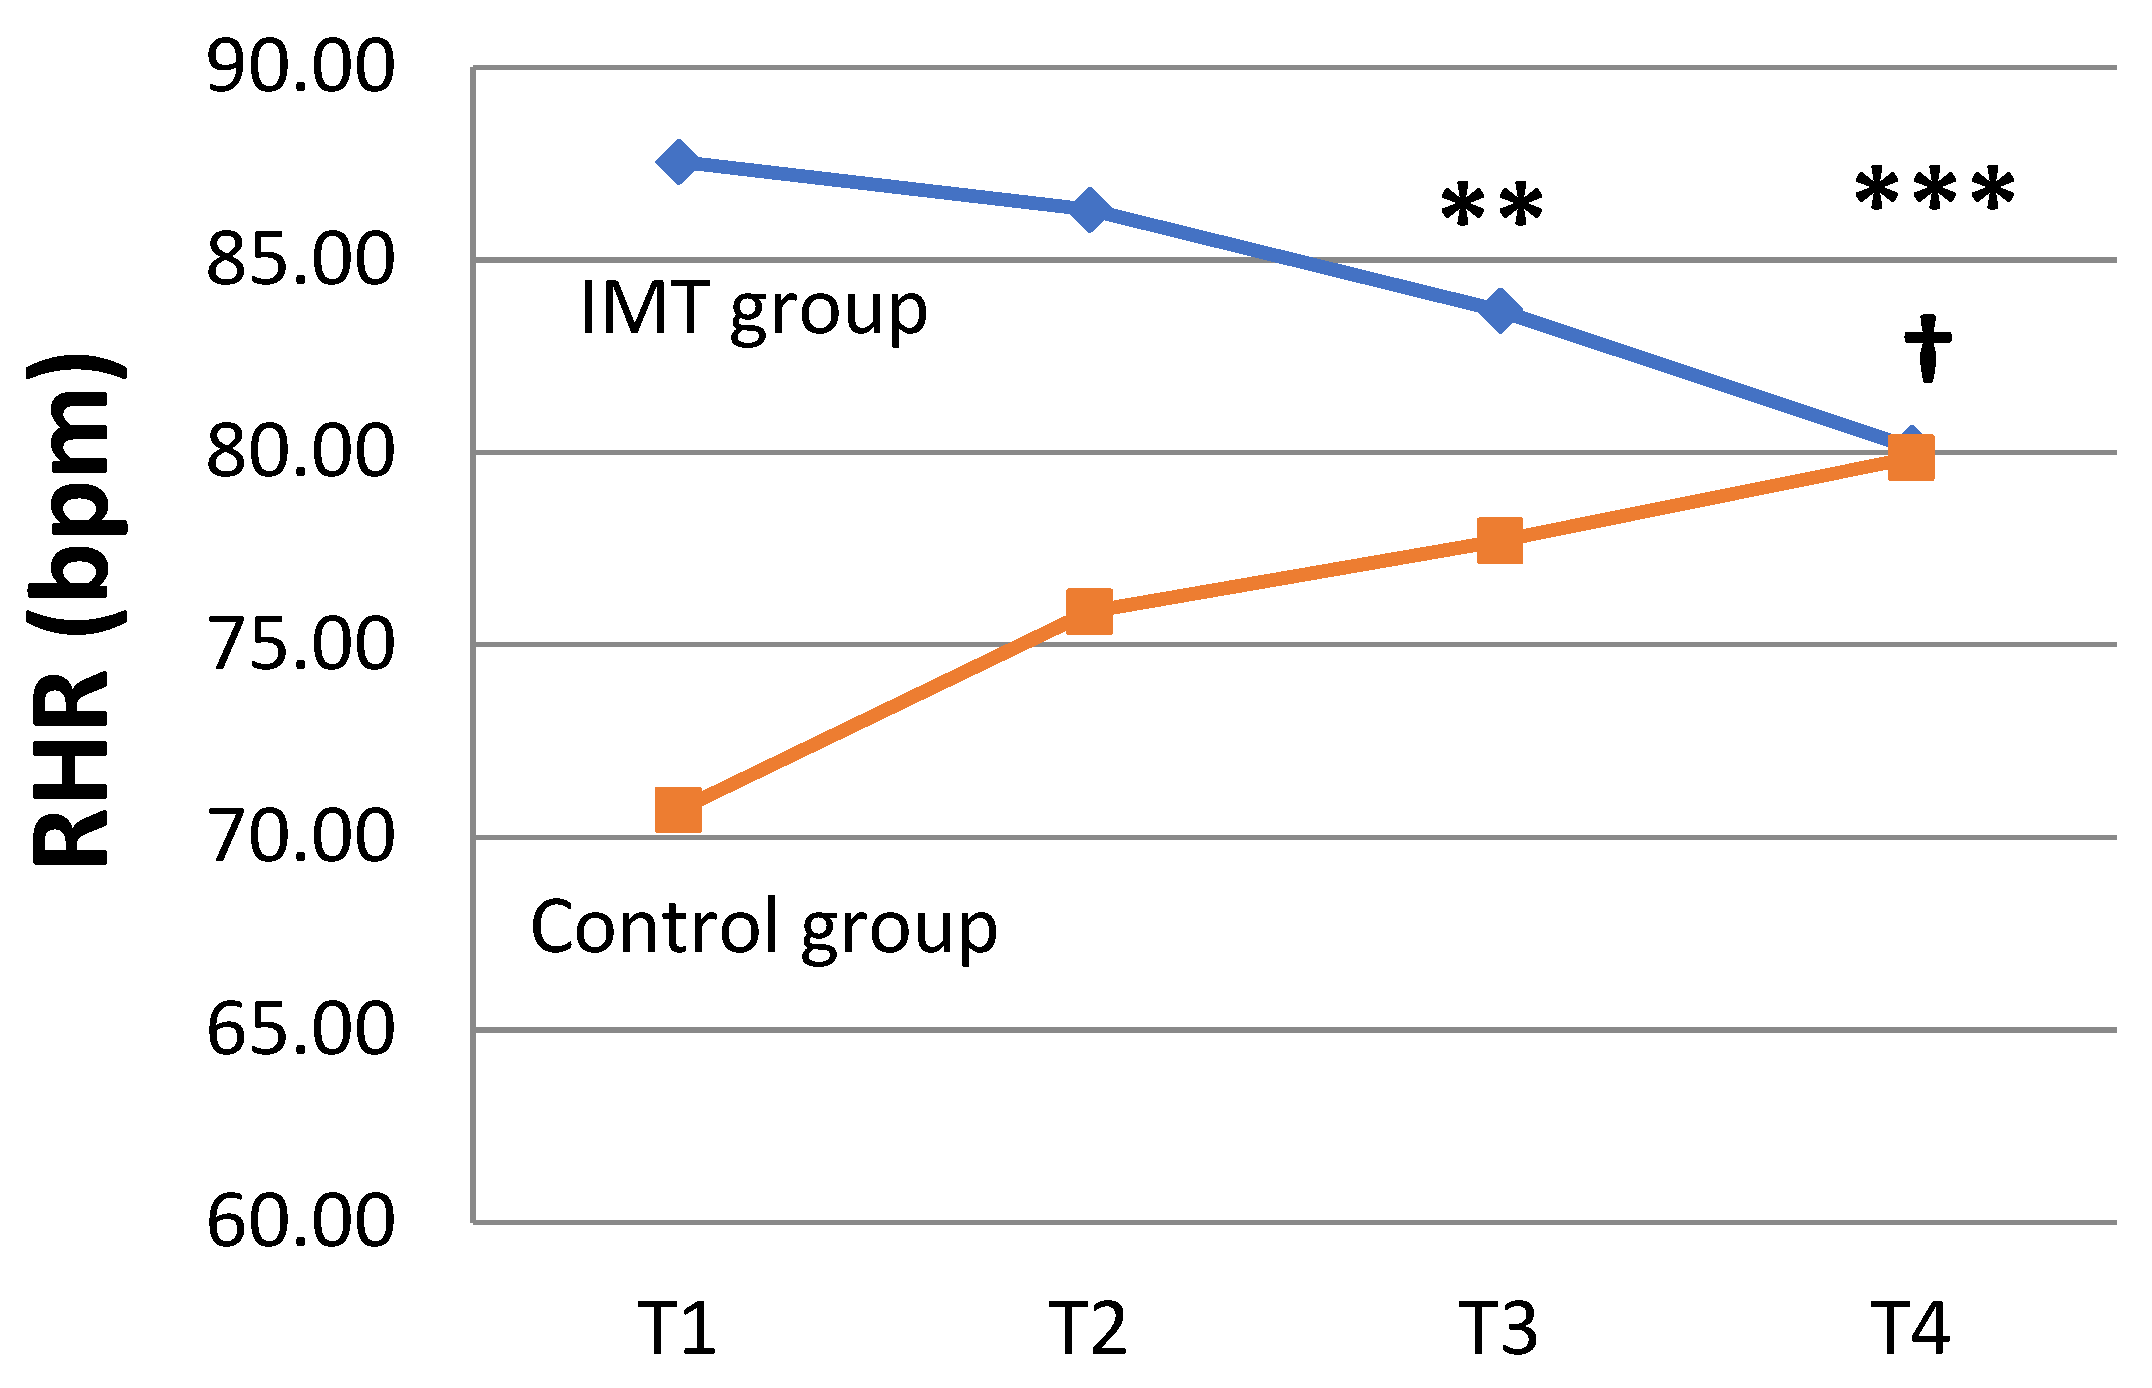
4.1. Beneficial Effects of IMT on Lung Function and Heart Rate in COPD Participants

The small airway function assessments in the present study found that the alveolar gas diffusion, airway obstruction, and small airway airflow limitations in the COPD participants tended to deteriorate with time. When analyzing the interactional effects between the study groups and the study time points, post-bronchodilator FEV1/FVC%, FEF25–75%, and FEF50% all showed significant improvements in the IMT group compared with the control group. Spirometry has been commonly utilized to evaluate lung function in past studies on IMT. Past studies showed variable results: Basso-Vanelli et al. [8] investigated an IMT program that involved a 21 min session each day for four consecutive months in 13 COPD patients, but they found that FEV1/FVC%, FEV1, and FVC were not significantly different after training. Mehani [34] evaluated a training strategy using 15–60% PImax three times per week for two months in 20 elderly patients with moderately severe COPD. They found that FEV1, FVC, predicted FEV1%, and predicted FVC% were significantly increased from baseline after the IMT. A FEV1/FVC% of < 0.70 is an indicator for a COPD diagnosis, suggesting limited expiratory airflow [1]. FEF reflects the severity of the airway obstruction, and decreases in FEF25-75% and FEF50% may be a result of small airway obstruction [31]. Distal expiratory flows, such as the forced expiratory flow at 50% FVC (FEF50), are important functional parameters for diagnosing small airway disease [35]. The results of the present study suggest that IMT could ameliorate the airway obstruction progression that occurs with COPD. Body plethysmography can effectively differentiate the COPD severity, which may be a supportive method for assessing the lung function of stable COPD patients [36]. Although this study found no differences in the parameters of body plethysmography in the participants, this may be because the study period was only 12 weeks and not the required long-term training and follow-up of the changes in small airway function.
The assessment of the heart rate has been used as a marker of health [37]. Having a lower RHR is usually a sign of good health and could therefore be a marker of a healthy lifestyle [38]. A decrease in RHR after exercise training may indicate enhanced cardiopulmonary endurance [39]. Conversely, a high RHR is associated with disease and adverse events [37], and the complications associated with a high rate include lower energy levels, low physical fitness, reduced blood circulation, etc. In the present study, at 8 and 12 weeks, the participants’ RHR significantly increased from baseline in the study cohort, suggesting that physical fitness decreases with time and that small airway airflow limitations tend to lower energy levels over time, leading to an RHR increase in stable COPD patients. In contrast, the RHR of the IMT group was significantly reduced from baseline, and it especially significantly decreased compared with the control group at 8 and 12 weeks. IMT could improve exercise performance and airway obstruction, which may lead to enhanced cardiopulmonary endurance. Home-based IMT perhaps can enhance the physical health of stable COPD patients.

4.2. Beneficial Effects of IMT on Disease-Associated Symptoms of COPD Participants

Dyspnea is the most common symptom in patients with COPD [40]. Improving dyspnea is a major goal when treating COPD patients [14]. A systematic review and meta-analysis by Figueiredo et al. [19] found that isolated IMT for patients with COPD showed no improvement in dyspnea or their quality of life. Another systematic review and meta-analysis by Beaumont et al. [14] found that dyspnea was significantly decreased during IMT sessions, but COPD patients without a weakness in their inspiratory muscles (PImax > 60 cmH2O) had a significant decrease in the IMT group compared with the control group. In this current study, we found that the participants (PImax > 60 cmH2O) experienced improvements in dyspnea after eight weeks of training in the IMT group, and this beneficial effect continued throughout the study period. Meanwhile, the CAT scores were improved from being more symptomatic (≥10 points) prior to training to less symptomatic (<10 points) after training, and these changes were greater in the IMT group than in the control group. This difference is indicative of the beneficial effects of home-based IMT in improving dyspnea and symptoms in patients with COPD as well as their quality of life. The results were similar to the previous study’s results [14]. The current study found that PImax and 6MWD were significantly increased after training in the IMT group, indicating enhanced exercise performance and greater inspiratory muscle strength. Peripheral muscle weakness can lead to an impaired exercise capacity in COPD patients [11]. Therefore, IMT can help COPD patients improve their inspiratory muscle strength as well as their exercise performance. To sum up the above findings, home-based IMT is beneficial for dyspnea and disease-associated symptoms in stable COPD patients, their quality of life, and their exercise capacity. These results were in concordance with the previous publications showing that IMT improved the inspiratory muscle strength and exercise endurance in COPD patients and positively impacted both their breathlessness and quality of life [9,10,14,16]. Although PImax and 6MWD were significantly improved from baseline after training in the IMT group, only a trend of improvement in the IMT group compared with the control group was noted.
Chronic obstructive pulmonary disease is a heterogeneous lung disease caused by gene–environment interventions, and it occurs throughout an individual’s lifetime. COPD is characterized by chronic respiratory symptoms due to abnormalities in the airways and/or alveoli [1]. The alleviation of dyspnea symptoms is a key objective highlighted across COPD guidelines. The first step is to optimize the bronchodilator therapy to improve the respiratory mechanics and muscle function, thus increasing the exercise capacity [40]. The strength of this study was the demonstration of the beneficial effects of home-based IMT in enhancing the post-bronchodilator airflow in the small airways in association with reduced disease-associated symptoms. Moreover, the IMT device is lightweight and easy to carry, facilitating its use by COPD patients in the home setting. For COPD patients who cannot receive physical rehabilitation regularly at healthcare institutions or who cannot perform whole-body exercise endurance training, IMT is a method that may be considered and promoted for pulmonary rehabilitation.
This study’s participants were mostly male, the average age was over 65 years, and most of them had a history of smoking. These characteristics were consistent with the findings in the previous studies in which smoking, a male sex, and an older age were the characteristics of COPD patients [23]. In older adults, sarcopenia may reflect the impaired muscle quality. Cigarette smoking, low physical activity, poor diet, and older age are risk factors shared by COPD and sarcopenia that have been identified [41]. While sarcopenia may contribute to inspiratory muscle weakness, the participants in this study had an average BMI that was within the normal range. Future studies may be considered to include a nutrition assessment of the COPD patients to understand the relationship between home-based IMT, nutritional status, inspiratory muscle strength, and small airway function.
The total number of participants in this study was small, which did not meet the required sample size for estimation. Therefore, the power of this study was calculated from the results of the study. Based on the main goal of the treatment of COPD patients being to relieve the symptoms of dyspnea [1], in this study, the results of four times the mMRC dyspnea scale in the IMT group were used to calculate the power. The observed power was calculated using the repeated measures of the general linear model, and the least significant difference (LSD) was used to compare the main effect. The results showed that the test power of the mMRC was 0.957, indicating that the results of this study had a good effect size. The limitations of this study were the relatively small sample size, the characteristics of the participant demographics, the specific geographic region, and the single medical center without the generalizability of the findings to a broader population of COPD patients. More research is required in the future to document the benefits of home-based IMT regarding small airway function improvement in patients with COPD.

5. Conclusions

In stable COPD participants with at least moderate disease severity, 12-week home-based IMT may improve the post-bronchodilator air flow in the small airways and ameliorate disease-associated symptoms. This training modality may be a choice for home-based pulmonary rehabilitation programs.

Author Contributions

Conceptualization, H.-C.L., H.-E.L. and W.C.; methodology, H.-C.L. and W.C.; validation, P.-J.C. and W.C.; formal analysis, W.C.; investigation, H.-C.L., P.-J.C. and W.C.; data curation, H.-E.L., P.-J.C. and W.C.; writing—original draft preparation, P.-J.C. and W.C.; writing—review and editing, P.-J.C., C.-Y.H. and W.C.; visualization, P.-J.C. and W.C.; supervision, H.-C.L., H.-E.L. and P.-J.C.; project administration, W.C.; funding acquisition, W.C. All authors have read and agreed to the published version of the manuscript.

Funding

The authors thank the research funding provided by Chang Gung Memorial Hospital Linkou Main Branch, Taiwan, R.O.C. (grant no CMRPF3E0111).

Institutional Review Board Statement

The study was conducted in accordance with the Declaration of Helsinki and was approved by the Institutional Review Board of the Chang Gung Medical Foundation (IRB-approved number: 103-4903B).

Informed Consent Statement

Informed consent was obtained from all the subjects involved in this study.

Data Availability Statement

Any data related to this study can be provided upon a reasonable request.

Acknowledgments

The authors would like to thank the working members of the Pulmonary Recovery Center of Chang Gung Memorial Hospital.

Conflicts of Interest

The authors declare no conflict of interest.

References

  1. Agusti, A.; Beasley, R.; Celli, B.R.; Criner, G.; Halpin, D.; Varela, M.V.; Montes de Oca, M.; Mortimer, K.; Salvi, S.; Vogelmeier, C.; et al. Pocket Guide to COPD Diagnosis, Management, and Prevention. A Guide for Health Care Professional; Global Initiative for Chronic Obstructive Lung Disease: Deer Park, IL, USA, 2023. [Google Scholar]
  2. Rabe, K.F.; Hurd, S.; Anzueto, A.; Barnes, P.J.; Buist, S.A.; Calverley, P.; Fukuch, Y.; Jenkins, C.; Rodriguez-Roisin, R.; Well, C.; et al. Global Strategy for the Diagnosis, Management, and Prevention of Chronic Obstructive Pulmonary Disease. Am. J. Respir. Crit. Care Med. 2007, 176, 532–555. [Google Scholar] [CrossRef] [PubMed]
  3. Riley, C.M.; Sciurba, F.C. Diagnosis and Outpatient Management of Chronic Obstructive Pulmonary Disease: A Review. JAMA 2019, 321, 786–797. [Google Scholar] [CrossRef]
  4. Usmani, O.S.; Barnes, P.J. Assessing and treating small airways disease in asthma and chronic obstructive pulmonary disease. Ann. Med. 2012, 44, 146–156. [Google Scholar] [CrossRef] [PubMed]
  5. Brusasco, V.; Barisione, G.; Crimi, E. Pulmonary physiology: Future directions for lung function testing in COPD. Respirology 2015, 20, 209–218. [Google Scholar] [CrossRef] [PubMed]
  6. Criée, C.P.; Sorichter, S.; Smith, H.J.; Kardos, P.; Merget, R.; Heise, D.; Berdel, D.; Köhler, D.; Magnussen, H.; Marek, W.; et al. A Body plethysmography—Its principles and clinical use. Respir. Med. 2011, 105, 959–971. [Google Scholar] [CrossRef]
  7. Agustí, A.; Vogelmeier, C.; Faner, R. COPD 2020: Changes and challenges. Am. J. Physiol. Lung Cell Mol. Physiol. 2020, 319, L879–L883. [Google Scholar] [CrossRef]
  8. Basso-Vanelli, R.P.; Di Lorenzo, V.A.P.; Labadessa, I.G.; Regueiro, E.M.; Jamami, M.; Gomes, E.L.; Costa, D. Effects of Inspiratory Muscle Training and Calisthenics-and-Breathing Exercises in COPD With and Without Respiratory Muscle Weakness. Respir. Care 2016, 61, 50–60. [Google Scholar] [CrossRef]
  9. Petrovic, M.; Reiter, M.; Zipko, H.; Pohl, W.; Wanke, T. Effects of inspiratory muscle training on dynamic hyperinflation in patients with COPD. Int. J. Chron. Obstruct. Pulm. Dis. 2012, 7, 797–805. [Google Scholar] [CrossRef]
  10. Crowe, J.; Reid, W.D.; Geddes, E.L.; O’Brien, K.; Brooks, D. Inspiratory muscle training compared with other rehabilitation interventions in adults with chronic obstructive pulmonary disease: A systematic literature review and meta-analysis. COPD 2005, 2, 319–329. [Google Scholar] [CrossRef]
  11. Gosselink, R.; Troosters, T.; Decramer, M. Peripheral muscle weakness contributes to exercise limitation in COPD. Am. J. Respir. Crit. Care Med. 1996, 153, 976–980. [Google Scholar] [CrossRef]
  12. Sahin, H.; Naz, I.; Varol, Y.; Aksel, N.; Tuksavul, F.; Ozsoz, A. Is a pulmonary rehabilitation program effective in COPD patients with chronic hypercapnic failure? Expert Rev. Respir. Med. 2016, 10, 593–598. [Google Scholar] [CrossRef] [PubMed]
  13. Riebe, D.; Ehrman, J.K.; Liguori, G.; Magal, M. ACSM’s Guidelines for Exercise Testing and Prescription, 10th ed.; American College of Sports Medicine; Wolters Kluwer Health: Philadelphia, PA, USA, 2018. [Google Scholar]
  14. Beaumont, M.; Forget, P.; Couturaud, F.; Reychler, G. Effects of inspiratory muscle training in COPD patients: A systematic review and meta-analysis. Clin. Respir. J. 2018, 12, 2178–2188. [Google Scholar] [CrossRef] [PubMed]
  15. McConnell, A.K. The role of inspiratory muscle function and training in the genesis of dyspnoea in asthma and COPD. Prim. Care Respir. J. 2005, 14, 186–194. [Google Scholar] [CrossRef]
  16. Shoemaker, M.; Donker, S.; Lapoe, A. Inspiratory muscle training in patients with chronic obstructive pulmonary disease: The state of the evidence. Cardiopulm. Phys. Ther. J. 2009, 20, 5–15. [Google Scholar] [CrossRef] [PubMed]
  17. Vázquez-Gandullo, E.; Hidalgo-Molina, A.; Montoro-Ballesteros, F.; Morales-González, M.; Muñoz-Ramírez, I.; Arnedillo-Muñoz, A. Inspiratory Muscle Training in Patients with Chronic Obstructive Pulmonary Disease (COPD) as Part of a Respiratory Rehabilitation Program Implementation of Mechanical Devices: A Systematic Review. Int. J. Environ. Res. Public Health 2022, 19, 5564. [Google Scholar] [CrossRef]
  18. Padula, C.A.; Yeaw, E. Inspiratory muscle training: Integrative review. Res. Theory Nurs. Pract. 2006, 20, 291–304. [Google Scholar] [CrossRef]
  19. Figueiredo, R.I.N.; Azambuja, A.M.; Cureau, F.V.; Sbruzzi, G. Inspiratory Muscle Training in COPD. Respir. Care 2020, 65, 1189–1201. [Google Scholar] [CrossRef]
  20. Ministry of Health and Welfare. Statistics & Publications. Taiwan: Ministry of Health and Welfare. 2022. Available online: https://dep.mohw.gov.tw/DOS/lp-5069-113-xCat-y110.html (accessed on 30 January 2023).
  21. Cheng, S.; Chan, M.C.; Wang, C.C.; Lin, C.H.; Wang, H.C.; Hsu, J.Y.; Hang, L.W.; Chang, C.J.; Perng, D.W.; Yu, C.J. COPD in Taiwan: A National Epidemiology Survey. Int. J. Chron. Obstruct. Pulm. Dis. 2015, 10, 2459–2467. [Google Scholar] [CrossRef]
  22. Ministry of Health and Welfare. Statistics & Publications Taiwan: Ministry of Health and Welfare. Available online: https://dep.mohw.gov.tw/DOS/lp-4268-113.html (accessed on 30 July 2019).
  23. Fu, S.N.; Yu, W.C.; Wong, C.K.; Lam, C.H. Prevalence of undiagnosed airflow obstruction among people with a history of smoking in a primary care setting. Int. J. Chron. Obstruct. Pulm. Dis. 2016, 11, 2391–2399. [Google Scholar] [CrossRef]
  24. Jenkins, S.C. 6-Minute walk test in patients with COPD: Clinical applications in pulmonary rehabilitation. Physiotherapy 2007, 93, 175–182. [Google Scholar] [CrossRef]
  25. Pescatello, L.S.; Arena, R.; Riebe, D.; Thompson, P.D. ACSM’s Guidelines for Exercise Testing and Prescription, 9th ed.; American College of Sports Medicine; Wolters Kluwer Health: Philadelphia, PA, USA, 2014. [Google Scholar]
  26. Kim, S.; Oh, J.; Kim, Y.I.; Ban, H.J.; Kwon, Y.S.; Oh, I.J.; Kim, K.S.; Kim, Y.C.; Lim, S.C. Differences in classification of COPD group using COPD assessment test (CAT) or modified Medical Research Council (mMRC) dyspnea scores: A cross-sectional analyses. BMC Pulm. Med. 2013, 3, 13–35. [Google Scholar] [CrossRef] [PubMed]
  27. Hsu, K.Y.; Lin, J.R.; Lin, M.S.; Chen, W.; Chen, Y.J.; Yan, Y.H. The modified Medical Research Council dyspnoea scale is a good indicator of health-related quality of life in patients with chronic obstructive pulmonary disease. Singapore Med. J. 2013, 54, 321–327. [Google Scholar] [CrossRef]
  28. Jones, P.W.; Adamek, L.; Nadeau, G.; Banik, N. Comparisons of health status scores with MRC grades in COPD: Implications for the GOLD 2011 classification. Eur. Respir. J. 2013, 42, 647–654. [Google Scholar] [CrossRef]
  29. Companies GSK. COPD Assessment Test. 2009. Available online: https://www.catestonline.org/patient-site-test-page-chinese-taiwan.html (accessed on 26 June 2017).
  30. Jones, P.; Harding, G.; Berry, P.; Wiklund, I.; Chen, W.-H.; Kline Leidy, N. Development and first validation of the COPD Assessment Test. Eur. Respir. J. 2009, 34, 648–654. [Google Scholar] [CrossRef]
  31. Kacmarek, R.M.; Stoller, J.K.; Heuer, A.J. Egan’s Fundamentals of Respiratory Care; Elsevier: Toronto, ON, Canada, 2017. [Google Scholar]
  32. Holland, A.; Spruit, M.A.; Troosters, T.; Puhan, M.A.; Pepin, V.; Saey, D.; McCormack, M.C.; Carlin, B.W.; Sciurba, F.C.; Pitta, F.; et al. An official European Respiratory Society/American Thoracic Society technical standard: Field walking tests in chronic respiratory disease. Eur. Respir. J. 2014, 44, 1428–1446. [Google Scholar] [CrossRef]
  33. Borg, G. Psychophysical bases of perceived exertion. Med. Sci. Sports Exerc. 1982, 14, 377–381. [Google Scholar] [CrossRef]
  34. Mehani, S.H.M. Comparative study of two different respiratory training protocols in elderly patients with chronic obstructive pulmonary disease. Clin. Interv. Aging 2017, 12, 1705–1715. [Google Scholar] [CrossRef]
  35. Ioachimescu, O.C.; Stoller, J.K. Assessing small airway disease in GLI versus NHANES III based spirometry using area under the expiratory flow-volume curve. BMJ Open Respir. Res. 2019, 6, e000511. [Google Scholar] [CrossRef]
  36. Tang, Y.; Zhang, M.; Feng, Y.; Liang, B. The measurement of lung volumes using body plethysmography and helium dilution methods in COPD patients: A correlation and diagnosis analysis. Sci. Rep. 2016, 6, 37550. [Google Scholar] [CrossRef] [PubMed]
  37. Jensen, M.T. Resting heart rate and relation to disease and longevity: Past, present and future. Scand. J. Clin. Lab. Investig. 2019, 79, 108–116. [Google Scholar] [CrossRef] [PubMed]
  38. Nauman, J.; Janszky, I.; Vatten, L.J.; Wisløff, U. Temporal changes in resting heart rate and deaths from ischemic heart disease. JAMA 2011, 306, 2579–2587. [Google Scholar] [CrossRef] [PubMed]
  39. Kraemer, W.J.; Fleck, S.J.; Deschenes, M.R. Exercise Physiology: Integrated from Theory to Practical Applications; Wolters Kluwer/Lippincott Williams & Wilkins Health: Philadelphia, PA, USA, 2012. [Google Scholar]
  40. O’Donnell, D.E.; Milne, K.M.; James, M.D.; de Torres, J.P.; Neder, J.A. Dyspnea in COPD: New Mechanistic Insights and Management Implications. Adv. Ther. 2020, 37, 41–60. [Google Scholar] [CrossRef] [PubMed]
  41. Lippi, L.; Folli, A.; Curci, C.; D’Abrosca, F.; Moalli, S.; Mezian, K.; de Sire, A.; Invernizzi, M. Osteosarcopenia in Patients with Chronic Obstructive Pulmonary Diseases: Which Pathophysiologic Implications for Rehabilitation? Int. J. Environ. Res. Public Health 2022, 19, 14314. [Google Scholar] [CrossRef] [PubMed]
Figure 1. The threshold IMT device.
Healthcare 11 02310 g001
Figure 2. Flow diagram from enrolment to analysis process of the study.
Healthcare 11 02310 g002
Figure 3. Changes in lung function from baseline to 12 weeks in the IMT and control groups. The interactions between two groups and the change from T1 (baseline) to T4 (12 weeks) were compared and analyzed through GEE. (a) The forced expiratory volume in 1-second-to-vital-capacity ratio (FEV1/FVC%). (b) Forced expiratory flow between 25 and 75% of the forced vital capacity (FEF25–75%). (c) Forced expiratory flow at 50% of the forced vital capacity (FEF50%). * p < 0.05 and ** p < 0.01.
Healthcare 11 02310 g003
Figure 4. Changes in disease-associated symptoms from baseline to 12 weeks in the IMT and control groups. The interactions between two groups and the change achieved between time points were compared and analyzed through GEE. The differences in the IMT group between T2 (4 weeks), T3 (8 weeks), and T4 (12 weeks) vs. T1 (baseline) were analyzed through Wilcoxon signed-rank test. (a) Modified British Medical Research Council (mMRC) dyspnea index. (b) COPD assessment test (CAT) scores. (c) Maximal inspiratory pressure (PImax). (d) The 6 min walking distance (6MWD). * p < 0.05 through GEE, † p < 0.05, and ‡ p < 0.01 vs. T1.
Healthcare 11 02310 g004
Figure 5. Changes in resting heart rate (RHR) from baseline to 12 weeks in the IMT and control groups. The interactions between two groups and the change between time points (from T1 to T2 (4 weeks), T3 (8 weeks), or T4) were compared and analyzed through GEE. ** p < 0.01 and *** p < 0.001. The differences in the IMT group at different time points vs. T1 were analyzed through Wilcoxon signed-rank test. † p < 0.05.
Healthcare 11 02310 g005
Table 1. Participant demographics of the total study cohort and the two study groups.
Participant
Demographics
Total Cohort
(n = 23)
N (%) or Mean ± SD
Study Groupsp Value
IMT (n = 16)
N (%) or Mean ± SD
Control (n = 7)
N (%) or Mean ± SD
Gender 0.273 a
Male19 (82.6)12 (75.0)7 (100.0)
Female4 (17.4)4 (25.0)0 (0.0)
Age (years)68.29 ± 10.8767.25 ± 1.6970.57 ± 12.660.535
BMI23.54 ± 4.7923.10 ± 4.2624.55 ± 6.100.720
Smoking status 0.087 a
Never smoker10 (43.5)9 (56.2)1 (14.3)
Former smoker9 (39.1)4 (25.0)5 (71.4)
Current smoker4 (17.4)3 (18.8)1 (14.3)
Severity of airflow limitation 0.202 a
Moderate15 (65.2)12 (75.0)3 (42.9)
Severe7 (30.4)3 (18.8)4 (57.1)
Extremely severe1 (4.3)1 (6.3)0 (0.0)
Medication
LAMA1 (4.3)1 (6.3)0 (0.0)1.000 a
LABA3 (13.0)2 (12.5)1 (14.3)1.000 a
LAMA/LABA6 (26.1)3 (18.8)3 (42.9)0.318 a
ICS/LABA6 (26.1)3 (18.8)3 (42.9)0.318 a
ICS/LAMA/LABA6 (26.1)6 (37.5)0 (0.0)0.124 a
Theophylline4 (17.4)4 (25.0)0 (0.0)0.273 a
OCS4 (17.4)4 (25.0)0 (0.0)0.273 a
Number of AEs in the previous year1.61 ± 1.952.00 ± 2.030.71 ± 1.500.154
≥2 AEs in the previous year9 (39.1)8 (50.0)1 (14.3)0.176 a
Note: Data are shown as number of patients (%) for categorical variables and mean ± standard deviation for continuous variables. a Analyzed with Fisher’s exact test, as > 20% of the expected subjects had less than 5 in chi-square test. IMT represents inspiratory muscle training, BMI represents body mass index, LAMA represents long-acting muscarinic antagonist, LABA represents long-acting β2-agonist, ICS represents inhaled corticosteroid, OCS represents oral corticosteroid, and AE represents acute exacerbation.
Table 2. Lung function and health status impairments in the two study groups.
VariableTimeStudy Group
IMT (n = 16)
Mean ± SD
p ValueControl (n = 7)
Mean ± SD
p Value
TLC (L)T14.53 ± 1.01 6.48 ± 1.28
T44.90 ± 0.840.1526.38 ± 1.110.612
RV (L)T12.15 ± 0.87 4.02 ± 1.28
T42.18 ± 1.020.9173.19 ± 1.690.553
RV/TLC%T152.86 ± 11.06 61.00 ± 9.36
T449.77 ± 16.060.42157.71 ± 10.090.916
FRC (L)T13.07 ± 1.06 4.66 ± 1.15
T43.40 ± 0.850.0644.60 ± 1.190.866
VC (L)T12.09 ± 0.47 2.47 ± 0.55
T42.42 ± 0.730.011 *2.63 ± 0.540.063
VT (L)T10.73 ± 0.25 0.72 ± 0.17
T40.74 ± 0.200.4840.81 ± 0.290.233
ERV (L)T10.56 ± 0.38 0.48 ± 0.28
T40.90 ± 0.410.012 *0.62 ± 0.360.345
DLCOT19.80 ± 4.48 9.06 ± 4.11
(mL/mmHg/min)T49.98 ± 4.630.2488.93 ± 3.660.933
DLCO/VAT13.45 ± 1.16 2.42 ± 0.80
(mL/mmHg/min/L)T43.43 ± 1.201.0002.24 ± 0.800.176
VA (L)T12.90 ± 0.83 3.67 ± 1.25
T42.91 ± 0.700.1334.02 ± 1.010.398
FVC (L)T12.06 ± 0.50 2.32 ± 0.37
T42.10 ± 0.490.5062.58 ± 0.610.063
FEV1 (L)T11.16 ± 0.39 1.29 ± 0.37
T41.18 ± 0.360.4421.26 ± 0.400.553
FEV1/FVC%T155.71 ± 9.99 53.71 ± 11.70
T456.62 ± 9.350.91649.43 ± 12.860.061
FEF25–75% (L/s)T10.57 ± 0.32 0.70 ± 0.33
T40.55 ± 0.220.8890.48 ± 0.220.018 *
FEF50% (L/s)T10.74 ± 0.48 0.87 ± 0.51
T40.78 ± 0.450.5520.65 ± 0.350.018 *
PEF (L/s)T13.62 ± 1.47 3.95 ± 0.41
T43.60 ± 1.270.9173.81 ± 0.940.499
mMRC (grade)T11.50 ± 0.63 1.86 ± 0.90
T40.88 ± 0.620.008 *1.86 ± 1.221.000
CAT (score)T111.50 ± 6.16 11.29 ± 9.01
T48.88 ± 6.540.06412.57 ± 10.470.395
HR (bpm)T187.56 ± 13.04 70.71 ± 12.83
T480.13 ± 10.230.011 *79.86 ± 10.420.028 *
PImax (cmH2O)T172.13 ± 26.75 88.57 ± 26.07
T484.31 ± 23.720.011 *91.43 ± 27.461.000
6MWD (m)T1424.44 ± 66.40 364.00 ± 130.90
T4442.38 ± 68.010.070406.57 ± 82.430.204
Note: * p < 0.05. IMT represents inspiratory muscle training, T1 represents baseline, T4 represents 12 weeks, TLC represents total lung capacity, RV represents residual volume, FRC represents functional residual capacity, VC represents vital capacity, VT represents tidal volume, ERV represents expiratory reserve volume, DLCO represents diffusion capacity of the lung for carbon monoxide, VA represents alveolar ventilation, FVC represents forced vital capacity, FEV1 represents forced expiratory volume in one second, FEF25–75% represents forced expiratory flow between 25 and 75% of the FVC, FEF50% represents forced expiratory flow at 50% of the FVC, PEF represents peak expiratory flow, mMRC represents modified Medical Research Council dyspnea index, CAT represents COPD Assessment Test, HR represents heart rate, bpm represents beats per minute, PImax represents maximal inspiratory pressure, and 6MWD represents 6 min walking distance.
Table 3. Analysis of the effects of interventional IMT on the lung function and health status impairments in COPD participants.
Study VariableBeta Coefficient (B)95% Wald Confidence Intervalp-Value
FEV1/FVC%Intercept53.7145.69to61.740.000 ǂ
Study group (IMT vs. control)2.00−7.48to11.480.679
Time point
T4 vs. T1−4.29−7.24to−1.330.004 ƚ
Study group × time point
IMT × (T4–T1)5.210.46to9.960.032 *
FEF25–75%Intercept0.700.47to0.920.000 ǂ
(L/s)Study group (IMT vs. control)−0.13−0.41to0.150.370
Time point
T4 vs. T1−0.22−0.32to−0.120.000 ǂ
Study group × time point
IMT × (T4–T1)0.200.04to0.350.012 *
FEF50%Intercept0.870.52to1.220.000 ǂ
(L/s)Study group (IMT vs. control)−0.13−0.56to0.290.546
Time point
T4 vs. T1−0.22−0.36to−0.090.000 ǂ
Study group × time point
IMT × (T4–T1)0.260.08to0.430.004 ƚ
mMRCIntercept1.861.24to2.470.000 ǂ
(grade)Study group (IMT vs. control)−0.36−1.04to0.330.308
Time point
T2 vs. T1−0.29−1.23to0.660.554
T3 vs. T1−0.29−0.94to0.370.391
T4 vs. T1−3.37 × 10⁻¹⁷−0.56to0.561.000
Study group × time point
IMT × (T2–T1)−0.03−1.02to0.960.958
IMT × (T3–T1)−0.21−0.91to0.480.547
IMT × (T4–T1)−0.63−1.28to0.030.062
CATIntercept11.295.10to17.470.000 ǂ
(score)Study group (IMT vs. control)0.21-6.62to7.050.951
Time point
T2 vs. T12.29-1.94to6.510.289
T3 vs. T13.00-1.37to7.370.179
T4 vs. T11.29-3.69to6.260.612
Study group × time point
IMT × (T2–T1)−4.54−9.47to1.610.071
IMT × (T3–T1)−5.50−10.31to−0.6950.025 *
IMT × (T4–T1)−3.91−9.42to1.610.165
RHR (bpm)Intercept70.7161.92to79.510.000 ǂ
Study group (IMT vs. control)16.856.09to27.600.002 ƚ
Time point
T2 vs. T15.14−0.57to10.340.053
T3 vs. T17.002.37to11.640.003 ƚ
T4 vs. T19.143.82to14.460.001 ƚ
Study group × time point
IMT × (T2–T1)−6.39−13.29to0.510.069
IMT × (T3–T1)−10.88−18.22to−3.530.004 ƚ
IMT × (T4–T1)−16.58−23.51to−9.650.000 ǂ
Note: * p < 0.05, ƚ p < 0.01, and ǂ p < 0.001. FVC represents forced vital capacity, FEV1 represents forced expiratory volume in one second, FEF25–75% represents forced expiratory flow between 25 and 75% of the FVC, FEF50% represents forced expiratory flow at 50% of the FVC, mMRC represents modified Medical Research Council dyspnea index, CAT represents COPD assessment test, RHR represents resting heart rate, and bpm represents beats per minute.
Disclaimer/Publisher’s Note: The statements, opinions and data contained in all publications are solely those of the individual author(s) and contributor(s) and not of MDPI and/or the editor(s). MDPI and/or the editor(s) disclaim responsibility for any injury to people or property resulting from any ideas, methods, instructions or products referred to in the content.

