
The Effect of Endurance and Endurance-Strength Training on Bone Health and Body Composition in Centrally Obese Women—A Randomised Pilot Trial

 ,
,  , ,
, , 
 ,
,  , and
, and 
Abstract
:1. Introduction
2. Materials and Methods
2.1. Study Design
2.2. Inclusion and Exclusion Criteria
2.3. Outcomes
2.4. Interventions Protocol
2.5. Anthropometric Parameters
2.6. Body Composition and Densitometric Parameters
2.7. Physical Capacity
2.8. Circulatory System Measurements
2.9. Biochemical Markers
2.10. Randomisation and Blinding
2.11. Minimum Sample Size
2.12. Statistical Analysis
3. Results
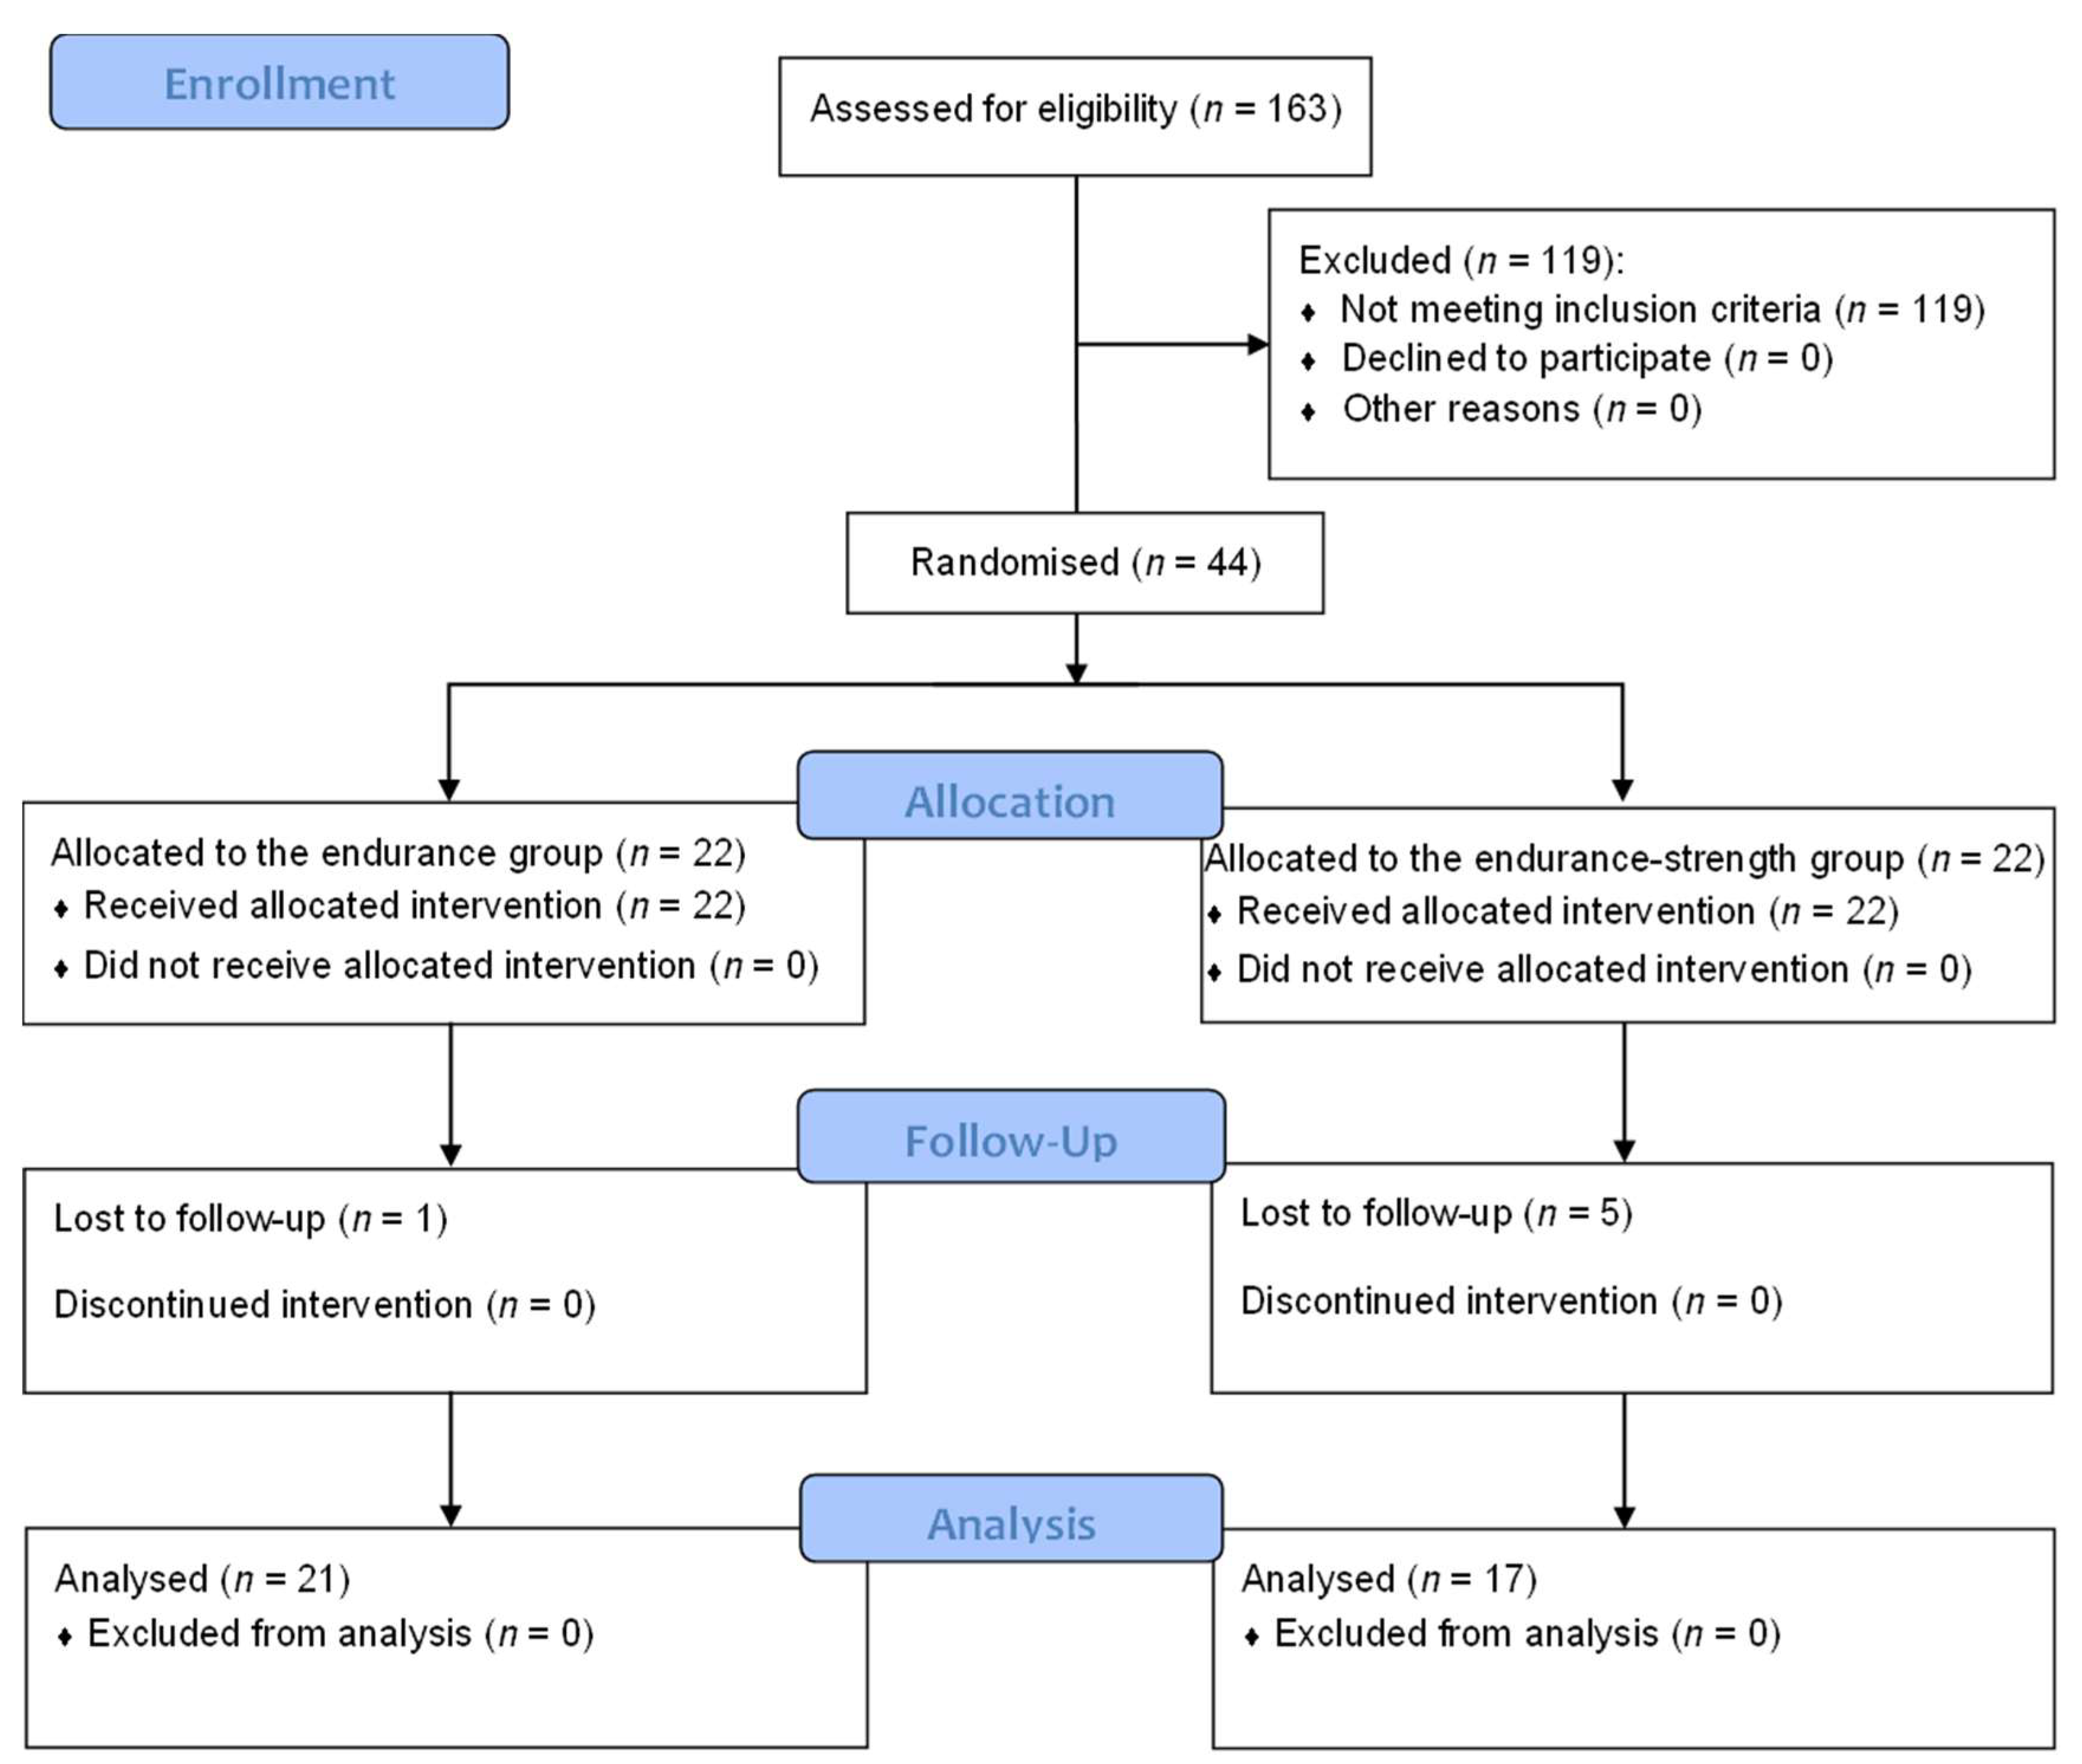
3.1. Study Flow
3.2. The Effect of Physical Activity on Bone Turnover Markers
3.3. The Effect of Physical Activity on Densitometric Parameters
3.4. The Effect of Physical Activity on Body Composition
3.5. Comparison of the Effect of Endurance and Endurance-Strength Training on Body Composition, Bone Turnover and Densitometric Parameters
3.6. Association between Changes in Densitometric Parameters, Bone Turnover Markers and Body Composition
4. Discussion
5. Conclusions
Supplementary Materials
Author Contributions
Funding
Institutional Review Board Statement
Informed Consent Statement
Data Availability Statement
Conflicts of Interest
References
- World Health Organization. Obesity and Overweight. Available online: https://www.who.int/news-room/fact-sheets/detail/obesity-and-overweight (accessed on 25 January 2022).
- Abdelaal, M.; le Roux, C.W.; Docherty, N.G. Morbidity and mortality associated with obesity. Ann. Transl. Med. 2017, 5, 161. [Google Scholar] [CrossRef] [PubMed] [Green Version]
- World Health Organization. Body Mass Index-BMI. Available online: https://www.euro.who.int/en/health-topics/disease-prevention/nutrition/a-healthy-lifestyle/body-mass-index-bmi (accessed on 16 November 2020).
- American Council on Exercise. Percent Body Fat Calculator. Available online: https://www.acefitness.org/education-and-resources/lifestyle/tools-calculators/percent-body-fat-calculator/ (accessed on 16 November 2020).
- World Health Organization. Waist Circumference and Waist-Hip Ratio: Report of a WHO Expert Consultation; World Health Organization: Genewa, Switzerland, 2008. [Google Scholar]
- Xue, R.; Li, Q.; Geng, Y.; Wang, H.; Wang, F.; Zhang, S. Abdominal obesity and risk of CVD: A dose–response meta-analysis of thirty-one prospective studies. Br. J. Nutr. 2021, 126, 1420–1430. [Google Scholar] [CrossRef] [PubMed]
- Zhang, C.; Rexrode, K.M.; van Dam, R.M.; Li, T.Y.; Hu, F.B. Abdominal obesity and the risk of all-cause, cardiovascular, and cancer mortality: Sixteen years of follow-up in US women. Circulation 2008, 117, 1658–1667. [Google Scholar] [CrossRef] [PubMed]
- Kim, M.H.; Song, S.W.; Kim, K.S. Abdominal obesity is associated with lower bone mineral density in non-weight-bearing site in Korean men. Am. J. Mens. Health 2019, 13, 1557988318813499. [Google Scholar] [CrossRef] [PubMed] [Green Version]
- Sharma, D.K.; Anderson, P.H.; Morris, H.A.; Clifton, P.M. Visceral fat is a negative determinant of bone health in obese postmenopausal women. Int. J. Environ. Res. Public Health 2020, 17, 3996. [Google Scholar] [CrossRef]
- Tariq, S.; Tariq, S.; Lone, K. Relationship of anthropometric measures with bone mineral density in postmenopausal non-osteoporotic, osteopenic and osteoporotic women. J. Pak. Med. Assoc. 2017, 67, 504–590. [Google Scholar]
- Centers for Disease Control and Prevention. Benefits of Physical Activity. Available online: https://www.cdc.gov/physicalactivity/basics/pa-health/index.htm (accessed on 8 October 2020).
- Benedetti, M.G.; Furlini, G.; Zati, A.; Mauro, G.L. The effectiveness of physical exercise on bone density in osteoporotic patients. Biomed. Res Int. 2018, 2018, 4840531. [Google Scholar] [CrossRef]
- Mages, M.; Shojaa, M.; Kohl, M.; von Stengel, S.; Becker, C.; Gosch, M.; Jakob, F.; Kerschan-Schindl, K.; Kladny, B.; Klöckner, N.; et al. Exercise effects on bone mineral density in men. Nutrients 2021, 13, 4244. [Google Scholar] [CrossRef]
- Kistler-Fischbacher, M.; Weeks, B.K.; Beck, B.R. The effect of exercise intensity on bone in postmenopausal women (part 1): A systematic review. Bone 2021, 143, 115696. [Google Scholar] [CrossRef]
- Kistler-Fischbacher, M.; Weeks, B.K.; Beck, B.R. The effect of exercise intensity on bone in postmenopausal women (part 2): A meta-analysis. Bone 2021, 143, 115697. [Google Scholar] [CrossRef]
- Mesinovic, J.; Jansons, P.; Zengin, A.; de Courten, B.; Rodriguez, A.J.; Daly, R.M.; Ebeling, P.R.; Scott, D. Exercise attenuates bone mineral density loss during diet-induced weight loss in adults with overweight and obesity: A systematic review and meta-analysis. J. Sport Health Sci. 2021, 10, 550–559. [Google Scholar] [CrossRef] [PubMed]
- Xu, J.; Lombardi, G.; Jiao, W.; Banfi, G. Effects of exercise on bone status in female subjects, from young girls to postmenopausal women: An overview of systematic reviews and meta-analyses. Sports Med. 2016, 46, 1165–1182. [Google Scholar] [CrossRef] [PubMed]
- Zouhal, H.; Berro, A.J.; Kazwini, S.; Saeidi, A.; Jayavel, A.; Clark, C.C.T.; Hackney, A.C.; VanDusseldorp, T.A.; Ben Abderrahman, A.; El Hage, R. Effects of exercise training on bone health parameters in individuals with obesity: A systematic review and meta-analysis. Front. Physiol. 2022, 12, 807110. [Google Scholar] [CrossRef] [PubMed]
- Pinheiro, M.B.; Oliveira, J.; Bauman, A.; Fairhall, N.; Kwok, W.; Sherrington, C. Evidence on physical activity and osteoporosis prevention for people aged 65+ years: A systematic review to inform the WHO guidelines on physical activity and sedentary behaviour. Int. J. Behav. Nutr. Phys. Act. 2020, 17, 150. [Google Scholar] [CrossRef] [PubMed]
- Bull, F.C.; Al-Ansari, S.S.; Biddle, S.; Borodulin, K.; Buman, M.P.; Cardon, G.; Carty, C.; Chaput, J.P.; Chastin, S.; Chou, R.; et al. World Health Organization 2020 guidelines on physical activity and sedentary behaviour. Br. J. Sports Med. 2020, 54, 1451–1462. [Google Scholar] [CrossRef]
- American College of Sport Medicine. ACSM’s Guidelines for Exercise Testing and Prescription, 11th ed.; Wolters Kluwer: Baltimore, MD, USA, 2021. [Google Scholar]
- Moher, D.; Hopewell, S.; Schulz, K.F.; Montori, V.; Gøtzsche, P.C.; Devereaux, P.J.; Elbourne, D.; Egger, M.; Altman, D.G. CONSORT 2010 explanation and elaboration: Updated guidelines for reporting parallel group randomised trials. BMJ 2010, 340, c869. [Google Scholar] [CrossRef] [Green Version]
- Jamka, M.; Bogdański, P.; Krzyżanowska-Jankowska, P.; Miśkiewicz-Chotnicka, A.; Karolkiewicz, J.; Duś-Żuchowska, M.; Mądry, R.; Lisowska, A.; Gotz-Więckowska, A.; Iskakova, S.; et al. Endurance training depletes antioxidant system but does not affect endothelial functions in women with abdominal obesity: A randomized trial with a comparison to endurance-strength training. J. Clin. Med. 2021, 10, 1639. [Google Scholar] [CrossRef]
- Jamka, M.; Mądry, E.; Bogdański, P.; Kryściak, J.; Mądry, R.; Lisowska, A.; Ismagulova, E.; Gotz-Więckowska, A.; Chudzicka-Strugała, I.; Amanzholkyzy, A.; et al. The effect of endurance and endurance-strength training on bone mineral density and content in abdominally obese postmenopausal women: A randomized trial. Healthcare 2021, 9, 1074. [Google Scholar] [CrossRef]
- Jamka, M.; Mądry, E.; Krzyżanowska-Jankowska, P.; Skrypnik, D.; Szulińska, M.; Mądry, R.; Lisowska, A.; Batyrova, G.; Duś-Żuchowska, M.; Gotz-Więckowska, A.; et al. The effect of endurance and endurance-strength training on body composition and cardiometabolic markers in abdominally obese women: A randomised trial. Sci. Rep. 2021, 1, 12339. [Google Scholar] [CrossRef]
- Jamka, M.; Bogdański, P.; Krzyżanowska-Jankowska, P.; Karolkiewicz, J.; Mądry, R.; Lisowska, A.; Walkowiak, J.; Mądry, E. Comparison of the effects of endurance and endurance-strength training programmes on the level of endothelial dysfunction in women with abdominal obesity: Study protocol for a randomised controlled trial. J. Med. Sci. 2020, 88, 266–272. [Google Scholar] [CrossRef]
- Skrypnik, D.; Ratajczak, M.; Karolkiewicz, J.; Madry, E.; Pupek-Musialik, D.; Hansdorfer-Korzon, R.; Walkowiak, J.; Jakubowski, H.; Bogdański, P. Effects of endurance and endurance-strength exercise on biochemical parameters of liver function in women with abdominal obesity. Biomed. Pharmacother. 2016, 80, 1–7. [Google Scholar] [CrossRef] [PubMed]
- Skrypnik, D.; Bogdański, P.; Mądry, E.; Karolkiewicz, J.; Ratajczak, M.; Kryściak, J.; Pupek-Musialik, D.; Walkowiak, J. Effects of endurance and endurance strength training on body composition and physical capacity in women with abdominal obesity. Obes. Facts 2015, 8, 175–187. [Google Scholar] [CrossRef] [PubMed]
- Szulinska, M.; Skrypnik, D.; Ratajczak, M.; Karolkiewicz, J.; Madry, E.; Musialik, K.; Walkowiak, J.; Jakubowski, H.; Bogdański, P. Effects of endurance and endurance-strength exercise on renal function in abdominally obese women with renal hyperfiltration: A prospective randomized trial. Biomed. Environ. Sci. 2016, 29, 706–712. [Google Scholar] [PubMed]
- Ratajczak, M.; Skrypnik, D.; Bogdański, P.; Mądry, E.; Walkowiak, J.; Szulińska, M.; Maciaszek, J.; Kręgielska-Narożna, M.; Karolkiewicz, J. Effects of endurance and endurance-strength training on endothelial function in women with obesity: A randomized trial. Int. J. Environ. Res. Public Health 2019, 16, 429. [Google Scholar] [CrossRef] [Green Version]
- Mancia, G.; Laurent, S.; Agabiti-Rosei, E.; Ambrosioni, E.; Burnier, M.; Caulfield, M.J.; Cifkova, R.; Clément, D.; Coca, A.; Dominiczak, A.; et al. Reappraisal of European guidelines on hypertension management: A European Society of Hypertension Task Force document. Blood Press. 2009, 18, 308–347. [Google Scholar] [CrossRef]
- Brzycki, M. Strength testing—Predicting a one-rep max from reps-to-fatigue. J. Phys. Educ. Recreat Dance 1993, 64, 88–90. [Google Scholar] [CrossRef]
- Amanat, S.; Sinaei, E.; Panji, M.; MohammadporHodki, R.; Bagheri-Hosseinabadi, Z.; Asadimehr, H.; Fararouei, M.; Dianatinasab, A. A randomized controlled trial on the effects of 12 weeks of aerobic, resistance, and combined exercises training on the serum levels of nesfatin-1, irisin-1 and HOMA-IR. Front. Physiol. 2020, 16, 562895. [Google Scholar] [CrossRef]
- Dianatinasab, A.; Koroni, R.; Bahramian, M.; Bagheri-Hosseinabadi, Z.; Vaismoradi, M.; Fararouei, M.; Amanat, S. The effects of aerobic, resistance, and combined exercises on the plasma irisin levels, HOMA-IR, and lipid profiles in women with metabolic syndrome: A randomized controlled trial. J. Exerc. Sci. Fit. 2020, 18, 168–176. [Google Scholar] [CrossRef]
- Nikseresht, M.; Agha-Alinejad, H.; Azarbayjani, M.A.; Ebrahim, K. Effects of nonlinear resistance and aerobic interval training on cytokines and insulin resistance in sedentary men who are obese. J. Strength Cond. Res. 2014, 28, 2560–2568. [Google Scholar] [CrossRef]
- Mohammad Rahimi, G.R.; Bijeh, N.; Rashidlamir, A. Effects of exercise training on serum preptin, undercarboxylated osteocalcin and high molecular weight adiponectin in adults with metabolic syndrome. Exp. Physiol. 2020, 105, 449–459. [Google Scholar] [CrossRef]
- Villareal, D.T.; Aguirre, L.; Gurney, A.B.; Waters, D.L.; Sinacore, D.R.; Colombo, E.; Armamento-Villareal, R.; Qualls, C. Aerobic or resistance exercise, or both, in dieting obese older adults. N. Engl. J. Med. 2017, 376, 1943–1955. [Google Scholar] [CrossRef] [PubMed] [Green Version]
- Rossi, F.E.; Fortaleza, A.C.S.; Neves, L.M.; Buonani, C.; Picolo, M.R.; Diniz, T.A.; Kalva-Filho, C.A.; Papoti, M.; Lira, F.S.; Freitas Junior, I.F. Combined training (aerobic plus strength) potentiates a reduction in body fat but demonstrates no difference on the lipid profile in postmenopausal women when compared with aerobic training with a similar training load. J. Strength Cond. Res. 2016, 30, 226–234. [Google Scholar] [CrossRef] [PubMed]
- Stensvold, D.; Tjønna, A.E.; Skaug, E.A.; Aspenes, S.; Stølen, T.; Wisløff, U.; Slørdahl, S.A. Strength training versus aerobic interval training to modify risk factors of metabolic syndrome. J. Appl. Physiol. 2010, 108, 804–810. [Google Scholar] [CrossRef] [PubMed] [Green Version]
- Campos, R.M.; Túlio de Mello, M.; Tock, L.; Silva, P.L.; Masquio, D.L.; de Piano, A.; Sanches, P.L.; Carnier, J.; Corgosinho, F.C.; Foschini, D.; et al. Aerobic plus resistance training improves bone metabolism and inflammation in obese adolescents. J. Strength Cond. Res. 2014, 28, 758–766. [Google Scholar] [CrossRef] [PubMed]
- Santos, L.; Elliott-Sale, K.J.; Sale, C. Exercise and bone health across the lifespan. Biogerontology 2017, 18, 931–946. [Google Scholar] [CrossRef] [Green Version]
- Arazi, H.; Eghbali, E. Effects of different types of physical training on bone mineral density in men and women. J. Osteopor. Phys. Act. 2017, 5, 207. [Google Scholar] [CrossRef] [Green Version]
- Clarke, B.L.; Khosla, S. Physiology of bone loss. Radiol. Clin. N. Am. 2010, 48, 483–495. [Google Scholar] [CrossRef]
- Lo, J.C.; Burnett-Bowie, S.A.M.; Finkelstein, J.S. Bone and the perimenopause. Obstet. Gynecol. Clin. N. Am. 2011, 38, 503–517. [Google Scholar] [CrossRef] [Green Version]
- Shariati-Sarabi, Z.; Rezaie, H.E.; Milani, N.; Rezaie, F.E.; Rezaie, A.E. Evaluation of bone mineral density in perimenopausal period. Arch. Bone Jt. Surg. 2018, 6, 57–62. [Google Scholar]
- Rinonapoli, G.; Pace, V.; Ruggiero, C.; Ceccarini, P.; Bisaccia, M.; Meccariello, L.; Caraffa, A. Obesity and bone: A complex relationship. Int. J. Mol. Sci. 2021, 22, 13662. [Google Scholar] [CrossRef]
- Von Thun, N.L.; Sukumar, D.; Heymsfield, S.B.; Shapses, S.A. Does bone loss begin after weight loss ends? Results 2 years after weight loss or regain in postmenopausal women. Menopause 2014, 21, 501–508. [Google Scholar] [CrossRef] [PubMed] [Green Version]
- Hunter, G.R.; Plaisance, E.P.; Fisher, G. Weight loss and bone mineral density. Curr. Opin. Endocrinol. Diabetes Obes. 2014, 21, 358–362. [Google Scholar] [CrossRef] [PubMed] [Green Version]
- Shapses, S.A.; Sukumar, D. Bone metabolism in obesity and weight loss. Annu. Rev. Nutr. 2012, 32, 287–309. [Google Scholar] [CrossRef] [PubMed] [Green Version]
- Hu, C.; Qin, Q.-H.; Hu, C.; Qin, Q.-H. Bone remodeling and biological effects of mechanical stimulus. AIMS Bioeng. 2020, 7, 12–28. [Google Scholar] [CrossRef]
- Avin, K.G.; Bloomfield, S.A.; Gross, T.S.; Warden, S.J. Biomechanical aspects of the muscle-bone interaction. Curr. Osteoporos. Rep. 2015, 13, 1–8. [Google Scholar] [CrossRef] [PubMed] [Green Version]
- Locquet, M.; Beaudart, C.; Durieux, N.; Reginster, J.Y.; Bruyère, O. Relationship between the changes over time of bone mass and muscle health in children and adults: A systematic review and meta-analysis. BMC Musculoskelet. Disord. 2019, 20, 429. [Google Scholar] [CrossRef] [PubMed]
- Villareal, D.T.; Fontana, L.; Weiss, E.P.; Racette, S.B.; Steger-May, K.; Schechtman, K.B.; Klein, S.; Holloszy, J.O. Bone mineral density response to caloric restriction-induced weight loss or exercise-induced weight loss: A randomized controlled trial. Arch. Intern. Med. 2006, 166, 2502–2510. [Google Scholar] [CrossRef]
- Villareal, D.T.; Shah, K.; Banks, M.R.; Sinacore, D.R.; Klein, S. Effect of weight loss and exercise therapy on bone metabolism and mass in obese older adults: A one-year randomized controlled trial. J. Clin. Endocrinol. Metab. 2008, 93, 2181–2187. [Google Scholar] [CrossRef]
- Nagle, K.B.; Brooks, M.A. A systematic review of bone health in cyclists. Sports Health 2011, 3, 235–243. [Google Scholar] [CrossRef]
- Olmedillas, H.; González-Agüero, A.; Moreno, L.A.; Casajus, J.A.; Vicente-Rodríguez, G. Cycling and bone health: A systematic review. BMC Med. 2012, 10, 168. [Google Scholar] [CrossRef] [Green Version]
- Hong, A.R.; Kim, S.W. Effects of resistance exercise on bone health. Endocrinol. Metab. (Seoul) 2018, 33, 435–444. [Google Scholar] [CrossRef] [PubMed]
- Kitsuda, Y.; Wada, T.; Noma, H.; Osaki, M.; Hagino, H. Impact of high-load resistance training on bone mineral density in osteoporosis and osteopenia: A meta-analysis. J. Bone Miner. Metab. 2021, 39, 787–803. [Google Scholar] [CrossRef] [PubMed]
- Shanb, A.; Youssef, E. The impact of adding weight-bearing exercise versus nonweight bearing programs to the medical treatment of elderly patients with osteoporosis. J. Family Community Med. 2014, 21, 176–181. [Google Scholar] [CrossRef] [Green Version]
- James, M.M.S.; Carroll, S. Effects of different impact exercise modalities on bone mineral density in premenopausal women: A meta-analysis. J. Bone Miner. Metab. 2010, 28, 251–267. [Google Scholar] [CrossRef] [PubMed]
- Rector, R.S.; Rogers, R.; Ruebel, M.; Hinton, P.S. Participation in road cycling vs running is associated with lower bone mineral density in men. Metabolism 2008, 57, 226–232. [Google Scholar] [CrossRef] [PubMed]
- Stewart, A.D.; Hannan, J. Total and regional bone density in male runners, cyclists, and controls. Med. Sci. Sports Exerc. 2000, 32, 1373–1377. [Google Scholar] [CrossRef] [PubMed]
- Chen, Z.; Sherk, V.D.; Sharma-Ghimire, P.; Bemben, M.G.; Bemben, D.A. Site-specific bone differences and energy status in male competitive runners and road cyclists. J. Clin. Densitom. 2022, 25, 150–159. [Google Scholar] [CrossRef]
- Turpin, N.A.; Watier, B. Cycling biomechanics and its relationship to performance. Appl. Sci. 2020, 10, 4112. [Google Scholar] [CrossRef]
- Nichols, J.F.; Rauh, M.J. Longitudinal changes in bone mineral density in male master cyclists and nonathletes. J. Strength Cond. Res. 2011, 25, 727–734. [Google Scholar] [CrossRef]
- Beshgetoor, D.; Nichols, J.F.; Rego, I. Effect of training mode and calcium intake on bone mineral density in female master cyclist, runners, and non-athletes. Int. J. Sport Nutr. Exerc. Metab. 2000, 10, 290–301. [Google Scholar] [CrossRef]
- Je, C. The impact of duration on effectiveness of exercise, the implication for periodization of training and goal setting for individuals who are overfat, a meta-analysis. Biol. Sport. 2016, 33, 309–333. [Google Scholar]
- Daly, R.M.; DallaVia, J.; Fyfe, J.J.; Nikander, R.; Kukuljan, S. Effects of exercise frequency and training volume on bone changes following a multi-component exercise intervention in middle aged and older men: Secondary analysis of an 18-month randomized controlled trial. Bone 2021, 148, 115944. [Google Scholar] [CrossRef] [PubMed]
- U.S. Department of Health and Human Services. Physical Activity Guidelines for Americans, 2nd ed.; Department of Health and Human Services: Washington, DC, USA, 2018.
- Eriksen, E.F. Normal and pathological remodeling of human trabecular bone: Three dimensional reconstruction of the remodeling sequence in normals and in metabolic bone disease. Endocr. Rev. 1986, 7, 379–408. [Google Scholar] [CrossRef] [PubMed]
- Banfi, G.; Colombini, A.; Lombardi, G.; Lubkowska, A. Metabolic markers in sports medicine. Adv. Clin. Chem. 2012, 56, 1–54. [Google Scholar] [PubMed]
- Hong, L.; Liu, D.; Wu, F.; Wang, M.; Cen, Y.; Ma, L. Correlation between bone turnover markers and bone mineral density in patients undergoing long-term anti-osteoporosis treatment: A systematic review and meta-analysis. Appl. Sci. 2020, 10, 832. [Google Scholar] [CrossRef] [Green Version]
- Fujimura, R.; Ashizawa, N.; Watanabe, M.; Mukai, N.; Amagai, H.; Fukubayashi, T.; Hayashi, K.; Tokuyama, K.; Suzuki, M. Effect of resistance exercise training on bone formation and resorption in young male subjects assessed by biomarkers of bone metabolism. J. Bone Miner. Res. 1997, 12, 656–662. [Google Scholar] [CrossRef]
- Schroeder, E.T.; Hawkins, S.A.; Jaque, S.V. Musculoskeletal adaptations to 16 weeks of eccentric progressive resistance training in young women. J. Strength Cond. Res. 2004, 18, 227–235. [Google Scholar] [CrossRef]
- Woitge, H.W.; Friedmann, B.; Suttner, S.; Farahmand, I.; Müller, M.; Schmidt-Gayk, H.; Baertsch, P.; Ziegler, R.; Seibel, M.J. Changes in bone turnover induced by aerobic and anaerobic exercise in young males. J. Bone Miner. Res. 1998, 13, 1797–1804. [Google Scholar] [CrossRef]
- Hinton, P.S.; Rector, R.S.; Linden, M.A.; Warner, S.O.; Dellsperger, K.C.; Chockalingam, A.; Whaley-Connell, A.T.; Liu, Y.; Thomas, T.R. Weight-loss-associated changes in bone mineral density and bone turnover after partial weight regain with or without aerobic exercise in obese women. Eur. J. Clin. Nutr. 2011, 66, 606–612. [Google Scholar] [CrossRef] [Green Version]
- Rector, R.S.; Loethen, J.; Ruebel, M.; Thomas, T.R.; Hinton, P.S. Serum markers of bone turnover are increased by modest weight loss with or without weight-bearing exercise in overweight premenopausal women. Appl. Physiol. Nutr. Metab. 2009, 34, 933–941. [Google Scholar] [CrossRef]
- Cifuentes, M.; Johnson, M.A.; Lewis, R.D.; Heymsfield, S.B.; Chowdhury, H.A.; Modlesky, C.M.; Shapses, S.A. Bone turnover and body weight relationships differ in normal-weight compared with heavier postmenopausal women. Osteoporos 2003, 14, 116–122. [Google Scholar] [CrossRef] [PubMed] [Green Version]
- Sheehan, K.M.; Murphy, M.M.; Reynolds, K.; Creedon, J.F.; White, J.; Kazel, M. The response of a bone resorption marker to marine recruit training. Mil. Med. 2003, 168, 797–801. [Google Scholar] [CrossRef] [PubMed] [Green Version]


| Variables | END Group (n = 21) | END–ST Group (n = 17) | p1 | ||
|---|---|---|---|---|---|
| Mean ± SD (95% CI) | Median (IQR) | Mean ± SD (95% CI) | Median (IQR) | ||
| Age [years] | 51 ± 8 (48–55) | 53 (43–58) | 48 ± 11 (42–54) | 49 (40–58) | 0.3236 |
| Weight [kg] | 91.7 ± 11.8 (86.3–97.0) | 90.2 (84.5–97.0) | 94.5 ± 13.4 (87.6–101.4) | 93.9 (80.1–101.3) | 0.4928 |
| Height [m] | 1.61 ± 0.05 (1.59–1.64) | 1.63 (1.58–1.65) | 1.64 ± 0.06 (1.61–1.67) | 1.66 (1.61–1.67) | 0.1114 |
| BMI [kg/m2] | 35.17 ± 3.86 (33.41–36.93) | 33.95 (32.38–37.51) | 34.93 ± 3.82 (32.96–36.89) | 33.75 (32.11–36.89) | 0.8464 |
| Waist circumference [cm] | 110.8 ± 10.2 (106.1–115.4) | 112.0 (102.0–115.0) | 111.6 ± 11.3 (105.8–117.5) | 109.5 (101.0–121.5) | 0.8020 |
| Fat [%] 2 | 46.9 ± 3.7 (45.2–48.6) | 45.8 (44.5–49.3) | 46.1 ± 5.1 (43.5–48.8) | 46.2 (44.5–48.9) | 0.5971 |
| Variables | END Group (n = 21) | END–ST Group (n = 17) | p1 | |||
|---|---|---|---|---|---|---|
| Mean ± SD (95% CI) | Median (IQR) | Mean ± SD (95% CI) | Median (IQR) | |||
| BAP [U/L] | PRE | 25.52 ± 5.94 (22.81–28.22) | 25.39 (20.36–29.7) | 24.80 ± 8.22 (20.57–29.03) | 23.58 (19.26–29.85) | 0.7587 3 |
| POST | 26.60 ± 7.11 (23.37–29.84) | 26.53 (22.01–30.01) | 24.25 ± 7.78 (20.25–28.25) | 23.74 (18.00–27.74) | 0.3366 3 | |
| p2 | 0.4234 5 | 0.5750 5 | ||||
| CTX–1 [ng/mL] | PRE | 0.41 ± 0.19 (0.32–0.49) | 0.40 (0.28–0.52) | 0.42 ± 0.21 (0.32–0.53) | 0.33 (0.30–0.52 | 0.8847 4 |
| POST | 0.41 ± 0.19 (0.33–0.50) | 0.36 (0.28–0.55) | 0.47 ± 0.22 (0.36–0.59) | 0.44 (0.33–0.57) | 0.3702 3 | |
| p2 | 0.8077 5 | 0.2274 5 | ||||
| OC [ng/mL] | PRE | 4.98 ± 2.34 (3.92–6.05) | 5.37 (3.55–6.97) | 5.77 ± 2.40 (4.53–7.00) | 4.90 (4.12–7.64) | 0.3178 3 |
| POST | 5.91 ± 2.21 (4.91–6.92) | 6.48 (4.73–9.98) | 6.79 ± 2.41 (5.53–8.05) | 6.34 (4.82–9.15) | 0.2523 3 | |
| p2 | 0.0484 5 | 0.0733 6 | ||||
| TRAP 5b [U/L] | PRE | 1.88 ± 0.75 (1.53–2.22) | 1.82 (1.26–2.55) | 1.60 ± 0.75 (1.21–1.98) | 1.66 (1.01–2.09) | 0.2641 3 |
| POST | 2.02 ± 0.94 (1.59–2.45) | 2.06 (1.10–2.70) | 2.22 ± 0.75 (1.83–2.60) | 2.31 (1.60–2.88) | 0.5020 3 | |
| p2 | 0.1808 6 | 0.0014 5 | ||||
| Variables | END Group (n = 21) | END-ST Group (n = 17) | p1 | |||
|---|---|---|---|---|---|---|
| Mean ± SD (95% CI) | Median (IQR) | Mean ± SD (95% CI) | Median (IQR) | |||
| Total body | ||||||
| BMD [g/cm2] | PRE | 1.224 ± 0.084 (1.186–1.262) | 1.226 (1.152–1.290) | 1.258 ± 0.100 (1.207–1.310) | 1.231 (1.208–1.296) | 0.2542 3 |
| POST | 1.208 ± 0.098 (1.163–1.252) | 1.199 (1.135–1.271) | 1.241 ± 0.089 (1.195–1.286) | 1.236 (1.183–1.265) | 0.2924 3 | |
| p2 | 0.0300 5 | 0.0063 5 | ||||
| BMC [g] | PRE | 2740.52 ± 286.73 (2610.01–2781.04) | 2675.00 (2477.00–3005.00) | 2929.88 ± 452.03 (2697.47–3162.29) | 2879.00 (2684.00–3076.00) | 0.1249 3 |
| POST | 2689.81 ± 290.26 (2557.69–2821.93) | 2701.00 (2484.00–2929.00) | 2897.35 ± 454.86 (2663.49–3131.22) | 2792.00 (2605.00–3078.00) | 0.0963 3 | |
| p2 | 0.0440 5 | 0.1530 5 | ||||
| L1-L4 | ||||||
| BMD [g/cm2] | PRE | 1.165 ± 0.151 (1.095–1.233) | 1.184 (1.095–1.291) | 1.267 ± 0.178 (1.176–1.359) | 1.269 (1.146–1.346) | 0.0624 3 |
| POST | 1.176 ± 0.157 (1.105–1.248) | 1.186 (1.103–1.307) | 1.283 ± 0.185 (1.188–1.378) | 1.266 (1.135–1.358) | 0.0622 3 | |
| p2 | 0.0883 5 | 0.0839 5 | ||||
| BMC [g] | PRE | 63.38 ± 11.59 (58.10–68.65) | 66.38 (56.38–70.22) | 71.45 ± 15.00 (63.74–79.16) | 68.67 (66.28–78.34) | 0.0945 4 |
| POST | 63.98 ± 12.02 (58.51–69.46) | 67.34 (57.36–73.33) | 71.54 ± 14.83 (63.92–79.17) | 67.92 (62.51–77.65) | 0.0909 3 | |
| p2 | 0.3135 5 | 0.8905 5 | ||||
| Femoral neck | ||||||
| BMD [g/cm2] | PRE | 1.017 ± 0.120 (0.962–1.071) | 1.013 (0.923–1.080) | 1.057 ± 0.155 (0.978–1.137) | 1.057 (0.955–1.137) | 0.3670 3 |
| POST | 1.006 ± 0.103 (0.959–1.053) | 0.978 (0.914–1.065) | 1.059 ± 0.141 (0.986–1.131) | 1.024 (0.957–1.139) | 0.1904 3 | |
| p2 | 0.3662 6 | 0.8951 5 | ||||
| BMC [g] | PRE | 4.81 ± 0.66 (4.51–5.11) | 4.78 (4.26–5.08) | 5.22 ± 0.99 (4.71–5.73) | 4.92 (4.66–6.12) | 0.1384 3 |
| POST | 4.61 ± 0.70 (4.29–4.93) | 4.63 (4.08–5.07) | 5.10 ± 0.88 (4.64–5.55) | 4.88 (4.64–5.19) | 0.1519 4 | |
| p2 | 0.1119 5 | 0.2663 6 | ||||
| Variables | END Group (n = 21) | END-ST Group (n = 17) | p 1 | |||
|---|---|---|---|---|---|---|
| Mean ± SD (95% CI) | Median (IQR) | Mean ± SD (95% CI) | Median (IQR) | |||
| Total body | ||||||
| Fat [g] | PRE | 41955 ± 7603 (38494–45415) | 42329 (36244–48478) | 42681 ± 8615 (38252–47110) | 42775 (35849–47614) | 0.7841 3 |
| POST | 39219 ± 7258 (35915–42522) | 37968 (34728–46281) | 40025 ± 8442 (35684–44366) | 38833 (32928–45588) | 0.7534 3 | |
| p 2 | <0.0001 5 | <0.0001 5 | ||||
| Lean [g] | PRE | 45969 ± 5468 (43480–48458) | 44017 (42118–50221) | 47844 ± 6280 (44615–51073) | 45605 (44368–51138) | 0.3319 3 |
| POST | 46598 ± 5961 (43884–49311) | 44881 (42854–48810) | 48640 ± (45354–51926) | 46895 (44192–51581) | 0.3160 3 | |
| p 2 | 0.1096 5 | 0.0005 5 | ||||
| Male area (android) | ||||||
| Fat [g] | PRE | 4244 ± 990 (3793–4694) | 4336 (3465–4757) | 4278 ± 1002 (3763–4793) | 4038 (3464–4920) | 0.9161 3 |
| POST | 3906 ± 960 (3469–4343) | 3701 (3319–4316) | 3956 ±1090 (3396–4516) | 3660 (3083–4685) | 0.9065 4 | |
| p 2 | <0.0001 6 | 0.0003 5 | ||||
| Lean [g] | PRE | 3630 ± 681 (3320–3940) | 3301 (3146–4196) | 3815 ± 833 (3387–4243) | 3473 (3263–4236) | 0.4811 4 |
| POST | 3478 ± 646 (3184–3772) | 3247 (3111–3727) | 3683 ± 775 (3284–4081) | 3321 (3144–4258) | 0.4453 4 | |
| p 2 | 0.0117 6 | 0.0975 6 | ||||
| Female area (gynoid) | ||||||
| Fat [g] | PRE | 6936 ± 1425 (6287–7584) | 7342 (5821–7708) | 7263 ± 1715 (6382–8145) | 7538 (6035–8051) | 0.5237 3 |
| POST | 6412 ± 1315 (5814–7011) | 6701 (5482–6938) | 6563 ± 1617 (5732–7395) | 6609 (5522–7124) | 1.0000 4 | |
| p 2 | <0.0001 5 | <0.0001 5 | ||||
| Lean [g] | PRE | 6785 ± 965 (6346–7224) | 6575 (6060–7288) | 6915 ± 950 (6426–7403) | 6559 (6299–7274) | 0.6799 3 |
| POST | 7054 ± 1008 (6595–7513) | 6844 (6572–7655) | 7529 ± 1106 (6960–8098) | 7138 (6694–8253) | 0.1750 3 | |
| p 2 | 0.0013 5 | 0.0001 5 | ||||
| Arms | ||||||
| Fat [g] | PRE | 3571 ± 721 (3243–3899) | 3660 (3060–4181) | 3514 ± 569 (3221–3806) | 3465 (2973–3905) | 0.7900 3 |
| POST | 3506 ± 604 (3231–3781) | 3503 (3002–4038) | 3313 ± 648 (2980–3647) | 3212 (2794–3754) | 0.3497 3 | |
| p 2 | 0.4178 5 | 0.0442 6 | ||||
| Lean [g] | PRE | 4330 ± 746 (3991–4670) | 4597 (3973–4838) | 4405 ± 843 (3972–4839) | 4493 (3826–4885) | 0.7728 3 |
| POST | 4312 ± 540 (4066–4557) | 4444 (3922–4637) | 4284 ± 757 (3894–4673) | 4372 (3819–4555) | 0.8953 3 | |
| p 2 | 0.8400 5 | 0.3094 5 | ||||
| Legs | ||||||
| Fat [g] | PRE | 14136 ± 3663 (12469–15804) | 14647 (11214–16032) | 13718 ± 3761 (11784- 15651) | 14691 (11252–16091) | 0.7314 3 |
| POST | 13242 ± 3638 (11585–14898) | 14055 (10468–14925) | 12992 ± 3635 (11123–14861) | 13462 (11597–15094) | 0.8347 3 | |
| p 2 | 0.0002 5 | 0.0006 5 | ||||
| Lean [g] | PRE | 15067 ± 2240 (14047–16086) | 14821 (13316–16491) | 15263 ± 1594 (14444–16083) | 15311 (13821–16059) | 0.7626 3 |
| POST | 15584 ± 2690 (14357–16807) | 15272 (13324–16917) | 16442 ± 2293 (15262–17621) | 16245 (14308–17815) | 0.3030 3 | |
| p 2 | 0.0129 5 | 0.0003 6 | ||||
| Trunk | ||||||
| Fat [g] | PRE | 23013 ± 4626 (20907–25119) | 23297 (19724–25380) | 24485 ± 5498 (21658–27312) | 23574 (20840–26572) | 0.3758 3 |
| POST | 21512 ± 4430 (19496–23529) | 21840 (18644–23035) | 22790 ± 5203 (20115–25465) | 21847 (19603–25749) | 0.4188 3 | |
| p 2 | 0.0011 5 | 0.0014 6 | ||||
| Lean [g] | PRE | 23522 ± 3654 (21858–25185) | 22540 (20780–25583) | 25097 ± 5062 (22495–27700) | 22415 (21872–27977) | 0.5972 4 |
| POST | 23613 ± 3691 (21933–25293) | 22752 (21423–24736) | 24792 ± 4431 (22514–27070) | 22090 (21739–27338) | 0.5376 4 | |
| p 2 | 0.7480 5 | 0.5228 6 | ||||
| Variables | END Group (n = 21) | END-ST Group (n = 17) | p1 | ||
|---|---|---|---|---|---|
| Mean ± SD (95% CI) | Median (IQR) | Mean ± SD (95% CI) | Median (IQR) | ||
| Δ BAP [U/L] | 0.51 ± 6.03 (−2.12–3.39) | 1.18 (−2.28–2.52) | −0.87 ± 7.17 (−2.94–1.37) | 0.16 (−2.98–1.56) | 0.3341 |
| Δ CTX-1 [ng/mL] | 0.01 ± 0.13 (−0.06–0.08) | 0.01 (−0.08–0.11) | 0.05 ± 0.11 (−0.04–0.014) | 0.09 (−0.06–0.18) | 0.3381 |
| Δ OC [ng/mL] | 0.74 ± 2.31 (−0.18–1.74) | 0.79 (−0.25–2.35) | 0.85 ± 2.38 (−0.14–1.94) | 0.72 (−0.36–1.41) | 0.4717 |
| Δ TRAP 5b [U/L] | 0.27 ± 0.67 (−0.10–0.60) | 0.260 (−0.04–0.80) | 0.67 ± 0.68 (0.31–1.00) | 0.57 (0.14–0.79) | 0.2018 |
| Variables | END Group (n = 21) | END-ST Group (n = 17) | p1 | ||
|---|---|---|---|---|---|
| Mean ± SD (95% CI) | Median (IQR) | Mean ± SD (95% CI) | Median (IQR) | ||
| Total body | |||||
| Δ BMD [g/cm2] | −0.019 ± −0.038 (−0.032–−0.005) | −0.021 (−0.033–−0.004) | −0.019 ± −0.044 (−0.031–−0.007) | −0.022 (−0.032–0.004) | 0.9923 |
| Δ BMC [g] | −47.20 ± 235.84 (−94.38–−1.07) | −44.00 (−104.00–26.00) | −30.83 ± 249.46 (−77.59–14.95) | −46.00 (−93.00–49.00) | 0.9020 |
| L1-L4 | |||||
| Δ BMD [g/cm2] | 0.012 ± 0.017 (−0.001–0.025) | 0.011 (−0.005–0.029) | 0.016 ± 0.010 (−0.002–0.034) | 0.014 (−0.001–0.052) | 0.8416 |
| Δ BMC [g] | 0.55 ± 3.36 (−0.66–1.79) | 0.90 (−0.91–2.42) | 0.02 ± 3.33 (−1.35–1.43) | −0.08 (−1.15–1.52) | 0.6308 |
| Femoral neck | |||||
| Δ BMD [g/cm2] | −0.009 ± 0.064 (0.024–0.006) | −0.004 (−0.023–0.010) | 0.004 ± 0.054 (−0.018–0024) | 0.002 (−0.033–0.027) | 0.1083 |
| Δ BMC [g] | −0.112 ± 0.725 (−0.329–0.077) | −0.080 (−0.450–0.050) | −0.087 ± 0.995 (−0.241–0.053) | 0.000 (−0.210–0.050) | 0.3787 |
| Variables | END Group (n = 21) | END-ST Group (n = 17) | p1 | ||
|---|---|---|---|---|---|
| Mean ± SD (95% CI) | Median (IQR) | Mean ± SD (95% CI) | Median (IQR) | ||
| Total body | |||||
| Δ fat [g] | −2802 ± 5329 (−3607–−1975) | −2226 (−3284–−1812) | −2716 ± 5246 (−3673–−1727) | −2571 (−3951–−1883) | 0.8324 |
| Δ lean [g] | 608 ± 1927 (−180–1403) | 685 (82–1192) | 793 ± 2848 (404–1184) | 745 (−4–1483) | 0.7496 |
| Male (android) | |||||
| Δ fat [g] | −334 ± 879 (−457–−212) | −233 (−357–−178) | −320 ± 853 (−471–−169) | −376 (−478–−275) | 0.8638 |
| Δ lean [g] | −138 ± 696 (−252–−28) | −81 (−225–−37) | −110 ± 635 (−263–36) | −152 (−222–27) | 0.5828 |
| Female (gynoid) | |||||
| Δ fat [g] | −523 ±1317 (−673–−373) | −507 (−773–−304) | −700 ± 1230 (−914–−486) | −637 (−1004–−439) | 0.2027 |
| Δ lean [g] | 227 ± 224 (71–400) | 227 (32–504) | 568 ± 188 (325–836) | 510 (331–829) | 0.0211 |
| Arms | |||||
| Δ fat [g] | −96 ± 795 (−258–80) | −122 (−185–53) | −258 ± 730 (−476–−8) | −295 (−480–−162) | 0.1746 |
| Δ lean [g] | −45 ± 839 (−227–148) | −137 (−328–222) | −169 ± 777 (−409–96) | −154 (−400–−7) | 0.4530 |
| Legs | |||||
| Δ fat [g] | −879 ± 2563 (−1290–−472) | −948 (−1123–−570) | −719 ±−2779 (−1079 - −362) | −666 (−1229–−2779) | 0.5938 |
| Δ lean [g] | 454 ± 968 (45–886) | 354 (94–1061) | 1141 ± 1012 (674–1630) | 774 (583–1567) | 0.0381 |
| Trunk | |||||
| Δ fat [g] | −1671 ± 4321 (−2515–−761) | −1468 (−2113–−862) | −1784 ± 4590 (−2521–−996) | −1990 (−2680–−1512) | 0.9346 |
| Δ lean [g] | 90 ± 2377 (−493–674) | 190 (−648–553) | −307 ± 2383 (−963–350) | −27 (−639–378) | 0.5387 |
Publisher’s Note: MDPI stays neutral with regard to jurisdictional claims in published maps and institutional affiliations. |
© 2022 by the authors. Licensee MDPI, Basel, Switzerland. This article is an open access article distributed under the terms and conditions of the Creative Commons Attribution (CC BY) license (https://creativecommons.org/licenses/by/4.0/).
Share and Cite
Jamka, M.; Piotrowska-Brudnicka, S.E.; Karolkiewicz, J.; Skrypnik, D.; Bogdański, P.; Cielecka-Piontek, J.; Sultanova, G.; Walkowiak, J.; Mądry, E. The Effect of Endurance and Endurance-Strength Training on Bone Health and Body Composition in Centrally Obese Women—A Randomised Pilot Trial. Healthcare 2022, 10, 821. https://doi.org/10.3390/healthcare10050821
Jamka M, Piotrowska-Brudnicka SE, Karolkiewicz J, Skrypnik D, Bogdański P, Cielecka-Piontek J, Sultanova G, Walkowiak J, Mądry E. The Effect of Endurance and Endurance-Strength Training on Bone Health and Body Composition in Centrally Obese Women—A Randomised Pilot Trial. Healthcare. 2022; 10(5):821. https://doi.org/10.3390/healthcare10050821
Chicago/Turabian StyleJamka, Małgorzata, Sylwia E. Piotrowska-Brudnicka, Joanna Karolkiewicz, Damian Skrypnik, Paweł Bogdański, Judyta Cielecka-Piontek, Gulnara Sultanova, Jarosław Walkowiak, and Edyta Mądry. 2022. "The Effect of Endurance and Endurance-Strength Training on Bone Health and Body Composition in Centrally Obese Women—A Randomised Pilot Trial" Healthcare 10, no. 5: 821. https://doi.org/10.3390/healthcare10050821
APA StyleJamka, M., Piotrowska-Brudnicka, S. E., Karolkiewicz, J., Skrypnik, D., Bogdański, P., Cielecka-Piontek, J., Sultanova, G., Walkowiak, J., & Mądry, E. (2022). The Effect of Endurance and Endurance-Strength Training on Bone Health and Body Composition in Centrally Obese Women—A Randomised Pilot Trial. Healthcare, 10(5), 821. https://doi.org/10.3390/healthcare10050821