Abstract
The aim of this study was to investigate the influence of statin on glycemic control in different age groups. Patients admitted for suspected or confirmed coronary artery disease between January 2005 and December 2013 in Seoul, Korea were initially enrolled. After propensity score matching, 2654 patients (1:1 statin users and non-users) were selected out of total 5041 patients, including 1477 “young” patients (≤60 y) and 1177 elderly patients (>60 y). HbA1c was decreased by 0.04% (±0.86%) in statin non-users. On the contrary, a slight increment of 0.05% (±0.71%) was found in statin users (p < 0.001). The change patterns of HbA1c were constant in both young and elderly patient groups. Furthermore, elderly statin users demonstrated significantly worse glycemic control in serum insulin and homeostatic model assessment—insulin resistance (HOMA-IR) index. In elderly patients, statin users were found to have a 2.61 ± 8.34 μU/mL increment in serum insulin, whereas it was 2.35 ± 6.72 μU/mL for non-users (p = 0.012). Statin users had a 0.78 ± 3.28 increment in HOMA-IR, in contrast to the 0.67 ± 2.51 increment in statin non-users (p = 0.008). In conclusion, statin treatment was associated with adverse glycemic control in the elderly population.
1. Introduction
Statins are widely used for patients who are at risk of or have cardiovascular diseases, to lower their serum levels of low-density lipoprotein cholesterol (LDL), which is the presumed origin of atherosclerotic cardiovascular disease (ASCVD). Since the disclosure of Justification for the Use of Statins in Prevention: an Intervention Trial Evaluating Rosuvastatin (JUPITER) in 2008, showing that statin could increase the risk of new-onset diabetes (NOD), clinicians raised concern about the statin-associated adverse glucose control [1]. Recently published data demonstrated the dysglycemic effect of statins and statin therapy, especially high dose therapy, that resulted in increased diabetes risk, yet stain usage is increasing [1,2,3,4,5]. Indeed, it is well established that statin induces excess risk of type 2 diabetes [4]. This risk is particularly elevated in patients with already high diabetes risk, according to warning from the US Food and Drug Administration in 2012 [5]. However, the predictors of the development of diabetes have not been fully clarified. Given the evident benefit and the necessity of statin therapy, clarifying the vulnerable patients is critical to providing more care to them to reduce the possible development of diabetes and consequent complications.
Being postmenopausal, having a high body mass index (BMI) and having a high baseline fasting blood glucose level are considered as risk factors of NOD under statin therapy [2,5,6,7]. However, to date, there is still no consensus on whether age is a risk factor of statin-associated dysglycemia [8,9,10,11,12,13]. Statin-related dysglycemia, e.g., new onset diabetes, may occur at younger ages, as shown by an IDEAL trial [2], and older ages [9,12,13]. Furthermore, it is not established whether the dosage of statin should be modified in elderly patients based on the possible incremental risk of dysglycemia. However, statin has been recommended for patients <75 years old at high risk of cardiovascular diseases in order to reduce the likelihood of ASCVD related events [4,14]. Given the inconsistent results of prior studies, the current study aimed to investigate the influence of statin on glycemic control.
2. Materials and Methods
2.1. Study Participants and Study Design
In this retrospective cohort study, a total of 5041 patients who were admitted for suspected or confirmed coronary artery disease between January 2005 and December 2013 at Guro Hospital, Seoul, Korea, were initially enrolled. The diagnosis criteria of suspected or confirmed coronary artery disease included: (1) had >50% coronary artery stenosis detected during coronary angiogram testing; (2) had typical symptoms of cardiac ischemia or (3) had myocardial infarction; (4) had coronary revascularization surgery, either Percutaneous Transluminal Coronary Intervention (PCI) or Coronary Artery Bypass Grafting (CABG). All patients signed patient informed consent and were divided into statin user and non-user groups. The statins strategy was left to the clinician’s discretion according to patient’s individual conditions. Patients were excluded if they changed their statin strategy plans, i.e., either statin users suspended statin use, or non-statin users started to use statins during the follow-up period, regardless of any reasons.
2.2. Data Assessment
The following demographic and clinical data were extracted from medical records: age at prescription date, gender, diagnostic history of acute coronary syndrome, diabetes and impaired glucose tolerance; concurrent medications, including β-blockers, calcium-channel blockers (CCB), angiotensin II receptor blockers (ARB), angiotensin-converting enzyme inhibitors (ACEI), diuretics, nitrates and fenofibrate. Laboratory testing results before prescription of statin were also extracted, including serum levels of fasting blood glucose, glycosylated hemoglobin (HbA1c), total cholesterol, high-density lipoprotein (HDL), triglyceride, LDL, high-sensitivity C-reactive protein (hs-CRP), aspartate aminotransferase (AST), alanine aminotransferase (ALT), alkaline phosphatase (ALP), fasting insulin, creatinine and uric acid. The homeostasis model assessment—insulin resistance (HOMA-IR) index was also calculated, which was defined as fasting glucose (mmol/L) × fasting insulin (μU/mL) divided by 22.5 as a parameter of insulin resistance [15].
Patients were divided into two groups according to their statin administration (statin user and non-user). Besides, patients were further classified into a “young” group (≤60 years old) and an elderly group (>60 years old).
2.3. Statistical Analysis
Continuous variables at baseline were compared between two groups using an independent-sample Student’s t-test and are presented as means ± standard deviations (std). Categorical variables at baseline were compared between two groups using chi-square statistics and are each presented as a number with a percentage. Between-group differences of the changes in fasting blood glucose, fasting insulin, HbA1c and HOMA-IR after statin treatment were compared using a repeated general linear model (GLM), while adjusting for gender, BMI, diabetes, β-blocker use, ACEI use, ARB use and diuretics use.
In order to balance the baseline characteristics between statin users and non-users, propensity score matching was utilized. Those baseline characteristics that were significantly different between statin user and non-user groups, including age, sex, hyperlipemia, diabetes, impaired glucose tolerance and coronary artery disease, were adjusted for propensity score, with a caliper width of 0.02, and neighbor 1:1 matching algorithm. A p-value < 0.05 (two sides) was considered as statistically significant. Data were analyzed using SPSS software (version 19.0 Inc., Chicago, IL, USA).
3. Results
3.1. Cohort Baseline and Glycemic Control before Propensity Score Matching
Initially, 5041 patients were enrolled, the majority of whom (n = 3541, 70.2%) were treated with a statin. Only 1500 (29.8%) patients were not receiving any statin therapy (Table 1, Supplemental Figure S1). Compared with non-users, statin users were more likely to be male (51.4%) and older (60.55 ± 10.42 years), and had higher prevalences of hyperlipidemia (14.1%), diabetes (55.4%) and coronary artery disease (11.8%) (all p-value < 0.05). On the other hand, less stain users had impaired glucose tolerance than non-statin users (32.8% vs. 43.5%). Furthermore, statin users also had higher serum levels of fasting blood glucose (120.02 ± 38.41 vs. 111.13 ± 34.64 mg/dL in statin users and non-users, respectively), HbA1c and insulin; a higher mean HOMA-IR; and were more likely to receive ACEI or ARB (all p-value < 0.05). Nearly all these differences were consistent in the subgroup analysis stratified by age.

Table 1.
Baselines of study patients stratified by age group before propensity score matching.
In the overall cohort, after treatment, statin users (−0.03 ± 0.98%) had a 50% lower level of HbA1c (−0.02 ± 0.82%), a 21.2% lower insulin level and a 13.4% lower level of HOMA-IR than non-statin users (all p < 0.05) (Table 2). These significant variances were also observed in the subgroup of elderly patients. However, in young patients, statin users (−0.02 ± 1.06) only had a more significant reduction in serum level of HbA1c than young statin non-users (−0.00 ± 0.79) (p < 0.001).
Table 2.
Changes in serum levels of glucose, HbA1c, insulin and HOMA-IR among non-statin users and statin users before propensity score matching—overall and in young and elderly cohorts.
3.2. Cohort Baseline and Glycemic Control after Propensity Score Matching
After propensity score matching, statin users and non-users were not statistically different in gender, age, the prevalence of dyslipidemia, diabetes, coronary artery disease, glucose metabolism profile (including fasting blood glucose, insulin level, HbA1c and HOMA-IR) and concomitant medications (all p > 0.05) (Table 3). However, statin users had a higher serum level of LDL than non-users (108.08 ± 38.42 and 113.10 ± 27.02 mg/dL for statin users and non-users, respectively), but lower Lpa (26.69 ± 29.33 and 19.80 ± 19.44 mg/dL) (all p < 0.001).
Table 3.
Baselines of study patients stratified by young and elderly groups after propensity score matching.
In the subgroups of young and elderly patients, lower Lpa levels were also observed in statin users, regardless of age group. No statistical differences were observed in young patients in LDL level between statin users and non-users (p = 0.559). Nevertheless, in elderly patients, statin users performed better in lipid control for total cholesterol and LDL (all p < 0.001).
Fasting blood glucose was increased by 0.54 ± 30.98 mg/dL in statin non-users and 2.24 ± 30.27 mg/dL in statin users, although this discrepancy was not statistically significant (p = 0.292) (Table 4, Figure 1). More importantly, HbA1c was decreased by 0.04% (±0.86%) in statin non-users, whereas an increment in 0.05% (±0.71%) was found in statin users (p < 0.001) (Figure 2). The change patterns of HbA1c were constant in both young and elderly patient groups. Serum levels of fasting insulin and HOMA-IR were all increased among statin users and non-users in the total population and the different age groups (Figure 3). However, in the elderly patient group only, statin users showed worse performance in these indicators. In this subgroup, statin users were found to have a 2.61 ± 8.34 μU/mL increment in serum insulin, whereas the non-users had a 2.35 ± 6.72 μU/mL (p = 0.012) increment. There was a 0.78 ± 3.28 increment in HOMA-IR among users, and a 0.67 ± 2.51 increment in non-users (p = 0.008) (Table 4, Figure 4).
Table 4.
Changes in serum levels of fasting blood glucose, HbA1c, insulin and HOMA-IR index among non-statin and statin users after propensity score matching, overall and in young and elderly cohorts.
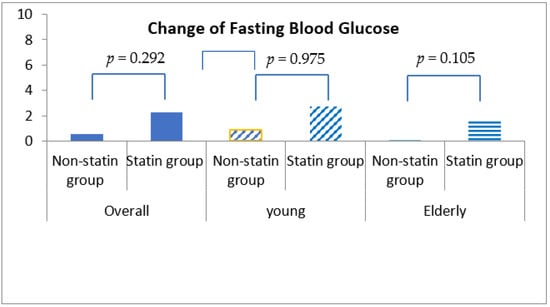
Figure 1.
Changes in fasting blood glucose levels among non-statin and statin users overall and in young and elderly cohorts after propensity score matching.
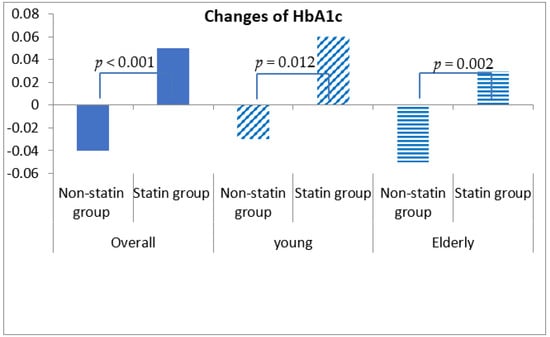
Figure 2.
Changes in serum levels of HbA1c among non-statin and statin users overall and in young and elderly patients after propensity score matching.
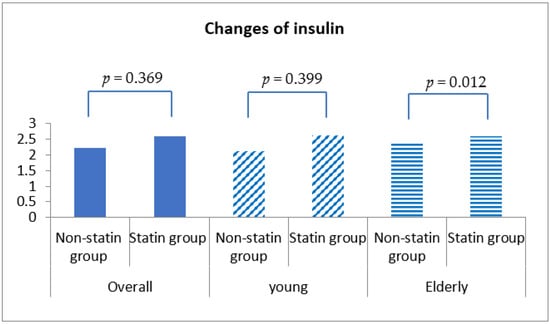
Figure 3.
Changes in serum insulin level among non-statin and statin users overall and in young and elderly patients after propensity score matching.
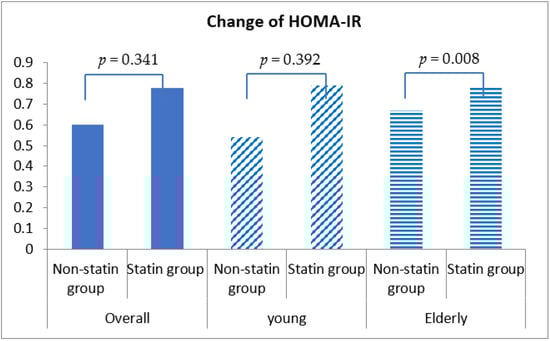
Figure 4.
Changes in homeostasis model assessment insulin resistance (HOMA-IR) index among non-statin and statin users overall and in young and elderly patients after propensity score matching.
4. Discussion
In the current cohort, statin treatment increased HbA1c significantly in all patients, regardless of age group. In addition, statin use was associated with adverse glucose metabolism, signified by increments in insulin level and HOMA-IR in the elderly patients but not in young patients.
Previous results have suggested an excess risk of new onset diabetes of around 9–13% in individuals treated with statins [9,14,15,16]. This off-target effect could be triggered through several mechanisms: inhibition of insulin secretion from pancreatic beta-cells by means of changes in activity of voltage-gated calcium channels; reduction in serum ubiquinol-10 and consequently of ATP production and insulin secretion; insulin resistance of peripheral tissues due to attenuation of glucose transporter 4 expression on adipocytes and damage to skeletal muscle cells [15,17,18,19,20,21].
A study conducted by Sattar et al. supported the increased risk of NOD in the elderly statin uses [9]. In this meta-analysis, which identified 13 statin trials with 91,140 participants, Sattar et al. reported a higher risk of developing diabetes in elderly statin users than younger statin users. The result was consistent with outcomes reported in a recent study conducted by Ma et al. and the ATTEMPT trial [12,13]. Conversely, after pooled TNT analysis in IDEAL and SPARCL studies, Waters and his colleagues did not find age differences between patients with and without NOD [2]. A study conducted by Chen et al. drew a similar conclusion to the IDEAL study: that the risk of statin-related NOD was more evident for young women (aged 40–64 years old) compared to the elderly (aged 65 years or more) [10]. The adjusted risk increased about 14% for every 10-year increment in age, taking 40–54 as a baseline age range. Increased age exhibited an inverse relationship with the risk of statin-induced NOD. Meanwhile, the third kind of inconsistent result was reported by several previous studies [3,11], which suggested no predictive effect of age or only a non-significant numeric trend of younger age predisposing to statin-related NOD.
Different types of statin were believed to exert different dysglycemic effect in patients with or without diabetes. Through comparison studies on effects of several statins, Cortese F et al. concluded that rosuvastatin should represent the first-choice drug in the management of diabetic subjects, not only due to its lipid lowering efficacy in these patients, but also due to its pleiotropic effects [22]. A 20 mg rosuvastatin daily dose for 12 weeks is effective at reducing discomforts in subjects with diabetic polyneuropathy [23]. Additionally, more importantly, no significant change in fasting glucose, glycated hemoglobin or nerve growth factor beta was found. As to the risk of NOD development during statin treatment, it was related to the type of statin and the intensity of dose administered [22]. Pravastatin, one of the less powerful statins but one which has only minor diabetogenic effects, should be preferred in the management of patients with high LDL-C serum levels who are at low CV risk and have predictive factors for diabetes. Conversely, rosuvastatin, known as the most powerful statin for reducing serum LDL-C but which has a significant effect on the development of NOD, should be used in subjects at high CV risk or in secondary prevention. In regard to the dose to administer, physicians should take into account the patient’s past medical history. Besides, they should perform periodic long-term glycometabolic control in order to eventually switch to a lower statin dose.
Notably, the demographic characteristics and concomitant medication were not equal between NOD cases and controls in the study reported by Chen et al. [10]. Higher prevalences of ACEI and triglyceride-lowering medications were observed in control groups. Recently, several studies reported the impact of antihypertensive medicine on glucose metabolism, which has been accepted widely and could not be ignored. Furthermore, the baseline BMI was not available, either, which was deemed as an independent risk factor of NOD. The above-mentioned studies [12,13], which found a higher incidence of NOD in the elderly participants, could not demonstrate the impact of age on the statin-related dysglycemic effect, even though they proved the predictive effect of age on NOD. Moreover, the uncertainty of comparable baseline characteristics between groups of different ages attenuated the strength of the analyses [10,12,13].
Considering the improvements via ACEI or ARB and the deterioration caused by diuretics or β-blockers on glycemic metabolism/control, which have been confirmed by clinical investigations [24,25,26], the combination medication was matched with propensity score and adjusted with GLM in the present study. In addition to antihypertensive medicine, in the present study, we matched the fenofibrate use between the statin user and non-user groups with propensity score as well. The existing evidence suggested that combination statin/fibrate therapy has a potential neutralizing effect on the adverse pro-diabetic impact of statins and could prevent NOD [27]. After matching and adjusting the confounding factors, the current analysis demonstrated a statistically significant increment in HbA1c and numerical increments in fasting blood glucose, insulin level and HOMA-IR in the statin user group compared with the non-user group, for the whole cohort, which confirmed the statin-related dysglycemia. Furthermore, in different age subgroups, the significant increments in the elderly group compared with the insignificance of the increments in young patient group in terms of glucose metabolism parameters suggested the deteriorated glucose control induced by statin was mainly driven by older age. This evidence might imply that age could worsens the statin-related dysglycemic effect.
The significantly higher level in HbA1c of 0.09% induced by statin treatment in the current study was in line with previous studies, confirming the statin-related dysglycemic effect [20,28,29,30]. In the meta-analysis conducted by Erqou et al., a higher mean HbA1c level by 0.12% was observed in participants treated with statin than in controls [30]. Our findings of non-significant increments in fasting blood glucose, insulin and HOMA-IR after statin use in the present analysis are consistent with the results of some previous studies [31,32,33,34]. One of the possible reason for the lack of impact of statin on these parameters is the mixture of diabetes and non-diabetes patients. In patients with diabetes, the value of HOMA-IR and insulin level for evaluating insulin sensitivity is still controversial [34]. In nondiabetic patients, statin use was associated with significant increases in insulin level, fasting blood glucose and HOMA-IR [35], whereas no significant increase was observed in diabetes [36]. Therefore, in the present analysis, which involved a 36.3% diabetic cohort, the non-significant change induced by statin could be reasonable. The second reason could have been the insensitivity of fasting glucose as an index of glucose metabolism compared to postprandial blood glucose. Despite statin’s detrimental effect on glucose control and the increment in risk of NOD, fasting blood glucose was similar between statin-treated patients and controls, as in the JUPITER study [1].
Due to the increased risk of dysglycemia in the elderly compared to youth, in regard to effective lipid control, modifications of statin dosage and being more alert to NOD should be considered. Based on these observations in the present analysis, we suggest more monitoring of insulin resistance in nondiabetic patients who are receiving statin therapy, and monitoring blood glucose concentrations in elderly patients with diabetes who are receiving statin therapy.
Several limitations shall be noted. One limitation is that the present analysis is a retrospective study. Potential confounders were therefore inevitable, and selection bias cannot be eliminated. The baseline was not equal between statin users and non-users. However, the propensity score matching was performed to minimize the confounding factors. After matching, the baseline characteristics were similar for statin users and non-users. Furthermore, we did not evaluate the dysglycemic effect of statin among nondiabetic patients in particular. At baseline, a large portion of patients had impaired glucose tolerance. Further study should be encouraged to evaluate the dysglycemic effect of statins in populations free from glucose-related impairments. Lastly, we did not analyze the impacts of statin dosage and individual statin type on the glycemic control, which has been explored in previous study [37], showing the different potentials according to different types and dosages of statin regarding increasing the risk of NOD. A further large prospective trial to verify the age effect on statin-related dysglycemia is warranted.
5. Conclusions
In brief, statin treatment was associated with adverse glycemic control, which was characterized by increased HbA1c. Dysglycemia was more evident in elderly statin users than elderly non-users. Older age could have strengthened the detrimental effect of statin on glycemic control.
Supplementary Materials
The following are available online at https://www.mdpi.com/article/10.3390/healthcare10050777/s1, Figure S1: Study participants recruitment flowchart.
Author Contributions
Conceptualization, S.X. and S.-W.R.; methodology, S.X. and S.-W.R.; software, S.X.; formal analysis, S.X.; investigation, S.X.; resources, S.-W.R., B.G.C. and H.S.S.; data curation, S.X.; writing—original draft preparation, S.X.; writing—review and editing, all authors; supervision, S.-W.R. All authors have read and agreed to the published version of the manuscript.
Funding
This research received no external funding.
Institutional Review Board Statement
This study was approved by the Medical Ethics Committee at Guro Hospital (#KUGH10045), Seoul, Korea. This study was conducted in accordance with the Declaration of Helsinki.
Informed Consent Statement
Written informed consent was obtained from all participants.
Data Availability Statement
The datasets generated and/or analyzed during the current study are not publicly available due to ethical restrictions, but are available from the corresponding author on reasonable request.
Conflicts of Interest
The authors declare no conflict of interest.
References
- Ridker, P.M.; Danielson, E.; Fonseca, F.A.; Genest, J.; Gotto, A.M., Jr.; Kastelein, J.J.; Koenig, W.; Libby, P.; Lorenzatti, A.J.; MacFadyen, J.G.; et al. Rosuvastatin to Prevent Vascular Events in Men and Women with Elevated C-Reactive Protein. N. Engl. J. Med. 2008, 359, 2195–2207. [Google Scholar] [CrossRef] [PubMed]
- Waters, D.D.; Ho, J.; DeMicco, D.A.; Breazna, A.; Arsenault, B.J.; Wun, C.-C.; Kastelein, J.J.; Colhoun, H.; Barter, P. Predictors of New-Onset Diabetes in Patients Treated With Atorvastatin: Results From 3 Large Randomized Clinical Trials. J. Am. Coll. Cardiol. 2011, 57, 1535–1545. [Google Scholar] [CrossRef]
- Preiss, D.; Seshasai, S.R.K.; Welsh, P.; Murphy, S.A.; Ho, J.; Waters, D.D.; Demicco, D.A.; Barter, P.; Cannon, C.P.; Sabatine, M.S.; et al. Risk of incident diabetes with intensive-dose compared with moderate-dose statin therapy: A meta-analysi. JAMA J. Am. Med. Assoc. 2011, 305, 2556–2564. [Google Scholar] [CrossRef] [PubMed]
- Stone, N.; Robinson, J.G.; Lichtenstein, A.H.; Merz, C.N.B.; Blum, C.B.; Eckel, R.H.; Goldberg, A.C.; Gordon, D.; Levy, D.; Lloyd-Jones, D.; et al. 2013 ACC/AHA guideline on the treatment of blood cholesterol to reduce atherosclerotic cardiovascular risk in adults: A report of the American College of Cardiology/American Heart Association Task Force on Practice Guidelines. J. Am. Coll. Cardiol. 2014, 63, 2889–2934. [Google Scholar] [CrossRef] [PubMed]
- FDA Drug Safety Communication. Important Safety Label Changes to Cholesterol-Lowering Statin Drugs: Food and Drug Administration. Available online: http://www.fda.gov/Drugs/DrugSafety/ucm293101.htm2012 (accessed on 14 February 2022).
- Culver, A.L.; Ockene, I.S.; Balasubramanian, R.; Olendzki, B.; Sepavich, D.M.; Wactawski-Wende, J.; Manson, J.E.; Qiao, Y.; Liu, S.; Merriam, P.A.; et al. Statin Use and Risk of Diabetes Mellitus in Postmenopausal Women in the Women’s Health Initiative. Arch. Intern. Med. 2012, 172, 144–152. [Google Scholar] [CrossRef] [PubMed]
- Ridker, P.M.; Pradhan, A.; MacFadyen, J.G.; Libby, P.; Glynn, R.J. Cardiovascular benefits and diabetes risks of statin therapy in primary prevention: An analysis from the JUPITER trial. Lancet 2012, 380, 565–571. [Google Scholar] [CrossRef]
- Aiman, U.; Najmi, A.; Khan, R.A. Statin induced diabetes and its clinical implications. J. Pharmacol. Pharmacother. 2014, 5, 181–185. [Google Scholar] [CrossRef]
- Sattar, N.; Preiss, D.; Murray, H.M.; Welsh, P.; Buckley, B.M.; de Craen, A.J.M.; Seshasai, S.R.K.; Mcmurray, J.J.; Freeman, D.J.; Jukema, J.W.; et al. Statins and risk of incident diabetes: A collaborative meta-analysis of randomised statin trials. Lancet 2010, 375, 735–742. [Google Scholar] [CrossRef]
- Chen, C.-W.; Chen, T.-C.; Huang, K.-Y.; Chou, P.; Chen, P.-F.; Lee, C.-C. Differential Impact of Statin on New-Onset Diabetes in Different Age Groups: A Population-Based Case-Control Study in Women from an Asian Country. PLoS ONE 2013, 8, e71817. [Google Scholar] [CrossRef][Green Version]
- Wang, K.-L.; Liu, C.-J.; Chao, T.-F.; Huang, C.-M.; Wu, C.-H.; Chen, S.-J.; Chen, T.-J.; Lin, S.-J.; Chiang, C.-E. Statins, Risk of Diabetes, and Implications on Outcomes in the General Population. J. Am. Coll. Cardiol. 2012, 60, 1231–1238. [Google Scholar] [CrossRef]
- Ma, T.; Tien, L.; Fang, C.-L.; Liou, Y.-S.; Jong, G.-P. Statins and New-Onset Diabetes: A Retrospective Longitudinal Cohort Study. Clin. Ther. 2012, 34, 1977–1983. [Google Scholar] [CrossRef] [PubMed]
- Athyros, V.G.; Elisaf, M.S.; Alexandrides, T.; Achimastos, A.; Ganotakis, E.; Bilianou, E.; Karagiannis, A.; Liberopoulos, E.N.; Tziomalos, K.; Mikhailidis, D.P.; et al. Long-Term Impact of Multifactorial Treatment on New-Onset Diabetes and Related Cardiovascular Events in Metabolic Syndrome. Angiology 2011, 63, 358–366. [Google Scholar] [CrossRef] [PubMed]
- Tavazzi, L.; Maggioni, A.P.; Marchioli, R.; Barlera, S.; Franzosi, M.G.; Latini, R.; Lucci, D.; Nicolosi, G.L.; Porcu, M.; Tognoni, G.; et al. Effect of rosuvastatin in patients with chronic heart failure (the GISSI-HF trial): A randomised, double-blind, placebo-controlled trial. Lancet 2008, 372, 1231–1239. [Google Scholar] [CrossRef] [PubMed]
- Rajpathak, S.N.; Kumbhani, D.J.; Crandall, J.; Barzilai, N.; Alderman, M.; Ridker, P.M. Statin Therapy and Risk of Developing Type 2 Diabetes: A Meta-Analysis. Diabetes Care 2009, 32, 1924–1929. [Google Scholar] [CrossRef]
- Kjekshus, J.; Apetrei, E.; Barrios, V.; Boehm, M.; Cleland, J.G.F.; Cornel, J.H.; Dunselman, P.; Fonseca, C.; Goudev, A.; Grande, P.; et al. Rosuvastatin in Older Patients with Systolic Heart Failure. N. Engl. J. Med. 2007, 357, 2248–2261. [Google Scholar] [CrossRef]
- Mills, E.J.; Wu, P.; Chong, G.; Ghement, I.; Singh, S.; Akl, E.A.; Eyawo, O.; Guyatt, G.; Berwanger, O.; Briel, M. Efficacy and safety of statin treatment for cardiovascular disease: A network meta-analysis of 170 255 patients from 76 randomized trials. QJM Int. J. Med. 2011, 104, 109–124. [Google Scholar] [CrossRef]
- Xia, F.; Xie, L.; Mihic, A.; Gao, X.; Chen, Y.; Gaisano, H.Y.; Tsushima, R.G. Inhibition of cholesterol biosynthesis impairs insulin secretion and voltage-gated calcium channel function in pancreatic beta-cells. Endocrinology 2008, 149, 5136–5145. [Google Scholar] [CrossRef]
- Mabuchi, H.; Higashikata, T.; Kawashiri, M.; Katsuda, S.; Mizuno, M.; Nohara, A.; Inazu, A.; Koizumi, J.; Kobayashi, J. Reduction of Serum Ubiquinol-10 and Ubiquinone-10 Levels by Atorvastatin in Hypercholesterolemic Patients. J. Atheroscler. Thromb. 2005, 12, 111–119. [Google Scholar] [CrossRef] [PubMed]
- Nakata, M.; Nagasaka, S.; Kusaka, I.; Matsuoka, H.; Ishibashi, S.; Yada, T. Effects of statins on the adipocyte maturation and expression of glucose transporter 4 (SLC2A4): Implications in glycaemic control. Diabetologia 2006, 49, 1881–1892. [Google Scholar] [CrossRef]
- Draeger, A.; Monastyrskaya, K.; Mohaupt, M.; Hoppeler, H.; Savolainen, H.; Allemann, C.; Babiychuk, E. Statin therapy induces ultrastructural damage in skeletal muscle in patients without myalgia. J. Pathol. 2006, 210, 94–102. [Google Scholar] [CrossRef]
- Cortese, F.; Gesualdo, M.; Cortese, A.M.; Carbonara, S.; Devito, F.; Zito, A.; Ricci, G.; Scicchitano, P.; Ciccone, M.M. Rosuvastatin: Beyond the cholesterol-lowering effect. Pharmacol. Res. 2016, 107, 1–18. [Google Scholar] [CrossRef] [PubMed]
- Miranda-Diaz, A.G.; Pintos, L.M.R.; Rodriguez-Carrizalez, A.D.; Troyo-Sanroman, R.; Alatorre-Carranza, M.D.P.; Muñoz, E.G.C.; Hernandez-Ojeda, J. Effect of rosuvastatin on diabetic polyneuropathy: A randomized, double-blind, placebo-controlled Phase IIa study. Diabetes Metab. Syndr. Obes. Targets Ther. 2014, 7, 401–407. [Google Scholar] [CrossRef] [PubMed]
- Yang, Y.; Wei, R.-B.; Wang, Z.-C.; Wang, N.; Gao, Y.-W.; Li, M.-X.; Qiu, Q. A meta-analysis of the effects of angiotensin converting enzyme inhibitors and angiotensin II receptor blockers on insulin sensitivity in hypertensive patients without diabetes. Diabetes Res. Clin. Pract. 2014, 107, 415–423. [Google Scholar] [CrossRef] [PubMed]
- Gillespie, E.L.; White, C.M.; Kardas, M.; Lindberg, M.; Coleman, C.I. The Impact of ACE Inhibitors or Angiotensin II Type 1 Receptor Blockers on the Development of New-Onset Type 2 Diabetes. Diabetes Care 2005, 28, 2261–2266. [Google Scholar] [CrossRef]
- Lee, H.-Y.; Sakuma, I.; Ihm, S.-H.; Goh, C.-W.; Koh, K.K. Statins and Renin-Angiotensin System Inhibitor Combination Treatment to Prevent Cardiovascular Disease. Circ. J. 2014, 78, 281–287. [Google Scholar] [CrossRef]
- Tenenbaum, A.; Fisman, E.Z. Balanced pan-PPAR activator bezafibrate in combination with statin: Comprehensive lipids control and diabetes prevention? Cardiovasc. Diabetol. 2012, 11, 140. [Google Scholar] [CrossRef]
- Kostapanos, M.S.; Milionis, H.J.; Agouridis, A.-D.; Rizos, C.V.; Elisaf, M.S. Rosuvastatin treatment is associated with an increase in insulin resistance in hyperlipidaemic patients with impaired fasting glucose. Int. J. Clin. Pract. 2009, 63, 1308–1313. [Google Scholar] [CrossRef]
- Koh, K.K.; Quon, M.; Han, S.H.; Lee, Y.; Kim, S.J.; Shin, E.K. Atorvastatin Causes Insulin Resistance and Increases Ambient Glycemia in Hypercholesterolemic Patients. J. Am. Coll. Cardiol. 2010, 55, 1209–1216. [Google Scholar] [CrossRef]
- Swerdlow, D.I.; Sattar, N. A dysglycaemic effect of statins in diabetes: Relevance to clinical practice? Diabetologia 2014, 57, 2433–2435. [Google Scholar] [CrossRef][Green Version]
- Huptas, S.; Geiss, H.-C.; Otto, C.; Parhofer, K.G. Effect of Atorvastatin (10 mg/day) on Glucose Metabolism in Patients with the Metabolic Syndrome. Am. J. Cardiol. 2006, 98, 66–69. [Google Scholar] [CrossRef]
- Anagnostis, P.; Selalmatzidou, D.; Polyzos, S.A.; Panagiotou, A.; Slavakis, A.; Athyros, V.G.; Karagiannis, A.; Mikhailidis, D.P.; Kita, M. Comparative effects of rosuvastatin and atorvastatin on glucose metabolism and adipokine levels in non-diabetic patients with dyslipidaemia: A prospective randomised open-label study. Int. J. Clin. Pract. 2011, 65, 679–683. [Google Scholar] [CrossRef] [PubMed][Green Version]
- Okada, K.; Maeda, N.; Kikuchi, K.; Tatsukawa, M.; Sawayama, Y.; Hayashi, J. Pravastatin Improves Insulin Resistance in Dyslipidemic Patients. J. Atheroscler. Thromb. 2005, 12, 322–329. [Google Scholar] [CrossRef] [PubMed][Green Version]
- Liu, P.-Y.; Lin, L.-Y.; Lin, H.-J.; Hsia, C.-H.; Hung, Y.-R.; Yeh, H.-I.; Wu, T.-C.; Chen, J.-Y.; Chien, K.-L.; Chen, J.-W. Pitavastatin and Atorvastatin Double-Blind Randomized ComPArative Study among HiGh-Risk Patients, Including ThOse with Type 2 Diabetes Mellitus, in Taiwan (PAPAGO-T Study). PLoS ONE 2013, 8, e76298. [Google Scholar] [CrossRef] [PubMed]
- Moutzouri, E.; Liberopoulos, E.; Mikhailidis, D.P.; Kostapanos, M.S.; Kei, A.A.; Milionis, H.; Elisaf, M. Comparison of the effects of simvastatin vs. rosuvastatin vs. simvastatin/ezetimibe on parameters of insulin resistance. Int. J. Clin. Pract. 2011, 65, 1141–1148. [Google Scholar] [CrossRef]
- Zhou, Y.; Yuan, Y.; Cai, R.-R.; Huang, Y.; Xia, W.-Q.; Yang, Y.; Wang, P.; Wei, Q.; Wang, S.-H. Statin therapy on glycaemic control in type 2 diabetes: A meta-analysis. Expert Opin. Pharmacother. 2013, 14, 1575–1584. [Google Scholar] [CrossRef]
- Navarese, E.P.; Buffon, A.; Andreotti, F.; Kozinski, M.; Welton, N.; Fabiszak, T.; Caputo, S.; Grzesk, G.; Kubica, A.; Swiatkiewicz, I.; et al. Meta-Analysis of Impact of Different Types and Doses of Statins on New-Onset Diabetes Mellitus. Am. J. Cardiol. 2013, 111, 1123–1130. [Google Scholar] [CrossRef]
Publisher’s Note: MDPI stays neutral with regard to jurisdictional claims in published maps and institutional affiliations. |
© 2022 by the authors. Licensee MDPI, Basel, Switzerland. This article is an open access article distributed under the terms and conditions of the Creative Commons Attribution (CC BY) license (https://creativecommons.org/licenses/by/4.0/).