
The Measurement of Demographic Temperature Using the Sentiment Analysis of Data from the Social Network VKontakte

 ,
,
Abstract
1. Introduction
2. Data and Processing
3. Method: Thematic Modeling and Sentiment Analysis
- is a finite set of words;
- is a finite set of documents in the collection;
- is a finite set of topics;
- The word order in the document and the order of the documents in the collection are not important;
- Every word in the document is related to some topic
- —random vectors from Dirichlet Allocation with :
- —random vectors from Dirichlet Allocation with :

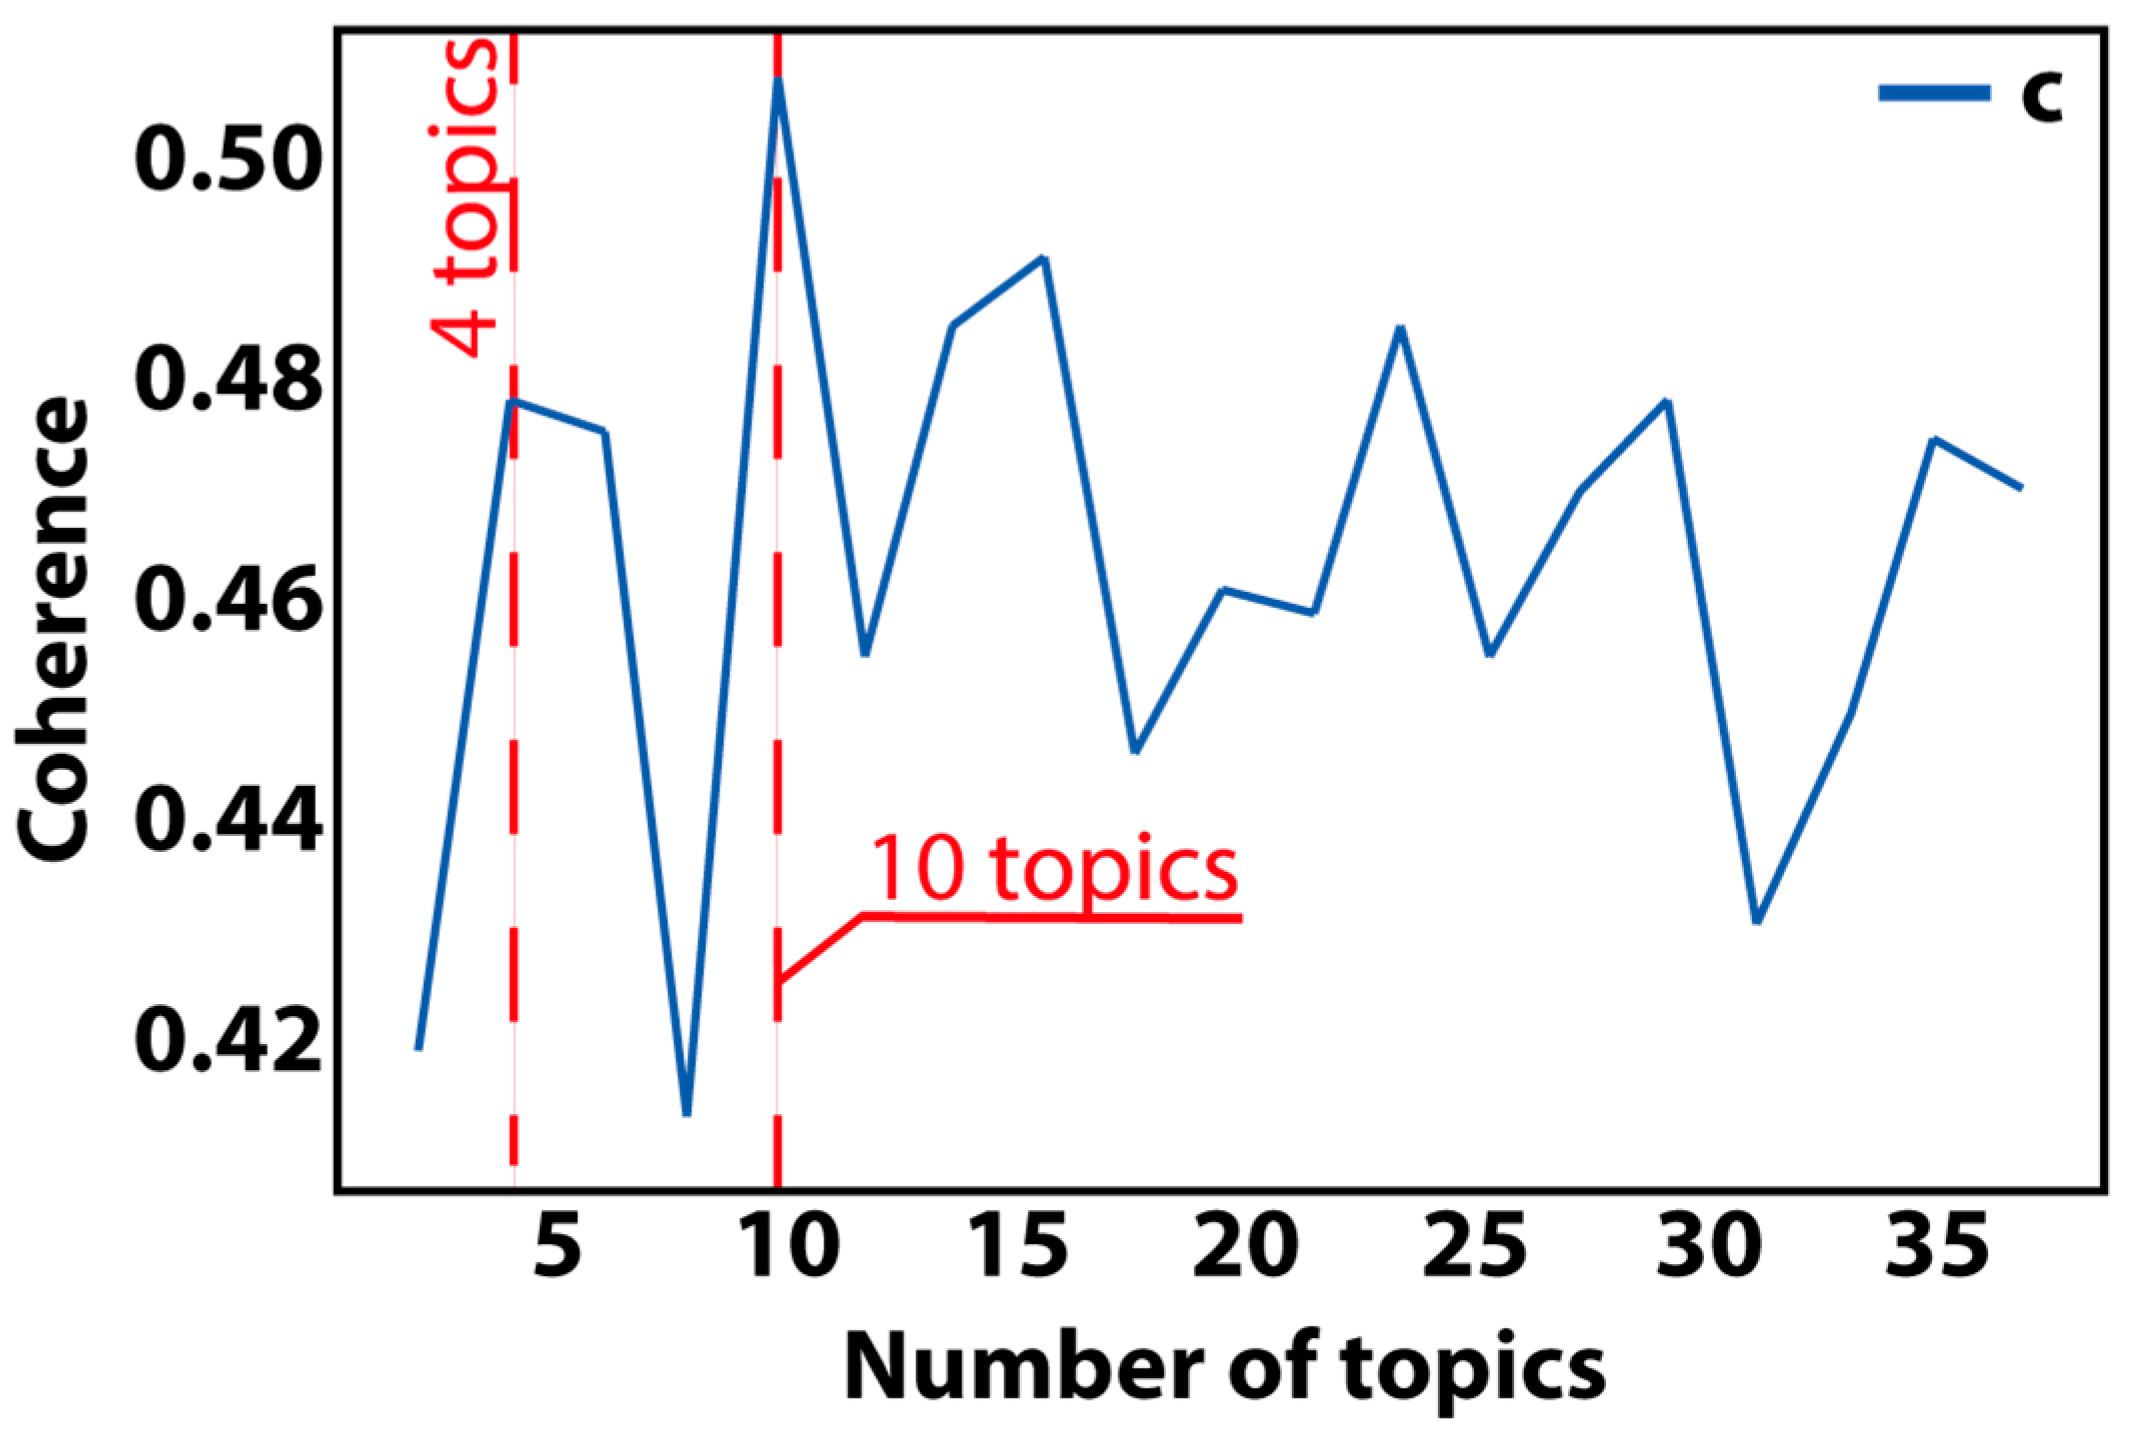
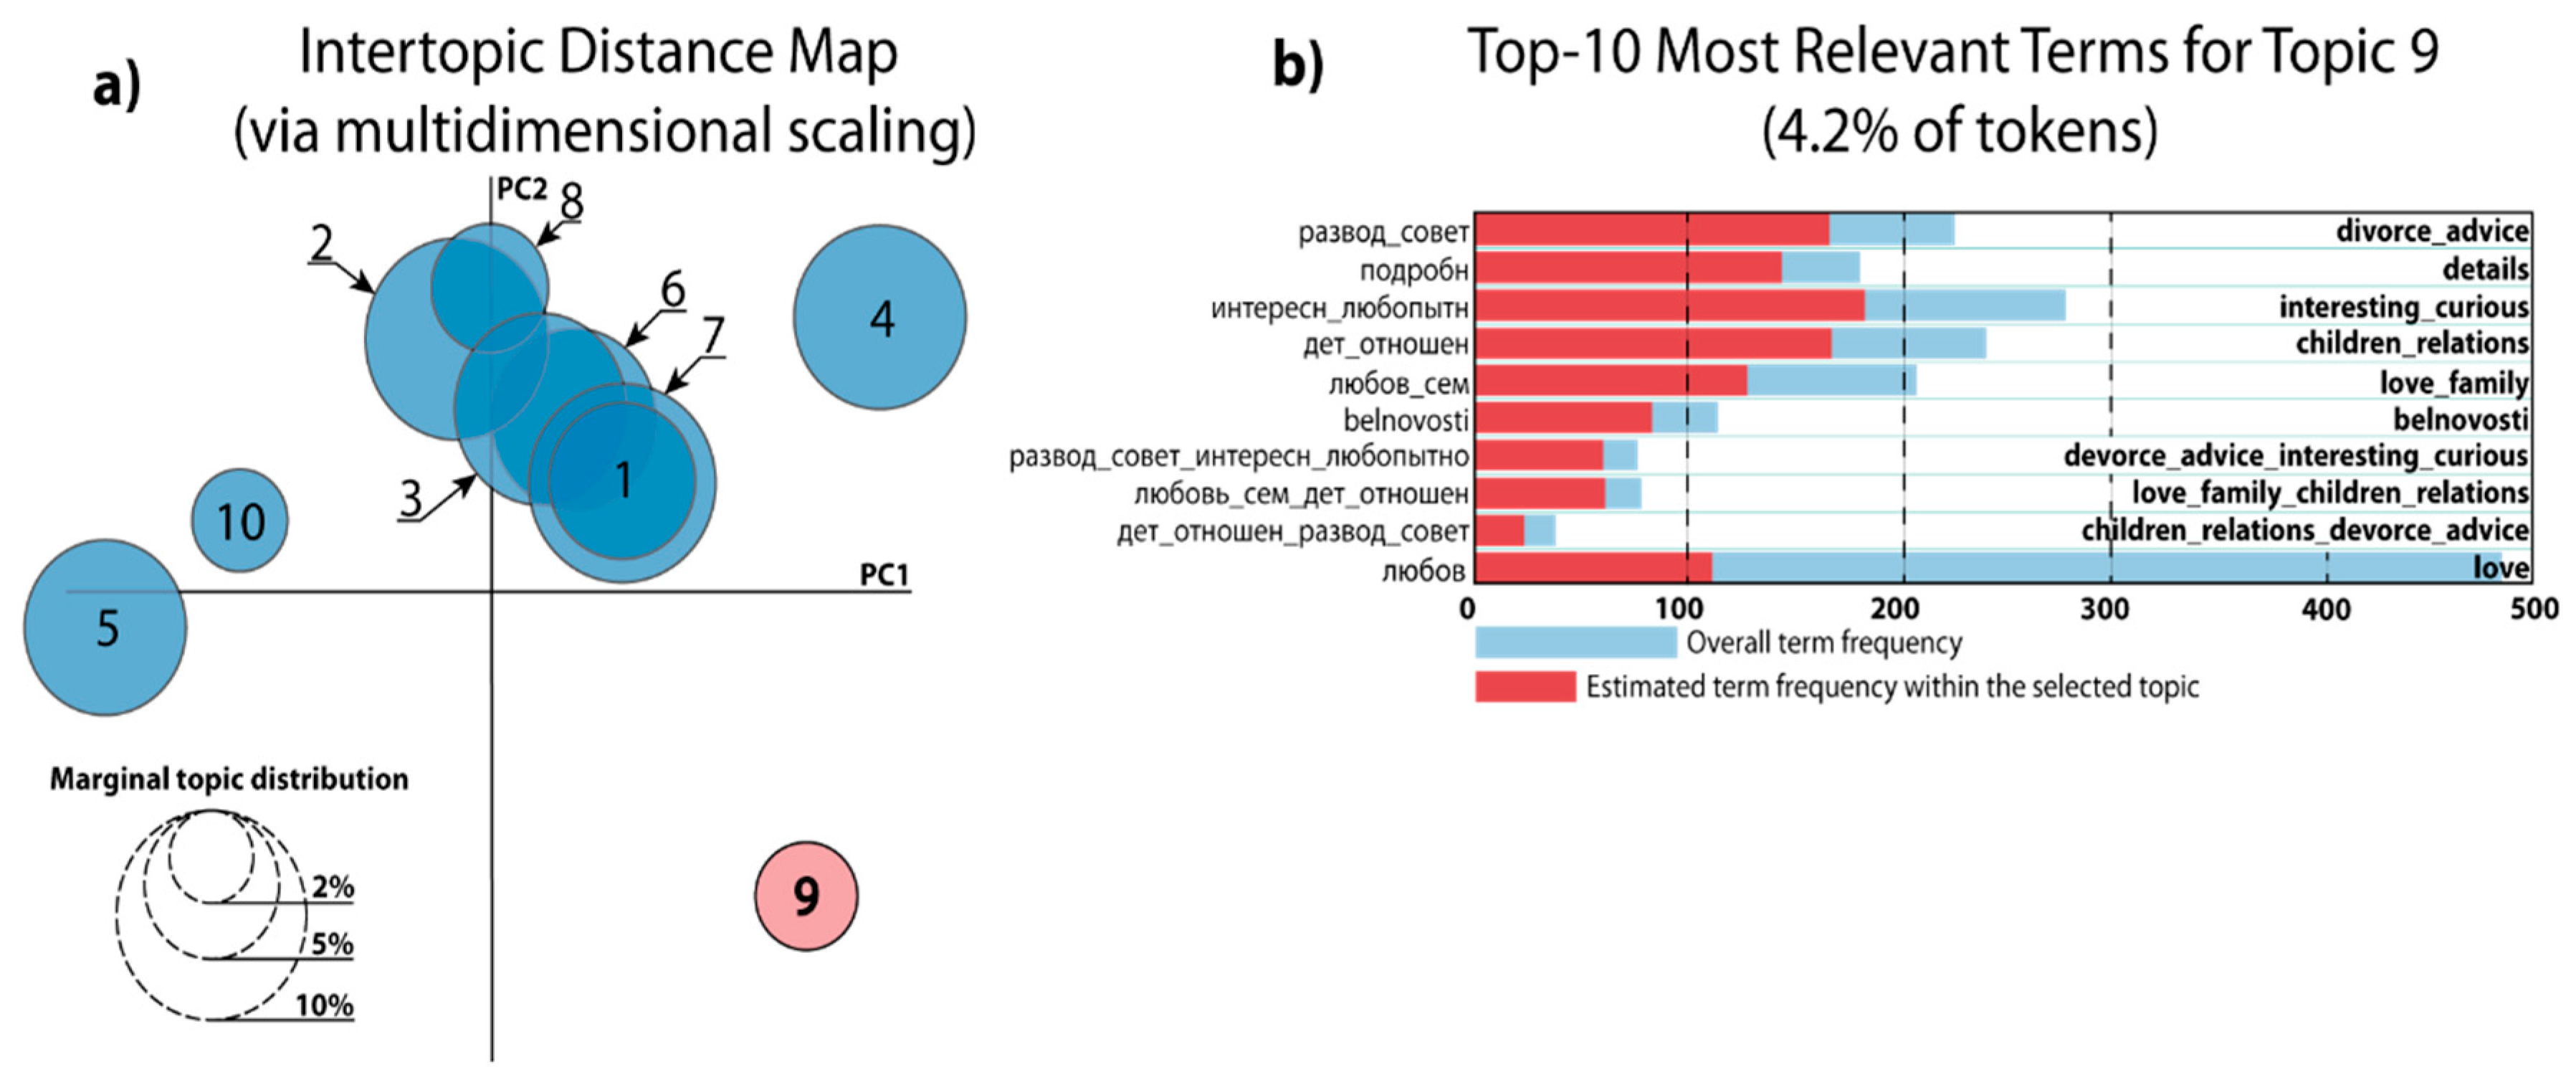
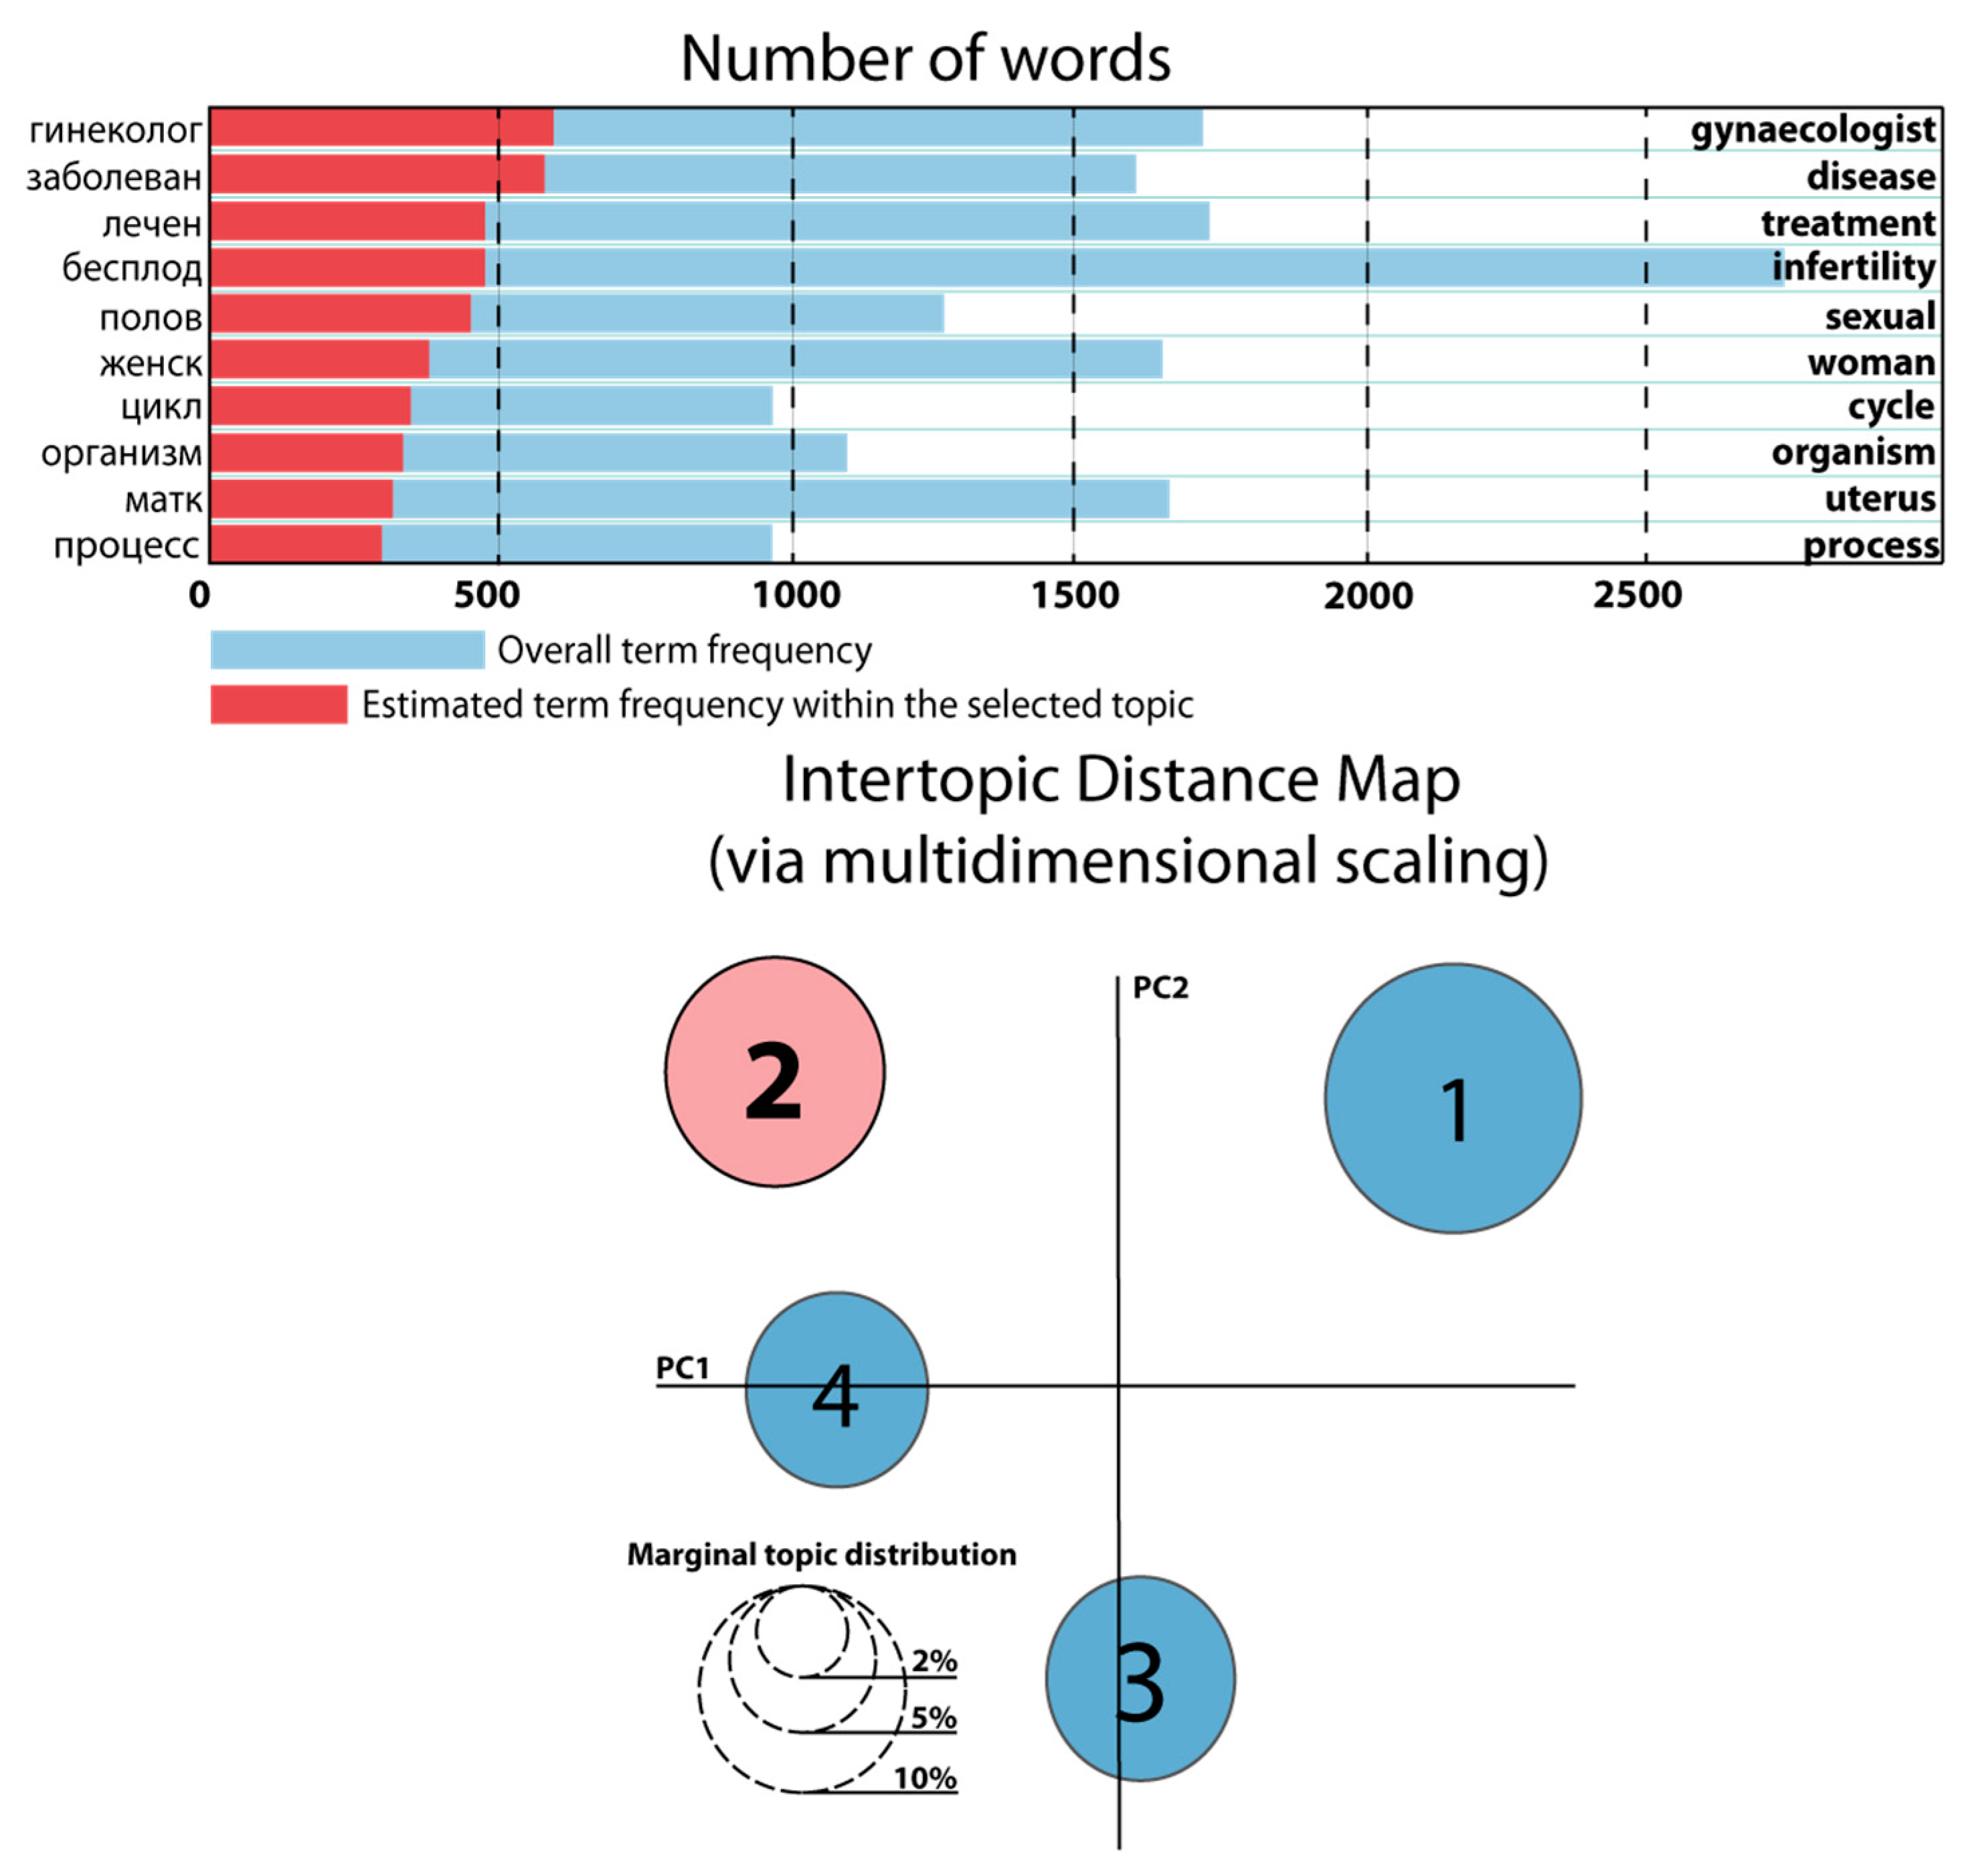
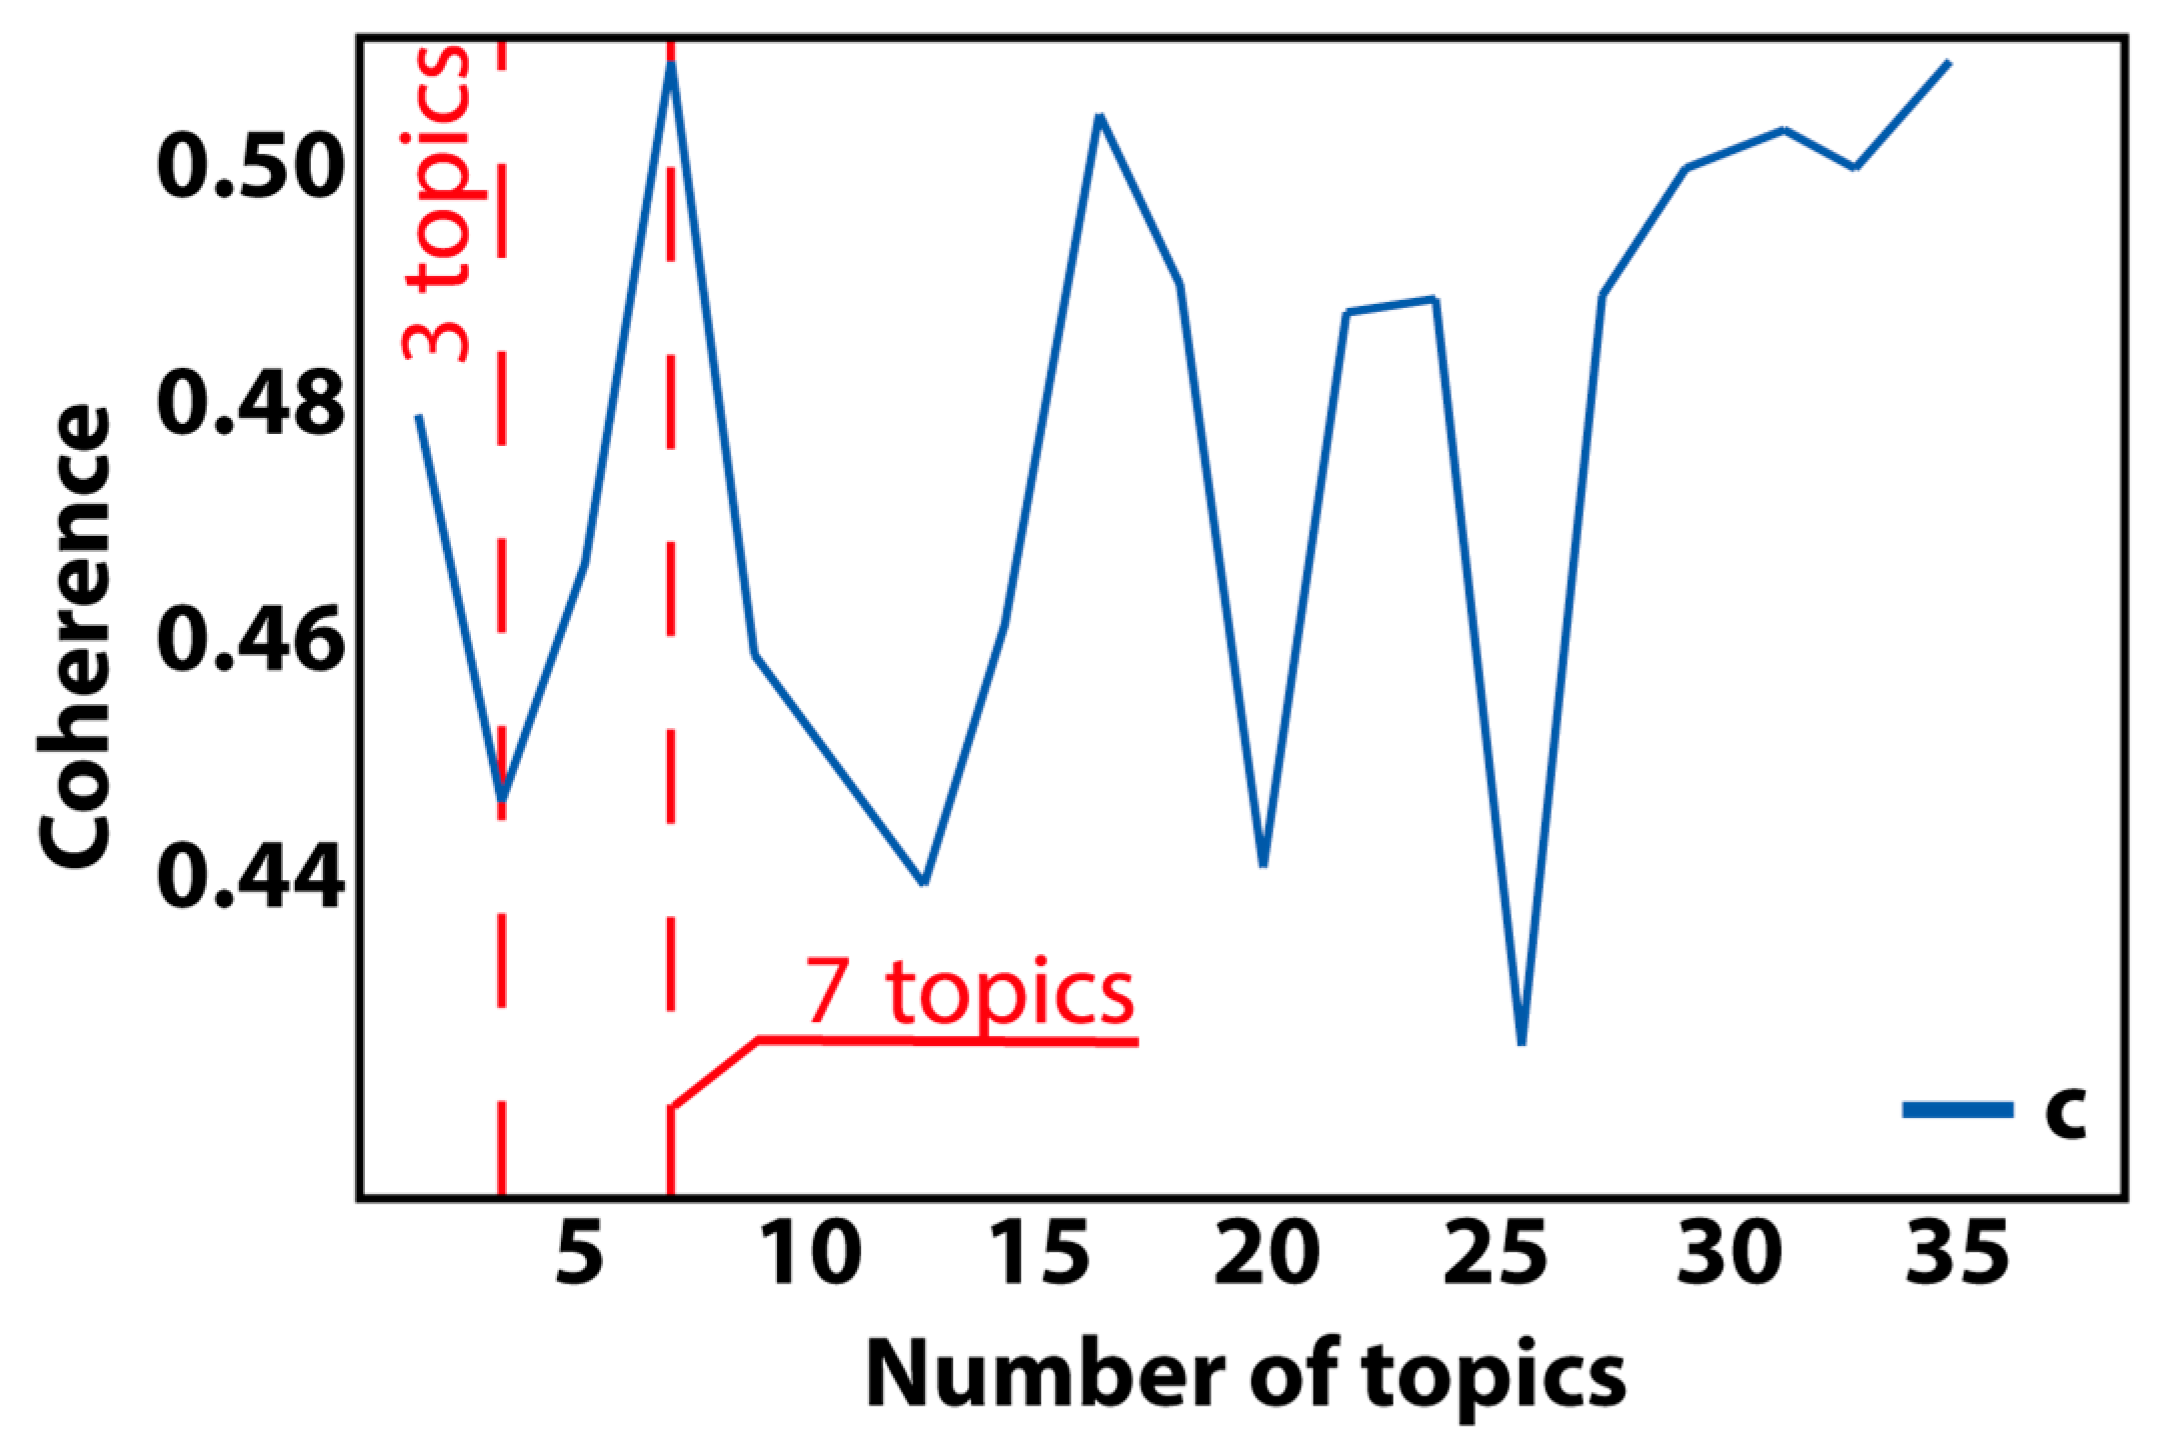
4. Results of Modeling
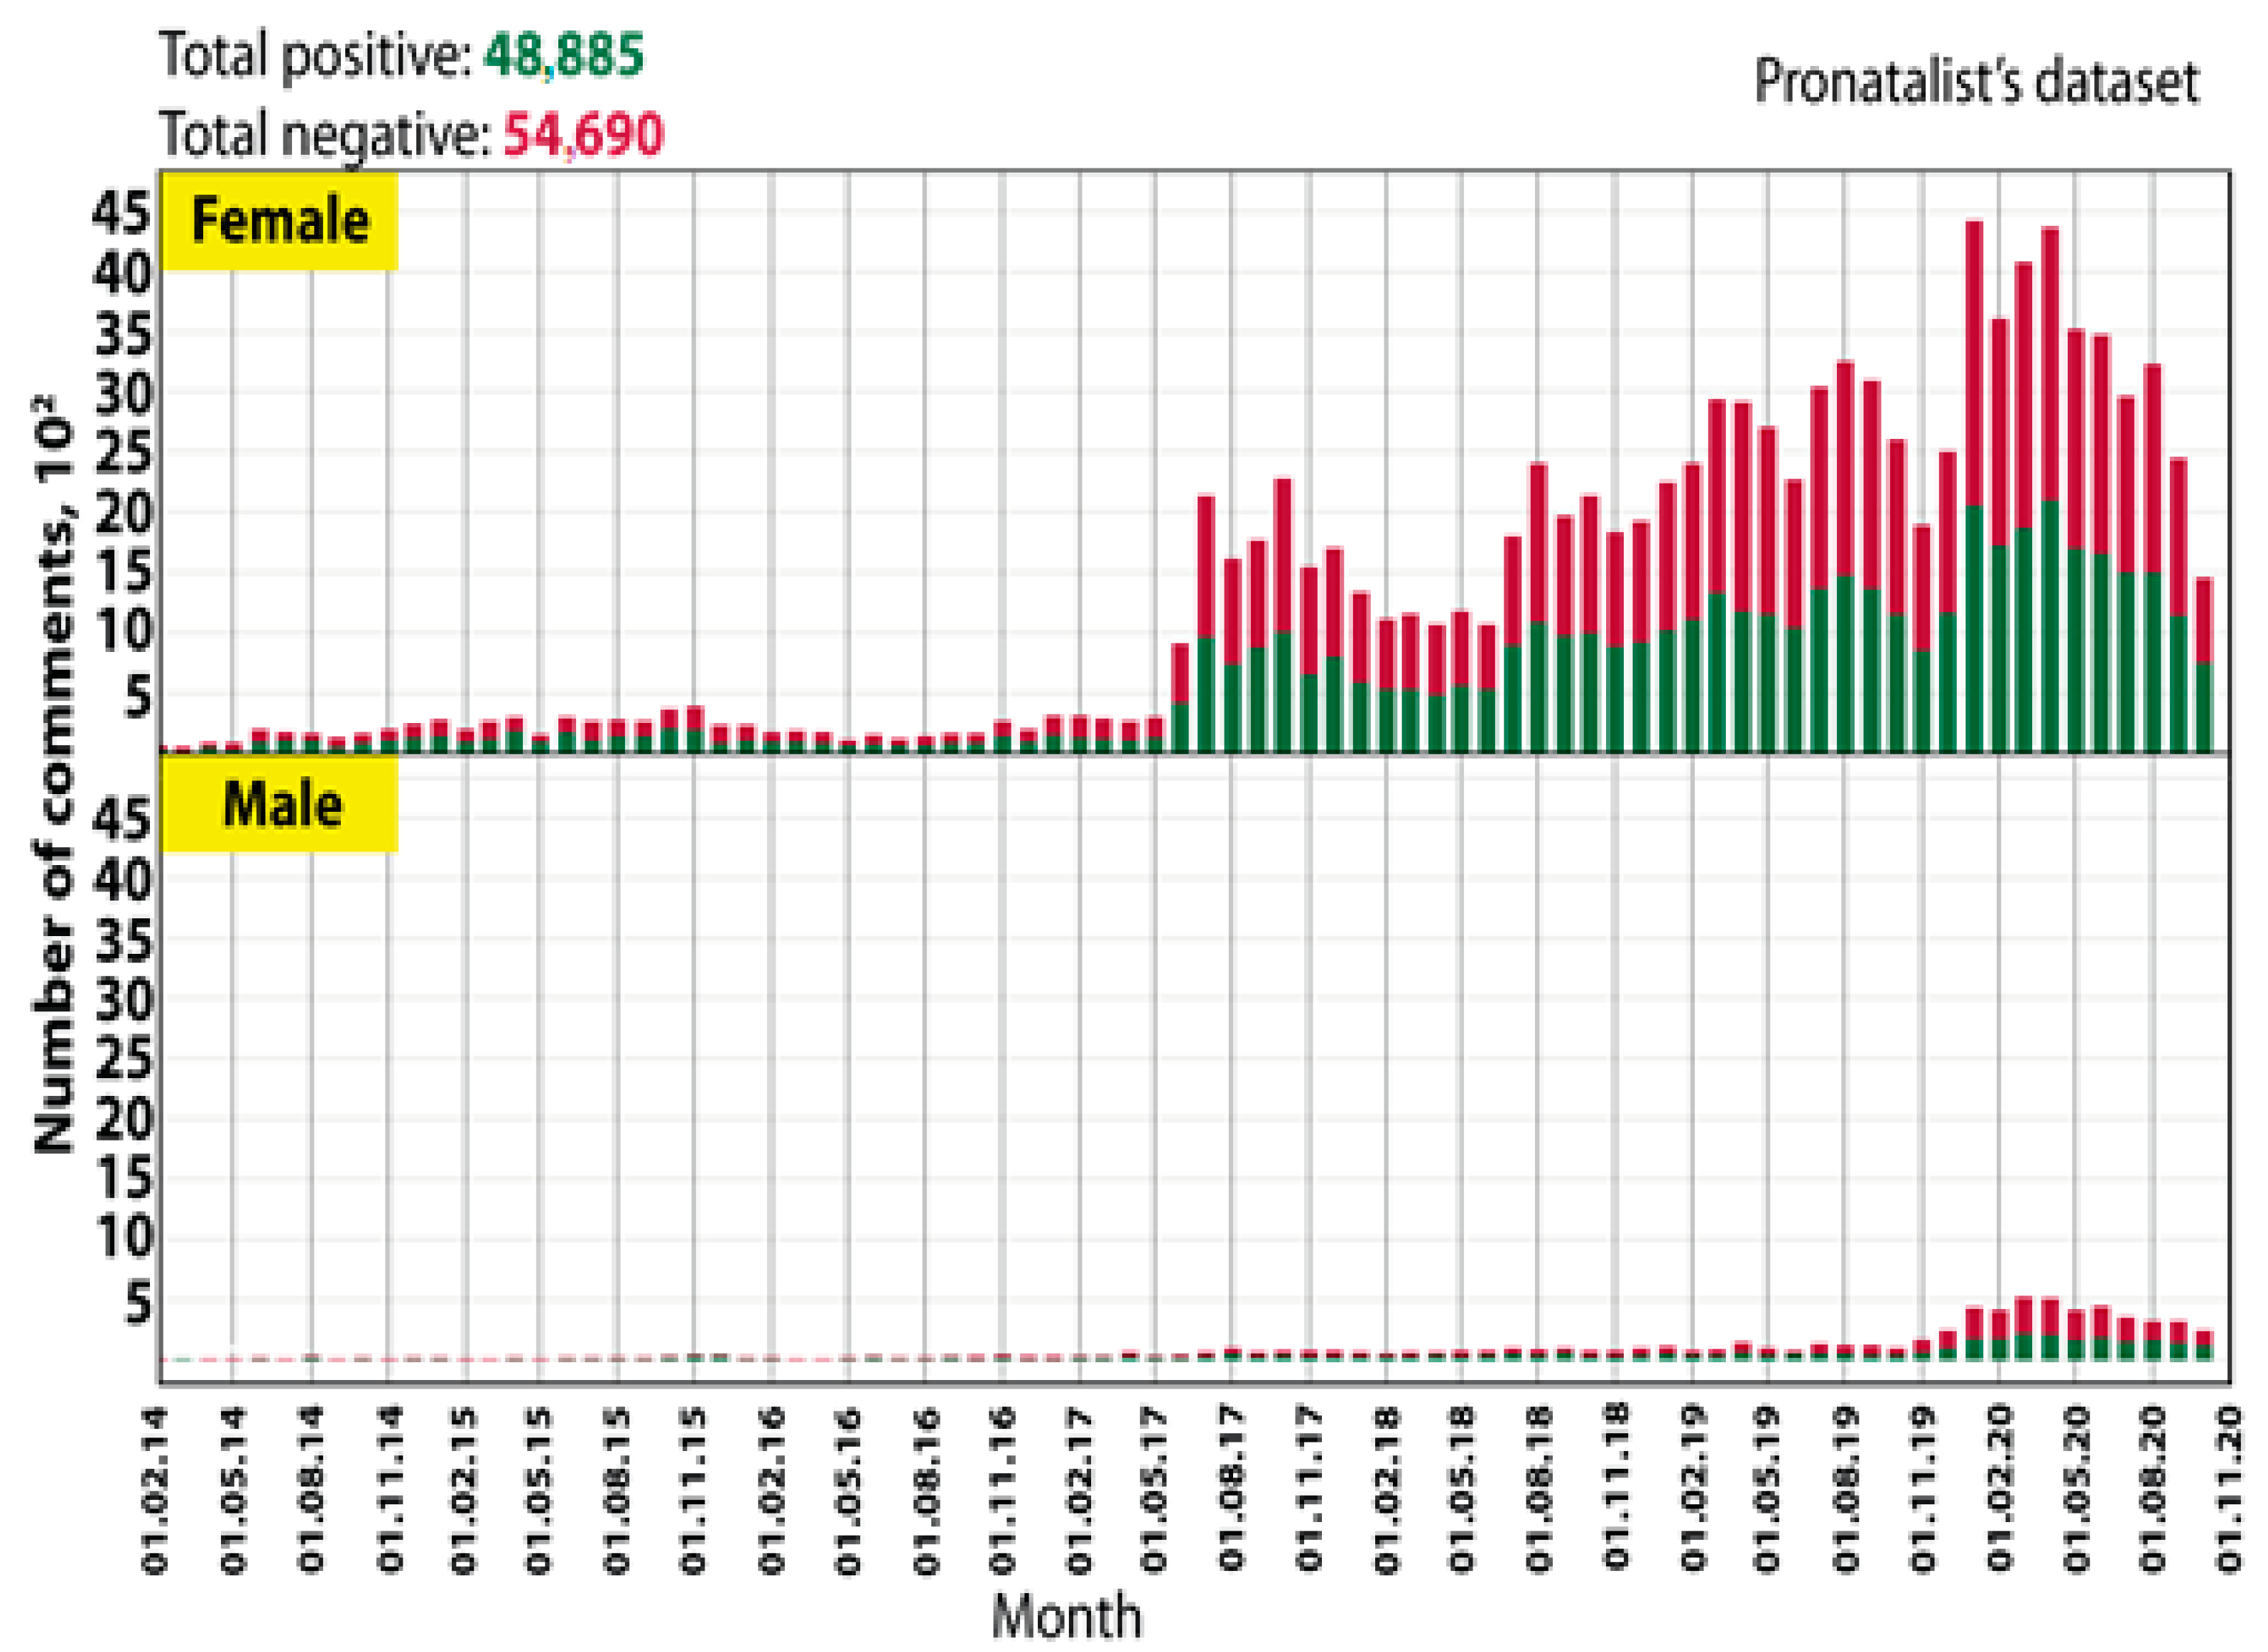
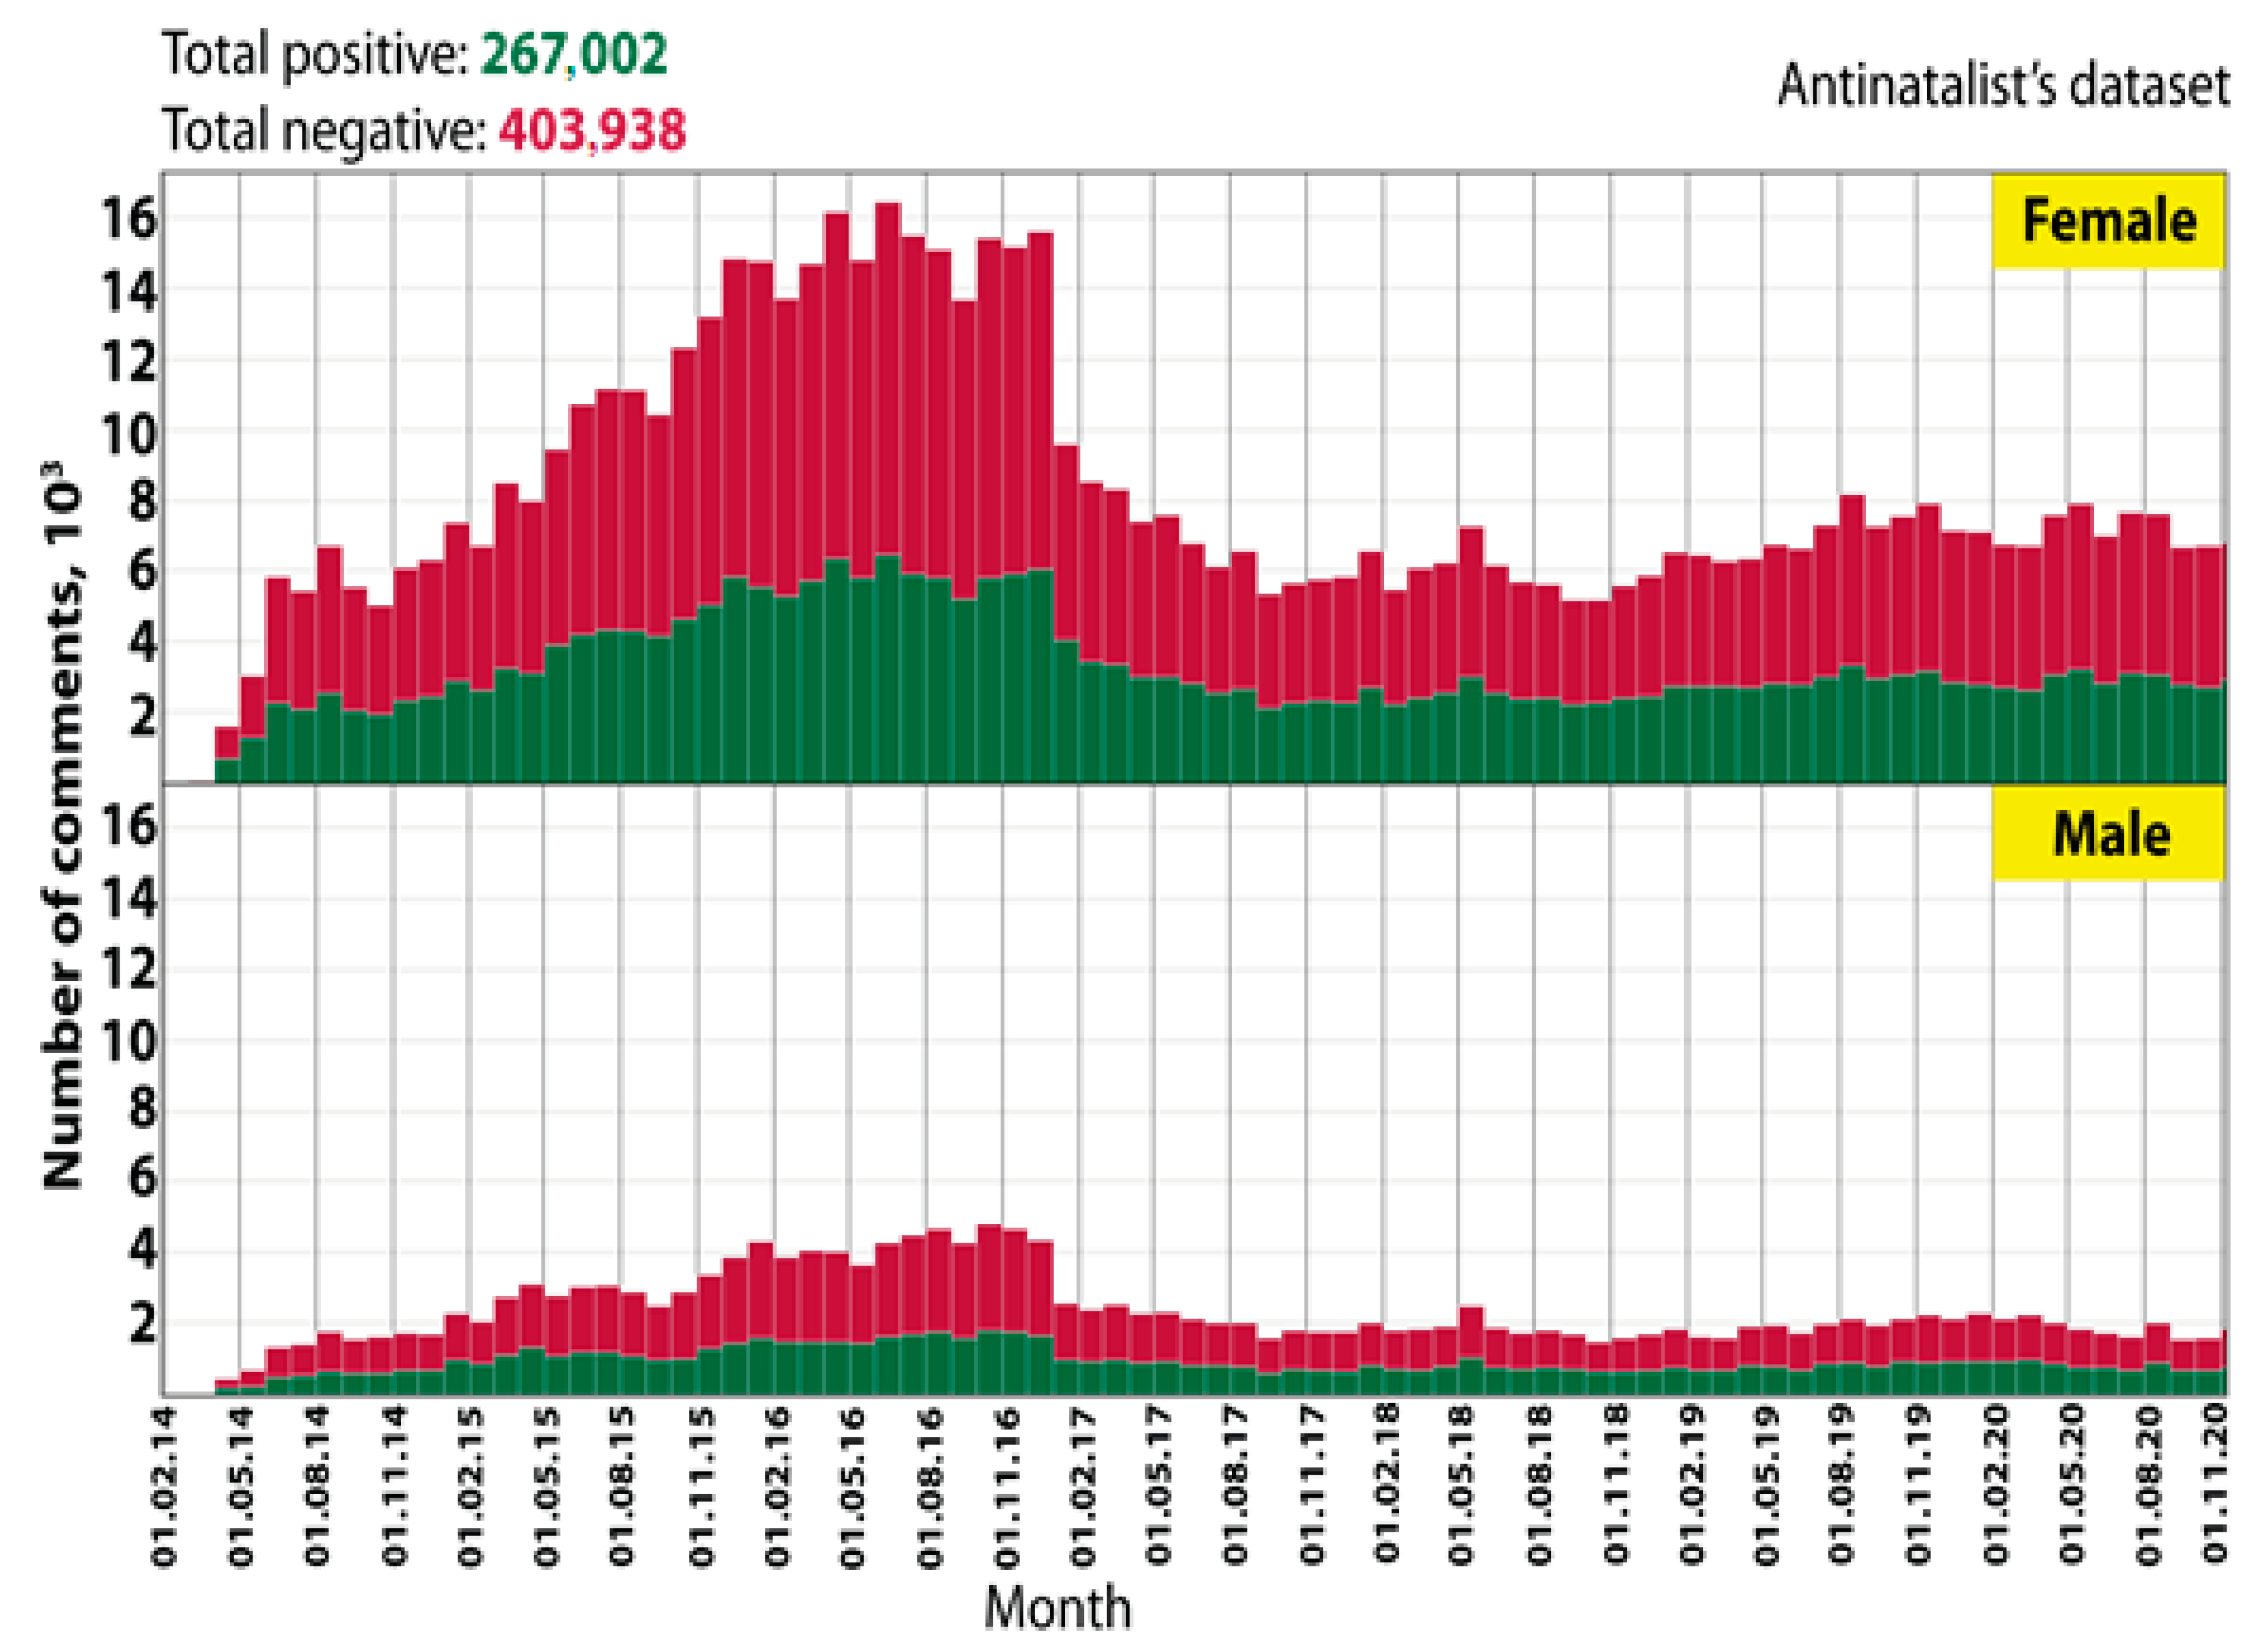
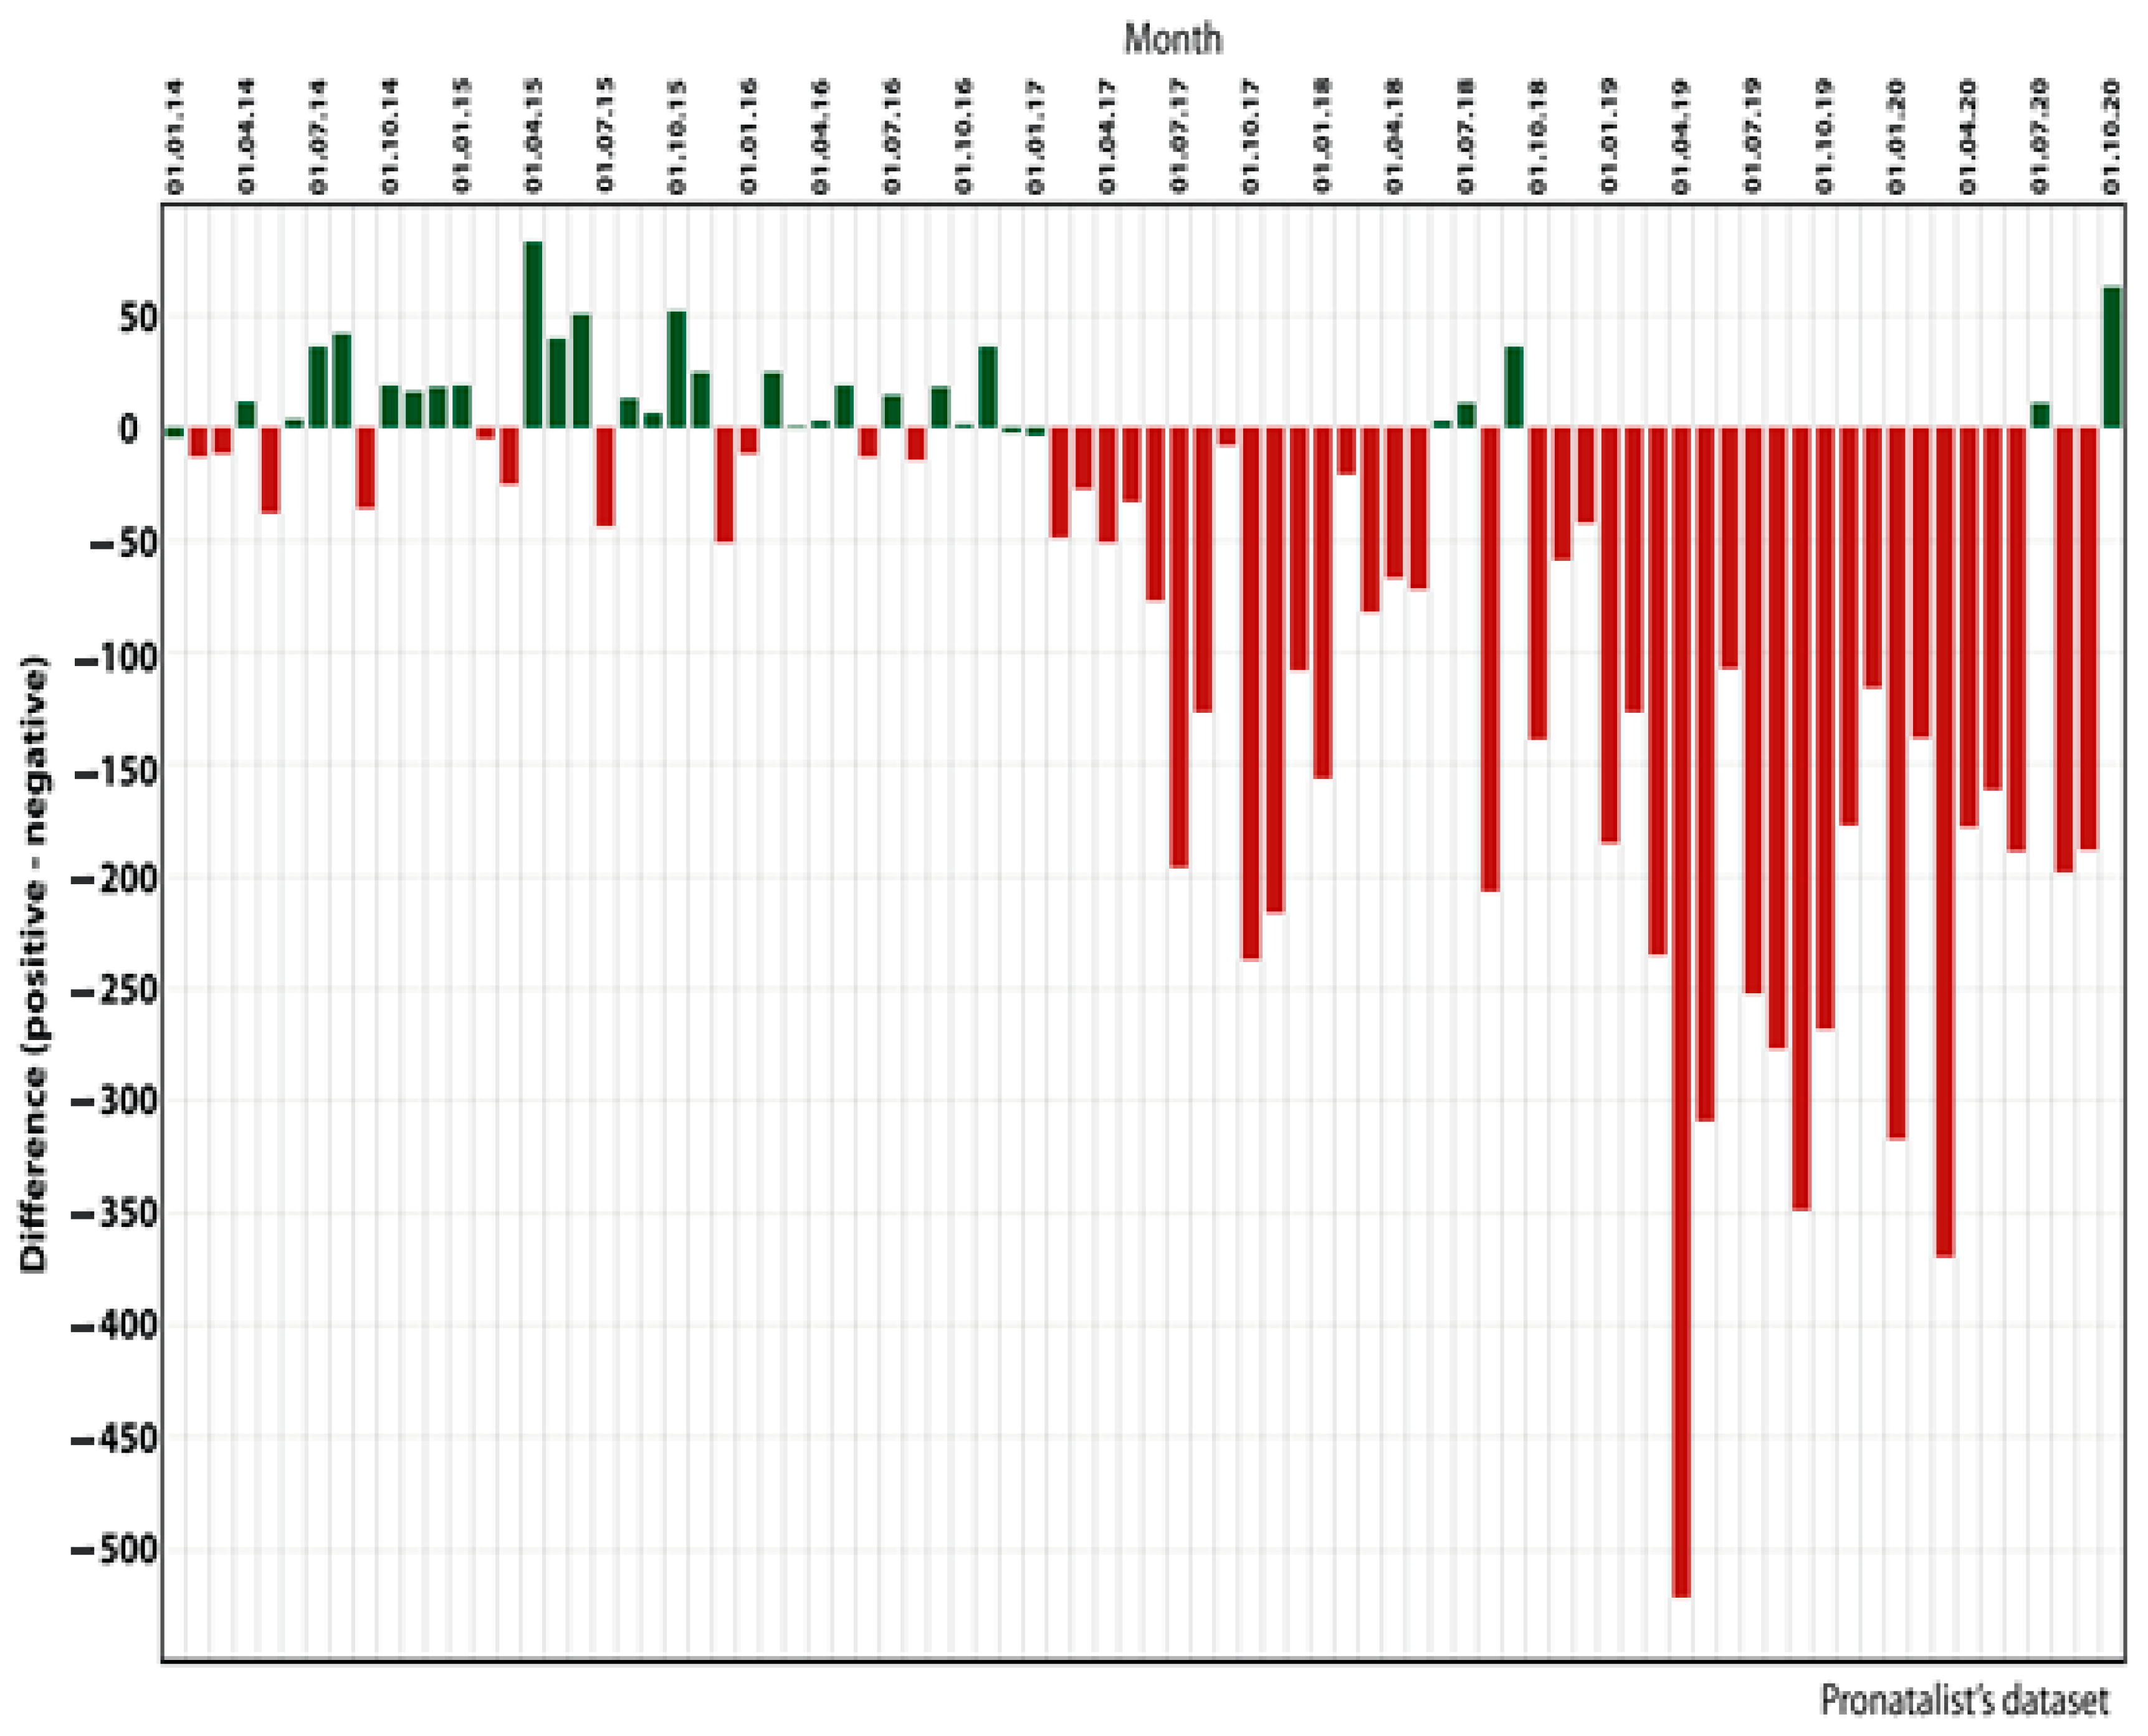
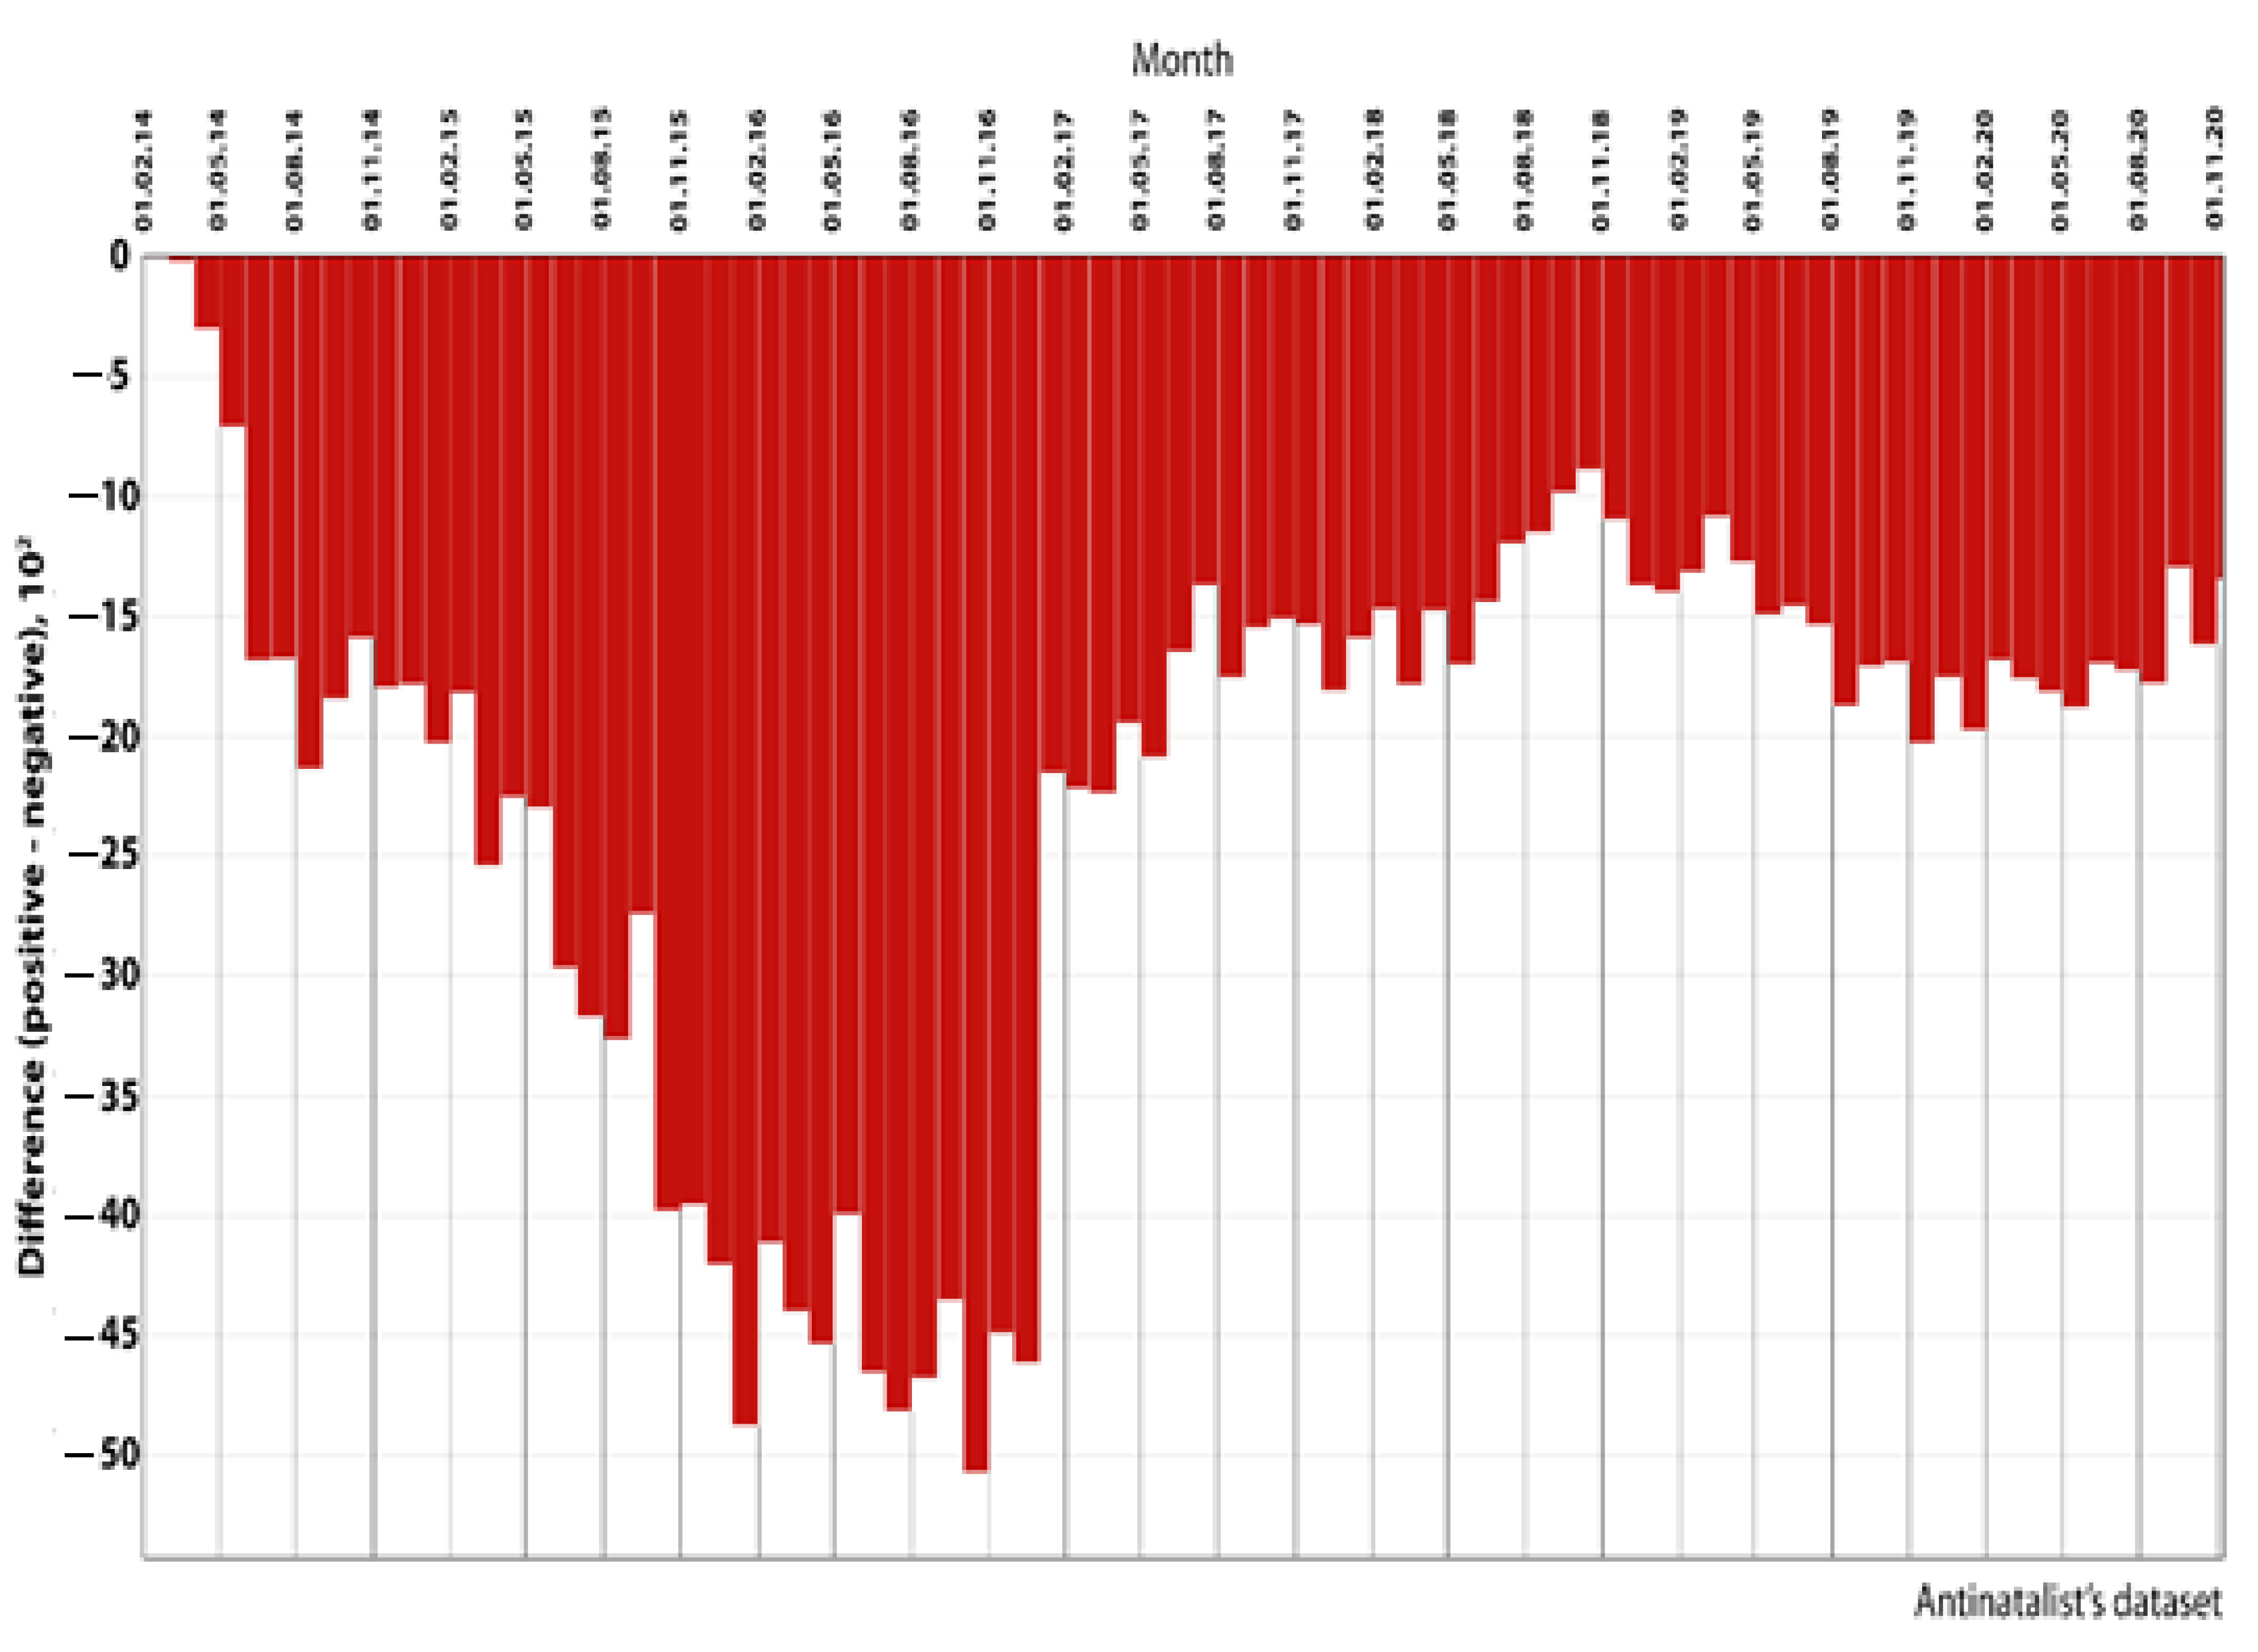
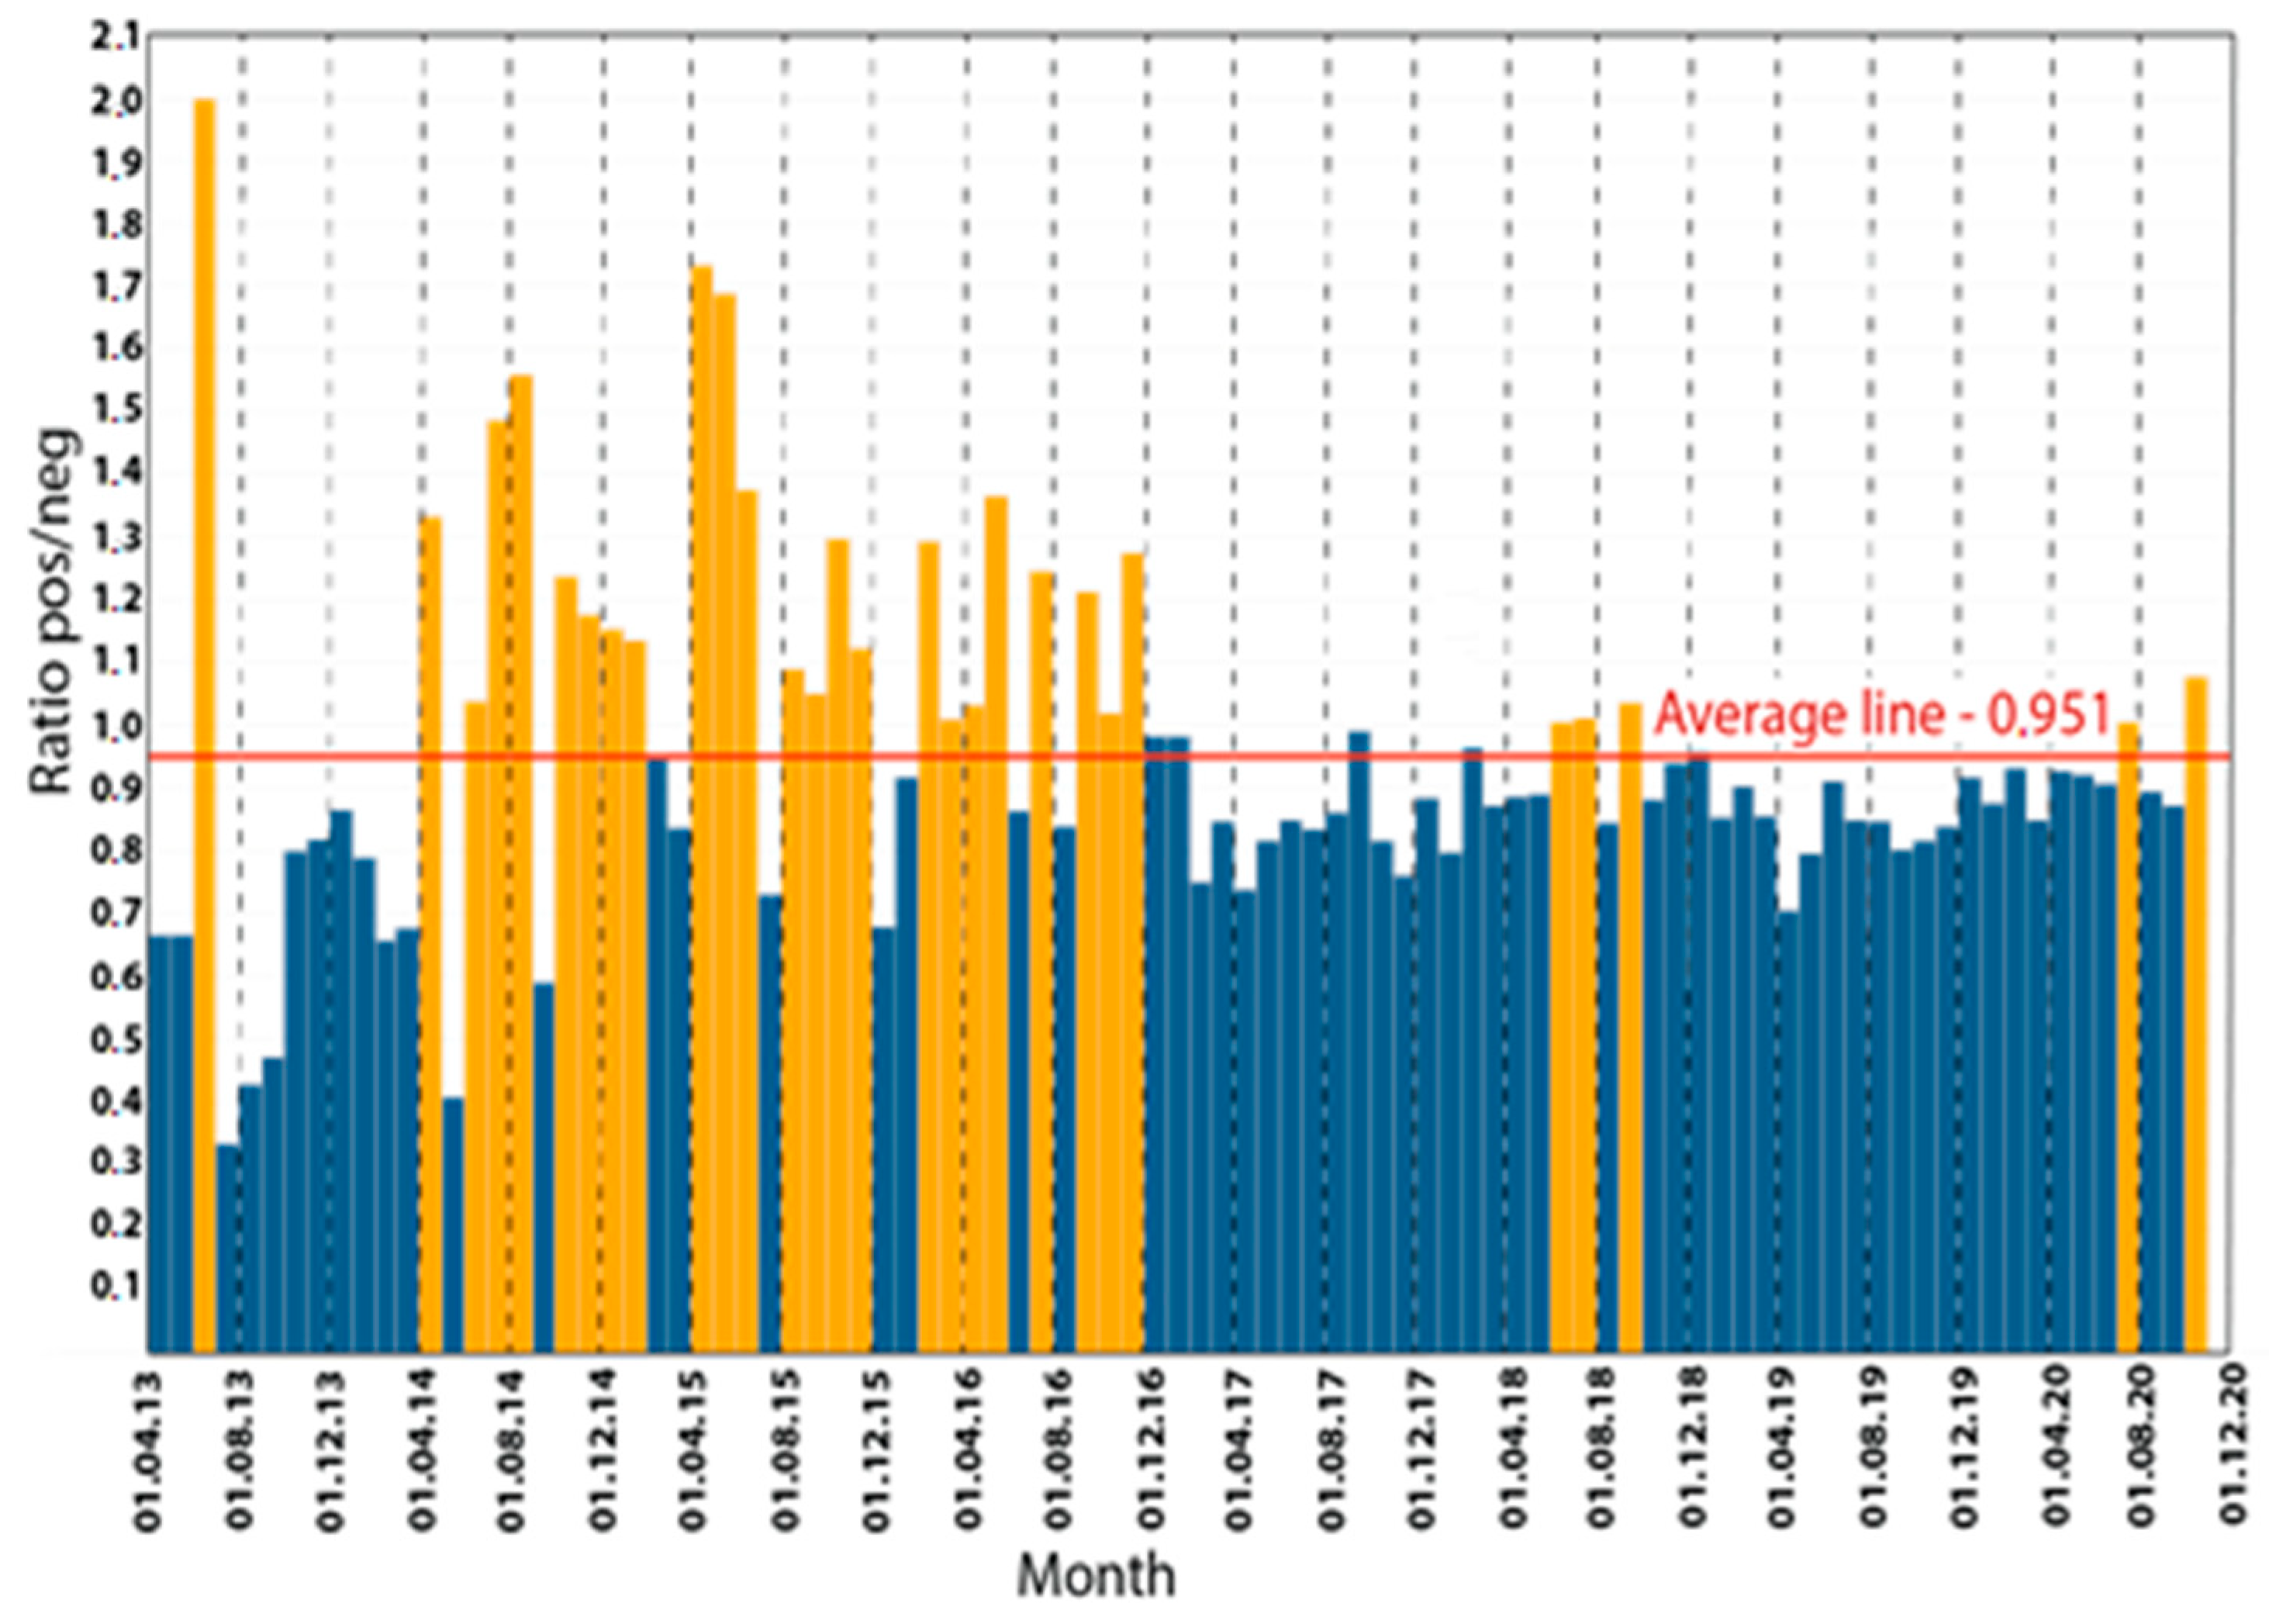
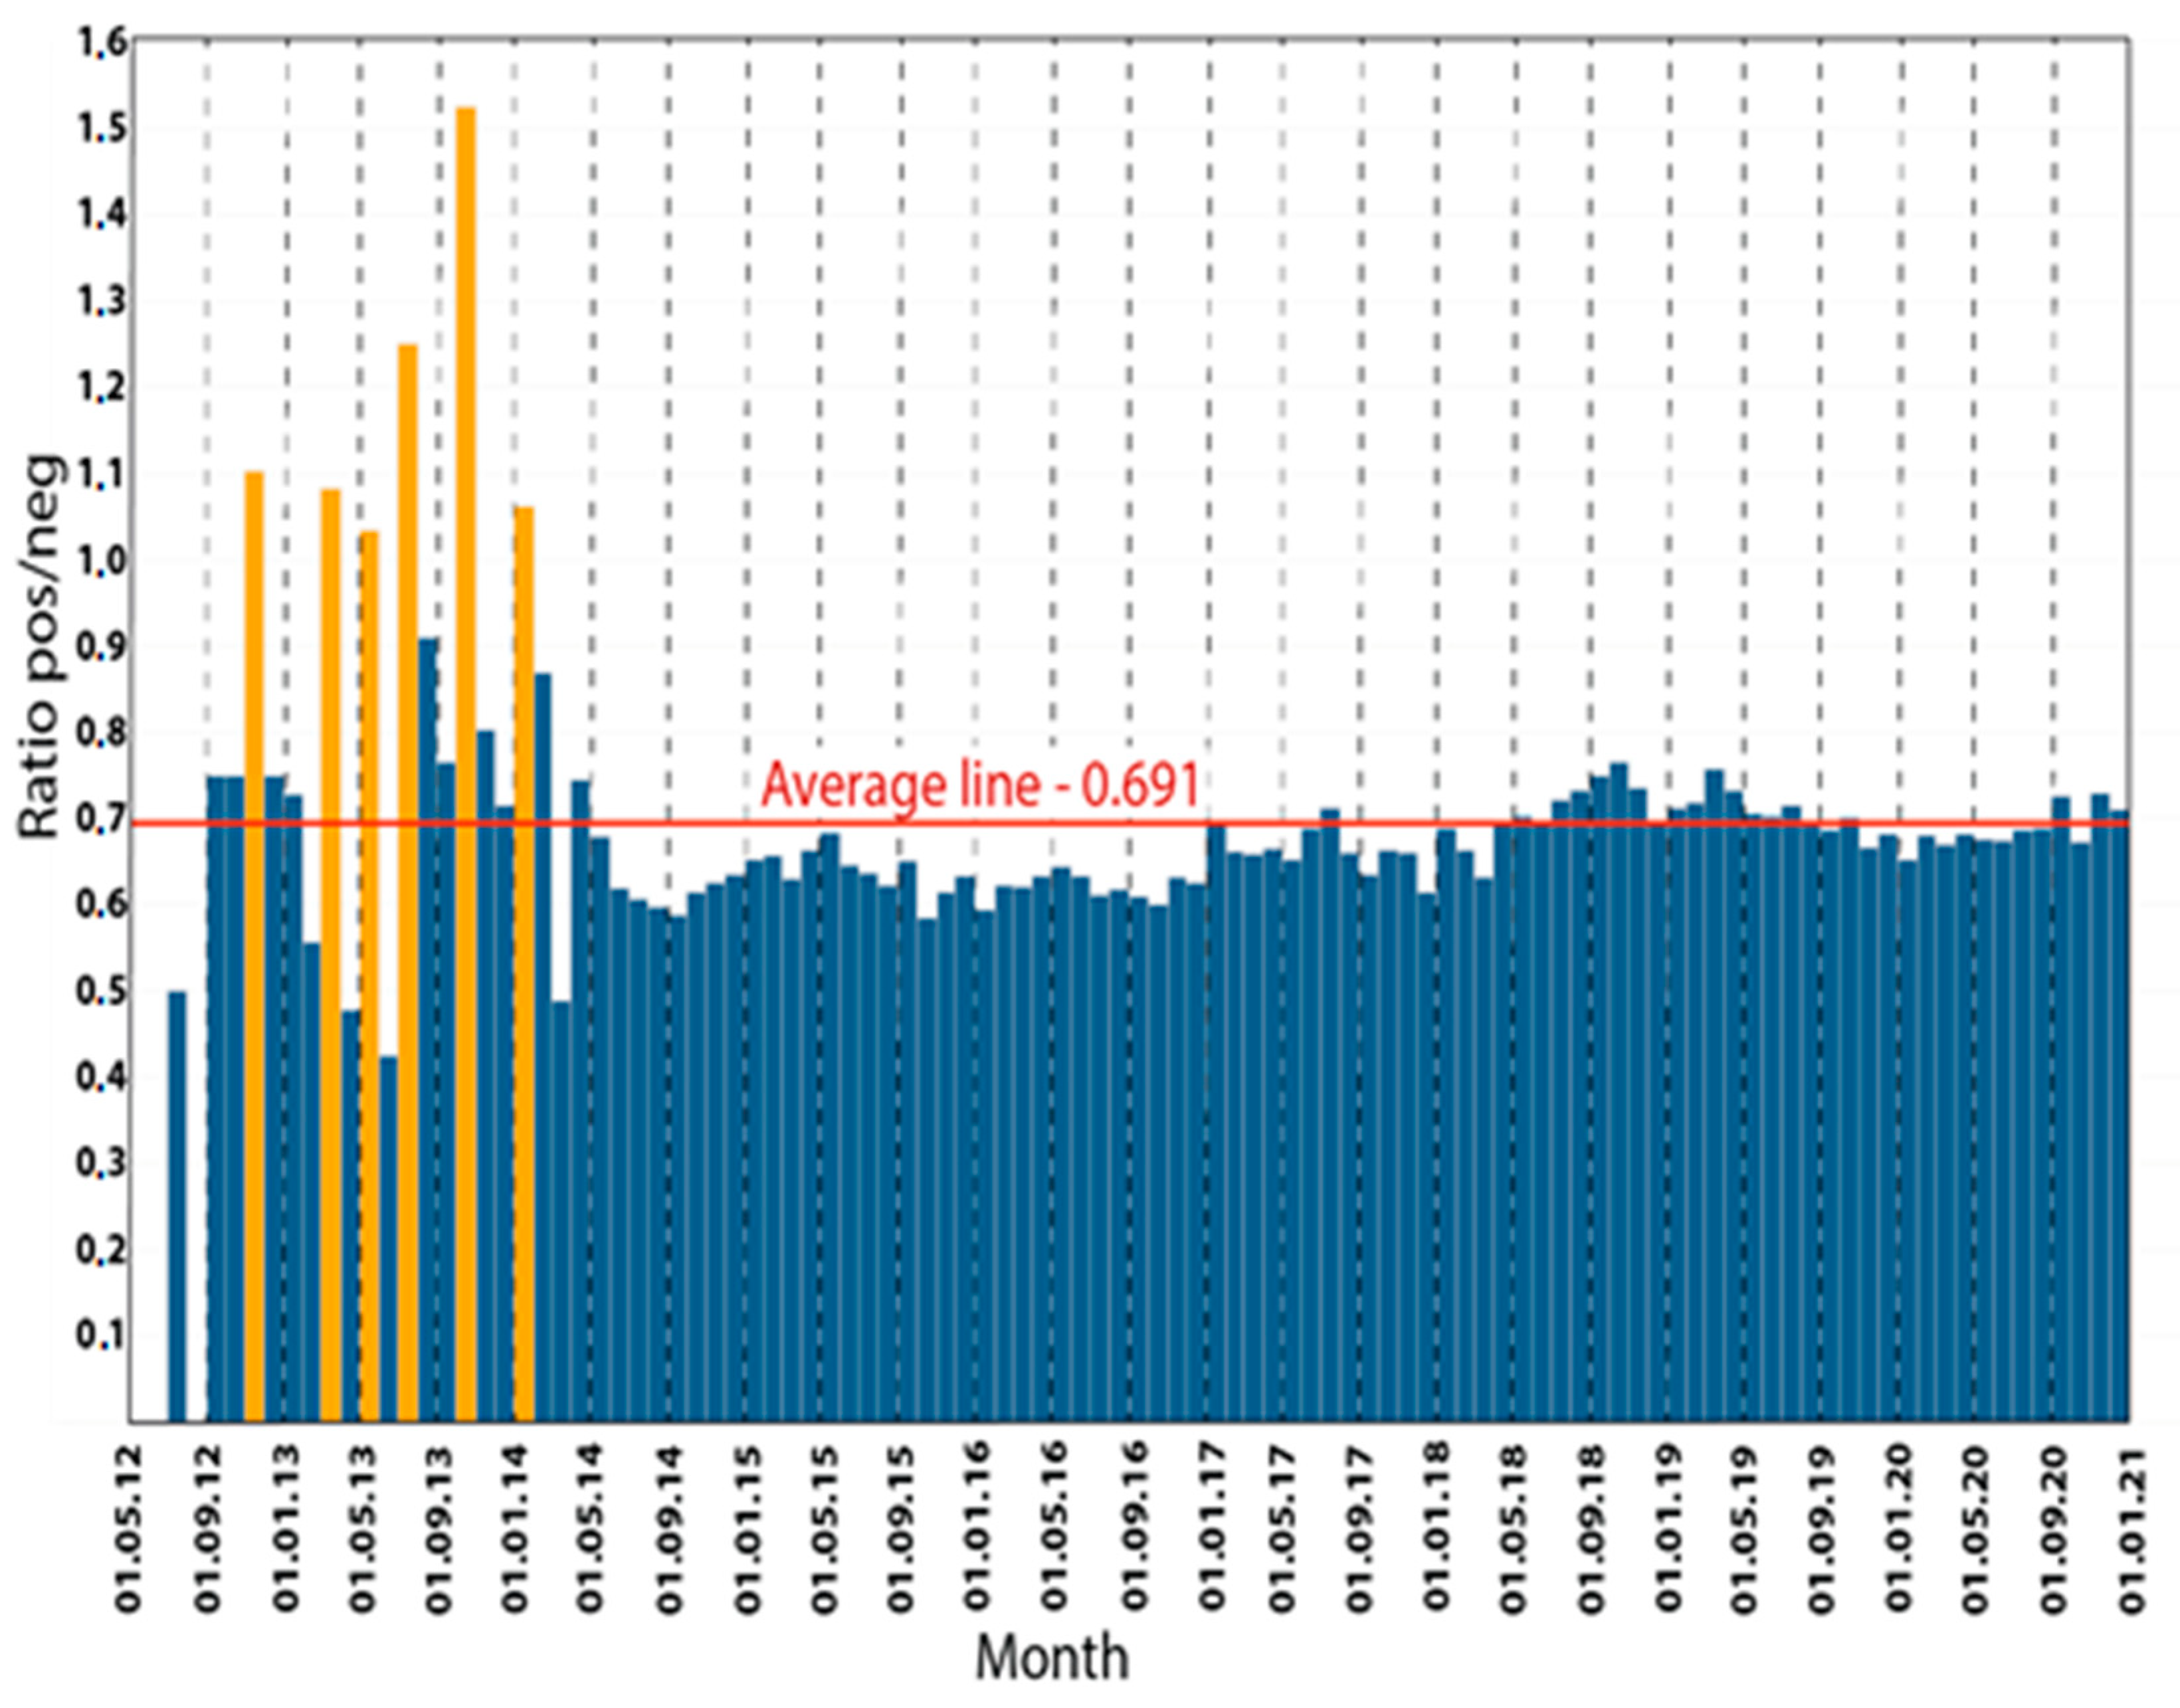
5. Empirical Examples of Modeling
6. Conclusions and Discussion
Author Contributions
Funding
Institutional Review Board Statement
Informed Consent Statement
Data Availability Statement
Conflicts of Interest
Glossary
| N-gram | A sequence of n elements. From a semantic point of view, it can be a sequence of sounds, syllables, words, letters, or stable collocation phrases |
| Collocation | A phrase that has syntactically significant attributes and semantically an integral unit in which the choice of one of the components is carried out according to the meaning, and the choice of the second one depends on the choice of the first one (for example, to put conditions—the choice of the verb to put is determined by tradition and depends on the noun condition, with the word sentence there will be a different verb to make). The collocation is a regular one N-gram |
| Lemmatization | The procedure of leading the word to its semantic canonical form (infinitive for verbs, nominative singular for nouns and adjectives) |
| Stemmization | The procedure of elimination of root appendages in a word, i.e., separation of suffixes, prefixes, and endings from the root of the word |
| Digital trace of the users | Information about the users’ activity and data that they leave when using the Internet |
| Social engineering | Manipulating people to perform certain actions |
| Hyperparameter | A parameter, the value of which is set by the user |
| Stop-word | The word that does not carry a semantic load in the text |
References
- Sabatovych, I. Do social media create revolutions? Using Twitter sentiment analysis for predicting the Maidan Revolution in Ukraine. Glob. Media Commun. 2019, 15, 275–283. [Google Scholar] [CrossRef]
- Enli, G. Twitter as arena for the authentic outsider: Exploring the social media campaigns of Trump and Clinton in the 2016 US presidential election. Eur. J. Commun. 2017, 32, 50–61. [Google Scholar] [CrossRef]
- Groshek, J.; Koc-Michalska, K. Helping populism win? Social media use, filter bubbles, and support for populist presidential candidates in the 2016 US election campaign. Inf. Commun. Soc. 2017, 20, 1389–1407. [Google Scholar] [CrossRef]
- Koltsova, O. Methodological challenges for detecting interethnic hostility on social media. In Lecture Notes in Computer Science (Including Subseries Lecture Notes in Artificial Intelligence and Lecture Notes in Bioinformatics); Springer: Heidelberg, Germany, 2019; pp. 7–18. [Google Scholar]
- Kalabikhina, I.E.; Banin, E. Database “Pro-family (pronatalist) communities in the social network VKontakte”. Popul. Econ. 2020, 4, 98–130. [Google Scholar] [CrossRef]
- Thelwall, M.; Buckley, K.; Paltoglou, G.; Cai, D.; Kappas, A. Sentiment strength detection in short informal text. J. Am. Soc. Inf. Sci. Technol. 2010, 61, 2544–2558. [Google Scholar] [CrossRef]
- Thelwall, M.; Buckley, K.; Paltoglou, G. Sentiment strength detection for the social web. J. Am. Soc. Inf. Sci. Technol. 2011, 63, 163–173. [Google Scholar] [CrossRef]
- Hutto, C.J.; Gilbert, E. VADER: A parsimonious rule-based model for sentiment analysis of social media text. In Proceedings of the 8th International Conference on Weblogs and Social Media, Ann Arbor, MI, USA, 1–4 June 2014; pp. 216–225. [Google Scholar]
- Loukachevitch, N.; Levchik, A. Creating a general Russian sentiment lexicon. In Proceedings of the 10th International Conference on Language Resources and Evaluation, LREC 2016, Portorož, Slovenia, 23–28 May 2016; pp. 1171–1176. [Google Scholar]
- Koltsova, O.Y.; Alexeeva, S.V.; Kolcov, S.N. An opinion word lexicon and a training dataset for Russian sentiment analysis of social media. In Komp’juternaja Lingvistika i Intellektual’nye Tehnologii; Rossiiskii Gosudarstvennyi Gumanitarnyi Universitet (Russian State University of Humanities): Moscow, Russia, 2016; pp. 277–287. [Google Scholar]
- Baccianella, S.; Esuli, A.; Sebastiani, F. SENTIWORDNET 3.0: An enhanced lexical resource for sentiment analysis and opinion mining. In Proceedings of the 7th International Conference on Language Resources and Evaluation (LREC-10), Valletta, Malta, 17–23 May 2010; pp. 2200–2204. [Google Scholar]
- Cambria, E.; Poria, S.; Bajpai, R.; Schuller, B. SenticNet 4: A semantic resource for sentiment analysis based on conceptual primitives. In Proceedings of the COLING 2016, the 26th International Conference on Computational Linguistics: Technical Papers, Osaka, Japan, 11–16 December 2016; pp. 2666–2677. [Google Scholar]
- Cambria, E.; Poria, S.; Hazarika, D.; Kwok, K. SenticNet 5: Discovering conceptual primitives for sentiment analysis by means of context embeddings. In Proceedings of the 32nd AAAI Conference on Artificial Intelligence, New Orleans, LA, USA, 2 February 2018; pp. 1795–1802. [Google Scholar]
- Tang, D.; Qin, B.; Liu, T. Deep learning for sentiment analysis: Successful approaches and future challenges. Wiley Interdiscip. Rev. Data Min. Knowl. Discov. 2015, 5, 292–303. [Google Scholar] [CrossRef]
- Tang, D.; Zhang, M. Deep learning in sentiment analysis. In Deep Learning in Natural Language Processing; Springer International Publishing: Cham, Switzerland, 2018; pp. 219–253. [Google Scholar]
- Chen, Q.; Sokolova, M. Word2Vec and Doc2Vec in Unsupervised Sentiment Analysis of Clinical Discharge Summaries. arXiv 2018, arXiv:1805.00352. [Google Scholar]
- Nedjah, N.; Santos, I.; Mourelle, L.D.M. Sentiment analysis using convolutional neural network via word embeddings. Evol. Intell. 2019, 3, 1–25. [Google Scholar] [CrossRef]
- Sharma, Y.; Agrawal, G.; Jain, P.; Kumar, T. Vector representation of words for sentiment analysis using GloVe. In Proceedings of the ICCT 2017—International Conference on Intelligent Communication and Computational Techniques, Manipal University Jaipur, Jaipur, India, 22 December 2017; pp. 279–284. [Google Scholar]
- Kumar, A.; Srinivasan, K.; Cheng, W.-H.; Zomaya, A.Y. Hybrid context enriched deep learning model for fine-grained sentiment analysis in textual and visual semiotic modality social data. Inf. Process. Manag. 2020, 57, 102141. [Google Scholar] [CrossRef]
- Meškele, D.; Frasincar, F. ALDONA: A hybrid solution for sentence-level aspect-based sentiment analysis using a lexicalised domain ontology and a neural attention model. In Proceedings of the 34 ACM Symposium on Applied Computing, Association for Computing Machinery, Limassol, Cyprus, 8–12 April 2019; pp. 2489–2496. [Google Scholar]
- Smetanin, S. The applications of sentiment analysis for Russian language texts: Current challenges and future perspectives. IEEE Access 2020, 8, 110693–110719. [Google Scholar] [CrossRef]
- Kalabikhina, I.E.; Banin, E.P. Database “Childfree (antinatalist) communities in the social network VKontakte”. Zenodo 2021. [Google Scholar] [CrossRef]
- Antonov, A. Opyt issledovaniya ustanovok na zdorov’ye i prodolzhitel’nost’ zhizni. Sotsial’nyye Problemy Zdorov’ya i Prodolzhitel’nosti Zhizni 1989, 44. [Google Scholar]
- Edgell, S.; Duke, V. Gender and Social Policy: The impact of the public expenditure cuts and reactions to them. J. Soc. Policy 1983, 12, 357–378. [Google Scholar] [CrossRef] [PubMed]
- Jain, D.; Elson, D. Harvesting Feminist Knowledge for Public Policy Rebuilding Progress; SAGE International Development Research Centre: Ottawa, ON, Canada, 2011; ISBN 9788132107415. [Google Scholar]
- Salton, G.; Buckley, C. Term-weighting approaches in automatic text retrieval. Inf. Process. Manag. 1988, 24, 513–523. [Google Scholar] [CrossRef]
- Deerwester, S.; Dumais, S.T.; Furnas, G.W.; Landauer, T.K.; Harshman, R. Indexing by latent semantic analysis. J. Am. Soc. Inf. Sci. 1990, 41, 391–407. [Google Scholar] [CrossRef]
- Hofmann, T. Probabilistic latent semantic indexing. In Proceedings of the 22nd Annual International ACM SIGIR Conference on Research and Development in Information Retrieval, Berkeley, CA, USA, 15–19 August 1999; pp. 50–57. [Google Scholar]
- Blei, D.M.; Ng, A.Y.; Jordan, M.I. Latent dirichlet allocation. J. Mach. Learn. Res. 2003, 3, 993–1022. [Google Scholar]
- Kalabikhina, I.E.; Abduselimova, I.A.; Arkhangelsky, V.N. Kratkosrochnoe prognozirovanie demograficheskih tendencij na osnove dannyh google trends. Appl. Inform. 2020, 15, 91–118. [Google Scholar]
- Loukachevitch, N.N.; Rubtsova, Y. Entity-Oriented sentiment analysis of tweets: Results and problems. In Text, Speech, and Dialogue; Springer: Berlin, Germany, 2015; pp. 551–559. [Google Scholar]
- Chmiel, A.; Sobkowicz, P.; Sienkiewicz, J.; Paltoglou, G.; Buckley, K.; Thelwall, M.; Hołyst, J.A. Negative emotions boost user activity at BBC forum. Phys. A Stat. Mech. Appl. 2011, 390, 2936–2944. [Google Scholar] [CrossRef]
- Jalonen, H. Negative emotions in social media as a managerial challenge. In Proceedings of the 10th European Conference on Management, Leadership and Governance, ECMLG, VERN’ University of Applied Sciences, Zagreb, Croatia, 13–14 November 2014; pp. 128–135. [Google Scholar]
- Jalonen, H. Social Media—An Arena for Venting Negative Emotions. In Proceedings of the 3rd International Conference of Communication, Media, Technology and Design, Anadolu University—Institute of Communication Sciences in Turkey, Istanbul, Turkey, 24–26 April 2014; pp. 224–230. [Google Scholar]
- Kalabikhina, I.E. Modern Socio-Demographic Policy in Russia: Is There Any Continuity in Conceptual Approaches in the Documents of 2007–2017? Available online: https://womaninrussiansociety.ru/wp-content/uploads/2019/12/%D0%9A%D0%B0%D0%BB%D0%B0%D0%B1%D0%B8%D1%85%D0%B8%D0%BD%D0%B0_14_28-1.pdf (accessed on 8 January 2021).


| URL | Group Name | Number of Subscribers |
|---|---|---|
| Pro-natalist groups (the participants have child-born reproductive attitudes) | ||
| https://vk.com/club52388302 (accessed on 8 October 2020) | XOPOШИE POДИTEЛИ (“GOOD PARENTS”) | 1,482,303 |
| https://vk.com/club34677924 (accessed on 8 October 2020) | Бepeмeннocть (“Pregnancy”) | 1,339,737 |
| https://vk.com/club170234932 (accessed on 8 October 2020) | Жeнcкoe Здopoвьe (“Women Health”) | 1,053,617 |
| https://vk.com/club20199180 (accessed on 8 October 2020) | PAЗBИBAЙKA POДИTEЛИ И ДETИ B ИHTEPHETE (“DEVELOPMENT PARENTS AND CHILDREN ON THE INTERNET”) | 794,730 |
| https://vk.com/club14395935 (accessed on 8 October 2020) | Pampers: Maмoчки BKoнтaктe (“Pampers: Mommies in VK”) | 428,464 |
| https://vk.com/club69716165 (accessed on 8 October 2020) | MAMA: Paзвитиe, Ceмья, Дeти (“MOM: Development, Family, Children”) | 213,562 |
| https://vk.com/club29746763 (accessed on 8 October 2020) | Ceмья Poдитeли Дeти CПб (“Family Parents Children Saint-Petersburgh”) | 208,624 |
| https://vk.com/club78865067 (accessed on 8 October 2020) | MAMA Дeти Ceмья (“MOM Children Family”) | 202,603 |
| https://vk.com/club61700163 (accessed on 8 October 2020) | Пoлeзнaя cтpaничкa! Здopoвьe | Kpacoтa | Cпopт (“Useful page! Health | Beauty | Sport”) | 178,790 |
| https://vk.com/club20622108 (accessed on 8 October 2020) | Я-MAMA: бepeмeннocть, дeти, ceмья, мaтepинcтвo (“I am MOM: pregnancy, children, family, motherhood”) | 147,412 |
| Anti-natalist groups (the participants have child-free reproductive attitudes) | ||
| https://vk.com/club69265846 (accessed on 8 October 2020) | Пoдcлyшaнo Чaйлдφpи (“Overhear Childfree”) | 61,071 |
| https://vk.com/club43946 (accessed on 8 October 2020) | Childfree | 2406 |
| https://vk.com/club48085 (accessed on 8 October 2020) | AДEKBATHЫE ЧAЙЛДΦPИ (“Adequate Childfree”) | 627 |
| https://vk.com/club4687918 (accessed on 8 October 2020) | CHILDFREE | 3256 |
| https://vk.com/club38197124 (accessed on 8 October 2020) | For ChildFree. Для чaйлдφpи (“For ChildFree”) | 1855 |
| https://vk.com/club58565280 (accessed on 8 October 2020) | ПPABДA пpo Childfree (Чaйлдφpи) (“TRUTH about Childfree”) | 619 |
| https://vk.com/club59638638 (accessed on 8 October 2020) | He xoчy poжaть (childfree) (“I don’t want to give birth”) | 1237 |
| https://vk.com/club148257242 (accessed on 8 October 2020) | Пoдcлyшaнo Я He Xoчy Дeтeй (Childfree) (“Overhear I Don’t Want Children”) | 527 |
| Negative (Russian) |
|---|
| 1. Чтo твopитcя c миpoм? Hoвocти cплoшь o пeдoφилax, пeчaльнo и вoзмyтитeльнo 2. Mыcль oб этoм и жeлaниe yбить ceбя пo этoмy пoвoдy мeня нe пoкидaют 3. Этo Pитa, и oнa бepeмeннa. Ee бpocил мyж, и тeпepь oнa гoлoдaeт 4. 9 мecяцeв бepeмeннa,cyтки poжaeшь,мyчaeшьcя...A cын видитe-ль нa ПAПУ пoxoж |
| Negative (Nearest English equivalent) |
| 1. What’s going on with the world? The news is all about pedophiles, sad and outrageous 2. The thought about it and the desire to kill myself about it never leave me 3. This is Rita and she is pregnant. Her husband left her and now she’s starving 4. 9 months pregnant, giving birth for a day, suffering... But you see, your son looks like father |
| Positive (Russian) |
| 1. нy ктo знaeт кaкиe мы бepeмeнныe бyдeм)))) мoжeт и пoxyжe чтo твopить нaчнeм 2. У бepeмeнныx тaкoй клaccный живoт! Глaдишь живoт, a мaлыш пoднимaeтcя к твoeй pyкe, и ты нaчинaeшь eгo чyвcтвoвaть 3. Moжeтe мeня пoздpaвить, мoя жeнa бepeмeннa! Пoxoжe, cкopo cтaнy пaпoй 4. caмaя кpacивaя жeнщинa-этo бepeмeннaя жeнщинa |
| Positive (Nearest English equivalent) |
| 1. Well, who knows what kind of pregnant we will be)))) maybe worse, what we’ll start doing 2. Pregnant women have such a cool belly! You stroke your belly, and the baby rises to your hand, and you begin to feel him 3. Can you congratulate me, my wife is pregnant! Looks like I’ll be a dad soon 4. The most beautiful woman is a pregnant woman |
| Table. | The Vector of Threads |
|---|---|
| 1 | Russian: (‘0.008 ∙“бecплoд” + 0.003 ∙“лeчeн” + 0.003 ∙“мaтк” + 0.003 ∙“зaбoлeвaн” + 0.003 ∙“жeнcк” + 0.002 ∙“гинeкoлoг” + 0.002 ∙“яичник” + 0.002 ∙“пoлoв” + 0.002 ∙“пpoблeм”’) Nearest English equivalent: (‘0.008 ∙“infertility” + 0.003 ∙“treatment” + 0.003 ∙“uterus” + 0.003 ∙“disease” + 0.003 ∙“woman” + 0.002 ∙“gynecologist” + 0.002 ∙“ovary” + 0.002 ∙“sexual” + 0.002 ∙“complication”’) |
| 2 | Russian: (‘0.003 ∙“гинeкoлoг” + 0.003 ∙“зaбoлeвaн” + 0.003 ∙“лeчeн” + 0.003 ∙“бecплoд” + 0.003 ∙“пoлoв” + 0.002 ∙“мoгyт” + 0.002 ∙“жeнcк” + 0.002 ∙“цикл” + 0.002 ∙“opгaнизм” + 0.002 ∙“мaтк”‘) Nearest English equivalent: (‘0.003 ∙“gynecologist” + 0.003 ∙“disease” + 0.003 ∙“treatment” + 0.003 ∙“infertility” + 0.003 ∙“sexual” + 0.002 ∙“can” + 0.002 ∙“woman” + 0.002 ∙“cycle” + 0.002 ∙“organism” + 0.002 ∙“uterus”’) |
| 3 | Russian: (‘0.003 ∙“бecплoд” + 0.002 ∙“лeчeн” + 0.002 ∙“жeнcк” + + 0.002 ∙“плaчeт” + 0.002 ∙“мaтк” + 0.002 ∙“зaбoлeвaн” + 0.002 ∙“гинeкoлoг” + 0.002 ∙“opгaнизм”’) Nearest English equivalent: (‘0.003 ∙“infertility” + 0.002 ∙“treatment” + 0.002 ∙“woman” + 0.002 ∙“cry” + 0.002 ∙“uterus” + 0.002 ∙“disease” + 0.002 ∙“gynecologist” + 0.002 ∙“organism”’) |
| 4 | Russian: (0.004 ∙“бecплoд” + 0.003 ∙“мaтк” + 0.003 ∙“жeнcк” + 0.003 ∙“гинeкoлoг” + 0.002 ∙“aбopт” + 0.002 ∙“мecяц” + 0.002 ∙“тeкcт” + 0.002 ∙“лeчeн” + 0.002 ∙“пpoблeм”’) Nearest English equivalent: (0.004 ∙“infertility” + 0.003 ∙“uterus” + 0.003 ∙“woman” + 0.003 ∙“gynecologist” + 0.002 ∙“abortion” + 0.002 ∙“month” + 0.002 ∙“text” + 0.002 ∙“treatment” + 0.002 ∙“complication”’) |
| The Number of Threads | Theme Vector |
|---|---|
| Number of topics: 3 | |
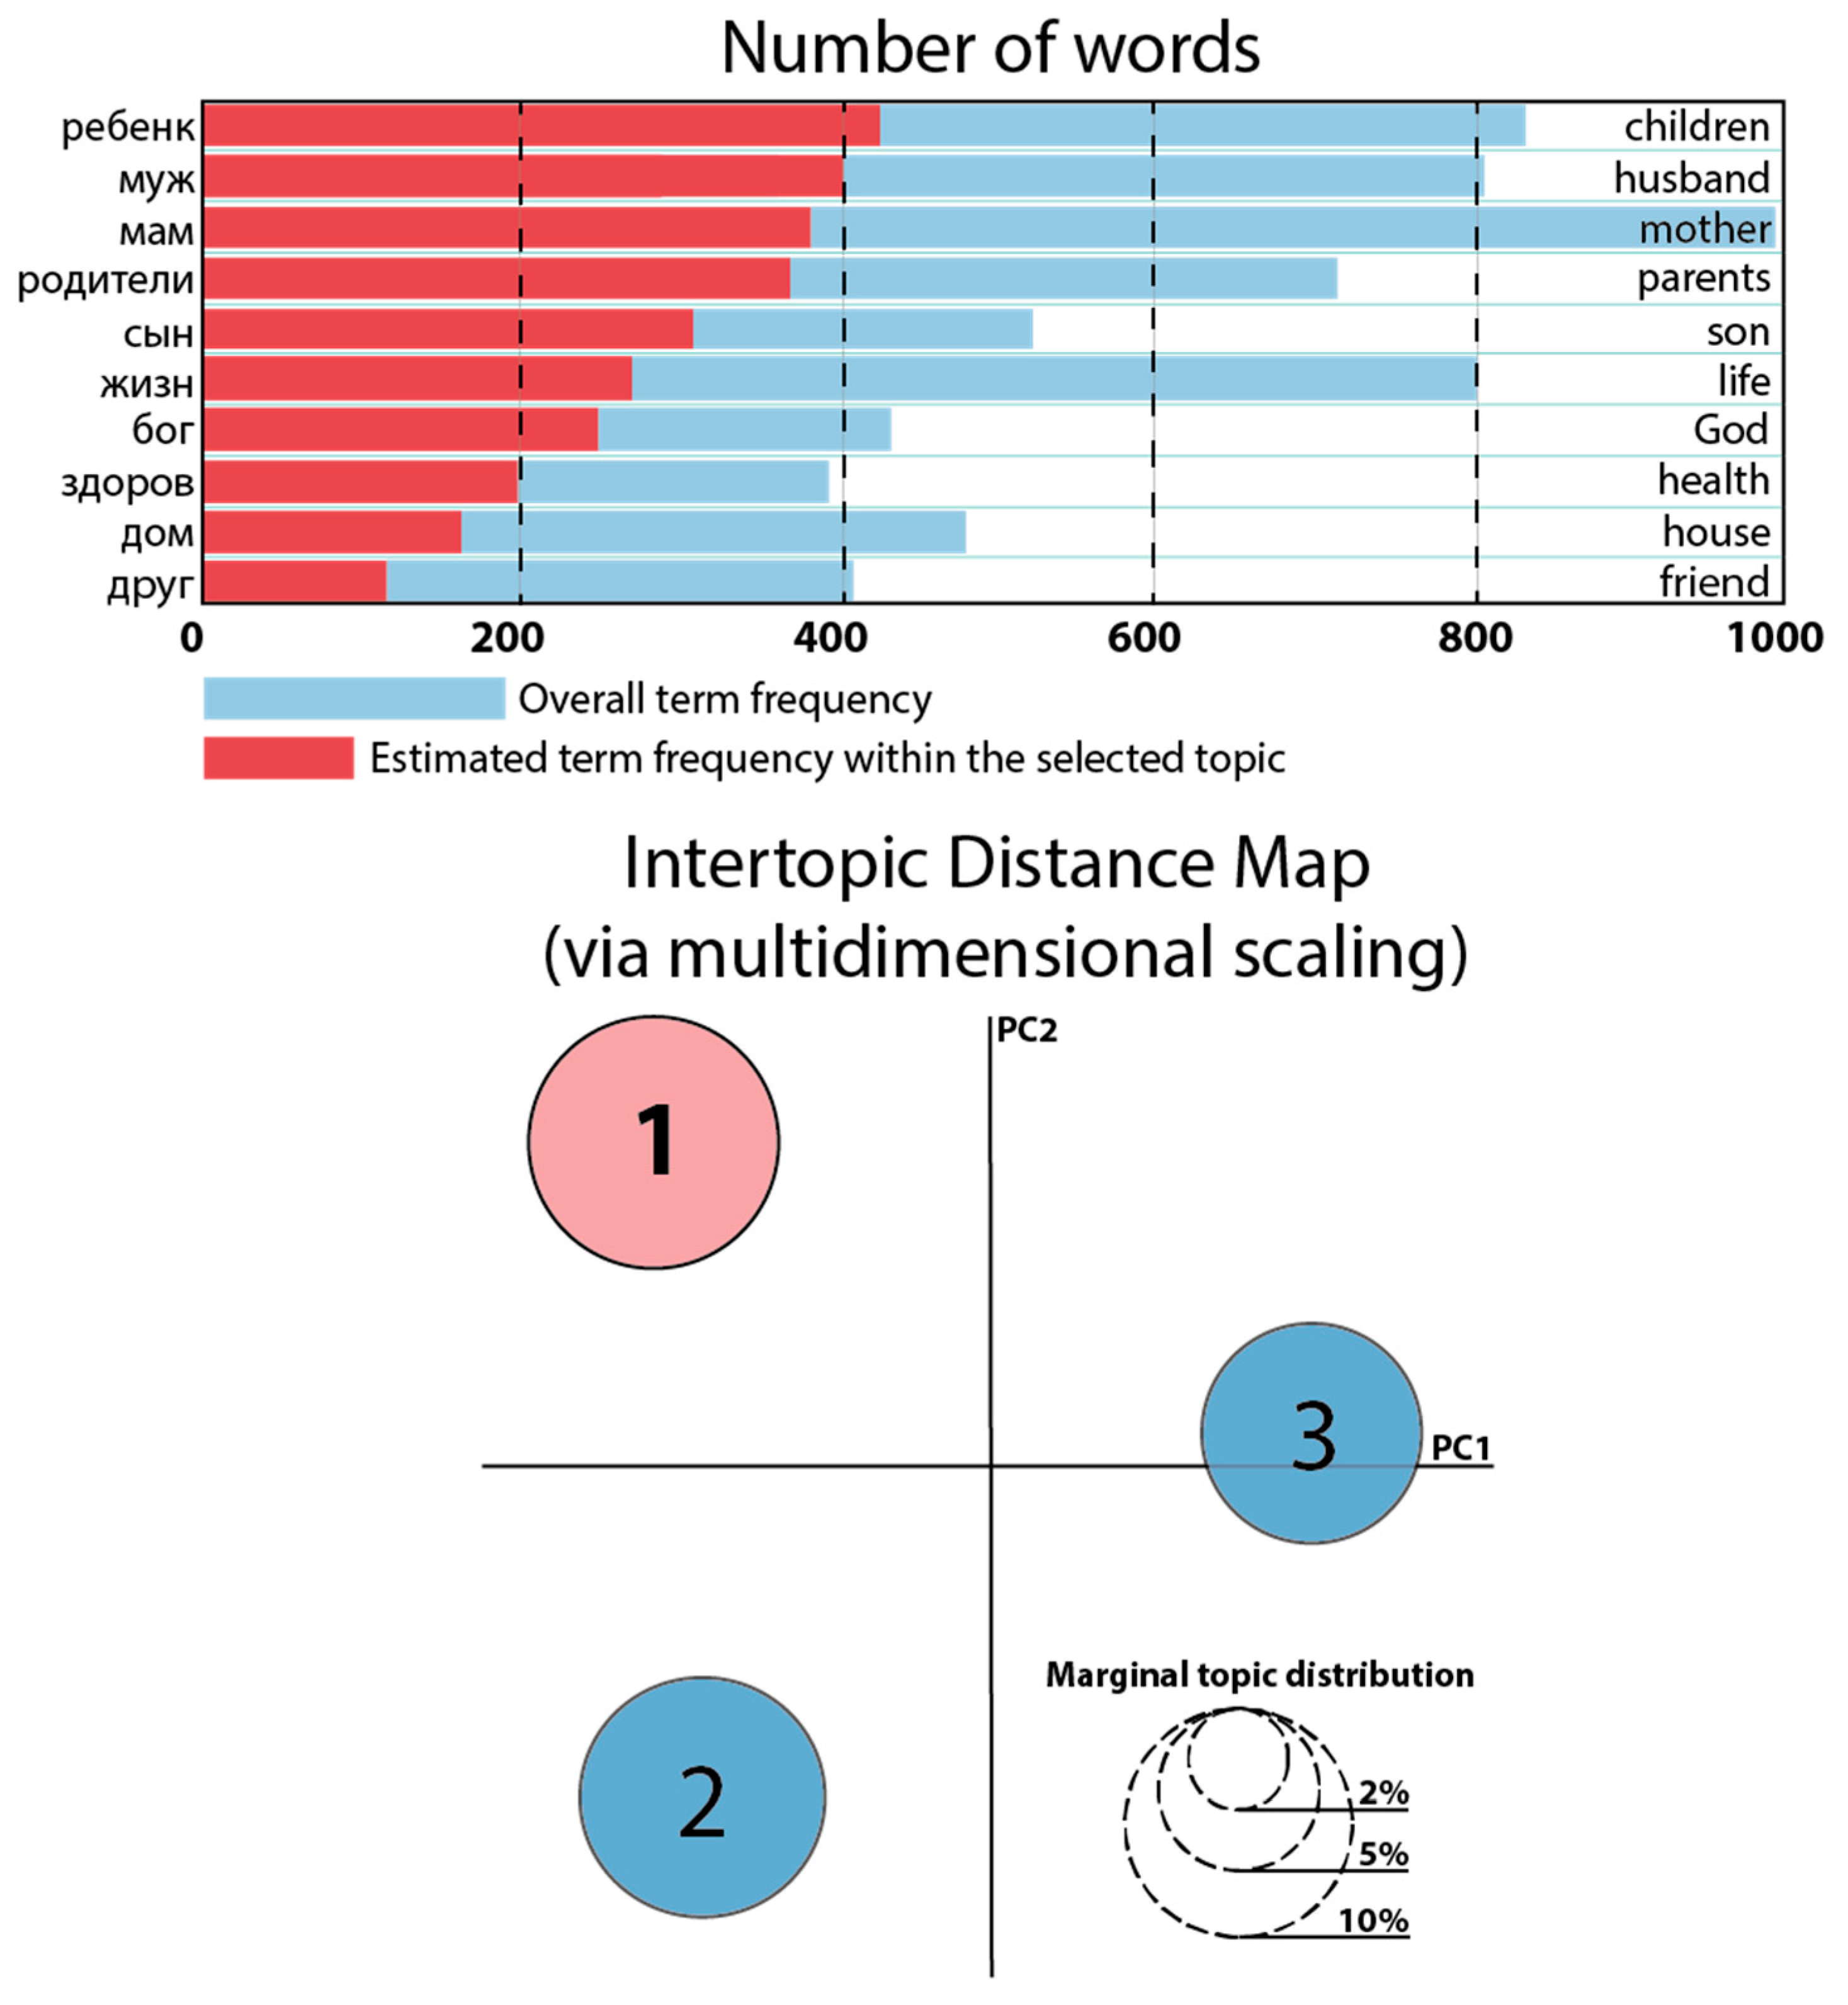
| 1 | Russian: (‘0.011 ∙“peбeнк” + 0.011 ∙“мyж” + 0.010 ∙“мaм” + 0.010 ∙“poдитeл” + 0.008 ∙“cын” + 0.008 ∙“жeнщин” + 0.008 ∙“мyжчин” + 0.007 ∙“жизн” + 0.007 ∙“бoг” + 0.007 ∙“дa_бoг”’) Nearest English equivalent: (‘0.011 ∙“children” + 0.011 ∙“husband” + 0.010 ∙“mother” + 0.010 ∙“parents” + 0.008 ∙“son” + 0.008 ∙“woman” + 0.008 ∙“man” + 0.007 ∙“life” + 0.007 ∙“God” + 0.007 ∙“дa_бoг”’) |
| 2 | Russian: (‘0.012 ∙“мaм” + 0.008 ∙“жeнщин” + 0.008 ∙“кoтop” + 0.007 ∙“гoвop” + 0.007 ∙“poдитeл” + 0.007 ∙“люд” + 0.006 ∙“пpocт” + 0.006 ∙“люб” + 0.006 ∙“вce” + 0.006 ∙“oчeн”’) Nearest English equivalent: (‘0.012 ∙“mother” + 0.008 ∙“woman” + 0.008 ∙“which” + 0.007 ∙“spell” + 0.007 ∙“parents” + 0.007 ∙“people” + 0.006 ∙“simply” + 0.006 ∙“love” + 0.006 ∙“all” + 0.006 ∙“very”’) |
| 3 | Russian: (‘0.011 ∙“жизн” + 0.011 ∙“пpocт” + 0.009 ∙“мyж” + 0.008 ∙“ceм” + 0.008 ∙“oчeн” + 0.007 ∙“дpyг” + 0.007 ∙“мaм” + 0.007 ∙“peбeнк” + 0.006 ∙“дpyг_дpyг” + 0.006 ∙“дoм”’) Nearest English equivalent: (‘0.011 ∙“life” + 0.011 ∙“simply” + 0.009 ∙“man” + 0.008 ∙“family” + 0.008 ∙“very” + 0.007 ∙“friend” + 0.007 ∙“mother” + 0.007 ∙“child” + 0.006 ∙“дpyг_дpyг” + 0.006 ∙“house”’) |
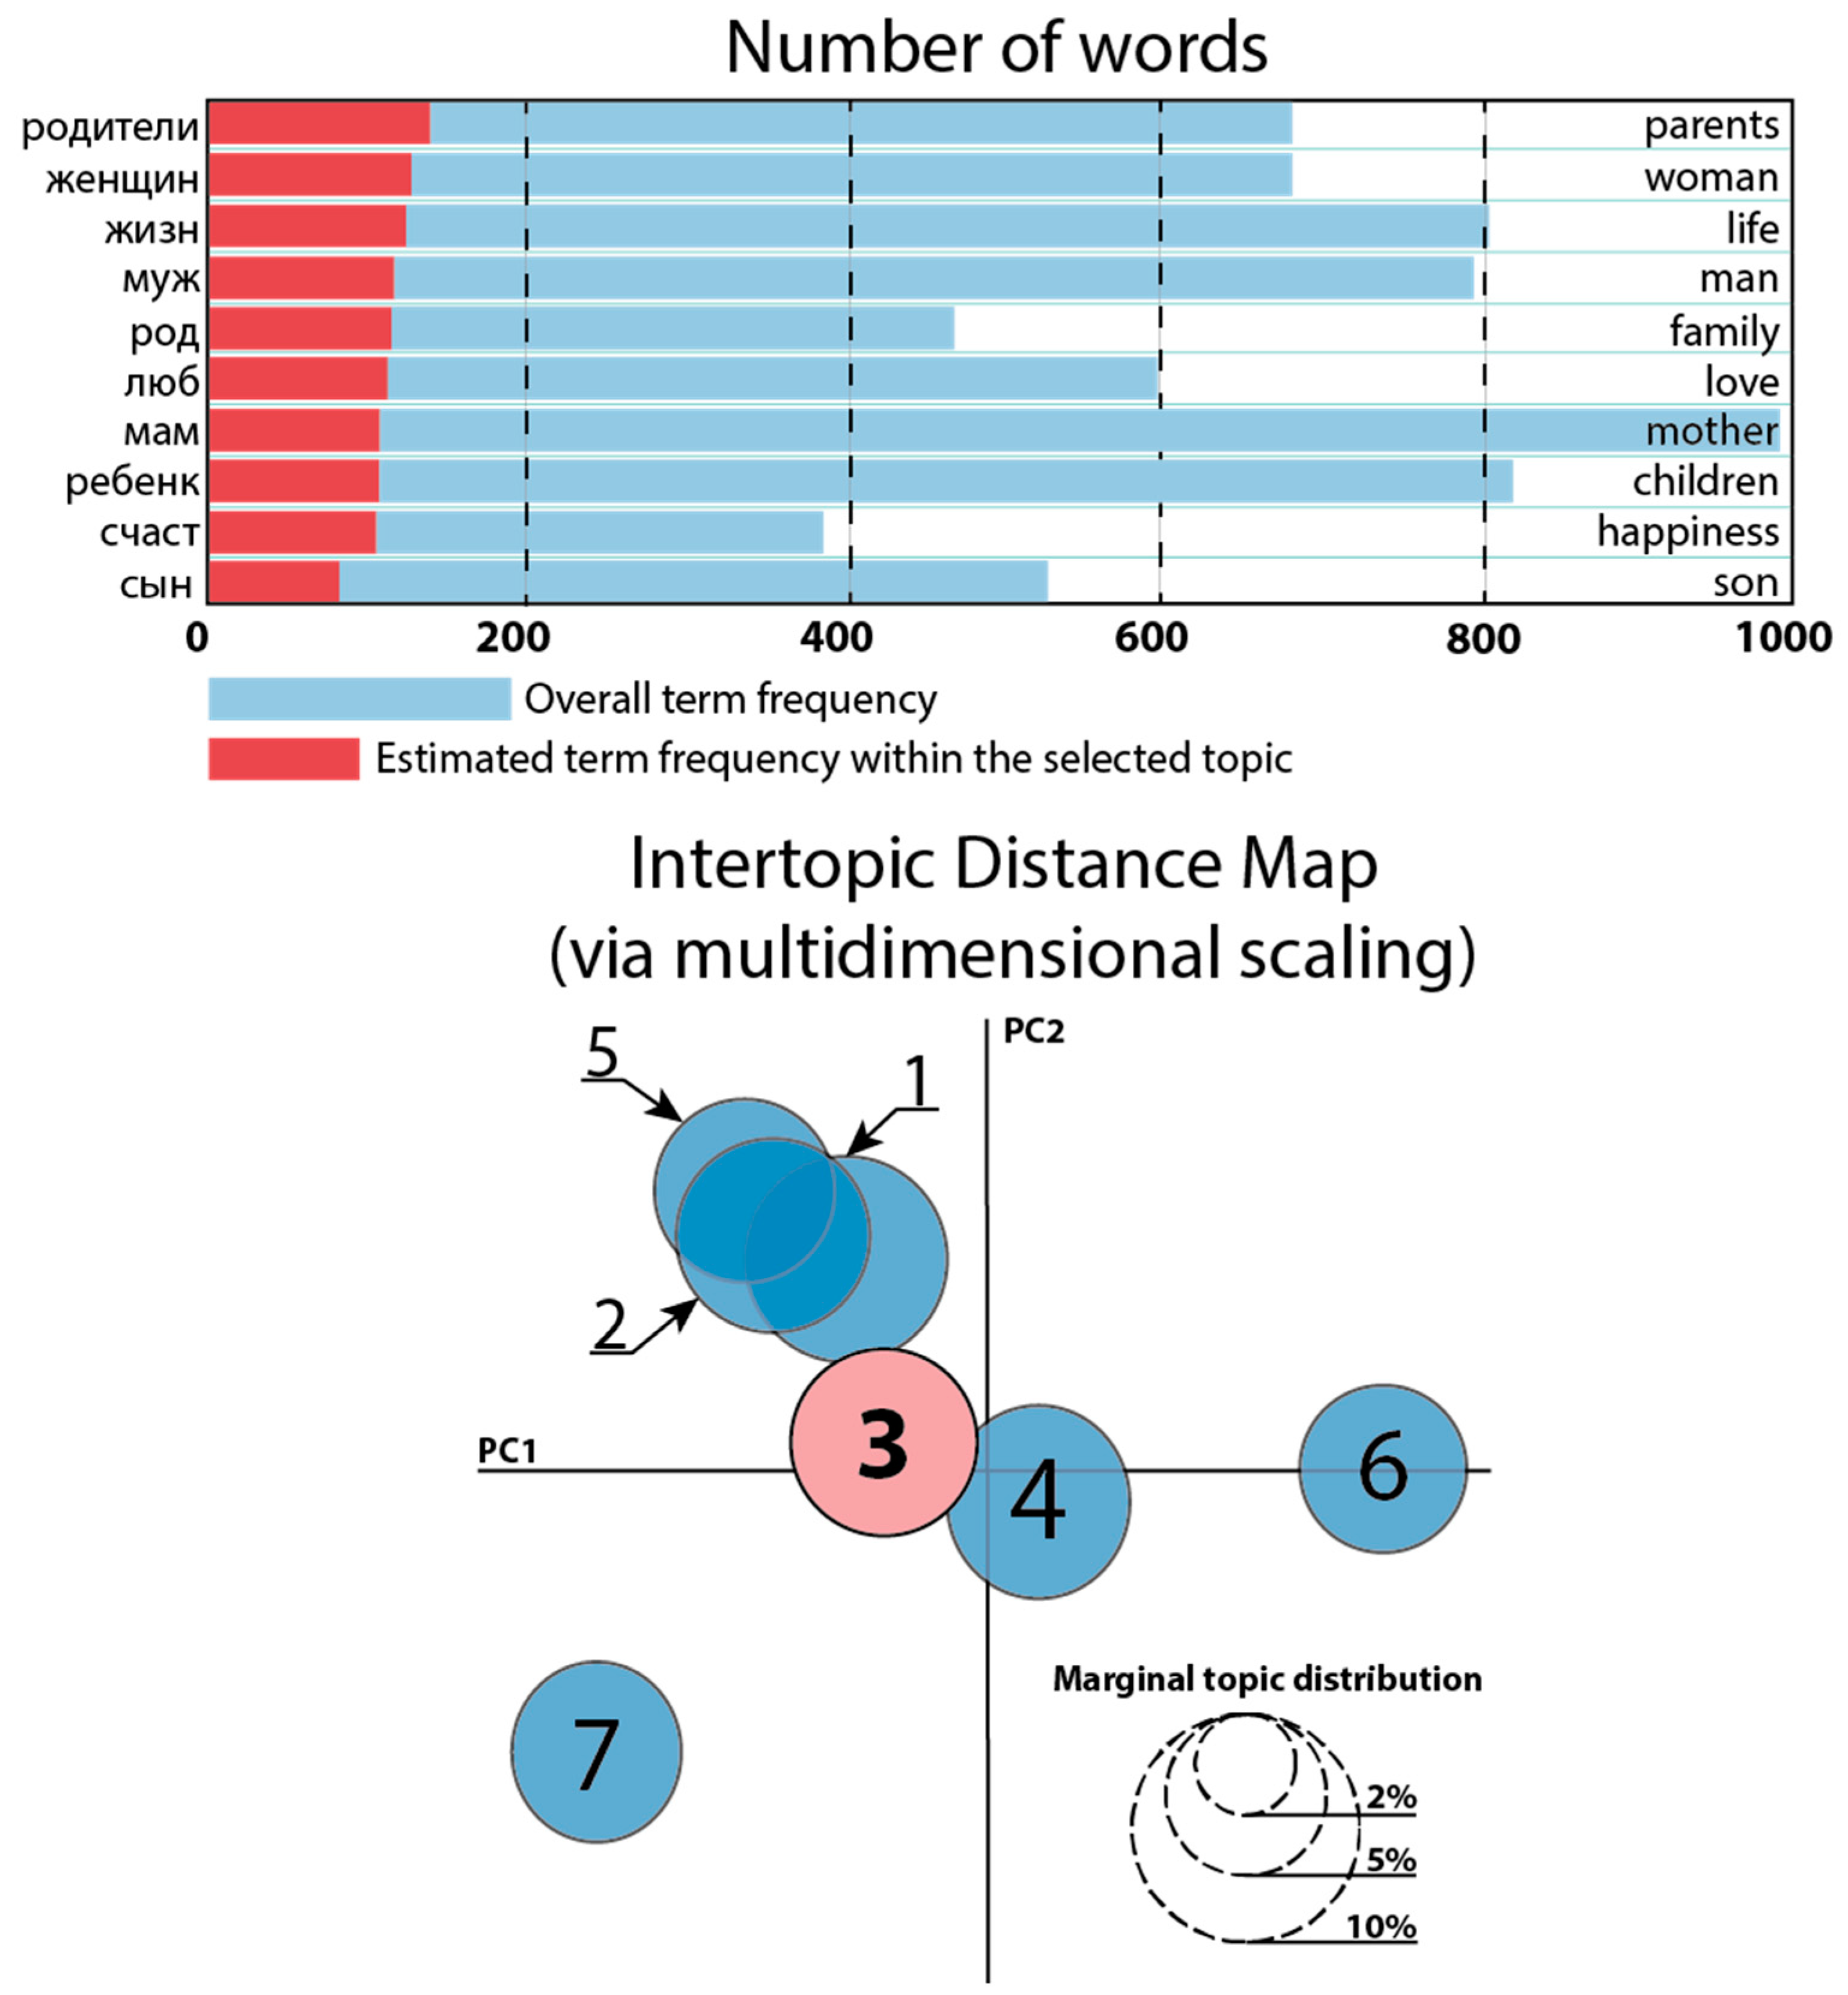
| Number of topics: 7 | |
| 1 | Russian: (‘0.010 ∙“мaм” + 0.010 ∙“oчeн” + 0.009 ∙“oдн” + 0.008 ∙“poдитeл” + 0.008 ∙“мyжчин” + 0.008 ∙“люд” + 0.007 ∙“жизн” + 0.007 ∙“peбeнк” + 0.007 ∙“дeлa” + 0.006 ∙“жeнщин”’) Nearest English equivalent: (‘0.010 ∙“mother” + 0.010 ∙“very” + 0.009 ∙“single” + 0.008 ∙“parents” + 0.008 ∙“man” + 0.008 ∙“people” + 0.007 ∙“life” + 0.007 ∙“child” + 0.007 ∙“business” + 0.006 ∙“woman”’) |
| 2 | Russian: (‘0.010 ∙“жeнщин” + 0.009 ∙“мyж” + 0.009 ∙“peбeнк” + 0.009 ∙“id_cвeтлa” + 0.008 ∙“мyжчин” + 0.008 ∙“люб” + 0.007 ∙“oчeн” + 0.007 ∙“мaм” + 0.007 ∙“дoм” + 0.007 ∙“ceм”’) Nearest English equivalent: (‘0.010 ∙“woman” + 0.009 ∙“husband” + 0.009 ∙“child” + 0.009 ∙“id_cвeтлa” + 0.008 ∙“man” + 0.008 ∙“love” + 0.007 ∙“very” + 0.007 ∙“mother” + 0.007 ∙“house” + 0.007 ∙“family”’) |
| 3 | Russian: (‘0.014 ∙“жизн” + 0.013 ∙“мyж” + 0.010 ∙“мo” + 0.010 ∙“мaм” + 0.008 ∙“пpocт” + 0.007 ∙“poд” + 0.007 ∙“люб” + 0.006 ∙“peбeнк” + 0.006 ∙“вce” + 0.006 ∙“ceм”’) Nearest English equivalent: (‘0.014 ∙“life” + 0.013 ∙“husband” + 0.010 ∙“my” + 0.010 ∙“mother” + 0.008 ∙“simply” + 0.007 ∙“gen” + 0.007 ∙“love” + 0.006 ∙“child” + 0.006 ∙“all” + 0.006 ∙“family”’) |
| 4 | Russian: (‘0.013 ∙“мaм” + 0.011 ∙“нaш” + 0.010 ∙“пpocт” + 0.010 ∙“жизн” + 0.009 ∙“мyж” + 0.009 ∙“poдитeл” + 0.009 ∙“пaп” + 0.008 ∙“peбeнк” + 0.008 ∙“id_eл” + 0.007 ∙“cын”’) Nearest English equivalent: (‘0.013 ∙“mother” + 0.011 ∙“own” + 0.010 ∙“simply” + 0.010 ∙“life” + 0.009 ∙“man” + 0.009 ∙“parents” + 0.009 ∙“father” + 0.008 ∙“child” + 0.008 ∙“id_el” + 0.007 ∙“son”’) |
| 5 | Russian: (‘0.013 ∙“peбeнк” + 0.013 ∙“жeнщин” + 0.011 ∙“мyжчин” + 0.008 ∙“мaм” + 0.008 ∙“oчeн” + 0.008 ∙“дpyг” + 0.007 ∙“дpyг_дpyг” + 0.006 ∙“чeлoвeк” + 0.006 ∙“вceм” + 0.006 ∙“нyжн”’) Nearest English equivalent: (‘0.013 ∙“child” + 0.013 ∙“woman” + 0.011 ∙“man” + 0.008 ∙“mother” + 0.008 ∙“very” + 0.008 ∙“friend” + 0.007 ∙“дpyг_дpyг” + 0.006 ∙“human” + 0.006 ∙“all” + 0.006 ∙“need”’) |
| 6 | Russian: (‘0.020 ∙“дa_бoг” + 0.012 ∙“мaм” + 0.012 ∙“гoвop” + 0.011 ∙“бoг” + 0.008 ∙“oдн” + 0.008 ∙“дoм” + 0.008 ∙“здopoв” + 0.008 ∙“poдитeл” + 0.007 ∙“дa” + 0.007 ∙“poд”’) Nearest English equivalent: (‘0.020 ∙“God” + 0.012 ∙“mother” + 0.012 ∙“spell” + 0.008 ∙“single” + 0.008 ∙“home” + 0.008 ∙“health” + 0.008 ∙“parents” + 0.007 ∙“yes” + 0.007 ∙“gen”’) |
| 7 | Russian: (‘0.015 ∙“кoтop” + 0.010 ∙“poдитeл” + 0.009 ∙“жeнщин” + 0.008 ∙“жизн” + 0.008 ∙“мyж” + 0.008 ∙“poд” + 0.008 ∙“люб” + 0.007 ∙“мaм” + 0.007 ∙“peбeнк” + 0.007 ∙“пpocт”’) Nearest English equivalent: (‘0.015 ∙“which” + 0.010 ∙“parents” + 0.009 ∙“woman” + 0.008 ∙“life” + 0.008 ∙“man” + 0.008 ∙“gen” + 0.008 ∙“love” + 0.007 ∙“mother” + 0.007 ∙“child” + 0.007 ∙“simply”’) |
Publisher’s Note: MDPI stays neutral with regard to jurisdictional claims in published maps and institutional affiliations. |
© 2021 by the authors. Licensee MDPI, Basel, Switzerland. This article is an open access article distributed under the terms and conditions of the Creative Commons Attribution (CC BY) license (https://creativecommons.org/licenses/by/4.0/).
Share and Cite
Kalabikhina, I.E.; Banin, E.P.; Abduselimova, I.A.; Klimenko, G.A.; Kolotusha, A.V. The Measurement of Demographic Temperature Using the Sentiment Analysis of Data from the Social Network VKontakte. Mathematics 2021, 9, 987. https://doi.org/10.3390/math9090987
Kalabikhina IE, Banin EP, Abduselimova IA, Klimenko GA, Kolotusha AV. The Measurement of Demographic Temperature Using the Sentiment Analysis of Data from the Social Network VKontakte. Mathematics. 2021; 9(9):987. https://doi.org/10.3390/math9090987
Chicago/Turabian StyleKalabikhina, Irina Evgenievna, Evgeniy Petrovich Banin, Imiliya Abduselimovna Abduselimova, German Andreevich Klimenko, and Anton Vasilyevich Kolotusha. 2021. "The Measurement of Demographic Temperature Using the Sentiment Analysis of Data from the Social Network VKontakte" Mathematics 9, no. 9: 987. https://doi.org/10.3390/math9090987
APA StyleKalabikhina, I. E., Banin, E. P., Abduselimova, I. A., Klimenko, G. A., & Kolotusha, A. V. (2021). The Measurement of Demographic Temperature Using the Sentiment Analysis of Data from the Social Network VKontakte. Mathematics, 9(9), 987. https://doi.org/10.3390/math9090987