
Core Predictors of Debt Specialization: A New Insight to Optimal Capital Structure

 , ,
, ,  and
and 
Abstract
1. Introduction
2. Theories and Literature Review
2.1. Theories of Capital Structure
2.2. Literature Review and Theoretical Predictions for Predictors of Debt Specialization
2.2.1. Liquidity
2.2.2. Profitability
2.2.3. Leverage
2.2.4. Nature of Assets
2.2.5. Risk
2.2.6. Growth
2.2.7. Controlling Authority
2.2.8. Market
2.2.9. Expenses
2.2.10. Debt Market
2.2.11. Stock Market
2.2.12. Industry
2.2.13. Macroeconomic
3. Materials and Methods
3.1. Data Collection and Sample Description
3.2. Measurement
3.3. Estimation Methods for Unbalanced Panel Data and Model Specifications
β8MARKt + β9NOEt + β10DMt + β11SMt + β12INDt + β13MACROt + εt
4. Results
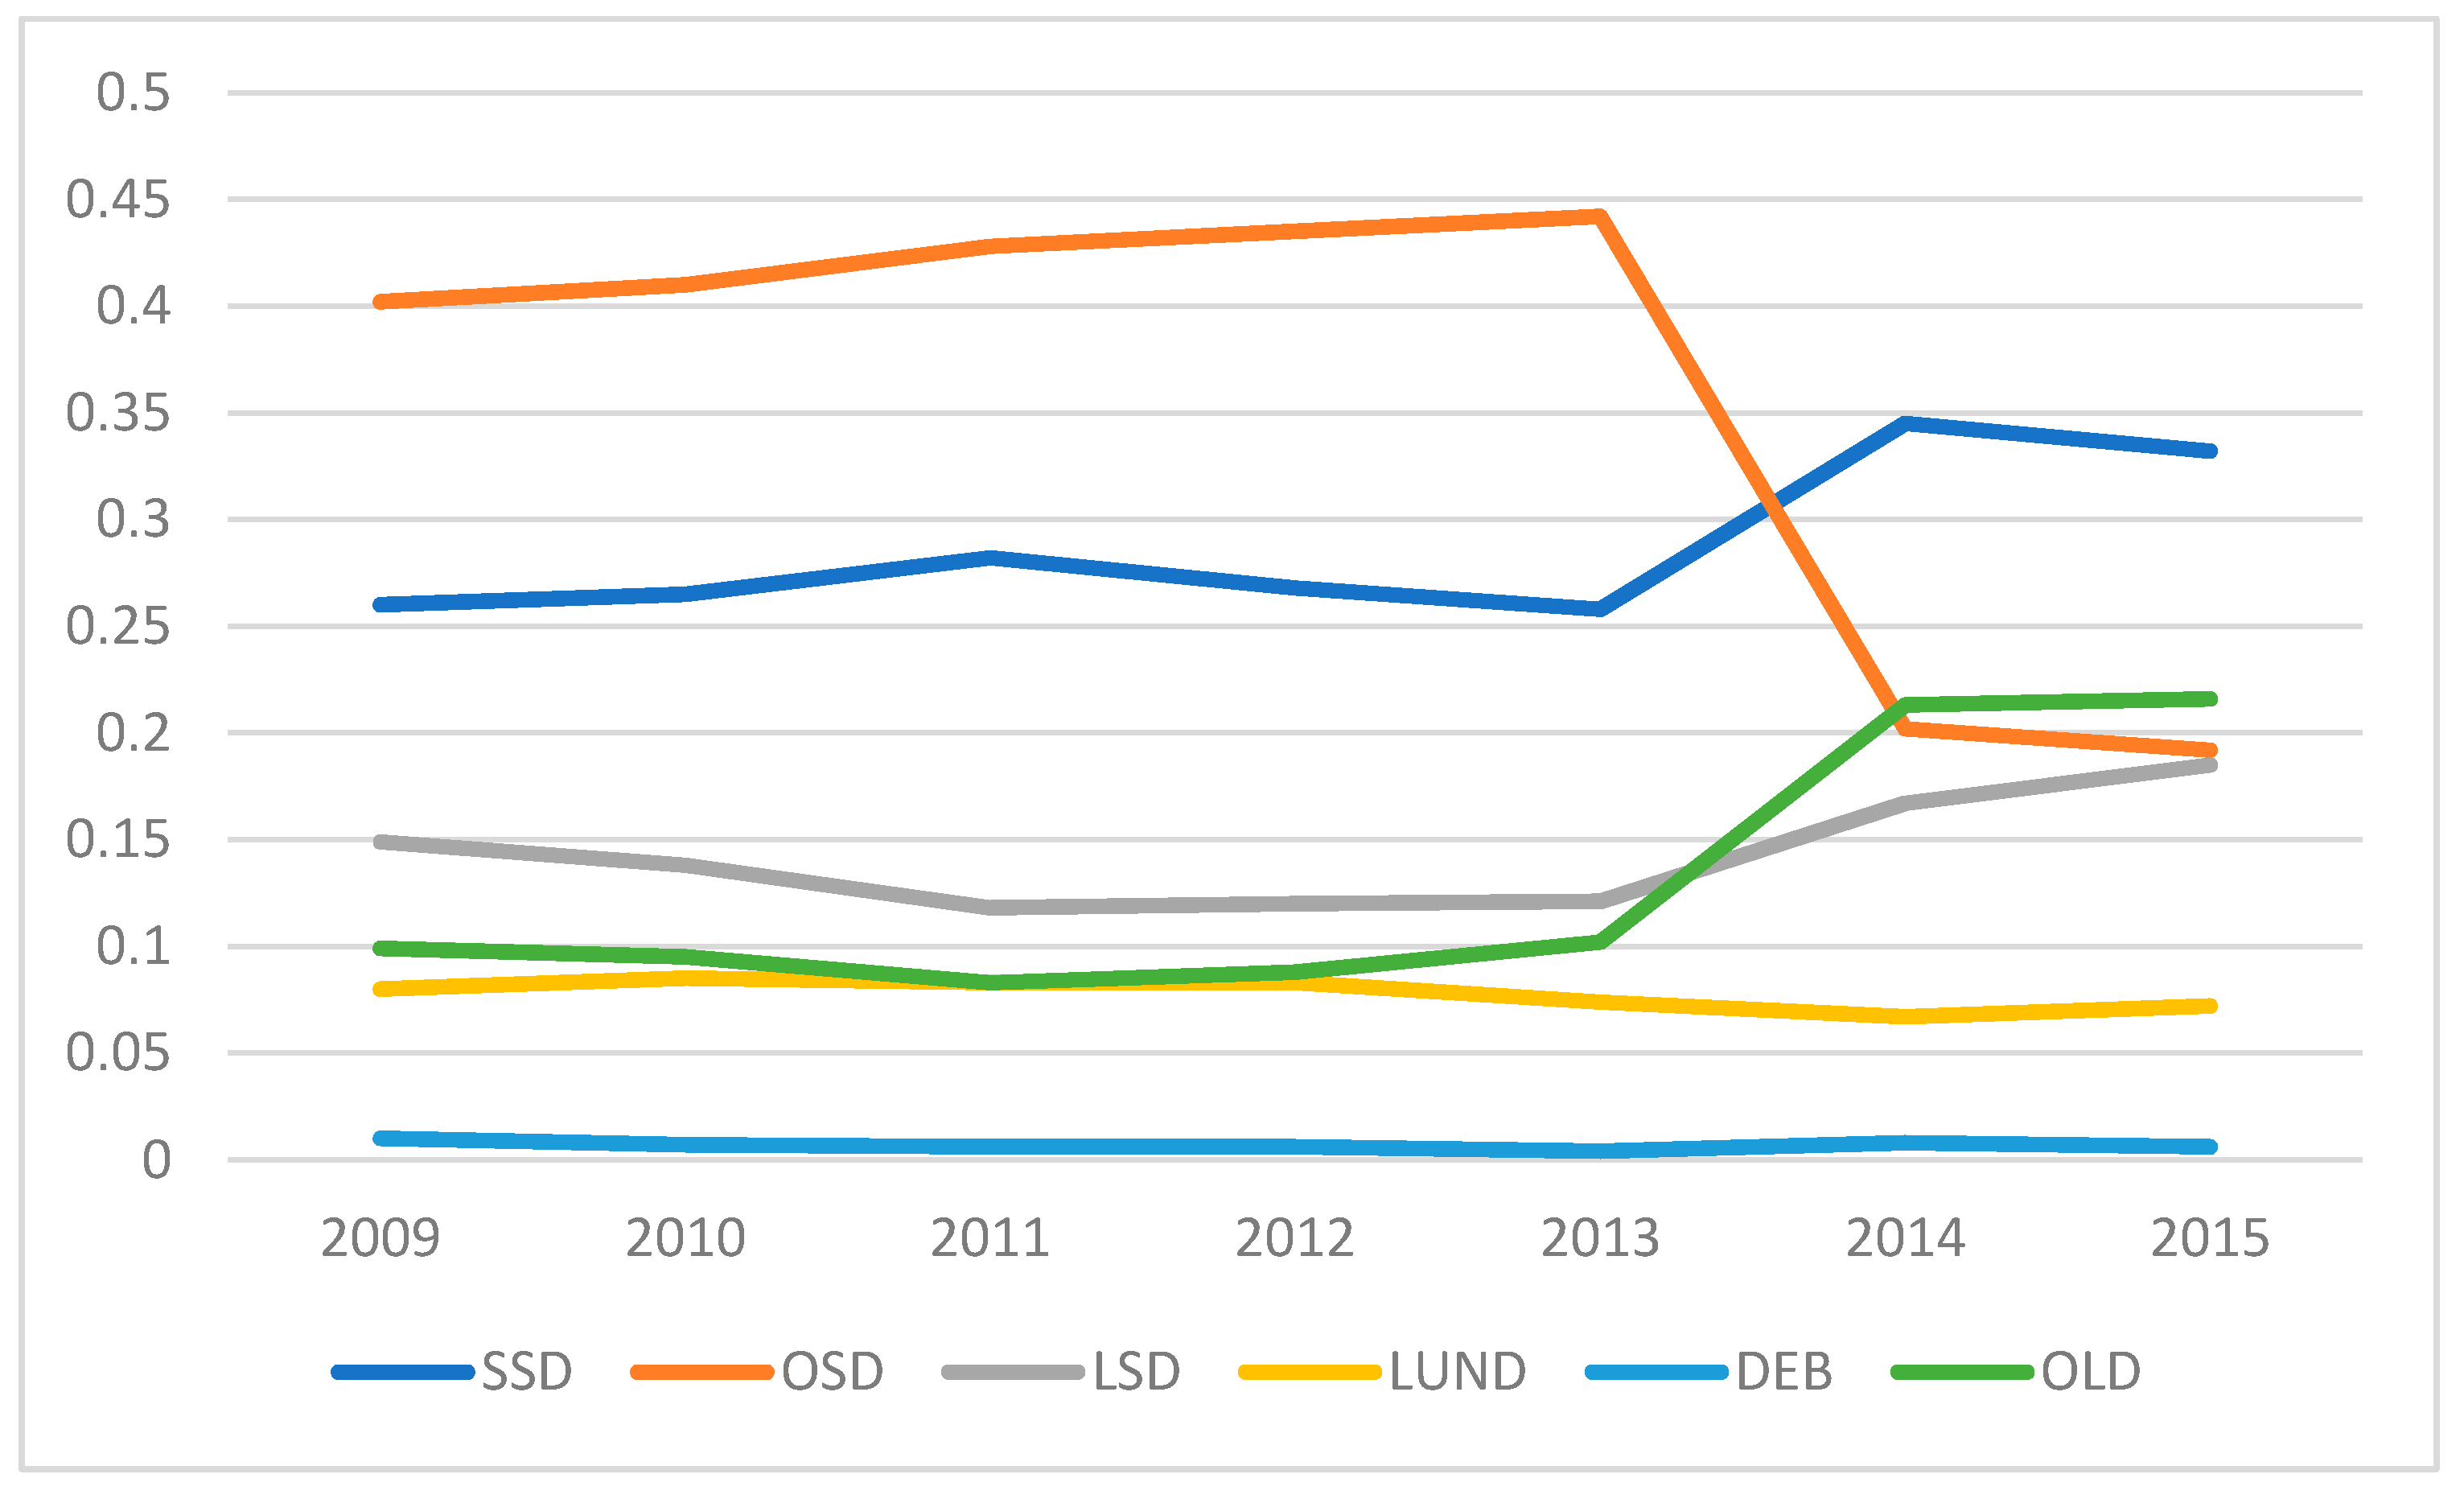
4.1. Debt Structure Overview
4.2. Descriptive Statistics
4.3. Which Organizations Specialize?
4.4. Applicability of Debt Specialization Strategy across Organizations
4.5. Empirical Evidence for Core Factor Identification
5. Conclusions
5.1. Implication of the Study
5.2. Limitations and Scope of the Study
Author Contributions
Funding
Data Availability Statement
Acknowledgments
Conflicts of Interest
Appendix A

| Variables | Acronym | Variables | Acronym | Variables | Acronym | Variables | Acronym |
|---|---|---|---|---|---|---|---|
| Cash Holding | CH | Asset Growth | AG | Dividend Payers | DP | Liquidity | LIQ |
| Current Ratio | CR | Sale Growth | SG | Dividend Payout Ratio | DPR | Profitability | PROF |
| Gross Margin Ratio | GMR | Earnings Growth | EG | Dividend Yield | DY | Leverage | LEV |
| EBITDA Margin Ratio | EBITDA | Business Group Affiliation | BGA | Regulation | Reg. | Nature of Asset | NOA |
| Net Profit Ratio | NPR | Size | Size | Median Industry Financial Leverage | MIFL | Risk | RISK |
| Financial Leverage | FL | Age | Age | Median Industry Long-term Debt to Assets | MILDA | Growth | GROW |
| Market Leverage | ML | Market to Book Growth | MBR | Median Industry Market Leverage | MIML | Controlling Authority | CA |
| Long-term Debt to Assets | LDA | Depreciation Ratio | Dep. | Median Industry Asset Growth | MIAG | Market | MARK |
| Asset Tangibility | AT | Operating Expense Ratio | OER | Median Industry Sale Growth | MISG | Nature of Expenses | NOE |
| Total Asset Turnover Ratio | TATR | Tax Ratio | TR | Median Industry Earnings Growth | MIEG | Debt Market | DM |
| Earnings Volatility | EV | Credit Rating | Rating | Government Borrowing | GB | Stock Market | SM |
| Default Risk | DR | Financial Ratio | FR | Expected Inflation Rates | EIR | Industry | IND |
| Return on Asset Volatility | ROAV | Interest Coverage Ratio | ICR | GDP Growth | GDP Gro. | Macroeconomic | MACRO |
| Short Term Secured Debts | SSD | Short Term Other Debts | OSD | Long Term Secured Debts | LSD | Long Term Unsecured Debts | LUND |
| Debenture | DEB | Other Long-Term Debts | OLD | Total Debts | TD |
References
- Nosratabadi, S.; Mosavi, A.; Shamshirband, S.; Zavadskas, E.K.; Rakotonirainy, A.; Chau, K.W. Sustainable business models: A review. Sustainability 2019, 11, 1663. [Google Scholar] [CrossRef]
- Frank, M.Z.; Goyal, V.K. Capital structure decisions: Which factors are reliably important? Financ. Manag. 2009, 38, 1–37. [Google Scholar] [CrossRef]
- Graham, J.R.; Leary, M.T. A review of empirical capital structure research and directions for the future. Annu. Rev. Financ. Econ. 2011, 3, 309–345. [Google Scholar] [CrossRef]
- Graham, J.R.; Leary, M.T.; Roberts, M.R. A century of capital structure: The leveraging of corporate America. J. Financ. Econ. 2015, 118, 658–683. [Google Scholar] [CrossRef]
- Azofra, V.; Castrillo, L.; del Mar Delgado, M. Ownership concentration, debt financing and the investment opportunity set as determinants of accounting discretion: Empirical evidence from Spain. Spanish J. Financ. Account. Rev. Española Financ. Contab. 2003, 32, 215–255. [Google Scholar] [CrossRef]
- Khan, K.I.; Qadeer, F.; John, A.; Sheeraz, M. Existence and prevalence of debt specialization strategy across organizations: A Pakistani perspective. Pakistan J. Commer. Soc. Sci. 2016, 10, 461–485. Available online: http://jespk.net/publications/320.pdf (accessed on 5 December 2020).
- Khan, K.I.; Qadeer, F.; Rizavi, S.S.S.; Mahmood, S.; Rizavi, S.S.S. Reasons of debt specialization: Understanding the perspectives of small and large organizations. Lahore J. Bus. 2017, 6, 93–110. [Google Scholar] [CrossRef]
- Malik, Q.U.Z.; Afza, T. Do group affiliated firms specialize in debt? Evidence from Pakistan. J. Econ. Adm. Sci. 2016, 32, 46–62. [Google Scholar] [CrossRef]
- Goodell, J.W.; Goyal, A. What determines debt structure in emerging markets: Transaction costs or public monitoring? Int. Rev. Financ. Anal. 2018, 55, 184–195. [Google Scholar] [CrossRef]
- Rajan, R.G.; Zingales, L. What do we know about capital structure? Some evidence from international data. J. Financ. 1995, 50, 1421–1460. [Google Scholar] [CrossRef]
- Booth, L.; Aivazian, V.; Demirguc-Kunt, A.; Maksimovic, V. Capital structures in developing countries. J. Financ. 2001, 56, 87–130. [Google Scholar] [CrossRef]
- Povoa, A.C.S.; Nakamura, W.T. Homogeneity versus heterogeneity in debt structure: A study using panel data. Account. Financ. Rev. 2014, 25, 19–32. [Google Scholar] [CrossRef][Green Version]
- Colla, P.; Ippolito, F.; Li, K.A.I. Debt specialization. J. Financ. 2013, 68, 2117–2141. [Google Scholar] [CrossRef]
- Rauh, J.D.; Sufi, A. Capital structure and debt structure. Rev. Financ. Stud. 2010, 23, 4242–4280. [Google Scholar] [CrossRef]
- Lemmon, M.L.; Roberts, M.R.; Zender, J.F. Back to the beginning: Persistence and the cross-section of corporate capital structure. J. Financ. 2008, 63, 1575–1608. [Google Scholar] [CrossRef]
- Giannetti, C. Debt specialization and performance of European firms. J. Empir. Financ. 2019, 53, 257–271. [Google Scholar] [CrossRef]
- Kraus, A.; Litzenberger, R.H. A state-preference model of optimal financial leverage. J. Financ. 1973, 28, 911–922. [Google Scholar] [CrossRef]
- Baker, H.K.; Martin, G.S. Capital Structure and Corporate Financing Decisions: Theory, Evidence, and Practice, 1st ed.; John Wiley & Sons: Hoboken, NJ, USA, 2011; ISBN 0470569522. [Google Scholar]
- Harris, M.; Raviv, A. The theory of capital structure. J. Financ. 1991, 46, 297–355. [Google Scholar] [CrossRef]
- Baker, H.K.; Powell, G.E.; Veit, E.T. Revisiting managerial perspectives on dividend policy. J. Econ. Financ. 2002, 26, 267–283. [Google Scholar] [CrossRef]
- Khan, K.I.; Qadeer, F.; Ghafoor, M.M. Debt specialization within profitability sub-groups: A new perspective of debt structure choices. FWU J. Soc. Sci. 2017, 11, 92–108. [Google Scholar]
- Myers, S.C. The capital structure puzzle. J. Financ. 1984, 39, 574–592. [Google Scholar] [CrossRef]
- Arena, M.P. The corporate choice between public debt, bank loans, traditional private debt placements, and 144A debt issues. Rev. Quant. Financ. Account. 2011, 36, 391–416. [Google Scholar] [CrossRef]
- Kale, J.R.; Meneghetti, C. The choice between public and private debt: A survey. IIMB Manag. Rev. 2011, 23, 5–14. [Google Scholar] [CrossRef]
- Elsas, R.; Flannery, M.J.; Garfinkel, J.A. Financing major investments: Information about capital structure decisions. Rev. Financ. 2014, 18, 1341–1386. [Google Scholar] [CrossRef]
- Fama, E.F.; French, K.R. Testing trade-off and pecking order predictions about dividends and debt. Rev. Financ. Stud. 2002, 15, 1–33. [Google Scholar] [CrossRef]
- Ross, S.A. The determination of financial structure: The incentive-signalling approach. Bell J. Econ. 1977, 8, 23–40. [Google Scholar] [CrossRef]
- Jensen, M.C.; Meckling, W.H. Theory of the firm: Managerial behavior, agency costs and ownership structure. J. Financ. Econ. 1976, 3, 305–360. [Google Scholar] [CrossRef]
- Alderson, M.J.; Bansal, N.; Betker, B.L. Secured debt and managerial incentives. Rev. Quant. Financ. Account. 2014, 43, 423–440. [Google Scholar] [CrossRef]
- Barclay, M.J.; Smith, C.W. The priority structure of corporate liabilities. J. Financ. 1995, 50, 899–917. [Google Scholar] [CrossRef]
- Ardalan, K. Capital structure theory: Reconsidered. Res. Int. Bus. Financ. 2017, 39, 696–710. [Google Scholar] [CrossRef]
- Priester, C.; Wang, J. Financial Strategies for the Manager, 2nd ed.; Tsinghua University Press: Beijing, China, 2010; ISBN 3540709665. [Google Scholar]
- Florackis, C.; Kanas, A.; Kostakis, A. Dividend policy, managerial ownership and debt financing: A non-parametric perspective. Eur. J. Oper. Res. 2015, 241, 783–795. [Google Scholar] [CrossRef]
- Tengulov, A. The impact of borrowing diversity on firm’s value, financial and real decisions. In Proceedings of the Annual Conference of the Swiss Society for Financial Market Research, Zurich, Switzerland, 10 April 2015. [Google Scholar]
- Khan, K.I.; Nasir, A.; Arslan, A. Impact of Loan Accessibility on Working Capital Management and Profitability: Comparative Study of Family Versus Non-Family Firms. Glob. Soc. Sci. Rev. 2020, V, 220–230. [Google Scholar] [CrossRef]
- Basu, K. Market imperfections and optimal capital structure: Evidence from Indian panel data. Glob. Bus. Rev. 2015, 16, 61–83. [Google Scholar] [CrossRef]
- Pessarossi, P.; Weill, L. Choice of corporate debt in China: The role of state ownership. China Econ. Rev. 2013, 26, 1–16. [Google Scholar] [CrossRef]
- Locorotondo, R.; Dewaelheyns, N.; Van Hulle, C. Cash holdings and business group membership. J. Bus. Res. 2014, 67, 316–323. [Google Scholar] [CrossRef]
- Danis, A.; Rettl, D.A.; Whited, T.M. Refinancing, profitability, and capital structure. J. Financ. Econ. 2014, 114, 424–443. [Google Scholar] [CrossRef]
- Afrasiabishani, J.; Ahmadinia, H.; Hesami, E. A Comprehensive Review on Capital Structure Theories. Sch. Dr. Stud. Eur. Union J. 2012, 4, 35–45. [Google Scholar]
- Myers, S.C.; Majluf, N.S. Corporate financing and investment decisions when firms have information that investors do not have. J. Financ. Econ. 1984, 13, 187–221. [Google Scholar] [CrossRef]
- Kaya, H.D. The Effect of Firm Characteristics on Choice of Debt Financing. Int. J. Manag. 2011, 28, 199–208. Available online: https://search.proquest.com/scholarly-journals/effect-firm-characteristics-on-choice-debt/docview/1008666418/se-2?accountid=135034 (accessed on 8 December 2020).
- Memon, Z.A.; Chen, Y.; Tauni, M.Z.; Ali, H. The impact of cash flow volatility on firm leverage and debt maturity structure: Evidence from China. China Financ. Rev. Int. 2018, 8, 69–91. [Google Scholar] [CrossRef]
- Johnson, S.A. An empirical analysis of the determinants of corporate debt ownership structure. J. Financ. Quant. Anal. 1997, 32, 47–69. [Google Scholar] [CrossRef]
- Titman, S.; Wessels, R. The determinants of capital structure choice. J. Financ. 1988, 43, 1–19. [Google Scholar] [CrossRef]
- Lopez-Gracia, J.; Mestre-Barbera, R. Tax effect on Spanish SME optimum debt maturity structure. J. Bus. Res. 2011, 64, 649–655. [Google Scholar] [CrossRef]
- Myers, S.C. Determinants of corporate borrowing. J. Financ. Econ. 1977, 5, 147–175. [Google Scholar] [CrossRef]
- Erel, I.; Julio, B.; Kim, W.; Weisbach, M.S. Macroeconomic conditions and capital raising. Rev. Financ. Stud. 2012, 25, 341–376. [Google Scholar] [CrossRef]
- Ozkan, A. Determinants of capital structure and adjustment to long run target: Evidence from UK company panel data. J. Bus. Financ. Account. 2001, 28, 175–198. [Google Scholar] [CrossRef]
- Bamiatzi, V.; Cavusgil, S.T.; Jabbour, L.; Sinkovics, R.R. Does business group affiliation help firms achieve superior performance during industrial downturns? An empirical examination. Int. Bus. Rev. 2014, 23, 195–211. [Google Scholar] [CrossRef]
- Goyal, V.K.; Wang, W. Debt maturity and asymmetric information: Evidence from default risk changes. J. Financ. Quant. Anal. 2013, 48, 789–817. [Google Scholar] [CrossRef]
- Gopalan, R.; Nanda, V.; Seru, A. Affiliated firms and financial support: Evidence from Indian business groups. J. Financ. Econ. 2007, 86, 759–795. [Google Scholar] [CrossRef]
- Masulis, R.W.; Pham, P.K.; Zein, J. Family business groups around the world: Financing advantages, control motivations, and organizational choices. Rev. Financ. Stud. 2011, 24, 3556–3600. [Google Scholar] [CrossRef]
- He, J.; Mao, X.; Rui, O.M.; Zha, X. Business groups in China. J. Corp. Financ. 2013, 22, 166–192. [Google Scholar] [CrossRef]
- Xavier, W.G.; Bandeira-de-Mello, R.; Marcon, R. Institutional environment and business groups’ resilience in Brazil. J. Bus. Res. 2014, 67, 900–907. [Google Scholar] [CrossRef]
- Han, S.H.; Kwon, Y.; Jo, E. The Knock-On Effect in Business Group: Evidence from Korean Chaebols Credit Rating Changes. In Proceedings of the 25th Australasian Finance and Banking Conference, Sydney, Australia, 16–18 December 2012. [Google Scholar]
- Dewaelheyns, N.; Hulle, C. Van Internal capital markets and capital structure: Bank versus internal debt. Eur. Financ. Manag. 2010, 16, 345–373. [Google Scholar] [CrossRef]
- Li, L.; Islam, S.Z. Firm and industry specific determinants of capital structure: Evidence from the Australian market. Int. Rev. Econ. Financ. 2019, 59, 425–437. [Google Scholar] [CrossRef]
- Chang, C.; Chen, X.; Liao, G. What are the reliably important determinants of capital structure in China? Pacific-Basin Financ. J. 2014, 30, 87–113. [Google Scholar] [CrossRef]
- Flannery, M.J. Asymmetric information and risky debt maturity choice. J. Financ. 1986, 41, 19–37. [Google Scholar] [CrossRef]
- Joeveer, K. Firm, country and macroeconomic determinants of capital structure: Evidence from transition economies. J. Comp. Econ. 2013, 41, 294–308. [Google Scholar] [CrossRef]
- Chemmanur, T.J.; Fulghieri, P. Reputation, renegotiation, and the choice between bank loans and publicly traded debt. Rev. Financ. Stud. 1994, 7, 475–506. [Google Scholar] [CrossRef]
- Lemmon, M.L.; Zender, J.F. Debt Capacity and Tests of Capital Structure Theories. J. Financ. Quant. Anal. 2010, 45, 1161–1187. [Google Scholar] [CrossRef]
- Faulkender, M.; Petersen, M.A. Does the source of capital affect capital structure? Rev. Financ. Stud. 2006, 19, 45–79. [Google Scholar] [CrossRef]
- Meneghetti, C. Managerial incentives and the choice between public and bank debt. J. Corp. Financ. 2012, 18, 65–91. [Google Scholar] [CrossRef]
- Baker, M.; Wurgler, J. Market timing and capital structure. J. Financ. 2002, 57, 1–32. [Google Scholar] [CrossRef]
- Grjebine, T.; Szczerbowicz, U.; Tripier, F. Corporate debt structure and economic recoveries. Eur. Econ. Rev. 2018, 101, 77–100. [Google Scholar] [CrossRef]
- Chen, H.; Hu, Y.J.; Huang, S. Monetary Incentive and Stock Opinions on Social Media. J. Manag. Inf. Syst. 2019, 36, 391–417. [Google Scholar] [CrossRef]
- Barclay, M.J.; Smith, C.W. The maturity structure of corporate debt. J. Financ. 1995, 50, 609–631. [Google Scholar] [CrossRef]
- Albring, S.M.; Khurana, I.K.; Nejadmalayeri, A.; Pereira, R. Managerial compensation and the debt placement decision. J. Corp. Financ. 2011, 17, 1445–1456. [Google Scholar] [CrossRef]
- Denis, D.J.; McKeon, S.B. Debt financing and financial flexibility evidence from proactive leverage increases. Rev. Financ. Stud. 2012, 25, 1897–1929. [Google Scholar] [CrossRef]
- Hanssens, J.; Deloof, M.; Vanacker, T. The evolution of debt policies: New evidence from business startups. J. Bank. Financ. 2016, 65, 120–133. [Google Scholar] [CrossRef]
- Li, N.; Lou, Y.; Otto, C.A.; Wittenberg-Moerman, R. Accounting quality and debt concentration: Evidence from internal control weakness disclosures. Work. Pap. HEC Paris 2016. [Google Scholar] [CrossRef]
- Abor, J. Debt policy and performance of SMEs: Evidence from Ghanaian and South African firms. J. Risk Financ. 2007, 8, 364–379. [Google Scholar] [CrossRef]
- Delen, D.; Kuzey, C.; Uyar, A. Measuring firm performance using financial ratios: A decision tree approach. Expert Syst. Appl. 2013, 40, 3970–3983. [Google Scholar] [CrossRef]
- Alhassan, A.; Li, L.; Reddy, K.; Duppati, G. The relationship between political instability and financial inclusion: Evidence from Middle East and North Africa. Int. J. Financ. Econ. 2019. [Google Scholar] [CrossRef]
- Lou, Y.; Otto, C. Debt Dispersion, Creditor Conflicts, and Covenants in Corporate Loans; HEC: Paris, France, 2015. [Google Scholar]
- Shah, A.; Khan, S.A. Empirical investigation of debt-maturity structure: Evidence from Pakistan. Pak. Dev. Rev. 2009, 48, 565–578. [Google Scholar] [CrossRef]
- Wang, H.D.; Lin, C.J. Debt financing and earnings management: An internal capital market perspective. J. Bus. Financ. Account. 2013, 40, 842–868. [Google Scholar] [CrossRef]
- Aggarwal, R.; Kyaw, N.A. Capital structure, dividend policy, and multinationality: Theory versus empirical evidence. Int. Rev. Financ. Anal. 2010, 19, 140–150. [Google Scholar] [CrossRef]
- Chang, H.H.; Hung, C.-J.; Hsieh, H.-W. Virtual teams: Cultural adaptation, communication quality, and interpersonal trust. Total Qual. Manag. Bus. Excell. 2014, 25, 1318–1335. [Google Scholar] [CrossRef]
- Buchuk, D.; Larrain, B.; Muñoz, F.; Urzúa I., F. The internal capital markets of business groups: Evidence from intra-group loans. J. Financ. Econ. 2014, 112, 190–212. [Google Scholar] [CrossRef]
- Custódio, C.; Ferreira, M.A.; Laureano, L. Why are US firms using more short-term debt? J. Financ. Econ. 2013, 108, 182–212. [Google Scholar] [CrossRef]
- George, D. SPSS for Windows Step by Step: A Simple Study Guide and Reference, 17.0 Update, 10th ed.; Pearson Education, Inc.: Boston, MA, USA, 2010; ISBN 8131762254. [Google Scholar]
- Tabachnick, B.G.; Fidell, L.S. Using Multivariate Statistics, 6th ed.; Pearson Education, Inc.: New York, NY, USA, 2013. [Google Scholar]
- Maddala, G.S. Limited Dependent and Qualitative Variables in Econometrics; Cambridge University Press: Cambridge, UK, 1986; ISBN 0521338255. [Google Scholar]
- West, S.G.; Finch, J.F.; Curran, P.J. Structural Equation Models with Non- Normal Variables: Problems and Remedies; Sage Publications, Inc.: Newbery Park, CA, USA, 1995; ISBN 9780803953185. [Google Scholar]
- Orlova, S.; Harper, J.T.; Sun, L. Determinants of capital structure complexity. J. Econ. Bus. 2020, 110, 105905. [Google Scholar] [CrossRef]
- Merton, R.C. On the pricing of corporate debt: The risk structure of interest rates. J. Financ. 1974, 29, 449–470. [Google Scholar] [CrossRef]
- Dell’Erba, S.; Hausmann, R.; Panizza, U. Debt levels, debt composition, and sovereign spreads in emerging and advanced economies. Oxford Rev. Econ. Policy 2013, 29, 518–547. [Google Scholar] [CrossRef]
- Davydov, D. Debt structure and corporate performance in emerging markets. Res. Int. Bus. Financ. 2016, 38, 299–311. [Google Scholar] [CrossRef]
- De Fiore, F.; Uhlig, H. Corporate Debt Structure and the Financial Crisis. J. Money Credit Bank. 2015, 47, 1571–1598. [Google Scholar] [CrossRef]

| Explanatory Variables | Expected Relations | Measurements | Relation Found in Prior Studies | Theories & Predicted Signs | ||
|---|---|---|---|---|---|---|
| Positive | Negative | |||||
| Liquidity | CH | Positive | Colla [13]; Florackis [33]; Tengulov [34] | TO (+) PO (+) AC (−) | ||
| CR | Positive | Basu [36]; Pessarossi [37] | ||||
| Profitability | GMR | Negative | Abor [74] | TO (−) PO (+) AC (−) S (−) | ||
| EBITDA | Negative | Delen [75] | ||||
| NPR | Negative | Danis [39]; Elsas [25]; Li [76] | Basu [36]; Colla [13]; Graham [4] | |||
| Leverage | FL | Negative | Povoa [12] | Colla [13]; Florackis [33]; Li [76]; Lou [77]; Tengulov [34] | TO (−) AC (−) | |
| ML | Negative | Alderson [29]; Tengulov [34] | ||||
| LDA | Negative | Albring [70]; Colla [13] | ||||
| Nature of Asset | AT | Negative | Povoa [12] | Colla [13]; Li [76]; Lou [77] | TO (−) PO (−) AC (−) | |
| TATR | Negative | Shah [78] | ||||
| Risk | EV | Positive | Danis [39]; Povoa [12] | TO (+) PO (+) AC (+) S (−) | ||
| DR | Positive | Alderson [29]; Wang [79] | ||||
| ROAV | Positive | It is the standard deviation of operating income divided by total assets over the previous 7 years | Meneghetti [65] | |||
| Growth | AG | Negative | Basu [36] | Chang [59] | TO (+) PO (−) AC (+) S (−) | |
| RG | Positive | Erel [48] | ||||
| EG | Negative | Shah [78] | ||||
| Controlling Authority | BGA | Negative | “1” if a company is a group affiliated, “0” if it is unaffiliated. | Bamiatzi [50]; He [54]; Locorotondo [38]; Wang [79] | TO (−) PO (−) AC (−) S (−) | |
| Market | Size | Negative | The logarithm of Total Assets | Colla [13]; Danis [39]; Elsas [25]; Florackis [33]; Li [76]; Lou [77]; Povoa [12] | TO (−) PO (+) AC (−) S (+) | |
| Age | Positive | Time in years since the company announces its first IPO | Chang [59]; Colla [13]; Povoa [12]; Li [76] | |||
| MBR | Negative | Colla [13]; Danis [39]; Lou [77]; Tengulov [34] | Povoa [12]; Li [76] | |||
| Nature of Expenses | Dep. | Positive | Chang [59]; Elsas [25] | TO (+) PO (+) AC (+) | ||
| OER | Positive | Colla [13]; Frank [2] | ||||
| TR | Negative | Shah [78] | ||||
| Debt Market | Rating | Negative | “1” if the firm is rated, “0” otherwise | Colla [13]; Danis [39]; Elsas [25]; Li [76]; Povoa [12] | TO (−) PO (+) AC (−) S (+) | |
| FR | Negative | Meneghetti [65]; Tengulov [34] | TO (+) PO (+) AC (+) | |||
| ICR | Negative | Khan [21] | ||||
| Stock Market | DP | Positive | “1” if a company pays either cash or stock dividends, “0” otherwise. | Lemmon [15] | Li [76]; Lou [77] | PO (+) MT(+) S (+) |
| DPR | Positive | Aggarwal [80]; Florackis [33] | ||||
| DY | Positive | Tengulov [34] | ||||
| Industry | Reg. | Positive | “1” if the company is in a regulated industry and “0” otherwise | Albring [70]; Basu [36]; Elsas [25]; Frank [2]; Graham [4] | TO (+) PO (+) AC (+) S (+) | |
| MIL | Negative | Median of leverage values (financial, long-term debt to asset and market) for all organizations of the industry during the year | Denis [71]; Chang [59]; Joeveer [61] | TO (−) AC (−) | ||
| MIG | Negative | Median values of growth (Revenue and market to book) for all organizations of the industry during the year. | Chang [81]; Frank [2] | TO (+) PO (−) AC (+) S (−) | ||
| Macroeconomic | GB | Positive | Graham [4] | PO (+) MT(+) S (+) | ||
| EIR | Positive | Graham [4] | Chang [59]; Joeveer [61] | |||
| GDPG | Negative | Chang [59]; Graham [4]; Joeveer [61] | ||||
| Types of Debts | Mean | Percentile | SD | Obs. with Positive Usage (%) | ||||||
|---|---|---|---|---|---|---|---|---|---|---|
| 10th | 25th | 50th | 75th | 90th | 95th | 99th | ||||
| SSD | 0.287 | 0.000 | 0.008 | 0.242 | 0.490 | 0.673 | 0.770 | 0.770 | 0.266 | 76.82 |
| OSD | 0.360 | 0.027 | 0.121 | 0.272 | 0.546 | 0.888 | 1.000 | 1.000 | 0.300 | 98.14 |
| LSD | 0.142 | 0.000 | 0.000 | 0.039 | 0.221 | 0.452 | 0.581 | 0.858 | 0.202 | 58.03 |
| LUND | 0.078 | 0.000 | 0.000 | 0.000 | 0.045 | 0.301 | 0.501 | 0.918 | 0.184 | 31.95 |
| DEB | 0.007 | 0.000 | 0.000 | 0.000 | 0.000 | 0.000 | 0.000 | 0.295 | 0.048 | 4.11 |
| OLD | 0.127 | 0.000 | 0.001 | 0.054 | 0.162 | 0.350 | 0.538 | 1.000 | 0.191 | 75.85 |
| Variables | Mean | SD | Percentiles | Skewness | Kurtosis | ||||
|---|---|---|---|---|---|---|---|---|---|
| 10th | 25th | 50th | 75th | 90th | |||||
| Debt Specialization | |||||||||
| HHI | 0.438 | 0.266 | 0.158 | 0.233 | 0.368 | 0.564 | 0.931 | 0.858 | 1.654 |
| i. Liquidity | |||||||||
| CH | 0.057 | 0.111 | 0.001 | 0.004 | 0.013 | 0.053 | 0.163 | 0.170 | −0.878 |
| CR | 1.096 | 0.485 | 0.550 | 0.850 | 1.030 | 1.270 | 1.700 | 1.063 | 1.498 |
| ii. Profitability | |||||||||
| GMR | 0.013 | 0.924 | −0.348 | 0.013 | 0.047 | 0.112 | 0.349 | 1.628 | 1.921 |
| EBITDA | −0.038 | 1.210 | −0.271 | −0.023 | 0.027 | 0.890 | 0.218 | 0.957 | 1.297 |
| NPR | −0.057 | 1.243 | −0.418 | −0.082 | 0.004 | 0.070 | 0.196 | 1.880 | 1.729 |
| iii. Leverage | |||||||||
| FL | 0.515 | 0.238 | 0.175 | 0.337 | 0.534 | 0.696 | 0.814 | −0.215 | −0.735 |
| ML | 0.635 | 0.283 | 0.187 | 0.417 | 0.698 | 0.882 | 0.959 | −0.576 | −0.848 |
| LDA | 0.197 | 0.202 | 0.006 | 0.039 | 0.135 | 0.287 | 0.471 | 1.459 | 2.007 |
| iv. Nature of Assets | |||||||||
| AT | 0.695 | 0.215 | 0.373 | 0.590 | 0.749 | 0.853 | 0.920 | −1.078 | 0.767 |
| TATR | 1.641 | 1.243 | 0.236 | 0.790 | 1.192 | 1.584 | 1.784 | 2.008 | 1.854 |
| v. Risk | |||||||||
| EV | 0.288 | 0.135 | 0.160 | 0.200 | 0.260 | 0.340 | 0.450 | 1.613 | 3.658 |
| DR | 1.274 | 1.333 | −0.337 | 0.432 | 1.232 | 2.137 | 2.978 | −0.064 | 0.159 |
| ROAV | 0.027 | 0.138 | −0.092 | −0.025 | 0.023 | 0.079 | 0.156 | −0.538 | 1.475 |
| vi. Growth | |||||||||
| AG | 0.037 | 0.235 | −0.148 | −0.045 | 0.030 | 0.134 | 0.258 | −1.211 | 1.460 |
| RG | 0.064 | 0.359 | −0.364 | −0.105 | 0.063 | 0.237 | 0.473 | 0.071 | 1.613 |
| EG | 0.306 | 1.939 | −1.372 | −0.233 | 0.238 | 0.854 | 1.984 | 0.151 | 1.333 |
| vii. Controlling Authority | |||||||||
| BGA | 0.572 | 0.495 | 0.000 | 0.000 | 1.000 | 1.000 | 1.000 | −0.292 | −1.916 |
| viii. Market | |||||||||
| Size | 3.361 | 0.867 | 2.328 | 2.867 | 3.403 | 3.942 | 4.408 | −0.564 | 1.759 |
| Age | 21.853 | 7.516 | 9.000 | 19.000 | 23.000 | 27.000 | 30.000 | −0.975 | 0.450 |
| MBR | 0.811 | 0.551 | 0.020 | 0.420 | 0.770 | 1.140 | 1.560 | 0.558 | −0.032 |
| ix. Expense | |||||||||
| Dep. | 0.080 | 0.124 | 0.016 | 0.036 | 0.059 | 0.090 | 0.120 | 1.129 | 1.635 |
| OER | 0.146 | 0.234 | 0.022 | 0.038 | 0.065 | 0.159 | 0.325 | 0.903 | 0.903 |
| TR | 0.159 | 0.324 | −0.090 | 0.000 | 0.140 | 0.319 | 0.467 | 0.126 | 1.897 |
| x. Debt Market | |||||||||
| Rating | 0.163 | 0.462 | 0.000 | 0.000 | 0.000 | 0.000 | 1.000 | 0.402 | 0.787 |
| FR | 0.072 | 0.161 | 0.004 | 0.008 | 0.030 | 0.062 | 0.139 | 1.211 | 2.031 |
| ICR | 0.033 | 0.019 | 0.019 | 0.020 | 0.029 | 0.033 | 0.076 | 1.697 | 1.404 |
| xi. Stock Market | |||||||||
| DP | 0.455 | 0.498 | 0.000 | 0.000 | 0.000 | 1.000 | 1.000 | 0.182 | −1.968 |
| DPR | 0.119 | 0.251 | 0.000 | 0.000 | 0.000 | 0.144 | 0.460 | 1.888 | 1.549 |
| DY | 0.038 | 0.107 | 0.000 | 0.000 | 0.000 | 0.033 | 0.093 | 1.155 | 1.424 |
| xii. Industry | |||||||||
| Reg. | 0.206 | 0.404 | 0.000 | 0.000 | 0.000 | 0.000 | 1.000 | 1.457 | 0.122 |
| MIFL | 0.666 | 0.181 | 0.420 | 0.554 | 0.692 | 0.812 | 0.888 | −0.742 | 0.246 |
| MIML | 0.583 | 0.100 | 0.453 | 0.519 | 0.592 | 0.666 | 0.708 | −0.443 | −0.121 |
| MILDA | 0.140 | 0.077 | 0.044 | 0.074 | 0.147 | 0.184 | 0.240 | 0.390 | 0.468 |
| MIAG | 0.058 | 0.459 | −0.034 | −0.076 | 0.026 | 0.217 | 0.249 | −1.245 | 1.978 |
| MIRG | 0.079 | 0.146 | −0.106 | 0.000 | 0.068 | 0.138 | 0.264 | 0.077 | 1.565 |
| MIEG | 0.326 | 1.521 | −1.245 | −0.658 | 0.163 | 0.532 | 1.875 | 1.114 | 1.840 |
| xiii. Macroeconomic | |||||||||
| GB | 0.008 | 0.004 | 0.006 | 0.007 | 0.007 | 0.008 | 0.010 | 1.120 | 2.931 |
| EIR | 0.086 | 0.032 | 0.025 | 0.067 | 0.088 | 0.120 | 0.122 | −0.569 | −0.529 |
| GDPG | 0.147 | 0.058 | 0.092 | 0.097 | 0.124 | 0.229 | 0.241 | 0.787 | −1.148 |
| Variables | Correlation | 1st Quartile | 4th Quartile | Test of Differences | |||
|---|---|---|---|---|---|---|---|
| Mean | Median | Mean | Median | t-Test | Wilcoxon Test | ||
| CH | 0.285 *** | 0.035 | 0.009 | 0.106 | 0.036 | −10.434 *** | −9.671 *** |
| CR | 0.0282 *** | 1.054 | 0.958 | 2.011 | 1.447 | −12.448 *** | −11.180 *** |
| GMR | 0.050 ** | 0.022 | 0.163 | 0.042 | 0.233 | −2.271 ** | −4.111 *** |
| EBITDA | 0.002 * | −0.059 | 1.098 | −0.053 | 1.554 | −0.105 | −5.186 *** |
| NPR | 0.037 * | −0.067 | −0.008 | 0.041 | 0.024 | −1.544 | −5.664 *** |
| FL | −0.301 *** | 0.587 | 0.607 | 0.405 | 0.375 | 15.002 *** | −14.061 *** |
| ML | −0.329 *** | 0.737 | 0.817 | 0.499 | 0.52 | 16.303 *** | −14.309 *** |
| LDA | −0.314 *** | 0.299 | 0.259 | 0.111 | 0.02 | 18.559 *** | −23.071 *** |
| AT | −0.331 *** | 0.778 | 0.814 | 0.594 | 0.621 | 15.938 *** | −13.693 *** |
| TATR | 0.251 *** | 2.505 | 3.808 | 6.537 | 11.727 | −9.465 *** | −6.745 *** |
| EV | 0.179 *** | 0.081 | 0.065 | 0.128 | 0.079 | −7.593 *** | −5.689 **** |
| DR | 0.084 *** | 1.16 | 1.052 | 1.463 | 1.506 | −4.208 *** | −4.723 *** |
| ROAV | 0.074 *** | 0.022 | 0.022 | 0.045 | 0.03 | −2.957 *** | −3.040 *** |
| AG | −0.045 ** | 0.046 | 0.032 | 0.024 | 0.014 | 1.667 * | −1.734 * |
| RG | −0.129 *** | 0.127 | 0.12 | 0.004 | 0.023 | 6.412 *** | −6.741 *** |
| EG | −0.038** | 0.387 | 0.382 | 0.197 | 0.156 | 1.884 * | −3.112 *** |
| BGA | −0.104 *** | 0.624 | 1.000 | 0.499 | 0.000 | 4.778 *** | −4.741 *** |
| Size | −0.221 *** | 3.479 | 3.405 | 3.073 | 3.141 | 8.231 *** | −6.889 *** |
| Age | 0.073 *** | 25.843 | 23.000 | 29.689 | 26.000 | −4.890 *** | −4.467 *** |
| MBR | 0.069 *** | 0.770 | 0.478 | 1.007 | 0.740 | −3.506 *** | −3.689 *** |
| Dep. | 0.080 *** | 0.063 | 0.052 | 0.091 | 0.063 | −4.542 *** | −3.722 *** |
| OER | 0.157 *** | 0.102 | 0.051 | 0.191 | 0.092 | −7.266 *** | −7.583 *** |
| TR | 0.038 ** | 0.142 | 0.113 | 0.184 | 0.173 | −2.482 ** | −3.003 *** |
| Rating | −0.014 | 0.189 | 0.000 | 0.150 | 0.000 | 1.37 | −3.939 *** |
| FR | −0.088 *** | 0.083 | 0.044 | 0.051 | 0.006 | 4.112 *** | −18.405 *** |
| ICR | −0.104 *** | 0.035 | 0.030 | 0.030 | 0.022 | 5.502 *** | −9.263 *** |
| DP | 0.068 *** | 0.384 | 0.000 | 0.503 | 1.000 | −4.497 *** | −4.466 *** |
| DPR | 0.154 *** | 0.068 | 0.000 | 0.174 | 0.000 | −8.048 *** | −6.407 *** |
| DY | 0.021 | 0.036 | 0.000 | 0.042 | 0.001 | −1.113 | −4.481 *** |
| Reg. | 0.171 *** | 0.123 | 0.000 | 0.289 | 0.000 | −7.862 *** | −7.513 *** |
| MIFL | −0.208 *** | 0.61 | 0.635 | 0.553 | 0.539 | 11.026 *** | −10.771 *** |
| MIML | −0.234 *** | 0.721 | 0.772 | 0.601 | 0.615 | 13.071 *** | −12.808 *** |
| MILDA | −0.360 *** | 0.175 | 0.173 | 0.101 | 0.089 | 18.979 *** | −17.294 *** |
| MIAG | 0.143 *** | 0.697 | 0.502 | 0.866 | 0.595 | −7.064 *** | −7.571 *** |
| MIRG | −0.097 *** | 0.104 | 0.110 | 0.060 | 0.059 | 5.452 *** | −6.718 *** |
| MIEG | −0.027 | 0.083 | 0.145 | 0.073 | 0.135 | 1.604 | −1.176 |
| GB | −0.085 *** | 0.008 | 0.008 | 0.007 | 0.007 | 3.140 *** | −8.241 *** |
| EIR | −0.179 *** | 0.094 | 0.106 | 0.078 | 0.071 | 9.941 *** | −9.568 *** |
| GDPG | −0.092 *** | 0.155 | 0.126 | 0.14 | 0.124 | 4.876 *** | −5.875 *** |
| Variables | Category | N | Mean | SD | t-Test | Wilcoxon Test |
|---|---|---|---|---|---|---|
| Credit Rating | Unrated | 940 | 0.233 | 0.356 | 0.243 | 0.219 |
| Rated | 876 | 0.292 | 0.381 | |||
| Business Group Affiliation | Affiliated | 727 | 0.367 | 0.315 | 5.751 *** | −5.354 *** |
| Unaffiliated | 1089 | 0.406 | 0.306 | |||
| Dividend Payments | Not Paying | 817 | 0.415 | 0.282 | −2.861 | −3.105 *** |
| Paying | 999 | 0.483 | 0.270 | |||
| Regulation | Non-Regulated | 1435 | 0.318 | 0.339 | −4.091 *** | −4.206 *** |
| Regulated | 381 | 0.397 | 0.391 | |||
| Size | Small | 569 | 2.436 | 0.373 | 6.359 *** | −5.569 ** |
| Large | 685 | 4.284 | 0.284 | |||
| Age | New | 692 | 12.201 | 0.239 | −2.350 ** | −1.568 |
| Old | 436 | 30.506 | 0.274 |
| Factors | Coefficient | t-Statistics |
|---|---|---|
| (1) | (2) | |
| CH | 0.187 | 3.714 |
| CR | 0.031 | 8.746 |
| FL | −0.092 | −4.340 |
| ML | −0.121 | −4.930 |
| AT | −119 | −5.781 |
| TATR | 0.009 | 9.120 |
| EV | 0.136 | 3.125 |
| DR | −0.0082 | −7.999 |
| Size | −0.072 | −11.924 |
| OER | 0.165 | 6.041 |
| GPM | 0.092 | 3.581 |
| FR | −0.162 | −5.821 |
| Reg | 0.062 | 5.761 |
| MILDA | −0.724 | −10.935 |
| EIR | −0.901 | −5.992 |
| Rating | 0.021 | 3.652 |
| Age | 0.219 | 4.492 |
| Constant | 0.918 | 27.621 |
| No. of obs. | 2795 | |
| R2 | 0.495 | |
| Adj. R2 | 0.432 |
| Factors | Coefficient | t-Statistics | Own R2 | Cumulative R2 | BIC | Group Positive (%) | Group Negative (%) | Year Positive (%) | Year Negative (%) |
|---|---|---|---|---|---|---|---|---|---|
| (1) | (2) | (3) | (4) | (5) | (6) | (7) | (8) | (9) | |
| Size | −0.0591 | −8.465 | 0.129 | 0.129 | −998.565 | 0 | 100 | 0 | 100 |
| GMR | −0.381 | −7.211 | 0.092 | 0.221 | −984.854 | 0 | 90 | 0 | 100 |
| MILDA | −0.892 | −6.152 | 0.072 | 0.293 | −929.546 | 0 | 90 | 0 | 100 |
| LDA | −0.223 | −8.564 | 0.057 | 0.350 | −843.073 | 0 | 90 | 0 | 71 |
| FR | −0.206 | −6.754 | 0.007 | 0.357 | −824.207 | 0 | 40 | 0 | 86 |
| AT | −0.161 | −5.328 | 0.052 | 0.409 | −893.589 | 0 | 60 | 0 | 100 |
| ML | −0.172 | −6.545 | 0.008 | 0.417 | −765.613 | 0 | 80 | 0 | 14 |
| FL | −0.205 | −8.651 | 0.009 | 0.426 | −731.439 | 0 | 40 | 0 | 71 |
| DPR | 0.059 | 3.421 | 0.001 | 0.427 | −714.848 | 70 | 0 | 57 | 0 |
| Age | 0.001 | 4.781 | 0.045 | 0.472 | −912.039 | 100 | 0 | 71 | 0 |
| TR | −0.005 | −0.495 | 0.002 | 0.474 | −814.450 | 0 | 50 | 0 | 29 |
| NPR | −0.004 | −0.924 | 0.001 | 0.475 | −821.884 | 0 | 80 | 0 | 43 |
| Reg. | 0.066 | 5.734 | 0.003 | 0.478 | −821.021 | 90 | 0 | 100 | 0 |
| RG | −0.054 | −3.961 | 0.002 | 0.480 | −813.561 | 0 | 100 | 0 | 86 |
| EBITDA | −0.024 | −0.751 | 0.003 | 0.483 | −811.565 | 0 | 40 | 0 | 57 |
| DR | −0.017 | −3.821 | 0.001 | 0.483 | −810.565 | 0 | 10 | 0 | 43 |
| EG | −0.001 | −0.341 | 0.001 | 0.484 | −808.552 | 0 | 40 | 0 | 71 |
| GB | −4.729 | −3.431 | 0.007 | 0.491 | −804.494 | 0 | 70 | NA | NA |
| EIR | −1.206 | −5.351 | 0.002 | 0.493 | −802.101 | 0 | 90 | 0 | 14 |
| DY | −0.072 | −0.981 | 0.000 | 0.493 | −800.417 | 0 | 90 | 0 | 43 |
| MIAG | 0.036 | 6.542 | 0.009 | 0.502 | −789.192 | 90 | 0 | 43 | 0 |
| Rating | −0.008 | −1.740 | 0.000 | 0.502 | −764.315 | 0 | 90 | 0 | 14 |
| AG | −0.042 | −2.040 | 0.002 | 0.504 | −755.196 | 0 | 100 | 0 | 43 |
| ROAV | −0.135 | −2.040 | 0.000 | 0.504 | −689.931 | 0 | 90 | 0 | 43 |
| DP | −2.920 | −0.127 | 0.000 | 0.504 | −688.454 | 0 | 100 | 0 | 47 |
| MBR | −0.016 | −3.561 | 0.001 | 0.505 | −687.246 | 0 | 90 | 0 | 57 |
| Dep. | −0.121 | −3.015 | 0.001 | 0.506 | −679.251 | 0 | 45 | 0 | 71 |
| MIEG | −0.016 | −2.125 | 0.000 | 0.506 | −679.112 | 0 | 45 | 0 | 21 |
| MIFL | −0.328 | −1.998 | 0.002 | 0.508 | −676.558 | 0 | 100 | 0 | 29 |
| ICR | −1.210 | −3.279 | 0.001 | 0.509 | −674.725 | 0 | 100 | NA | NA |
| BGA | −0.034 | −2.485 | 0.001 | 0.511 | −658.603 | 0 | 90 | 0 | 71 |
| MIRG | −0.091 | −2.974 | 0.001 | 0.512 | −654.905 | 0 | 80 | 0 | 29 |
| GDPG | −0.312 | −3.054 | 0.001 | 0.513 | −635.376 | 0 | 90 | 0 | 57 |
| MIML | −0.236 | −2.746 | 0.000 | 0.513 | −633.428 | 0 | 100 | 0 | 43 |
| CH | 0.472 | 7.854 | 0.002 | 0.515 | −624.265 | 27 | 0 | 0 | 0 |
| EV | 0.421 | 7.542 | 0.003 | 0.518 | −621.875 | 21 | 0 | 0 | 0 |
| OER | 0.230 | 8.125 | 0.003 | 0.520 | −610.455 | 10 | 0 | 0 | 0 |
| TATR | 0.009 | 6.451 | 0.001 | 0.521 | −604.746 | 7 | 0 | 0 | 0 |
| CR | 0.049 | 1.754 | 0.001 | 0.522 | −604.554 | 2 | 0 | 0 | 0 |
Publisher’s Note: MDPI stays neutral with regard to jurisdictional claims in published maps and institutional affiliations. |
© 2021 by the authors. Licensee MDPI, Basel, Switzerland. This article is an open access article distributed under the terms and conditions of the Creative Commons Attribution (CC BY) license (https://creativecommons.org/licenses/by/4.0/).
Share and Cite
Khan, K.I.; Qadeer, F.; Mata, M.N.; Chavaglia Neto, J.; Sabir, Q.u.A.; Martins, J.N.; Filipe, J.A. Core Predictors of Debt Specialization: A New Insight to Optimal Capital Structure. Mathematics 2021, 9, 975. https://doi.org/10.3390/math9090975
Khan KI, Qadeer F, Mata MN, Chavaglia Neto J, Sabir QuA, Martins JN, Filipe JA. Core Predictors of Debt Specialization: A New Insight to Optimal Capital Structure. Mathematics. 2021; 9(9):975. https://doi.org/10.3390/math9090975
Chicago/Turabian StyleKhan, Kanwal Iqbal, Faisal Qadeer, Mário Nuno Mata, José Chavaglia Neto, Qurat ul An Sabir, Jéssica Nunes Martins, and José António Filipe. 2021. "Core Predictors of Debt Specialization: A New Insight to Optimal Capital Structure" Mathematics 9, no. 9: 975. https://doi.org/10.3390/math9090975
APA StyleKhan, K. I., Qadeer, F., Mata, M. N., Chavaglia Neto, J., Sabir, Q. u. A., Martins, J. N., & Filipe, J. A. (2021). Core Predictors of Debt Specialization: A New Insight to Optimal Capital Structure. Mathematics, 9(9), 975. https://doi.org/10.3390/math9090975