Article

Transfer of Risk in Supply Chain Management with Joint Pricing and Inventory Decision Considering Shortages

by
Irfanullah Khan
1,† and
Biswajit Sarkar
2,*,†
1
Department of Industrial & Management Engineering, Hanyang University, Ansan 15588, Korea
2
Department of Industrial Engineering, Yonsei University, 50 Yonsei-ro, Sinchon-dong, Seodaemun-gu, Seoul 03722, Korea
*
Author to whom correspondence should be addressed.
These authors contributed equally to this work.
Mathematics 2021, 9(6), 638; https://doi.org/10.3390/math9060638
Submission received: 25 January 2021 / Revised: 9 March 2021 / Accepted: 11 March 2021 / Published: 17 March 2021

Abstract

:
This study is the first to consider a distribution-free approach in a newsvendor model with a transfer of risk and back-ordering. Previously, in many articles, discrete demand is considered. In this model, we consider a newsvendor selling a single seasonal item with price-dependent stochastic demand. Competition in markets has forced the retailer and manufacturer to coordinate in decentralized supply chain management. A coordination contract is made between a retailer and manufacturer to overcome the randomness of demand for a short-life-cycle product. The retailer pays an additional amount per product to transfer the risk of unsold items. The manufacturer bears the cost of unsold products from the retailer. Shortages are allowed with back-ordering costs during the season. The distribution-free model is developed and solved with only available demand data of mean and standard deviation. Stackelberg’s game approach is used to calculate the optimal ordering quality and price. This model aims to maximize expected profit by optimizing unit selling price and ordered quantity through coordination. To illustrate that the model is robust, numerical experiment and sensitivity analyses are conducted for both decentralized and centralized supply chain management. For applicability of the model in the real-world business scenario, managerial insights are provided with sensitivity analysis.

1. Introduction

Recent advances in technology have accelerated product development. As soon as a new product comes to the market, the old product becomes obsolete. The newsvendor model is most suitable to deal with such short-life products. The newsvendor model has various applications in the volatile product market (Khouja [1]; Dai and Meng [2]). These applications include, but are not limited to, mobile phones, personal computers, toys, books, electronic items, fashion apparel, fast-moving consumer goods, and other perishable products. Application of the newsvendor model also lies in healthcare financing schemes and insurance policies (Rosenfield [3]; Eeckhoudt et al. [4]). In most newsvendor models, price is assumed as constant. However, in reality, the price fluctuates with the demand.
In the present business scenario, the firms are facing volatile demand. The demand uncertainty sometimes causes loss in sales or extra quantity has to be salvaged. The inventory manager has to place the order before the selling season starts with a single opportunity and no additional replenishment opportunity in the season. The product he is dealing with is of a nature that becomes obsolete rapidly. The situation may become difficult for the retailer in the case of a special promotion. He faces the problem of overstocking or understocking. In the first scenario, he has to salvage the remaining stock or pay the holding cost. In the second scenario, he may lose potential profit by not satisfying customer demand.
In this paper, a real option contract is introduced to the newsvendor model for supply chain expected profit maximization. We have developed a coordination policy to enhance the performance of the decentralized supply chain. The retailer pays the contract fee per product to reduce the risk associated with the product being salvaged. The risk of product obsoleteness is transferred to the manufacturer in the form of salvage value. If excess demand occurs, the product can be back-ordered with a back-ordering price. The manufacturer earns more profit from the contract price; however, he may lose profit as salvage value. The newsvendor places the order based on historical data that possesses a high variance in demand. By introducing the real option contract, variance in the order could be reduced for the retailer, whereas in the traditional newsvendor model, all the risk is borne by the retailer.
Initially, quantity is purchased at a regular wholesale price in the newsvendor model. If the ordered quantity is less than the realized demand, then the remaining items are purchased with the emergency back-ordering price. The emergency back-ordering price is usually high, depending on the different plans offered in this model. If observed demand during the season is lower than the ordered quantity, then remaining items are salvaged at a lower price compared with the regular price. For essential commodities, shortages may have a severe impact on supply chain management. The reasons behind shortages may be the unavailability of raw material or other issues that interrupt the production process. Due to shortages, the company may face a loss of demand that will reduce the market share. After demand realization, newsvendor faces penalties in case of shortages.
This paper fulfills the research gap within the transfer of risk model in a supply chain where in almost all existing literature, the transfer of risk model is studied with specific demand distribution. Estimating the probability distribution of demand is difficult and costly because it requires all the actual demand data within a specific time frame with exact means and standard deviations. In order to overcome the difficulty in collecting data and saving funds, this study does not consider any specific probability distribution of demand. The distribution-free (DF) approach is utilized to solve the model with only the mean and variance of demand. Price-dependent stochastic demand is considered, where the objective is to maximize the profit, which has to be achieved by optimizing price and ordered quantity. The supply chain model is analyzed as a centralized and a decentralized entity. Furthermore, we apply the Stackelberg game approach in the decentralized supply chain, where the manufacturer and the retailer are considered two players. Two cases are assumed for the Stackelberg game. In the first case, the manufacturer is a Stackelberg leader and the retailer is a follower. In the second case, the retailer acts as a leader and the manufacturer as a follower.

2. Literature Review

The newsboy problem started by the economist Edgeworth [5], he applied the model to the variant bank cash-flow problem. However, there was slow progress before the article of Arrow et al. [6]. The newsvendor model gained much attention after the two best review papers in the field were presented by Petruzzi and Dada [7] and Khouja [1]. Khouja’s [1] paper classifies the Newsvendor problem and outlined the contribution of the previous papers. Sarkar et al. [8] applied the DF approach for developing the consignment policy in a newsvendor model. He also suggested future extensions of the problem in various directions. He and Wang [9] studied vendor/buyer decision making in the newsvendor model within an uncertain unit profit environment and found that the consumer inventory decisions are enhanced by demand uncertainty. Sana [10] dealt with green and nongreen products in the newsvendor scenario where demand was subjected to selling price, amount of carbon emissions, and corporate social responsibility.
Demand distribution pattern estimation is a challenging and time-consuming job for manufacturers under uncertain environments before the selling season starts. Demand uncertainty is the toughest thing to deal with in the newsvendor model. Specific probability distributions are considered (e.g., uniform or normal) in many models. Huge funds are invested into demand probability distribution calculation. To save time and money, the DF approach is a suitable method. Scarf [11] first introduced the DF approach. To solve the newsboy model with Scarf’s procedure, only the mean and variance of the demand are required. Furthermore, he showed that the worst demand distribution is positive in two points. However, the Scarf model was hard to understand for managers. Gallego and Moon [12] came up with a simplified approach to solve the model compared to Scarf’s [11] compact rule. The DF approach is used when the demand pattern does not follow any particular demand distribution. Sarkar et al. [8] utilized a DF approach in a newsvendor model by using the consignment contract for the retailer cost reduction. The multilocation newsvendor network was studied by Govindarajan et al. [13] utilizing the DF approach. This is the first paper to study the transfer of risk by applying the DF approach with back-orders.
In many cases, demand data is not available to the manager and is gained through a sequence of operations. There is immense literature for such instances with partial information where operational efficiency, market parameters, or demand are considered as exogenous while minimizing the expected cost. Moon and Choi [14] applied the DF approach to the continuous inventory problem with a service level constraint. Liao et al. [15] developed a newsvendor model with a lost sales penalty and balking with the DF procedure. Raza [16] studied the newsvendor model from a pricing perspective with a DF approach. Furthermore, he extends the model to holding and shortage cases. Sarkar et al. [17] further extend Moon and Choi’s [14] model with quality improvement and setup cost reduction. Moon et al. [18] compared the normal distribution and DF approach within four scenarios with only available mean and variance of demand data. These scenarios were multiple discounts, multiple upgrades, multiple discounts and upgrades, and the final extension is capacity and budget constraint. Castellano et al. [19] applied the DF approach to the single-vendor multibuyer integrated inventory model lead time is considered controllable in their model with a back-order lost sales mixture. They adopted a periodic review policy and derived the long-run expected cost per unit time with stock-out costs. Govindarajan et al. [13] studied a multilocation networking newsvendor problem with a DF approach.
It is assumed in the traditional newsboy model that the entire unsatisfied customer demand is lost during the selling season. However, some unsatisfied customers wait for the replenishments, while other customers are lost. In this model, the customers willing to wait are satisfied with back-orders. An additional profit is gained by the newsvendor while satisfying the excess demand of the customer otherwise lost. Therefore, the newsvendor in inventory stock-out situations always encourage the customer to accept the back-orders. Guchhait et al. [20] investigated optimum distance between two radio frequency identification readers in a vendor-managed inventory to optimize the profit of unreliable supply chain management. The Loss-averse newsvendor model was developed by Xu et al. [21] with back-ordering. Expected utility was maximized with the optimal ordering quantity calculation to overcome the risk occurring from fluctuations in the market; demand conditional value at risk was also introduced in their model. Khan et al. [22] implied a service level constraint to meet the shortages. The impact of random defective rate is studied by Sarkar et al. [23] in an imperfect production system with multiple products. They consider a planned back-order for a single-stage production system. Taleizadeh et al. [24] developed the vendor-managed inventory system and discussed the replenishment policies and lost sales with back-ordering.
Kouvelis and Zhao [25] analyzed a newsvendor problem with the price-only contract, where bankruptcy cost exists under the Stackelberg approach. Ghosh and Shah [26] developed a model considering product greening in an apparel supply chain with Stackelberg and Nash game-theoretic approaches. They show the impact of greening level, price, and profit influenced by the supply chain structure. A DF procedure is implied in a newsvendor model by Sarkar et al. [8] with consignment policy and retailer’s royalty reduction, under the Stackelberg gaming approach. Khan et al. [22] constructed a supply chain model where they used the Stackelberg approach in a decentralized supply chain. They compared the centralized and decentralized supply chain policy effect on the expected total cost. Guchhait et al. [27] used the DF approach in a dual-channel supply chain model to control product quality, and a buyback contract is used to reduce lost sales. The model is analyzed in a centralized way, and the Stackelberg approach is utilized in a decentralized supply chain. Hovelaque et al. [28] used the Stackelberg game-theoretic approach to study the working capital impact on retailer borrowing decision in a noncooperative game with price-sensitive demand. Their analysis was dependent on a model with a retailer, a supplier, and a bank. They calculated the ordered quantity, the wholesale price, and the interest rate. Wu et al. [29] presents a model with a risk-averse retailer and a supplier who offers a loss-sharing and trade credit under the supplier Stackelberg game. The decision variables in their model are the order quantity and loss sharing. Furthermore, a comparison is performed without loss sharing and trade credit. Stackelberg’s game-theoretic approach is implied in Yadav et al. [30], considering a two-level supply chain with imperfect quality items and shortages. Fan et al. [31] studied the application of an option contract with the Stackelberg approach in the risk-averse model. Furthermore, they investigated the effect of option price and option exercise price via conditional value-at-risk minimization.
Impact of sales on perishable products was analyzed by Afshar-Nadjafi [32] in the newsvendor model, he considered deterministic expiry dates with probabilistic demand in the selling period. The effects of product quality, pricing, and promotional efforts was studied by Olbrich et al. [33] on national brand performance and private labels. He and Lu [34] investigated the price-setting problem, considering both multiplicative and additive demand patterns. The performances of three discount contracts (Push, Pull, and advance purchasing) were analyzed by He and Khouja [35] in a manufacturer retailer model. A logistic system was analyzed with a buyer and supplier by Kim and Jeong [36] to calculate the order up to the level at the beginning of the selling season. Furthermore, both parties received the benefits of coordination and cost minimization policy. Sarkar et al. [37] studied replenishment rate of a retailer with demand dependent on selling price and trade credit for deteriorating products. The discrete demand in the newsvendor model was considered by Jörnsten et al. [38] with a real option contract and a mixed contract. Park et al. [39] considered the replenishment problem with minimum order size requirements having multiple items for single buyers and many heterogeneous suppliers. Sarkar et al. [40] proposed an online-to-offline retailing strategy with selling-price-dependent demand and utilized the DF approach. Noh et al. [41] formed a contract for the supplier to offer the quantity discount to the buyer on a certain amount of quantity at the beginning of the season. Maihami et al. [42] studied the pricing and inventory control problem, where the demand is price and greening-level-dependent with noninstantaneous deteriorating items. Moreover, they considered backlogged shortages with greening programs.
In the literature, the option contract is considered with the discrete demand or continuous demand. This paper is the first to study the option contract with a DF approach in the newsvendor model. The Stackelberg gaming approach is used, and we have considered the shortages in the model with the price-dependent stochastic demand. In this model, various emergency replenishment problems are designed to back-order the inventory. To show the literature related to this work, Table 1 is presented with relevant keywords.

3. Model Description and Preliminaries

3.1. Problem Definition

In the newsvendor-type model, the retailer has limited resources and cannot bear the loss of those products leftover after the selling season. The manufacturer is resourceful in most cases. Therefore, sometimes leftover stocks from one retailer could further be passed to another retailer with some demand. In this model, a contract is offered to the retailer for those items that remain after the selling season; the manufacturer will bear the loss as a salvage value. The retailer has to pay a certain amount per product to the manufacturer to reduce the risk associated with leftover items. The agreement is made with mutual understanding before the selling season starts. Shortages are allowed in this model and can be fulfilled with a back-ordering price, which is higher than the original price because of the extra efforts made in order fulfillment. The DF approach is used in this model. The price-dependent stochastic demand is considered with joint pricing and stocking decision.

3.2. Assumptions

To understand the model deeply and to address the limitation of the study, the following assumptions are made:
  • A single-period newsvendor model is considered with a single product. The product is assumed to be a seasonal or fashionable product.
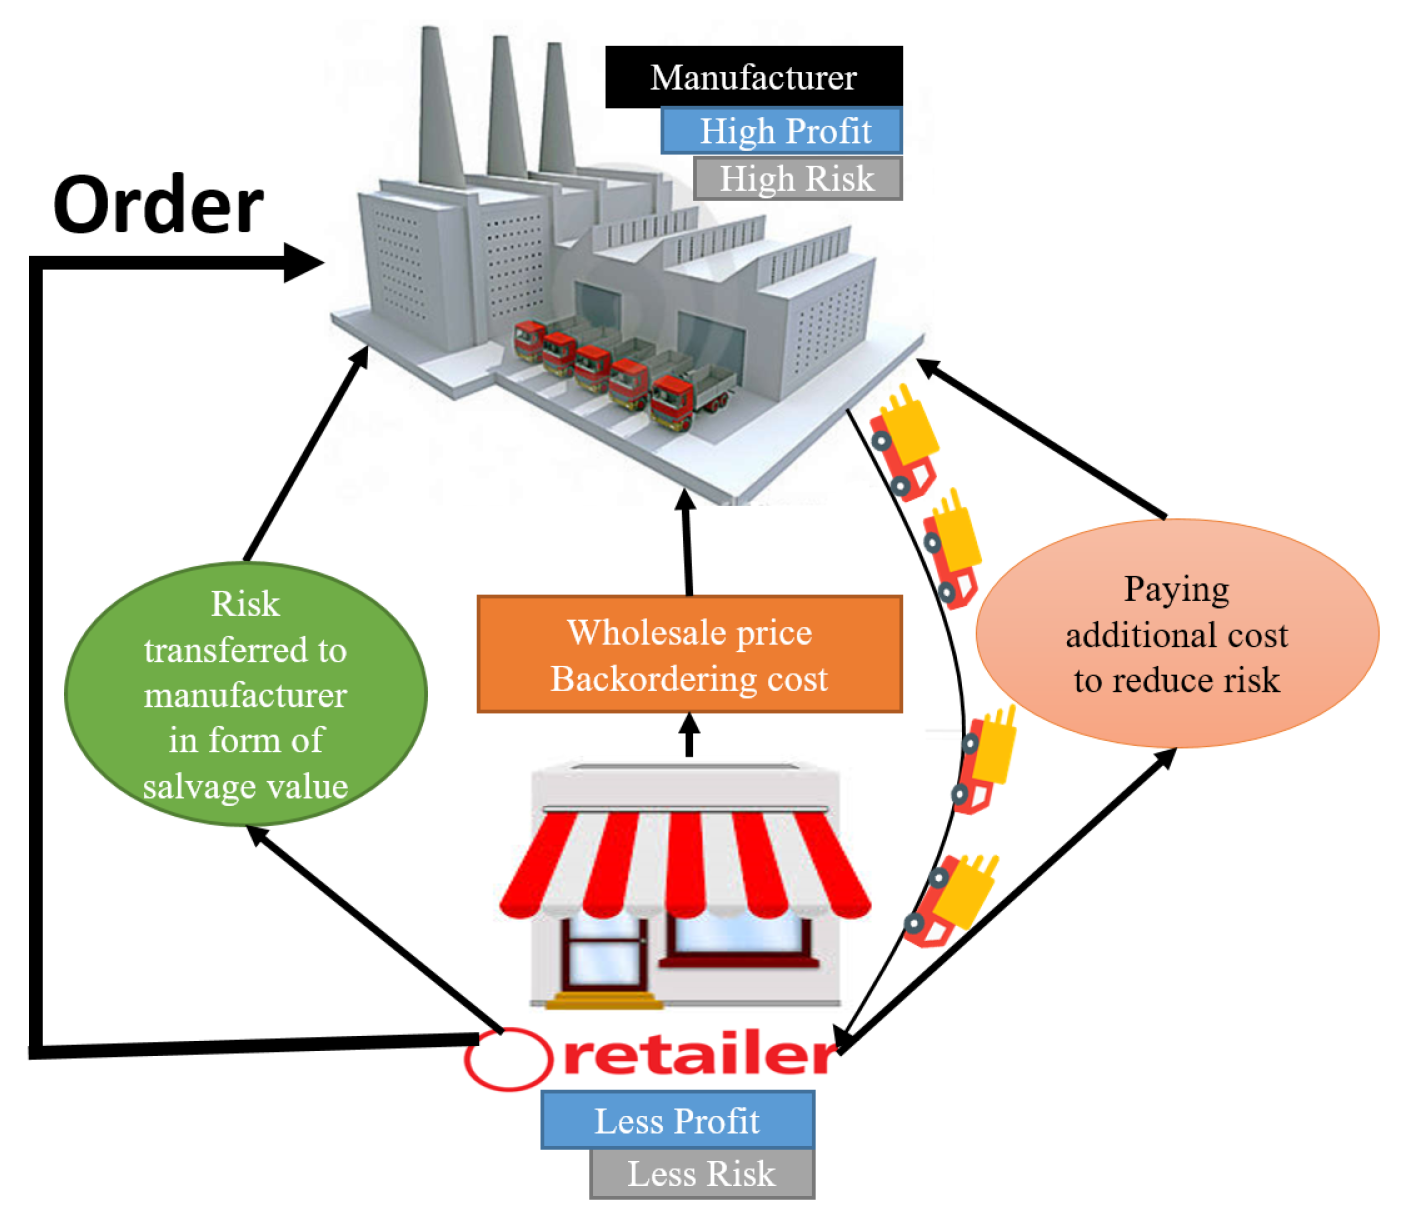
  • A newsvendor model is considered. The fixed manufacturing cost M is incurred by the manufacturer and they decide the wholesale price W. The exogenous price R is faced by the retailer, who determines the ordered quantity Q. The remaining items during the season are salvaged at a constant vale S.
  • In the traditional newsboy model, random demand D is faced by the retailer, who orders a specific quantity from the manufacturer. To earn a profit, they expect to sell all products.
  • In the transfer of risk model, the retailer can select a contract that permits them to buy a product at a certain time in the future. Each contract price for the retailer is c. The retailer has the right to purchase a single item at a fixed price of t, which is not essential. A contract is selected before the selling season starts.
  • Stochastic demand is considered without any specific probability distribution. Demand distribution underlies a class of probability distributions function. The only available data is the mean and variance of demand.
  • Shortages are allowed in this model and can be fulfilled with a back-ordering price that is high compare to the wholesale price.

4. Mathematical Model

This classical newsvendor model and the newsvendor with transfer of risk models are expressed in this section.

4.1. The Emergency Back-Ordering Options

To meet excess demand, an emergency replenishment policy is employed. All or partial excess demand is satisfied by different emergency schemes to overcome the stock-out situation, which could affect the market share or profit and customer goodwill. Before the selling season starts, the newsvendor should make a contract of Q items and an emergency replenishment plan S = { s 1 , s 2 , , s n } from the set of n available contingency schemes.
Every scheme consists of the time coefficient k i ϵ K = { k 1 , k 2 , , k n } that has a back-ordering cost per unit b i ϵ b = { b 1 , b 2 , , b n } . That cost is the per-unit price the customer agrees to pay as a contingency plan s i , which reduces the emergency supply by the time coefficient k i , where the value of k i lies in the range of 0 < k i < 1 . From that relation, it is clear that the back-ordering cost per unit will increase if the lead time is reduced, which the newsvendor has to pay for an emergency replenishment scheme.
In this model, b is the decreasing function of τ . The following exponential form equation from Lee and Lodree, Jr. [44] shows the back-ordering function of demand in Equation (1).
β ( τ ) = e α τ .
The parameter α can be obtained statistically from the historical correlated data by newsvendor. To obtain the generalized understanding of b as a function of shortage size, the lead time during backlogging for emergency replenishment is considered proportional to ( D Q ) + for the shortage amount Lodree, Jr. [57]. Therefore, the replenishment waiting time is presented as in Equation (2):
τ i = k i ( D Q ) + ,
where k i is constant and is linked to emergency replenishment option s i .
From Equations (1) and (2), the unsatisfied demand during backlogging is described as the function of shortage quantity, as presented in Equation (3).
β ( D Q ) + = e α k i ( D Q ) + .

4.2. Traditional Newsvendor Model

The retailer orders a lot of products, and he expects to sell enough of them to get a profit. Demand is uncertain. The assumption is made that the manufacturing cost M borne by the manufacturer is fixed, and that they determine the wholesale price W. The retailer has to decide the decision on ordered quantity Q, while selling the products on exogenously given price R. Those items remaining after the season are salvaged at a fixed salvage value h; the demand distribution is unknown. The concept of the traditional newsvendor model is shown in Figure 1.
The retailer profit is denoted by Π r ( Q ) and is shown in Equation (4):
Π r ( Q ) = R min ( D , Q ) + β ( D Q ) + R b i l ( 1 β ) ( D Q ) + + h ( Q D ) + W Q .
The manufacturer’s profit is represented as Π m ( Q ) , which does not depend on the price in the classical newsvendor model, as expressed in Equation (5).
Π m ( Q ) = ( W M ) Q .

4.3. Transfer of Risk

The transfer of risk model is developed in a decentralized supply chain environment where the Stackelberg gaming approach is utilized. In the transfer of risk model, the retailer and manufacturer are considered to be two different entities. The model is depicted in Figure 2.

4.3.1. Retailers Model

In the transfer of risk model, the retailer has the option to choose a contract that allows him to buy the product in the future date. He pays the price r for selecting one contract. The retailer has the right in this contract to purchase a single product at a certain fixed price, thought it is not obligatory. The contract is decided before the selling season starts. In the case when retailer choose Q contracts, then profit of the retailer is shown as “ Π r ( Q , r , t ) ” in Equation (6):
Π r ( Q , r , t ) = ( R t ) min [ D , Q ] r Q + β ( D Q ) + ( R b i ) l ( 1 β ) ( D Q ) + ,
and the expected value of the retailers profit is shown in Equation (7),
E [ Π ^ r ( Q , r , t ) ] = ( R t ) E [ min [ D , Q ] ] r Q + β E ( D Q ) + ( R b i ) l ( 1 β ) E ( D Q ) + ,
using the relation (Gallego and Moon [12])
min ( D , Q ) = D ( D Q ) + .
The retailer’s expected profit becomes, by Equation (8),
E [ Π ^ r ( Q , r , t ) ] = ( R t ) ( E ( D ) E ( D Q ) + ) r Q l E ( 1 β ) E ( D Q ) + + β E ( D Q ) + ( R b i ) .
By utilizing Equation (3) and inserting the value of β in Equation (8), we get the expected profit for the retailer in Equation (9):
E [ Π ^ r ( Q , r , t ) ] = ( R t ) ( μ a ) ( R t ) 2 σ 2 + ( Q μ a ) 2 ( Q μ a ) + e α k i 2 σ 2 + ( Q μ a ) 2 ( Q μ a ) R b i 2 σ 2 + ( Q μ a ) 2 ( Q μ a ) r Q l 2 σ 2 + ( Q μ a ) 2 ( Q μ a ) ( 1 e α k i 2 σ 2 + ( Q μ a ) 2 ( Q μ a ) ) .
The retailer transfers his risk to the manufacturer as a contract where the manufacturer pays salvage value. However, the optimization problem for the manufacturer becomes complex with this function Q ^ = Q ^ ( r , t ) . The manufacturer selects r , t to optimize the expected profit.

4.3.2. Manufacturer Model

The manufacturer’s profit ( Π ^ m ( Q , r , t ) ) is shown in Equation (10):
Π ^ m ( Q , r , t ) = t min [ D , Q ] + h ( Q D ) + + ( r M ) Q ,
using the relation (Gallego and Moon [12])
( Q D ) + = ( Q D ) + ( D Q ) + .
After inserting the Gallego and Moon [12] relation, the manufacturer’s profit can be written as shown in Equation (11):
Π ^ m ( Q , r , t ) = Q ( r M ) + h ( ( Q D ) + ( D Q ) + ) + t ( D ( D Q ) + ) .
The manufacturer’s expected profit is given in Equation (12):
E ( Π ^ m ( Q , r , t ) ) = Q ( r M ) + h E ( ( Q D ) + ( D Q ) + ) + t E ( D ( D Q ) + ) .
The price-dependent stochastic demand is shown below as
D = D ( P , X ) .
Further demand consists of two parts as
D = a ( P ) + X .
The expected value of stochastic demand is equal to the price-dependent deterministic demand and the expected value of random error, which is greater than zero (Ullah et al. [58]).
E ( D ) = a ( P ) + μ .
Riskless demand in season is the highest accumulated demand, that is, the product of market share and price sensitivity concerning cumulative deterministic demand, shown as
a ( P ) = y z P .
By using the inequality from Ullah et al. [58],
E ( D Q ) + 1 2 σ 2 + ( Q μ a ) 2 ( Q μ a ) .
The manufacturer’s expected profit is shown in Equation (13):
E ( Π ^ m ( Q , r , t ) ) = Q ( r M ) h E ( D Q ) + t E ( D Q ) + h E ( D ) + t E ( D ) + h Q .
Utilizing the above inequalities, the manufacturer’s profit becomes as in Equation (14):
E ( Π ^ m ( Q , r , t ) ) = h Q + t ( μ + a ) t 2 ( σ 2 + ( Q μ a ) 2 ( Q μ a ) ) h ( μ + a ) h 2 ( σ 2 + ( Q μ a ) 2 ( Q μ a ) ) + ( r M ) Q .

4.3.3. Centralized Supply Chain Model

Centralized supply chain profit ( Π ^ c h a i n ( Q , r , t ) ) relies solely on the ( r , t ) pair via Q as shown below in Equation (15). In the centralized supply chain, the manufacturer and retailer work as a single entity, therefore, the pair ( r , t ) is not used.
Π ^ c h a i n ( Q , r , t ) = ( t h ) min [ D , Q ] ( M h r ) Q + ( P t ) min [ D , Q ] r Q + β ( D Q ) + ( P b i ) l ( 1 β ) ( D Q ) + .
Equation (15) is further simplified as Equation (16):
Π ^ c h a i n ( Q , P ) = ( P h ) min [ D , Q ] ( M h ) Q + β ( D Q ) + ( P b i ) l ( 1 β ) ( D Q ) + .
The ( r , t ) choice leads the retailer in selecting the ordered quantity Q among several contracts. In a centralized supply chain, there is mutual coordination between all players. The contract is not required for optimizing profit in that case, as the wholesale price is equal to the manufacturing cost W = M . In this model, the manufacturer and retailer are considered independent entities for maximizing profit. For R , h , W , and M, the assumption is made so that R > W > M > h . In this model, the manufacturer proposes a contract for ( r , t ) price, and to maximize the expected profit, the retailer places an order of Q items.
For the retailer’s objective function optimization, the manufacturer selects ( r , t ) , and the job of the retailer is to calculate Q = Q ^ with price p so that expected profit is maximized. Expected value of supply chain profit with back-ordering is presented in Equation (17):
E ( Π ^ c h a i n ( Q , P ) ) = E ( D ( D Q ) + ) ( P h ) Q ( M h ) l ( 1 β ) ( D Q ) + ) + E ( β ( D Q ) + ( P b i ) .
By inserting the values as shown above in Equation (17), the expected value of supply chain profit will become as in Equation (18):
E ( Π ^ c h a i n ( Q , P ) ) = ( P h ) ( ( μ + a ) 1 2 σ 2 + ( Q μ a ) 2 ( Q μ a ) Q ( M h ) l ( 1 e α k i σ 2 + ( Q μ a ) 2 ( Q μ a ) 2 ) 1 2 σ 2 + ( Q μ a ) 2 ( Q μ a ) ( P b i ) 2 σ 2 + ( Q μ a ) 2 ( Q μ a ) e α k i ( σ 2 + ( Q μ a ) 2 ( Q μ a ) ) 2 .

4.4. Supply Chain Analysis

The supply chain model is analyzed as a centralized and decentralized entity. Furthermore, we apply the Stackelberg game approach in the decentralized supply chain, where the manufacturer and retailer are considered two different players. We have the supply chain total expected profit as Equation (19):
E ( Π ^ c h a i n ( Q , P ) ) = ( P h ) ( ( μ + a ) 1 2 σ 2 + ( Q μ a ) 2 ( Q μ a ) Q ( M h ) l ( 1 e α k i σ 2 + ( Q μ a ) 2 ( Q μ a ) 2 ) 1 2 σ 2 + ( Q μ a ) 2 ( Q μ a ) ( P b i ) 2 σ 2 + ( Q μ a ) 2 ( Q μ a ) e α k i ( σ 2 + ( Q μ a ) 2 ( Q μ a ) ) 2 .

4.5. Optimal Policies

To find the necessary condition partial differentiation of total supply chain profit for Q and P, calculations are performed as presented in Equations (20) and (21).
E ( Π ^ c h a i n ( Q , P ) ) Q = 1 2 ( P h ) 1 a μ + Q j + 1 2 ( P b i ) a μ + Q j 1 e 1 2 α k i ( g + μ Q ) 1 4 α k i ( P b i ) Q μ g 1 ( a + j + μ Q ) e 1 2 α k i ( g + μ Q ) 1 2 l a μ + Q j 1 1 e 1 2 α k i ( g + μ Q ) 1 4 α k i l Q μ g 1 ( a + j + μ Q ) e 1 2 α k i ( g + μ Q ) M + h
E ( Π ^ c h a i n ( Q , P ) ) P = 1 2 ( a + j + μ Q ) e 1 2 α k i ( g + μ Q ) + 1 2 ( a j μ + Q ) + a + μ ,
where the following notation is used to show the long equation in the simplified form:
j = ( a μ + Q ) 2 + σ 2 ,
g = ( Q μ ) 2 + σ 2 .

4.5.1. Decentralized Supply Chain (Stackelberg Approach)

Two cases are assumed for the Stackelberg game. In the first case, the manufacturer is a Stackelberg leader and the retailer is a follower. In the second case, the retailer acts as a leader and the manufacturer as a follower.

Case 1

In the first case, the manufacturer is a leader and the retailer is a follower. Accordingly, the retailer optimizes its decision variables first. The retailer calculates the ordered quantity and retail price. Subsequently, the manufacturer determines the wholesale price based on the retailer’s decision.
The retailer’s expected total cost is shown in Equation (22):
E [ Π ^ r ( Q , r , t ) ] = ( R t ) ( μ a ) ( R t ) 2 σ 2 + ( Q μ a ) 2 ( Q μ a ) + e α k i 2 σ 2 + ( Q μ a ) 2 ( Q μ a ) R b i 2 σ 2 + ( Q μ a ) 2 ( Q μ a ) r Q l 2 σ 2 + ( Q μ a ) 2 ( Q μ a ) ( 1 e α k i 2 σ 2 + ( Q μ a ) 2 ( Q μ a ) ) .
The manufacturer’s expected cost is shown in Equation (23):
E ( Π ^ m ( t ) ) = h Q + t ( μ + a ) t 2 ( σ 2 + ( Q μ a ) 2 ( Q μ a ) ) h ( μ + a ) h 2 ( σ 2 + ( Q μ a ) 2 ( Q μ a ) ) + ( r M ) Q .

Case 2

In the second case, the retailer is the leader and the manufacturer is the follower. Therefore, the manufacturer optimizes his ordered quantity and wholesale price. The retailer determines the retail price. The manufacturer’s expected cost is shown in Equation (24):
E ( Π ^ m ( Q , r , t ) ) = h Q + t ( μ + a ) t 2 ( σ 2 + ( Q μ a ) 2 ( Q μ a ) ) h ( μ + a ) h 2 ( σ 2 + ( Q μ a ) 2 ( Q μ a ) ) + ( r M ) Q .
The retailer’s expected profit function is shown in Equation (25):
E [ Π ^ r ( R ) ] = ( R t ) ( μ a ) ( R t ) 2 σ 2 + ( Q μ a ) 2 ( Q μ a ) + e α k i 2 σ 2 + ( Q μ a ) 2 ( Q μ a ) R b i 2 σ 2 + ( Q μ a ) 2 ( Q μ a ) r Q l 2 σ 2 + ( Q μ a ) 2 ( Q μ a ) ( 1 e α k i 2 σ 2 + ( Q μ a ) 2 ( Q μ a ) ) .

5. Numerical Experiment

The numerical example is presented in this section. Data for the given example are taken from (Brito and de Almeida [47], and Ullah et al. [58]). Here, M = 30 $/unit, s = 10 $/unit, μ = 11, σ = 7, y = 42 units/period, z = 0.8, r = 0.5 $/unit, l = 15 $/unit, α = 0.05, v = 50. The following values for k i and b i are used under the set of s i emergency replenishment schemes, as shown in Table 2.
The optimum values for the decision variables are presented in Table 3 for the centralized supply chain for the seven replenishment schemes. For the decentralized supply chain, two cases are considered and the numerical study results are depicted in Table 4. Furthermore, 2D and 3D plots are developed. In Figure 3, 3D plots are presented for manufacturer, retailer, and centralized supply chain. Three parameters for the 3D plots are profit, price, and ordered quantity. Figure 4 shows the 2D plot of centralized and decentralized supply chain. Six cases in total are shown for profit versus ordered quantity and profit versus price.

Sensitivity Analysis

The model is validated by performing sensitivity analysis. The results are presented in Table 5, Table 6 and Table 7 and Figure 5 and Figure 6.
  • Among all key parameters, manufacturing cost possesses a significant influence over the manufacturer and the centralized supply chain profitability. If the manufacturing cost is reduced by 50%, the increase in profit is 440%; respectively, if manufacturing cost is increased by 50%, profit is reduced by up to 260% for the manufacturer. In a centralized supply chain, the 50% cost reduction increases profit by 215%. If the same amount is increased, profit is reduced by up to 90%. Thus, a negligible reduction in the manufacturing cost has more impact over an increase. Therefore, a manager must concentrate on manufacturing cost reduction by all means to maximize system profit.
  • For a retailer, the most sensitive parameter is wholesale price. If the wholesale price is reduced by 50%, profit is increased by up to 820%. If the wholesale price is increased by 50%, profit is reduced up to 118%.
  • The unit contract price possesses a symmetrical effect over the profit of the manufacturer. There is almost a symmetrical effect for retailer profit when the contract price is varied in the range of 50%.
  • A 50% decrease in back-ordering cost for a centralized system increases profit by up to 107%. A 50% increase counts for a 49% reduction in the overall profit of the system. The results are alike for the decentralized system, if the retailer back-ordering cost is reduced by 50%, profit increases by 140%. If cost is increased by the same amount, the profit shrinks by 41%.
  • The salvage value is the least effective parameter among all other parameters for the manufacturer, a 50% cost reduction increases profit by 10%. A 50% increase counts for a 6% increase in profit.
The four demand parameters are as follows:
  • The expected value of random error for demand possesses a symmetrical impact on the centralized, manufacturer, and retailer profit percentages.
  • The retailer is the most sensitive among all, a 50% decrease accounts for 114% reduction, and a 50% increase accounts for a 170% rise in profit. For the manufacturer, a 50% decrease leads to a 102% reduction in the profit. A 50% increase raises profit by 126%. In the centralized case, profit is reduced by 64% with a reduction in the random error of demand and increases by 77% with the rise of random error in demand.
  • The standard deviation of demand has a perfectly symmetrical effect in all the cases when the variation is made between positive 50% and negative 50% on the profit of the centralized and decentralized system.
    The variation in market share is a very sensitive parameter. It is highly sensitive in the manufacturer case, where a 50% reduction accounts for a 261% reduction in the total profit, and a 50% increase enhances profit by 611%. For the retailer, a 50% decrease results in a 137% reduction in profit, and a 50% increase raises profit by 952%. Similarly, for the centralized system, a 50% decrease accumulates a 174% reduction in profit, and a 50% increase shows a 362% rise in profit.
  • The price sensitivity for cumulative deterministic demand is the most sensitive demand parameter. Retailer profit is greatly affected by this parameter a 50% reduction counts for an 1895% increase in profit. A 50% increase decreases profit by 165%, which means the reduction is highly sensitive to the negligible change. For a manufacturer, a 50% rise accumulates for an 895% increase in profit, and a 50% increase reduces profit by 218%. For the centralized system, a 50% decrease generates 565% more profit compared to a 50% increase, which reduces profit by 145%.

6. Managerial Insights

This paper studied the centralized and decentralized newsvendor model with transfer of risk and back-ordering. The following are managerial insights from the newsvendor model. The retailer can save an enormous amount of money otherwise wasted as salvaged by paying contract fees. The quantity can be back-ordered by the retailer, with a back-order price during the season, which reduces lost sales and keeps some customers. The manufacturer gets an additional amount as a contract fee by which he can bear the loss of salvaged products. By this policy, mutual trust is increased between both parties. The manufacturer can sell these products further in other markets as well or salvage these items. No specific demand distribution is considered in this model that saves funds otherwise used on demand data collection from the market. Demand depends on selling price, hikes in price will reduce the demand, ultimately resulting in profit reduction.

7. Conclusions

This paper studied the transfer of risk in a decentralized supply chain model. For the retailer and manufacturer, joint pricing and inventory decisions are made. A price-dependent stochastic demand is considered. The main objective of this model was profit maximization by calculating optimal price and ordered quantity. Demand does not follow any specific probability distribution, and no specific assumption was made for the distribution of random error in demand. Only mean and variance are available to solve the model. A numerical experiment was performed and results are shown for the centralized and decentralized cases. For the decentralized supply chain, there are two cases. In the first case, the manufacturer is considered the leader. In the second case, the retailer is considered the leader. Results of this model show that newsvendor profit is increased with the transfer-of-risk policy. The back-order satisfies additional customers and offers more flexibility to the retailer in selecting the ordered quantity. As a result of this policy, the retailer is more flexible in deciding the ordered quantity. If products remain, he can transfer them back to the manufacturer, and if shortages occur in the season, more products could be ordered with a back-ordered price. This model can be applied in many fields, especially for products like masks, sanitizers, mobile phones, etc. The manufacturer is powerful in many cases, as they can sell those remaining products after season in secondary markets with high demand. We considered a single retailer and a single product, which is not the case for most real-world models. The model is limited to only a single period which covers seasonal items. Leftover items from the retailers are salvaged at a constant value by the manufacturer. These items can be resold through a manufacturer’s discount policy. This paper has numerous research directions to explore. First, there are many types of uncertain demands that could be examined, such as the environmental-effort-dependent and inventory-stock-dependent demand. Second, this model could be extended to include multiple retailers, manufacturers, and products. Third, constraints could be added to this model, such as budget and storage space. Fourth, a possible extension is a multiperiod newsvendor model with a discounted policy for remaining products on the manufacturer’s side. The fifth promising extension could be a multiobjective optimization model, including fields such as environmental, social, and financial studies.

Author Contributions

Conceptualization, I.k.; methodology, B.S. and I.k.; software, I.k.; validation, B.S.; formal analysis, I.k. and B.S.; investigation, B.S. and I.k.; resources, I.k.; data curation, B.S. and I.k.; writing—original draft preparation, I.k. writing—review and editing, I.k.; visualization, I.k.; supervision, B.S. All authors have read and agreed to the published version of the manuscript.

Funding

This research received no external funding.

Institutional Review Board Statement

Not applicable.

Informed Consent Statement

Not applicable.

Data Availability Statement

Not applicable.

Conflicts of Interest

The authors declare no conflict of interest.

Notation

WWholesale price ($/unit)
DPrice dependent stochastic demand (units)
MFixed manufacturing cost ($/unit)
RRetail price ($/unit)
QOrder quantity (units)
PCentralized supply chain price ($/units)
hSalvage value ($/unit)
rPrice of one contract
tUnit price in transfer of risk model ($/unit)
βBack-order rate
yMaximum perceived cumulative deterministic demand or riskless demand—i.e., market share (units/unit time)
XRandom error in demand
biBack-order cost associated with the emergency replenishment option s i ($/unit)
a(t)Price-dependent deterministic demand during the season for decentralized supply chain (units)
a(P)Price-dependent deterministic demand during the season for centralized supply chain (units)
lA lost sale cost that can be estimated financially ($/unit)
ΠrExpected profit of retailer ($)
ΠmExpected profit of manufacturer ($)
ΠchainExpected profit of supply chain ($)
zCumulative deterministic demand price sensitivity

References

  1. Khouja, M. The single-period (news-vendor) problem: Literature review and suggestions for future research. Omega 1999, 27, 537–553. [Google Scholar] [CrossRef]
  2. Dai, J.; Meng, W. A risk-averse newsvendor model under marketing-dependency and price-dependency. Int. J. Prod. Econ. 2015, 160, 220–229. [Google Scholar] [CrossRef]
  3. Rosenfield, D.B. Optimal management of tax-sheltered employee reimbursement programs. Interfaces 1986, 16, 68–72. [Google Scholar] [CrossRef]
  4. Eeckhoudt, L.; Gollier, C.; Schlesinger, H. The risk-averse (and prudent) newsboy. Manag. Sci. 1995, 41, 786–794. [Google Scholar] [CrossRef]
  5. Edgeworth, F.Y. The mathematical theory of banking. J. R. Stat. Soc. 1888, 51, 113–127. [Google Scholar]
  6. Arrow, K.J.; Harris, T.; Marschak, J. Optimal inventory policy. Econom. J. Econom. Soc. 1951, 19, 250–272. [Google Scholar] [CrossRef]
  7. Petruzzi, N.C.; Dada, M. Pricing and the newsvendor problem: A review with extensions. Oper. Res. 1999, 47, 183–194. [Google Scholar] [CrossRef] [Green Version]
  8. Sarkar, B.; Zhang, C.; Majumder, A.; Sarkar, M.; Seo, Y.W. A distribution free newsvendor model with consignment policy and retailer’s royalty reduction. Int. J. Prod. Res. 2018, 56, 5025–5044. [Google Scholar] [CrossRef]
  9. He, H.; Wang, S. Cost-benefit associations in consumer inventory problem with uncertain benefit. J. Retail. Consum. Serv. 2019, 51, 271–284. [Google Scholar] [CrossRef]
  10. Sana, S.S. Price competition between green and non green products under corporate social responsible firm. J. Retail. Consum. Serv. 2020, 55, 102118. [Google Scholar] [CrossRef]
  11. Scarf, H. A min-max solution of an inventory problem. In Studies in the Mathematical Theory of Inventory and Production; Stanford University Press: Palo Alto, CA, USA, 1958. [Google Scholar]
  12. Gallego, G.; Moon, I. The distribution free newsboy problem: Review and extensions. J. Oper. Res. Soc. 1993, 44, 825–834. [Google Scholar] [CrossRef]
  13. Govindarajan, A.; Sinha, A.; Uichanco, J. Distribution-Free Inventory Risk Pooling in a Multilocation Newsvendor. Manag. Sci. 2020. [Google Scholar] [CrossRef]
  14. Moon, I.; Choi, S. The distribution free continuous review inventory system with a service level constraint. Comput. Ind. Eng. 1994, 27, 209–212. [Google Scholar] [CrossRef]
  15. Liao, Y.; Banerjee, A.; Yan, C. A distribution-free newsvendor model with balking and lost sales penalty. Int. J. Prod. Econ. 2011, 133, 224–227. [Google Scholar] [CrossRef]
  16. Raza, S.A. A distribution free approach to newsvendor problem with pricing. 4OR 2014, 12, 335–358. [Google Scholar] [CrossRef]
  17. Sarkar, B.; Chaudhuri, K.; Moon, I. Manufacturing setup cost reduction and quality improvement for the distribution free continuous-review inventory model with a service level constraint. J. Manuf. Syst. 2015, 34, 74–82. [Google Scholar] [CrossRef]
  18. Moon, I.; Yoo, D.K.; Saha, S. The distribution-free newsboy problem with multiple discounts and upgrades. Math. Probl. Eng. 2016, 2016, 2017253. [Google Scholar] [CrossRef] [Green Version]
  19. Castellano, D.; Gallo, M.; Santillo, L.C. A periodic review policy for a coordinated single vendor-multiple buyers supply chain with controllable lead time and distribution-free approach. 4OR 2020, 1–42. [Google Scholar] [CrossRef]
  20. Guchhait, R.; Pareek, S.; Sarkar, B. How Does a Radio Frequency Identification Optimize the Profit in an Unreliable Supply Chain Management? Mathematics 2019, 7, 490. [Google Scholar] [CrossRef] [Green Version]
  21. Xu, X.; Wang, H.; Dang, C.; Ji, P. The loss-averse newsvendor model with backordering. Int. J. Prod. Econ. 2017, 188, 1–10. [Google Scholar] [CrossRef]
  22. Khan, I.; Jemai, J.; Lim, H.; Sarkar, B. Effect of electrical energy on the manufacturing setup cost reduction, transportation discounts, and process quality improvement in a two-echelon supply chain management under a service-level constraint. Energies 2019, 12, 3733. [Google Scholar] [CrossRef] [Green Version]
  23. Sarkar, B.; Dey, B.K.; Pareek, S.; Sarkar, M. A single-stage cleaner production system with random defective rate and remanufacturing. Comput. Ind. Eng. 2020, 150, 106861. [Google Scholar] [CrossRef]
  24. Taleizadeh, A.A.; Shokr, I.; Konstantaras, I.; VafaeiNejad, M. Stock replenishment policies for a vendor-managed inventory in a retailing system. J. Retail. Consum. Serv. 2020, 55, 102137. [Google Scholar] [CrossRef]
  25. Kouvelis, P.; Zhao, W. The newsvendor problem and price-only contract when bankruptcy costs exist. Prod. Oper. Manag. 2011, 20, 921–936. [Google Scholar] [CrossRef]
  26. Ghosh, D.; Shah, J. A comparative analysis of greening policies across supply chain structures. Int. J. Prod. Econ. 2012, 135, 568–583. [Google Scholar] [CrossRef]
  27. Guchhait, R.; Pareek, S.; Sarkar, B. Application of distribution-free approach in integrated and dual-channel supply chain under buyback contract. In Handbook of Research on Promoting Business Process Improvement Through Inventory Control Techniques; IGI Global: Pennsylvania, PA, USA, 2018; pp. 388–426. [Google Scholar]
  28. Hovelaque, V.; Viviani, J.L.; Ait Mansour, M. Trade and bank credit in a non-cooperative chain with a price-sensitive demand. Int. J. Prod. Res. 2021, 1–16. [Google Scholar] [CrossRef]
  29. Wu, C.; Liu, X.; Li, A. A loss-averse retailer–supplier supply chain model under trade credit in a supplier-Stackelberg game. Math. Comput. Simul. 2021, 182, 353–365. [Google Scholar] [CrossRef]
  30. Yadav, R.; Pareek, S.; Mittal, M. Stackelberg models in two-level supply chain with imperfect quality items with allowable shortages. Sci. Iran. 2021. [Google Scholar] [CrossRef]
  31. Fan, Y.; Feng, Y.; Shou, Y. A risk-averse and buyer-led supply chain under option contract: CVaR minimization and channel coordination. Int. J. Prod. Econ. 2020, 219, 66–81. [Google Scholar] [CrossRef]
  32. Afshar-Nadjafi, B. The influence of sale announcement on the optimal policy of an inventory system with perishable items. J. Retail. Consum. Serv. 2016, 31, 239–245. [Google Scholar] [CrossRef]
  33. Olbrich, R.; Jansen, H.C.; Hundt, M. Effects of pricing strategies and product quality on private label and national brand performance. J. Retail. Consum. Serv. 2017, 34, 294–301. [Google Scholar] [CrossRef]
  34. He, R.; Lu, Y. A Robust Price-Setting Newsvendor Problem. Prod. Oper. Manag. 2021, 30, 276–292. [Google Scholar] [CrossRef]
  35. He, X.; Khouja, M. Pareto analysis of supply chain contracts under satisficing objectives. Eur. J. Oper. Res. 2011, 214, 53–66. [Google Scholar] [CrossRef]
  36. Kim, J.S.; Jeong, W.C. A model for buyer and supplier coordination and information sharing in order-up-to systems. J. Ind. Manag. Optim. 2012, 8, 987. [Google Scholar]
  37. Sarkar, B.; Dey, B.K.; Sarkar, M.; Hur, S.; Mandal, B.; Dhaka, V. Optimal replenishment decision for retailers with variable demand for deteriorating products under a trade-credit policy. RAIRO-Oper. Res. 2020, 54, 1685–1701. [Google Scholar] [CrossRef]
  38. Jörnsten, K.; Nonås, S.L.; Sandal, L.; Ubøe, J. Mixed contracts for the newsvendor problem with real options and discrete demand. Omega 2013, 41, 809–819. [Google Scholar] [CrossRef]
  39. Park, J.H.; Kim, J.S.; Shin, K.Y. Inventory control model for a supply chain system with multiple types of items and minimum order size requirements. Int. Trans. Oper. Res. 2018, 25, 1927–1946. [Google Scholar] [CrossRef]
  40. Sarkar, B.; Dey, B.K.; Sarkar, M.; AlArjani, A. A Sustainable Online-to-Offline (O2O) Retailing Strategy for a Supply Chain Management under Controllable Lead Time and Variable Demand. Sustainability 2021, 13, 1756. [Google Scholar] [CrossRef]
  41. Noh, J.S.; Kim, J.S.; Sarkar, B. Stochastic joint replenishment problem with quantity discounts and minimum order constraints. Oper. Res. 2019, 19, 151–178. [Google Scholar] [CrossRef]
  42. Maihami, R.; Ghelehkhondabi, I.; Ahmadi, E. Pricing and Inventory Planning for Non-Instantaneous Deteriorating Products with Greening Investment: A Case Study in Beef Industry. J. Clean. Prod. 2021, 295, 126368. [Google Scholar] [CrossRef]
  43. Lodree, E.J., Jr.; Kim, Y.; Jang, W. Time and quantity dependent waiting costs in a newsvendor problem with backlogged shortages. Math. Comput. Model. 2008, 47, 60–71. [Google Scholar] [CrossRef]
  44. Lee, H.; Lodree, E.J., Jr. Modeling customer impatience in a newsboy problem with time-sensitive shortages. Eur. J. Oper. Res. 2010, 205, 595–603. [Google Scholar] [CrossRef]
  45. Lee, C.M.; Hsu, S.L. The effect of advertising on the distribution-free newsboy problem. Int. J. Prod. Econ. 2011, 129, 217–224. [Google Scholar] [CrossRef]
  46. Jörnsten, K.; Nonås, S.L.; Sandal, L.; Ubøe, J. Transfer of risk in the newsvendor model with discrete demand. Omega 2012, 40, 404–414. [Google Scholar] [CrossRef] [Green Version]
  47. Brito, A.J.; de Almeida, A.T. Modeling a multi-attribute utility newsvendor with partial backlogging. Eur. J. Oper. Res. 2012, 220, 820–830. [Google Scholar] [CrossRef]
  48. Andersson, J.; Jörnsten, K.; Nonås, S.L.; Sandal, L.; Ubøe, J. A maximum entropy approach to the newsvendor problem with partial information. Eur. J. Oper. Res. 2013, 228, 190–200. [Google Scholar] [CrossRef] [Green Version]
  49. Pando, V.; San-José, L.A.; García-Laguna, J.; Sicilia, J. A newsboy problem with an emergency order under a general backorder rate function. Omega 2013, 41, 1020–1028. [Google Scholar] [CrossRef]
  50. Kwon, K.; Cheong, T. A minimax distribution-free procedure for a newsvendor problem with free shipping. Eur. J. Oper. Res. 2014, 232, 234–240. [Google Scholar] [CrossRef]
  51. Ahmed, M.T.; Kwon, C. Optimal contract-sizing in online display advertising for publishers with regret considerations. Omega 2014, 42, 201–212. [Google Scholar] [CrossRef]
  52. Pando, V.; San-José, L.; García-Laguna, J.; Sicilia, J. Some general properties for the newsboy problem with an extraordinary order. Top 2014, 22, 674–693. [Google Scholar] [CrossRef]
  53. Pal, B.; Sana, S.S.; Chaudhuri, K. A distribution-free newsvendor problem with nonlinear holding cost. Int. J. Syst. Sci. 2015, 46, 1269–1277. [Google Scholar] [CrossRef]
  54. Ma, L.; Xue, W.; Zhao, Y.; Zeng, Q. Loss-averse newsvendor problem with supply risk. J. Oper. Res. Soc. 2016, 67, 214–228. [Google Scholar] [CrossRef]
  55. Shi, J.; Du, Q.; Lin, F.; Li, Y.; Bai, L.; Fung, R.Y.; Lai, K.K. Coordinating the supply chain finance system with buyback contract: A capital-constrained newsvendor problem. Comput. Ind. Eng. 2020, 146, 106587. [Google Scholar] [CrossRef]
  56. Bi, C.; Zhang, B.; Yang, F.; Wang, Y.; Bi, G. Selling to the Newsvendor through Debt-Shared Bank Financing. Eur. J. Oper. Res. 2021. [Google Scholar] [CrossRef]
  57. Lodree, E.J., Jr. Advanced supply chain planning with mixtures of backorders, lost sales, and lost contract. Eur. J. Oper. Res. 2007, 181, 168–183. [Google Scholar] [CrossRef]
  58. Ullah, M.; Khan, I.; Sarkar, B. Dynamic Pricing in a Multi-Period Newsvendor Under Stochastic Price-Dependent Demand. Mathematics 2019, 7, 520. [Google Scholar] [CrossRef] [Green Version]
Figure 1. Traditional newsvendor model.
Mathematics 09 00638 g001
Figure 2. Transfer of risk in the supply chain. (Some parts of the image are taken from Khan et al. [22] Figure 1).
Mathematics 09 00638 g002
Figure 3. 3D figures showing the comparison of profit with ordered quantity and wholesale price.
Mathematics 09 00638 g003
Figure 4. Centralized (a,b), Retailer (c,d), and Manufacturer (e,f).
Mathematics 09 00638 g004
Figure 5. Graphical representation of sensitivity of demand parameters.
Mathematics 09 00638 g005
Figure 6. Graphical representation of sensitivity of key parameters.
Mathematics 09 00638 g006
Table 1. Literature related to this study.
Author(s)NewsvendorBack-OrderTransfer of RiskDistribution-Free ApproachStackelberg Game
Lodree, Jr. et al. [43]
Lee and Lodree, Jr. [44]
Lee and Hsu [45]
Jörnsten et al. [46]
Brito and de Almeida [47]
Andersson et al. [48]
Jörnsten et al. [38]
Pando et al. [49]
Kwon and Cheong [50]
Ahmed and Kwon [51]
Pando et al. [52]
Pal et al. [53]
Ma et al. [54]
Xu et al. [21]
Sarkar et al. [8]
Castellano et al. [19]
Shi et al. [55]
Govindarajan et al. [13]
Fan et al. [31]
Wu et al. [29]
Bi et al. [56]
This paper
Table 2. Available emergency replenishment schemes.
Option k i b i
s 1 0.9540
s 2 0.7043
s 3 0.6047
s 4 0.5051
s 5 0.4055
s 4 0.3060
s 5 0.2565
Table 3. Centralized supply chain optimum values for replenishment schemes.
OptionsQP Π chain
s 1 , Q * , P * 1447.73145.95
s 2 , Q * , P * 1447.85139.51
s 3 , Q * , P * 1547.90127.72
s 4 , Q * , P * 1547.97116.12
s 5 , Q * , P * 1648.01104.78
s 6 , Q * , P * 1648.0590.97
s 7 , Q * , P * 1748.0777.77
Table 4. Decentralized (Stackelberg) supply chain numerical result.
StackelbergLeaderFollowerPrice
$/Units
Quantity
Units
Π m
$
Π r
$
Total Profit
$
Case IManufacturerRetailer42.973424.6633.8958.55
Case IIRetailerManufacturer581880.6125.6106.21
Table 5. Demand parameter sensitivity analysis.
ParameterPercent ChangeCentralizedManufacturerRetailer
Percent Change in ProfitPercent Variation in ProfitPercent Variation in Profit
μ −50−64.09−102.50−114.68
−25−33.70−54.25−64.26
+25+36.98+60.25+78.51
+50+77.23+126.48+170.86
σ −50+44.74+116.92+41.35
−25+22.51+58.30+20.62
+25−22.77−57.98−20.66
+50−45.80−115.63−41.35
y−50−174.09−261.51−137.59
−25−93.74−174.81−170.69
+25+161.54+262.20+374.50
+50+372.32+611.36+952.82
z−50+564.25+894.45+1894.94
−25+177.37+277.07+514.75
+25−93.55−142.41−168.59
+50−145.09−218.11−164.13
Table 6. Centralized key parameter analysis.
Centralized
Percent Change in ValueParameterPercent Change in Profit
−50M+215.14
−25+89.93
+25−59.97
+50−89.21
−50b+107.50
−25+37.59
+25−26.90
+50−48.84
Table 7. Key parameter sensitivity analysis for manufacturer and retailer.
ManufacturerRetailer
Percent Change in ValueParameterPercent Change in ProfitParameterPercent Change in Profit
−50M+440.14W+817.63
−25+191.94+322.01
+25−149.43−147.13
+50−260.52−118.67
−50S+10.38b+140.15
−25+3.00+32.24
+25+1.17−22.56
+50+6.54−41.27
−50c−5.63c+29.18
−25−2.82+13.53
+25+2.83−12.17
+50+5.68−23.37
Publisher’s Note: MDPI stays neutral with regard to jurisdictional claims in published maps and institutional affiliations.

